Craig County, VA Map & Demographics
Craig County Map
Craig County Overview
$32,020
PER CAPITA INCOME
$88,125
AVG FAMILY INCOME
$66,286
AVG HOUSEHOLD INCOME
36.0%
WAGE / INCOME GAP [ % ]
64.0¢/ $1
WAGE / INCOME GAP [ $ ]
0.39
INEQUALITY / GINI INDEX
4,898
TOTAL POPULATION
2,446
MALE POPULATION
2,452
FEMALE POPULATION
99.76
MALES / 100 FEMALES
100.25
FEMALES / 100 MALES
46.1
MEDIAN AGE
2.9
AVG FAMILY SIZE
2.7
AVG HOUSEHOLD SIZE
2,055
LABOR FORCE [ PEOPLE ]
54.0%
PERCENT IN LABOR FORCE
1.9%
UNEMPLOYMENT RATE
Craig County Area Codes
Income in Craig County
Income Overview in Craig County
Per Capita Income in Craig County is $32,020, while median incomes of families and households are $88,125 and $66,286 respectively.
| Characteristic | Number | Measure |
| Per Capita Income | 4,898 | $32,020 |
| Median Family Income | 1,376 | $88,125 |
| Mean Family Income | 1,376 | $96,613 |
| Median Household Income | 1,810 | $66,286 |
| Mean Household Income | 1,810 | $83,740 |
| Income Deficit | 1,376 | $0 |
| Wage / Income Gap (%) | 4,898 | 36.01% |
| Wage / Income Gap ($) | 4,898 | 63.99¢ per $1 |
| Gini / Inequality Index | 4,898 | 0.39 |
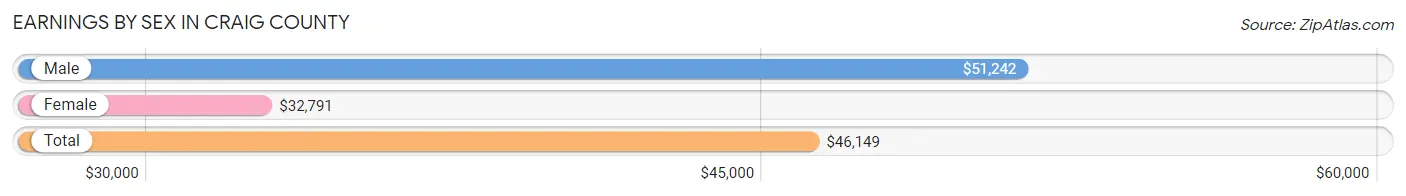
Earnings by Sex in Craig County
Average Earnings in Craig County are $46,149, $51,242 for men and $32,791 for women, a difference of 36.0%.
| Sex | Number | Average Earnings |
| Male | 1,065 (47.9%) | $51,242 |
| Female | 1,158 (52.1%) | $32,791 |
| Total | 2,223 (100.0%) | $46,149 |
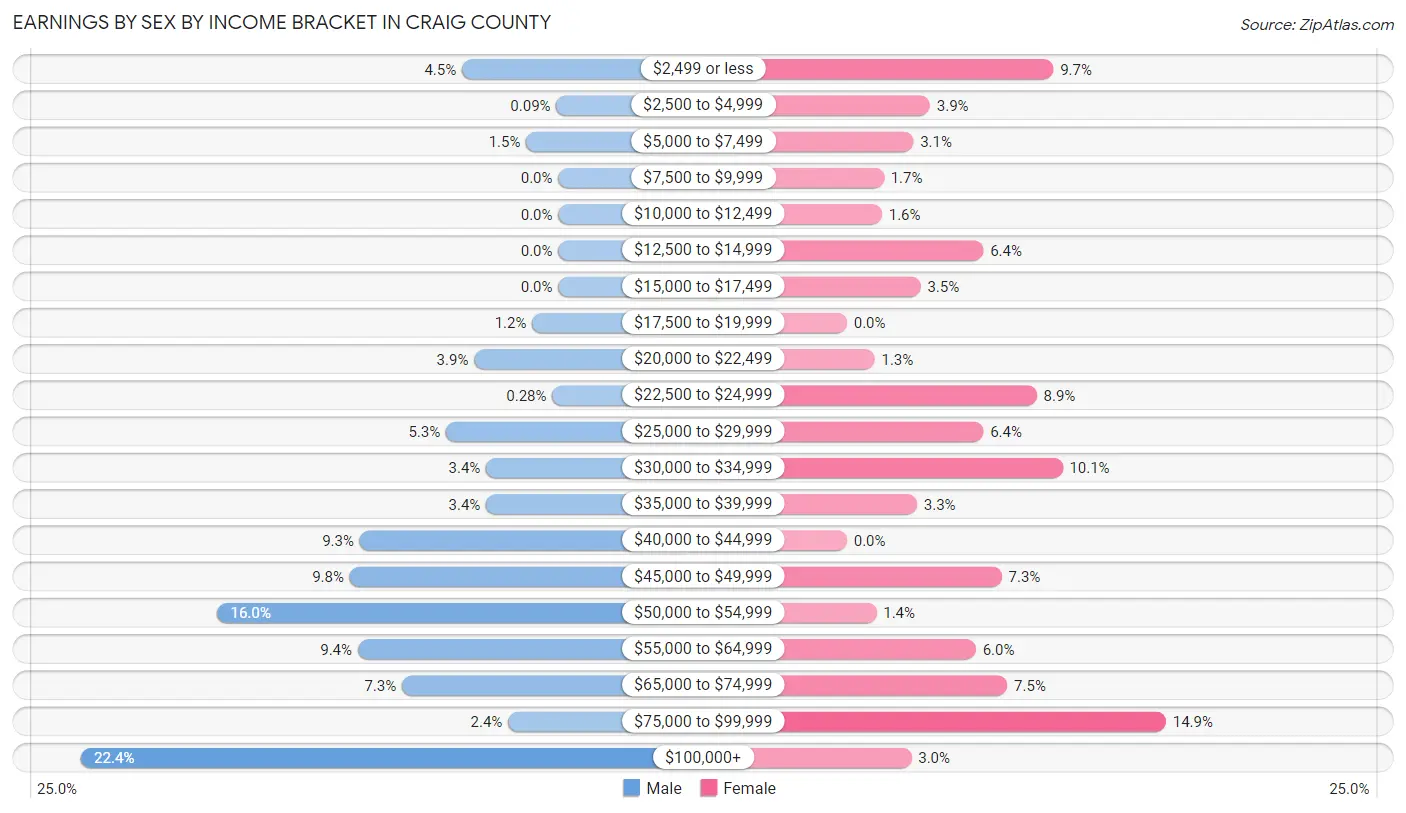
Earnings by Sex by Income Bracket in Craig County
The most common earnings brackets in Craig County are $100,000+ for men (238 | 22.4%) and $75,000 to $99,999 for women (173 | 14.9%).
| Income | Male | Female |
| $2,499 or less | 48 (4.5%) | 112 (9.7%) |
| $2,500 to $4,999 | 1 (0.1%) | 45 (3.9%) |
| $5,000 to $7,499 | 16 (1.5%) | 36 (3.1%) |
| $7,500 to $9,999 | 0 (0.0%) | 20 (1.7%) |
| $10,000 to $12,499 | 0 (0.0%) | 19 (1.6%) |
| $12,500 to $14,999 | 0 (0.0%) | 74 (6.4%) |
| $15,000 to $17,499 | 0 (0.0%) | 40 (3.5%) |
| $17,500 to $19,999 | 13 (1.2%) | 0 (0.0%) |
| $20,000 to $22,499 | 42 (3.9%) | 15 (1.3%) |
| $22,500 to $24,999 | 3 (0.3%) | 103 (8.9%) |
| $25,000 to $29,999 | 56 (5.3%) | 74 (6.4%) |
| $30,000 to $34,999 | 36 (3.4%) | 117 (10.1%) |
| $35,000 to $39,999 | 36 (3.4%) | 38 (3.3%) |
| $40,000 to $44,999 | 99 (9.3%) | 0 (0.0%) |
| $45,000 to $49,999 | 104 (9.8%) | 84 (7.2%) |
| $50,000 to $54,999 | 170 (16.0%) | 16 (1.4%) |
| $55,000 to $64,999 | 100 (9.4%) | 70 (6.0%) |
| $65,000 to $74,999 | 78 (7.3%) | 87 (7.5%) |
| $75,000 to $99,999 | 25 (2.4%) | 173 (14.9%) |
| $100,000+ | 238 (22.4%) | 35 (3.0%) |
| Total | 1,065 (100.0%) | 1,158 (100.0%) |
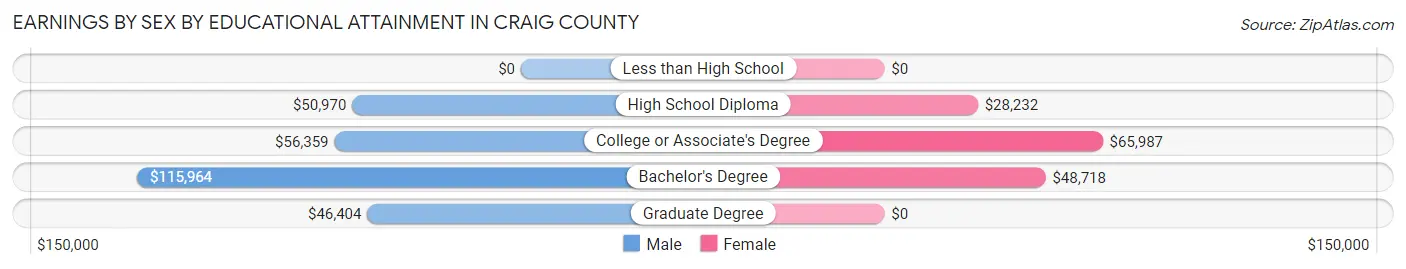
Earnings by Sex by Educational Attainment in Craig County
Average earnings in Craig County are $51,305 for men and $34,535 for women, a difference of 32.7%. Men with an educational attainment of bachelor's degree enjoy the highest average annual earnings of $115,964, while those with graduate degree education earn the least with $46,404. Women with an educational attainment of college or associate's degree earn the most with the average annual earnings of $65,987, while those with high school diploma education have the smallest earnings of $28,232.
| Educational Attainment | Male Income | Female Income |
| Less than High School | - | - |
| High School Diploma | $50,970 | $28,232 |
| College or Associate's Degree | $56,359 | $65,987 |
| Bachelor's Degree | $115,964 | $48,718 |
| Graduate Degree | $46,404 | $0 |
| Total | $51,305 | $34,535 |
Family Income in Craig County
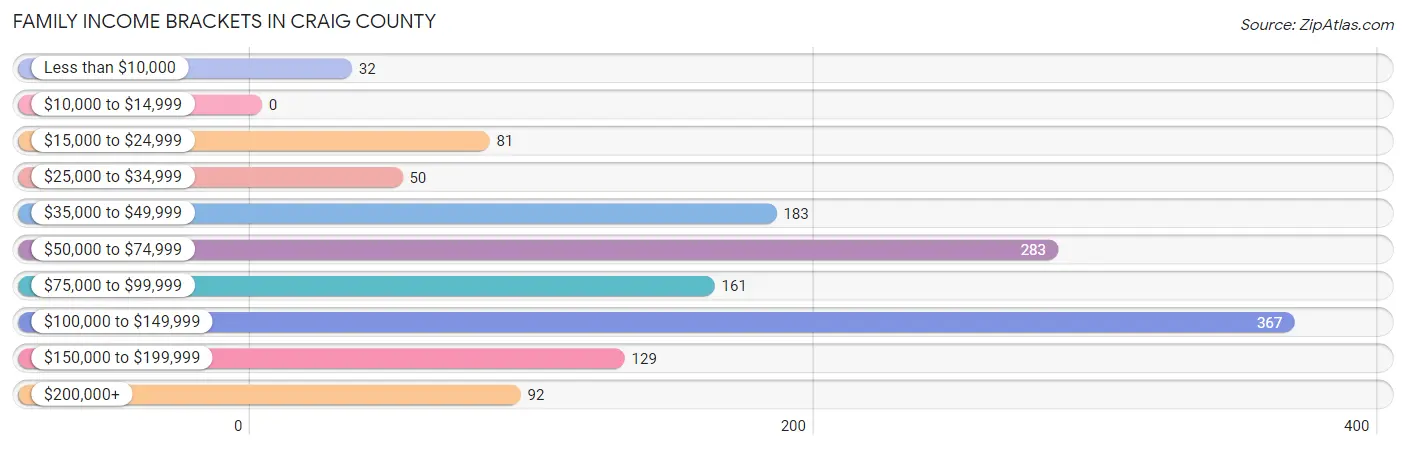
Family Income Brackets in Craig County
According to the Craig County family income data, there are 367 families falling into the $100,000 to $149,999 income range, which is the most common income bracket and makes up 26.7% of all families.
| Income Bracket | # Families | % Families |
| Less than $10,000 | 32 | 2.3% |
| $10,000 to $14,999 | 0 | 0.0% |
| $15,000 to $24,999 | 81 | 5.9% |
| $25,000 to $34,999 | 50 | 3.6% |
| $35,000 to $49,999 | 183 | 13.3% |
| $50,000 to $74,999 | 283 | 20.6% |
| $75,000 to $99,999 | 161 | 11.7% |
| $100,000 to $149,999 | 367 | 26.7% |
| $150,000 to $199,999 | 129 | 9.4% |
| $200,000+ | 92 | 6.7% |
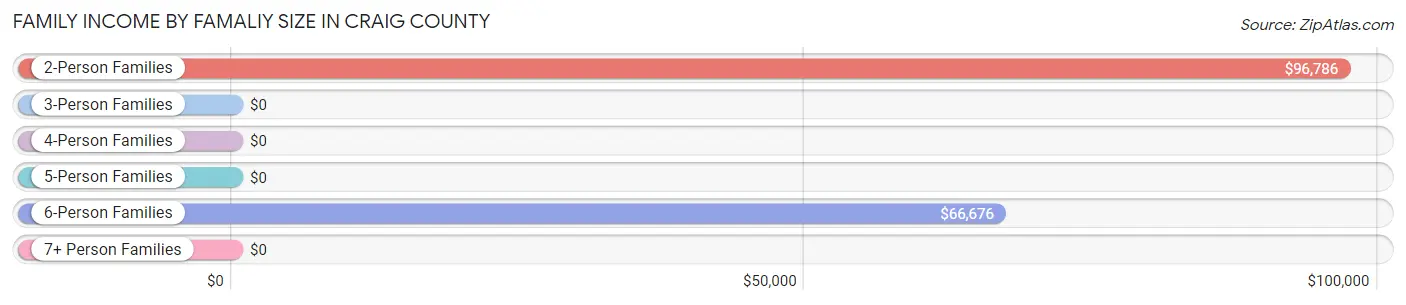
Family Income by Famaliy Size in Craig County
2-person families (802 | 58.3%) account for the highest median family income in Craig County with $96,786 per family, while 2-person families (802 | 58.3%) have the highest median income of $48,393 per family member.
| Income Bracket | # Families | Median Income |
| 2-Person Families | 802 (58.3%) | $96,786 |
| 3-Person Families | 216 (15.7%) | $0 |
| 4-Person Families | 171 (12.4%) | $0 |
| 5-Person Families | 61 (4.4%) | $0 |
| 6-Person Families | 126 (9.2%) | $66,676 |
| 7+ Person Families | 0 (0.0%) | $0 |
| Total | 1,376 (100.0%) | $88,125 |
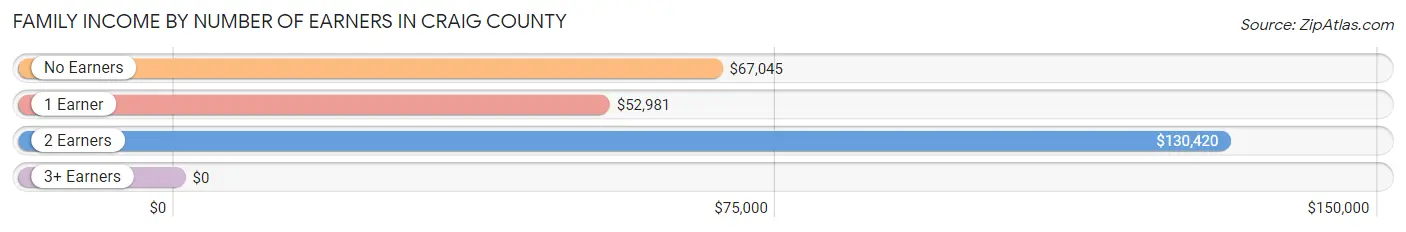
Family Income by Number of Earners in Craig County
| Number of Earners | # Families | Median Income |
| No Earners | 254 (18.5%) | $67,045 |
| 1 Earner | 407 (29.6%) | $52,981 |
| 2 Earners | 693 (50.4%) | $130,420 |
| 3+ Earners | 22 (1.6%) | $0 |
| Total | 1,376 (100.0%) | $88,125 |
Household Income in Craig County
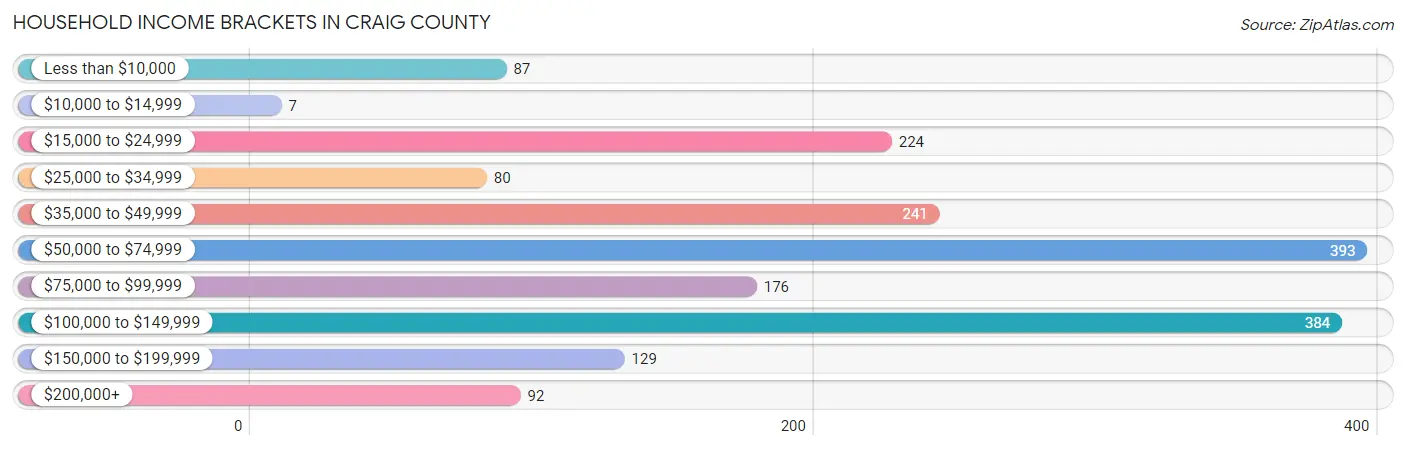
Household Income Brackets in Craig County
With 393 households falling in the category, the $50,000 to $74,999 income range is the most frequent in Craig County, accounting for 21.7% of all households. In contrast, only 7 households (0.4%) fall into the $10,000 to $14,999 income bracket, making it the least populous group.
| Income Bracket | # Households | % Households |
| Less than $10,000 | 87 | 4.8% |
| $10,000 to $14,999 | 7 | 0.4% |
| $15,000 to $24,999 | 224 | 12.4% |
| $25,000 to $34,999 | 80 | 4.4% |
| $35,000 to $49,999 | 241 | 13.3% |
| $50,000 to $74,999 | 393 | 21.7% |
| $75,000 to $99,999 | 176 | 9.7% |
| $100,000 to $149,999 | 384 | 21.2% |
| $150,000 to $199,999 | 129 | 7.1% |
| $200,000+ | 92 | 5.1% |
Household Income by Householder Age in Craig County
The median household income in Craig County is $66,286, with the highest median household income of $88,359 found in the 45 to 64 years age bracket for the primary householder. A total of 863 households (47.7%) fall into this category. Meanwhile, the 15 to 24 years age bracket for the primary householder has the lowest median household income of $23,750, with 27 households (1.5%) in this group.
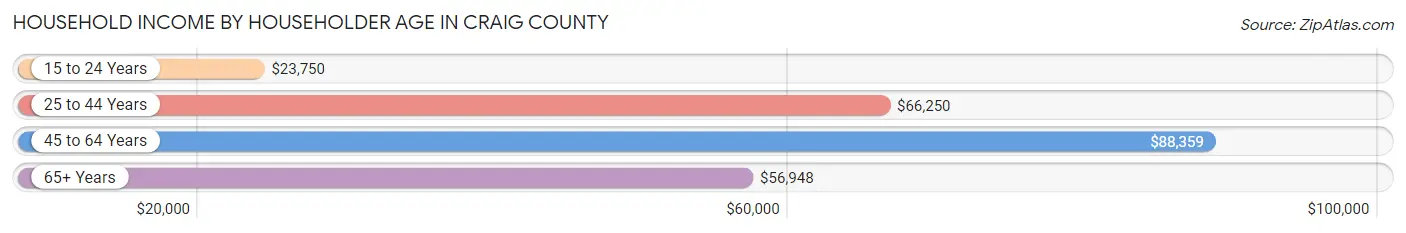
| Income Bracket | # Households | Median Income |
| 15 to 24 Years | 27 (1.5%) | $23,750 |
| 25 to 44 Years | 369 (20.4%) | $66,250 |
| 45 to 64 Years | 863 (47.7%) | $88,359 |
| 65+ Years | 551 (30.4%) | $56,948 |
| Total | 1,810 (100.0%) | $66,286 |
Poverty in Craig County
Income Below Poverty by Sex and Age in Craig County
With 10.1% poverty level for males and 11.8% for females among the residents of Craig County, 5 year old males and 12 to 14 year old females are the most vulnerable to poverty, with 2 males (100.0%) and 21 females (95.5%) in their respective age groups living below the poverty level.
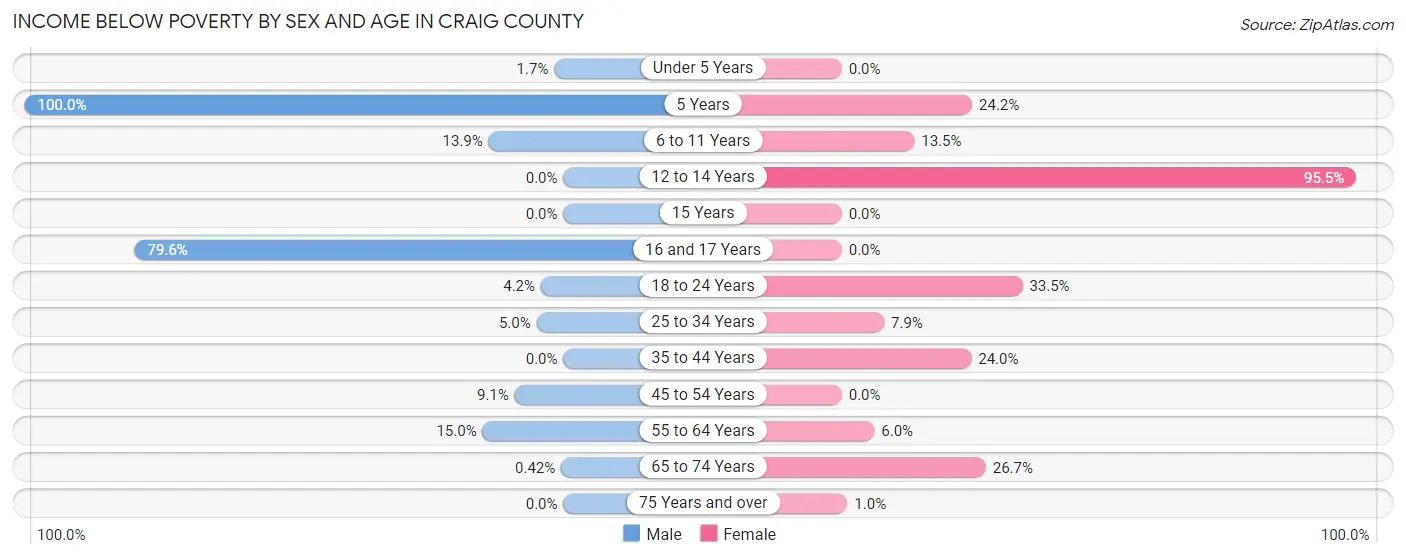
| Age Bracket | Male | Female |
| Under 5 Years | 3 (1.7%) | 0 (0.0%) |
| 5 Years | 2 (100.0%) | 15 (24.2%) |
| 6 to 11 Years | 33 (13.9%) | 23 (13.5%) |
| 12 to 14 Years | 0 (0.0%) | 21 (95.5%) |
| 15 Years | 0 (0.0%) | 0 (0.0%) |
| 16 and 17 Years | 82 (79.6%) | 0 (0.0%) |
| 18 to 24 Years | 1 (4.2%) | 56 (33.5%) |
| 25 to 34 Years | 12 (5.0%) | 27 (7.9%) |
| 35 to 44 Years | 0 (0.0%) | 50 (24.0%) |
| 45 to 54 Years | 37 (9.0%) | 0 (0.0%) |
| 55 to 64 Years | 68 (15.0%) | 27 (6.0%) |
| 65 to 74 Years | 1 (0.4%) | 58 (26.7%) |
| 75 Years and over | 0 (0.0%) | 2 (1.0%) |
| Total | 239 (10.1%) | 279 (11.8%) |
Income Above Poverty by Sex and Age in Craig County
According to the poverty statistics in Craig County, males aged 12 to 14 years and females aged under 5 years are the age groups that are most secure financially, with 100.0% of males and 100.0% of females in these age groups living above the poverty line.
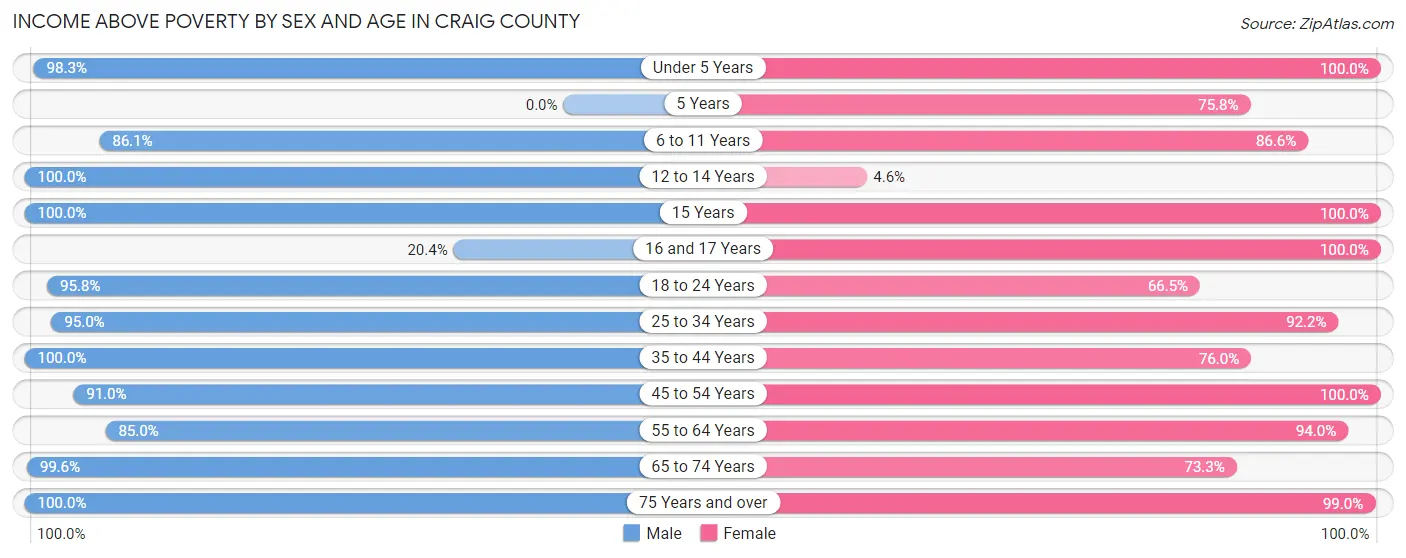
| Age Bracket | Male | Female |
| Under 5 Years | 174 (98.3%) | 198 (100.0%) |
| 5 Years | 0 (0.0%) | 47 (75.8%) |
| 6 to 11 Years | 205 (86.1%) | 148 (86.6%) |
| 12 to 14 Years | 24 (100.0%) | 1 (4.5%) |
| 15 Years | 25 (100.0%) | 19 (100.0%) |
| 16 and 17 Years | 21 (20.4%) | 32 (100.0%) |
| 18 to 24 Years | 23 (95.8%) | 111 (66.5%) |
| 25 to 34 Years | 229 (95.0%) | 317 (92.1%) |
| 35 to 44 Years | 142 (100.0%) | 158 (76.0%) |
| 45 to 54 Years | 372 (90.9%) | 291 (100.0%) |
| 55 to 64 Years | 385 (85.0%) | 420 (94.0%) |
| 65 to 74 Years | 236 (99.6%) | 159 (73.3%) |
| 75 Years and over | 295 (100.0%) | 190 (99.0%) |
| Total | 2,131 (89.9%) | 2,091 (88.2%) |
Income Below Poverty Among Married-Couple Families in Craig County
The poverty statistics for married-couple families in Craig County show that 4.0% or 48 of the total 1,194 families live below the poverty line. Families with 3 or 4 children have the highest poverty rate of 15.9%, comprising of 26 families. On the other hand, families with 1 or 2 children have the lowest poverty rate of 0.0%, which includes 0 families.
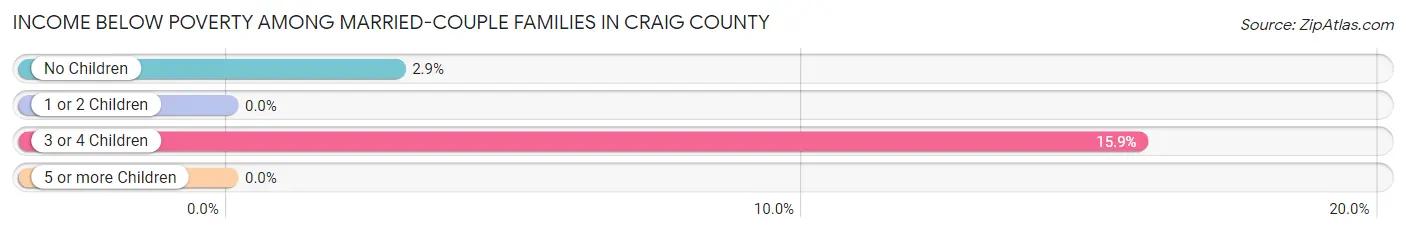
| Children | Above Poverty | Below Poverty |
| No Children | 735 (97.1%) | 22 (2.9%) |
| 1 or 2 Children | 273 (100.0%) | 0 (0.0%) |
| 3 or 4 Children | 138 (84.2%) | 26 (15.9%) |
| 5 or more Children | 0 (0.0%) | 0 (0.0%) |
| Total | 1,146 (96.0%) | 48 (4.0%) |
Income Below Poverty Among Single-Parent Households in Craig County
According to the poverty data in Craig County, 3.8% or 1 single-father households and 19.2% or 30 single-mother households are living below the poverty line. Among single-father households, those with 1 or 2 children have the highest poverty rate, with 1 households (16.7%) experiencing poverty. Likewise, among single-mother households, those with 1 or 2 children have the highest poverty rate, with 30 households (31.2%) falling below the poverty line.
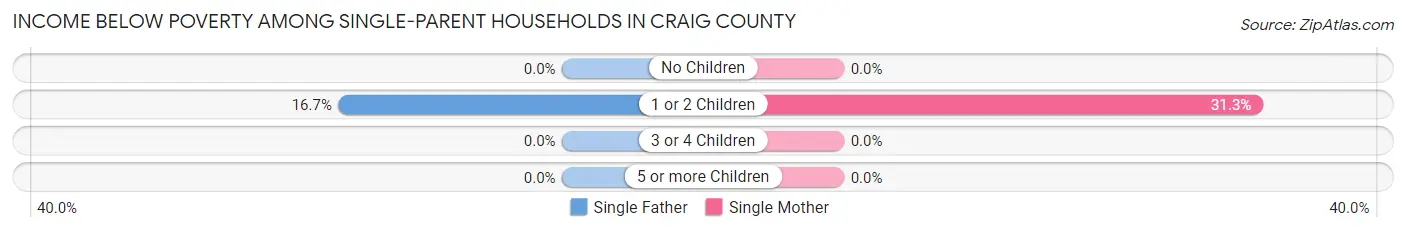
| Children | Single Father | Single Mother |
| No Children | 0 (0.0%) | 0 (0.0%) |
| 1 or 2 Children | 1 (16.7%) | 30 (31.2%) |
| 3 or 4 Children | 0 (0.0%) | 0 (0.0%) |
| 5 or more Children | 0 (0.0%) | 0 (0.0%) |
| Total | 1 (3.8%) | 30 (19.2%) |
Income Below Poverty Among Married-Couple vs Single-Parent Households in Craig County
The poverty data for Craig County shows that 48 of the married-couple family households (4.0%) and 31 of the single-parent households (17.0%) are living below the poverty level. Within the married-couple family households, those with 3 or 4 children have the highest poverty rate, with 26 households (15.9%) falling below the poverty line. Among the single-parent households, those with 1 or 2 children have the highest poverty rate, with 31 household (30.4%) living below poverty.
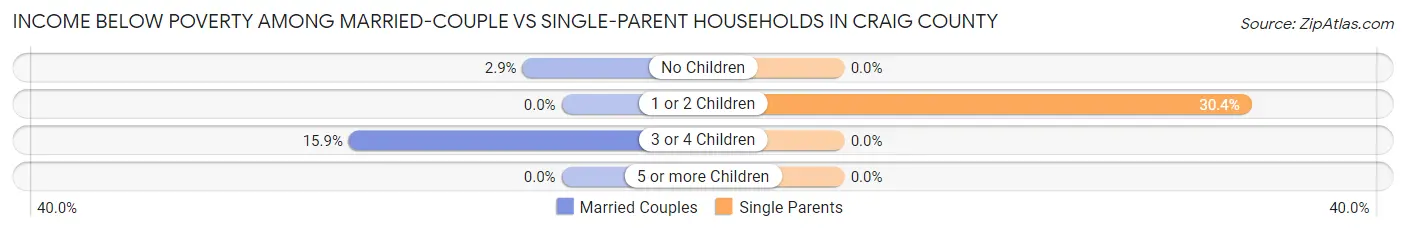
| Children | Married-Couple Families | Single-Parent Households |
| No Children | 22 (2.9%) | 0 (0.0%) |
| 1 or 2 Children | 0 (0.0%) | 31 (30.4%) |
| 3 or 4 Children | 26 (15.9%) | 0 (0.0%) |
| 5 or more Children | 0 (0.0%) | 0 (0.0%) |
| Total | 48 (4.0%) | 31 (17.0%) |
Race in Craig County
The most populous races in Craig County are White / Caucasian (4,638 | 94.7%), Two or more Races (185 | 3.8%), and Some other Race (72 | 1.5%).
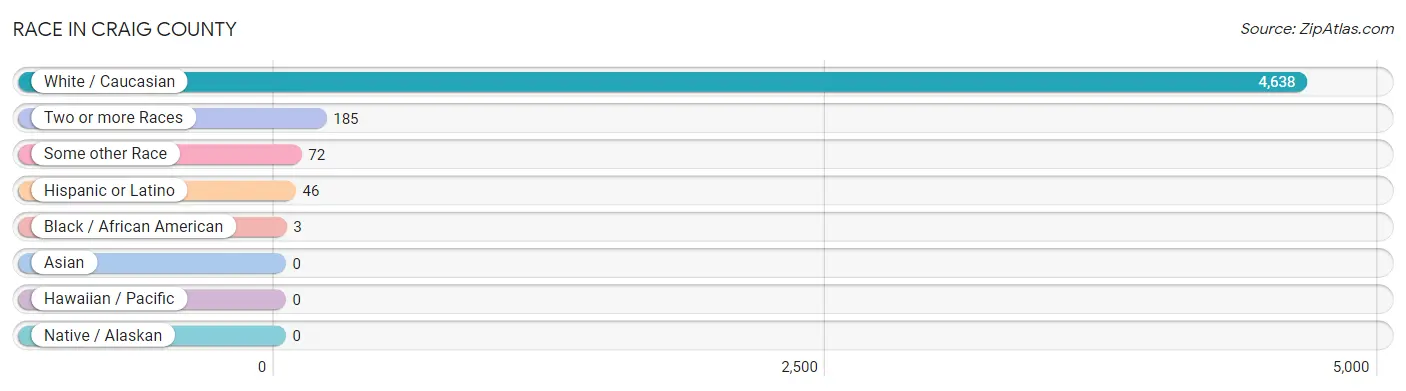
| Race | # Population | % Population |
| Asian | 0 | 0.0% |
| Black / African American | 3 | 0.1% |
| Hawaiian / Pacific | 0 | 0.0% |
| Hispanic or Latino | 46 | 0.9% |
| Native / Alaskan | 0 | 0.0% |
| White / Caucasian | 4,638 | 94.7% |
| Two or more Races | 185 | 3.8% |
| Some other Race | 72 | 1.5% |
| Total | 4,898 | 100.0% |
Ancestry in Craig County
The most populous ancestries reported in Craig County are German (660 | 13.5%), English (611 | 12.5%), American (394 | 8.0%), Irish (364 | 7.4%), and Scotch-Irish (145 | 3.0%), together accounting for 44.4% of all Craig County residents.
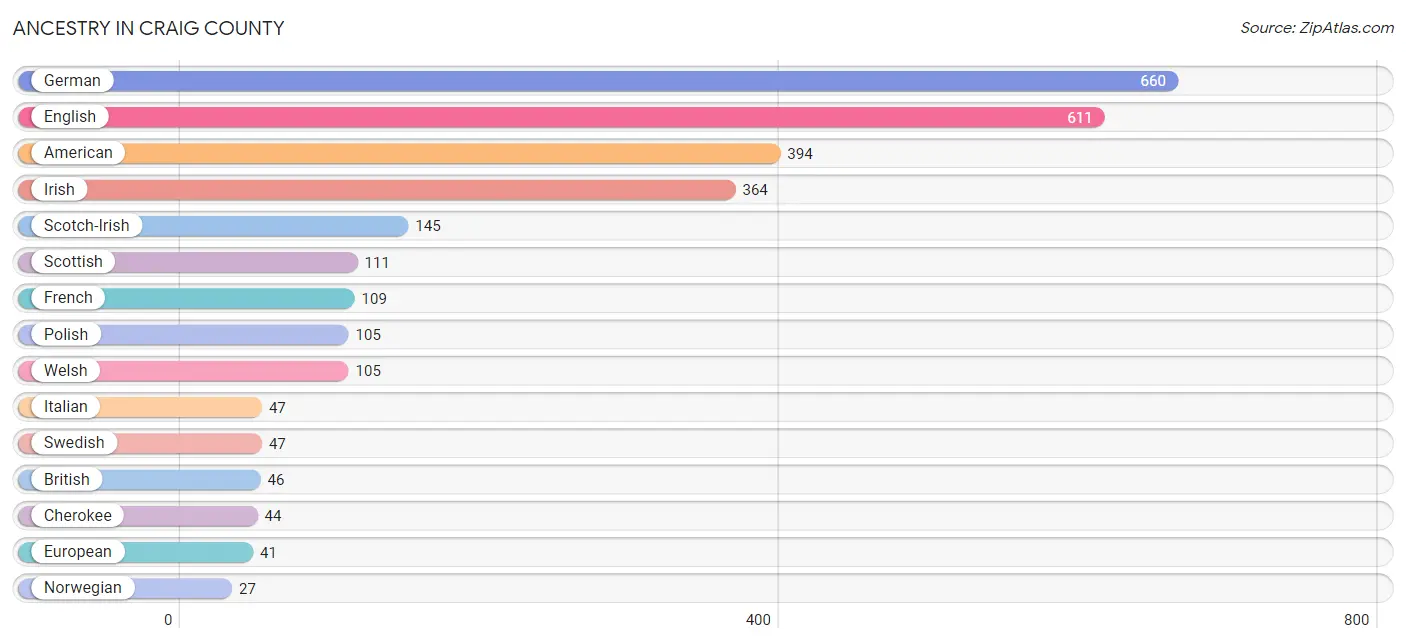
| Ancestry | # Population | % Population |
| American | 394 | 8.0% |
| British | 46 | 0.9% |
| Central American | 6 | 0.1% |
| Cherokee | 44 | 0.9% |
| Dominican | 1 | 0.0% |
| Dutch | 24 | 0.5% |
| English | 611 | 12.5% |
| European | 41 | 0.8% |
| French | 109 | 2.2% |
| French Canadian | 5 | 0.1% |
| German | 660 | 13.5% |
| Irish | 364 | 7.4% |
| Italian | 47 | 1.0% |
| Norwegian | 27 | 0.5% |
| Peruvian | 7 | 0.1% |
| Polish | 105 | 2.1% |
| Salvadoran | 6 | 0.1% |
| Scotch-Irish | 145 | 3.0% |
| Scottish | 111 | 2.3% |
| South American | 7 | 0.1% |
| Swedish | 47 | 1.0% |
| Swiss | 18 | 0.4% |
| Welsh | 105 | 2.1% | View All 23 Rows |
Immigrants in Craig County
The most numerous immigrant groups reported in Craig County came from Europe (17 | 0.4%), Germany (17 | 0.4%), Western Europe (17 | 0.4%), Latin America (13 | 0.3%), and Peru (7 | 0.1%), together accounting for 1.5% of all Craig County residents.
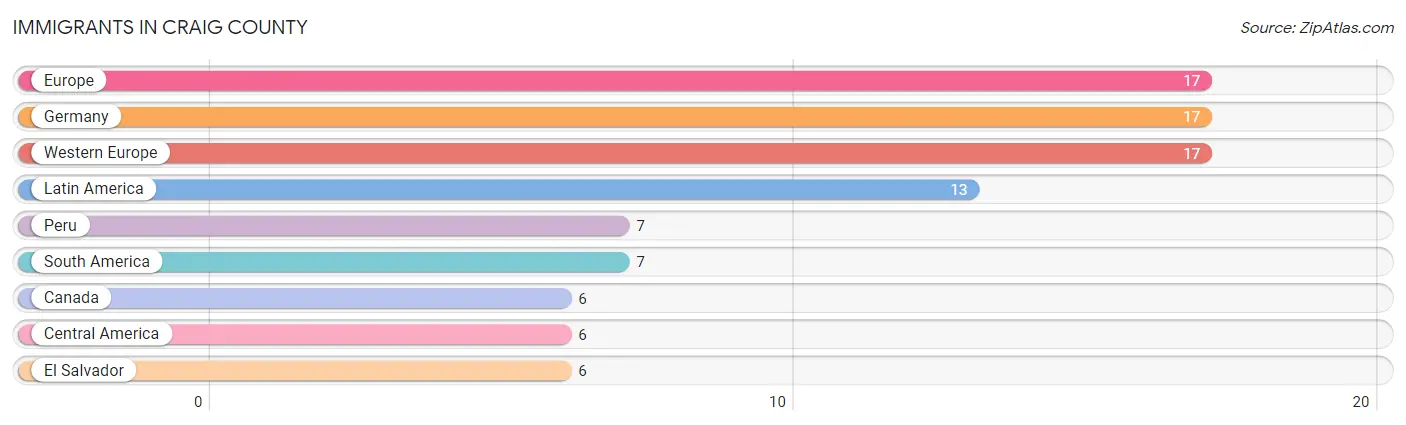
| Immigration Origin | # Population | % Population |
| Canada | 6 | 0.1% |
| Central America | 6 | 0.1% |
| El Salvador | 6 | 0.1% |
| Europe | 17 | 0.4% |
| Germany | 17 | 0.4% |
| Latin America | 13 | 0.3% |
| Peru | 7 | 0.1% |
| South America | 7 | 0.1% |
| Western Europe | 17 | 0.4% | View All 9 Rows |
Sex and Age in Craig County
Sex and Age in Craig County
The most populous age groups in Craig County are 55 to 59 Years (312 | 12.8%) for men and 60 to 64 Years (284 | 11.6%) for women.
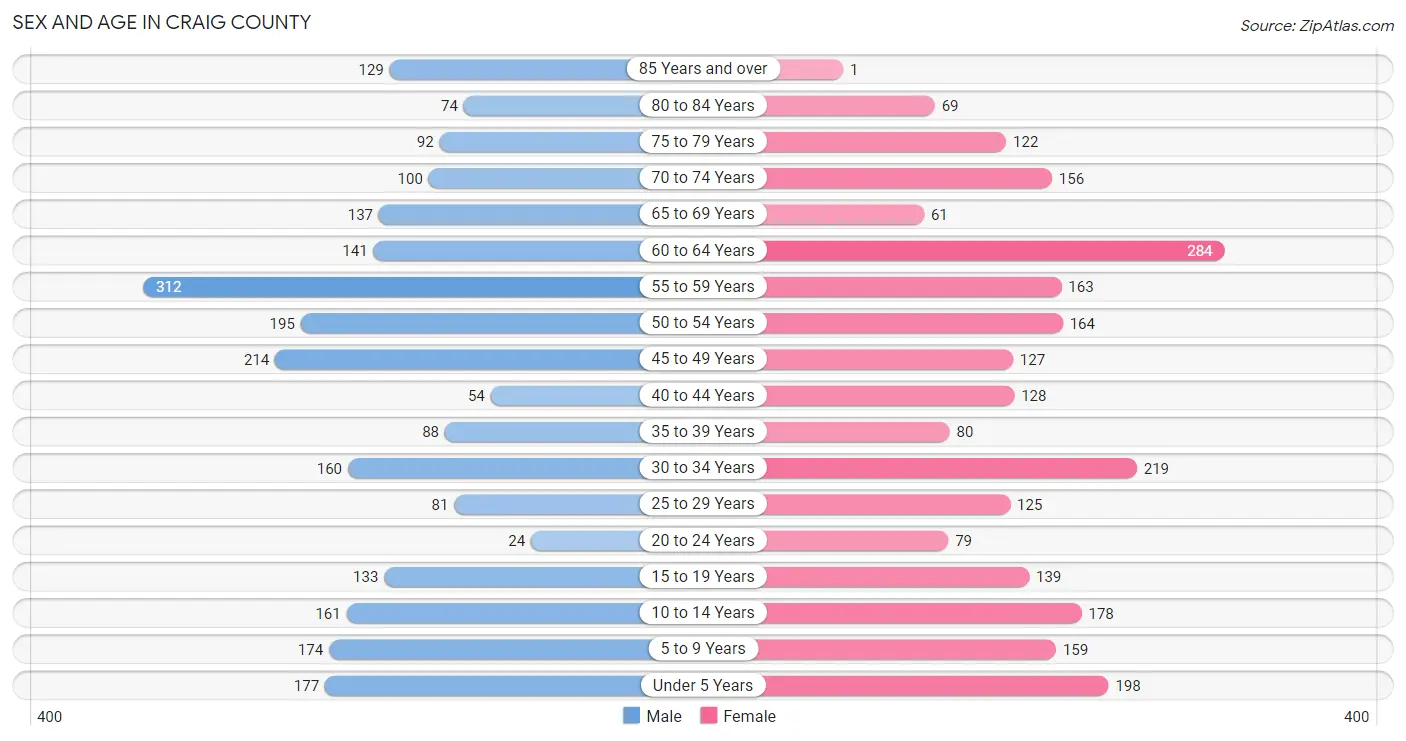
| Age Bracket | Male | Female |
| Under 5 Years | 177 (7.2%) | 198 (8.1%) |
| 5 to 9 Years | 174 (7.1%) | 159 (6.5%) |
| 10 to 14 Years | 161 (6.6%) | 178 (7.3%) |
| 15 to 19 Years | 133 (5.4%) | 139 (5.7%) |
| 20 to 24 Years | 24 (1.0%) | 79 (3.2%) |
| 25 to 29 Years | 81 (3.3%) | 125 (5.1%) |
| 30 to 34 Years | 160 (6.5%) | 219 (8.9%) |
| 35 to 39 Years | 88 (3.6%) | 80 (3.3%) |
| 40 to 44 Years | 54 (2.2%) | 128 (5.2%) |
| 45 to 49 Years | 214 (8.7%) | 127 (5.2%) |
| 50 to 54 Years | 195 (8.0%) | 164 (6.7%) |
| 55 to 59 Years | 312 (12.8%) | 163 (6.7%) |
| 60 to 64 Years | 141 (5.8%) | 284 (11.6%) |
| 65 to 69 Years | 137 (5.6%) | 61 (2.5%) |
| 70 to 74 Years | 100 (4.1%) | 156 (6.4%) |
| 75 to 79 Years | 92 (3.8%) | 122 (5.0%) |
| 80 to 84 Years | 74 (3.0%) | 69 (2.8%) |
| 85 Years and over | 129 (5.3%) | 1 (0.0%) |
| Total | 2,446 (100.0%) | 2,452 (100.0%) |
Families and Households in Craig County
Median Family Size in Craig County
The median family size in Craig County is 2.94 persons per family, with single male/father families (26 | 1.9%) accounting for the largest median family size of 3.19 persons per family. On the other hand, single female/mother families (156 | 11.3%) represent the smallest median family size with 2.83 persons per family.
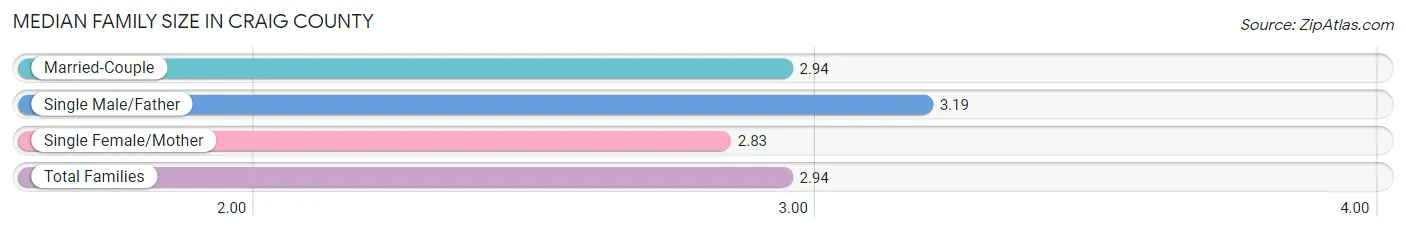
| Family Type | # Families | Family Size |
| Married-Couple | 1,194 (86.8%) | 2.94 |
| Single Male/Father | 26 (1.9%) | 3.19 |
| Single Female/Mother | 156 (11.3%) | 2.83 |
| Total Families | 1,376 (100.0%) | 2.94 |
Median Household Size in Craig County
The median household size in Craig County is 2.70 persons per household, with single male/father households (26 | 1.4%) accounting for the largest median household size of 4.73 persons per household. non-family households (434 | 24.0%) represent the smallest median household size with 1.18 persons per household.
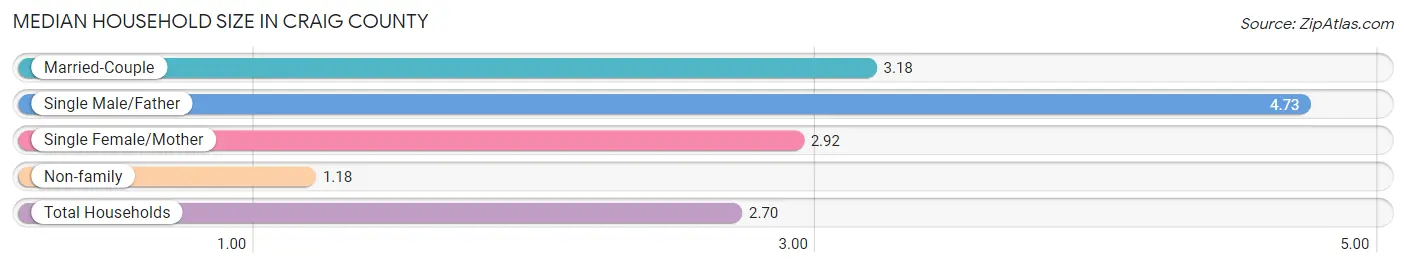
| Household Type | # Households | Household Size |
| Married-Couple | 1,194 (66.0%) | 3.18 |
| Single Male/Father | 26 (1.4%) | 4.73 |
| Single Female/Mother | 156 (8.6%) | 2.92 |
| Non-family | 434 (24.0%) | 1.18 |
| Total Households | 1,810 (100.0%) | 2.70 |
Household Size by Marriage Status in Craig County
Out of a total of 1,810 households in Craig County, 1,376 (76.0%) are family households, while 434 (24.0%) are nonfamily households. The most numerous type of family households are 2-person households, comprising 778, and the most common type of nonfamily households are 1-person households, comprising 393.
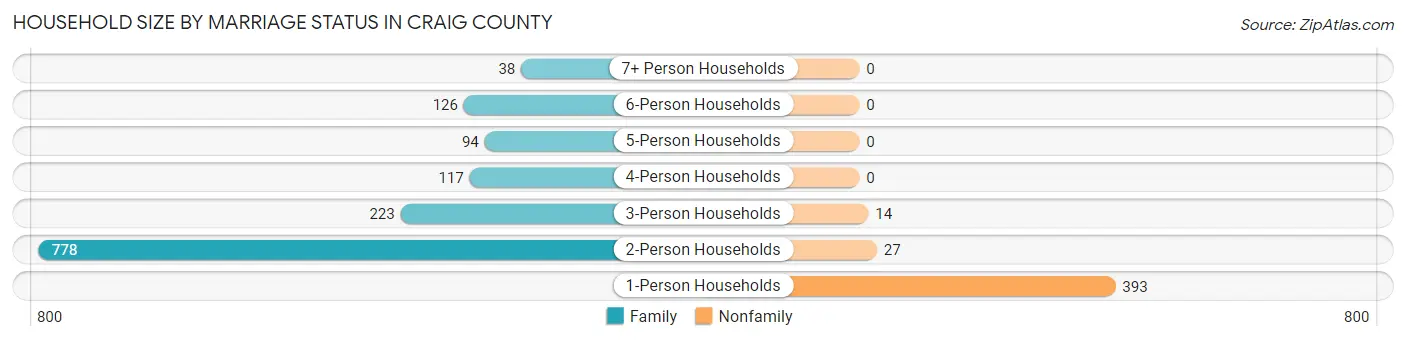
| Household Size | Family Households | Nonfamily Households |
| 1-Person Households | - | 393 (21.7%) |
| 2-Person Households | 778 (43.0%) | 27 (1.5%) |
| 3-Person Households | 223 (12.3%) | 14 (0.8%) |
| 4-Person Households | 117 (6.5%) | 0 (0.0%) |
| 5-Person Households | 94 (5.2%) | 0 (0.0%) |
| 6-Person Households | 126 (7.0%) | 0 (0.0%) |
| 7+ Person Households | 38 (2.1%) | 0 (0.0%) |
| Total | 1,376 (76.0%) | 434 (24.0%) |
Female Fertility in Craig County
Fertility by Age in Craig County
Average fertility rate in Craig County is 49.0 births per 1,000 women. Women in the age bracket of 20 to 34 years have the highest fertility rate with 106.0 births per 1,000 women. Women in the age bracket of 20 to 34 years acount for 100.0% of all women with births.
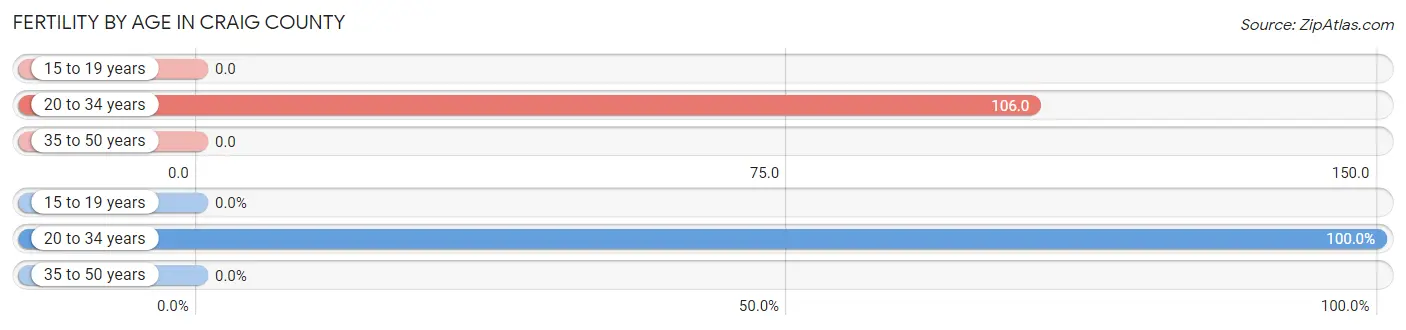
| Age Bracket | Women with Births | Births / 1,000 Women |
| 15 to 19 years | 0 (0.0%) | 0.0 |
| 20 to 34 years | 45 (100.0%) | 106.0 |
| 35 to 50 years | 0 (0.0%) | 0.0 |
| Total | 45 (100.0%) | 49.0 |
Fertility by Age by Marriage Status in Craig County
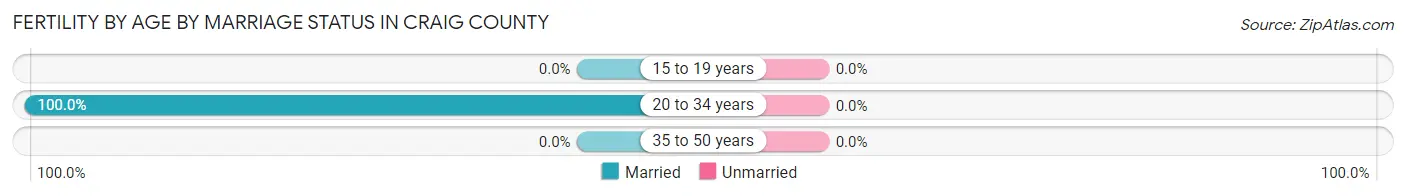
| Age Bracket | Married | Unmarried |
| 15 to 19 years | 0 (0.0%) | 0 (0.0%) |
| 20 to 34 years | 45 (100.0%) | 0 (0.0%) |
| 35 to 50 years | 0 (0.0%) | 0 (0.0%) |
| Total | 45 (100.0%) | 0 (0.0%) |
Fertility by Education in Craig County
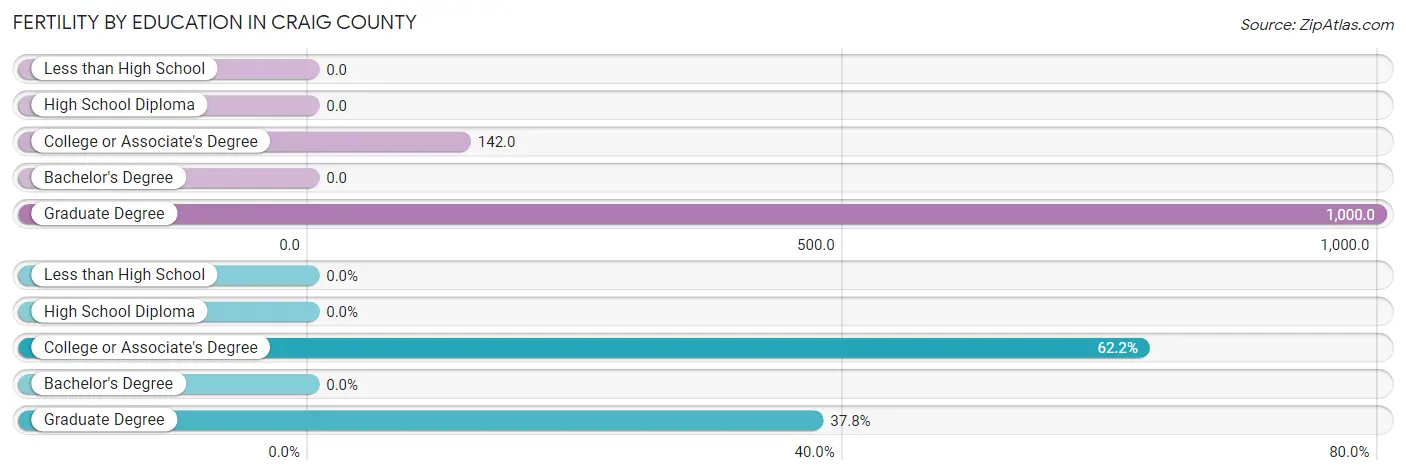
| Educational Attainment | Women with Births | Births / 1,000 Women |
| Less than High School | 0 (0.0%) | 0.0 |
| High School Diploma | 0 (0.0%) | 0.0 |
| College or Associate's Degree | 28 (62.2%) | 142.0 |
| Bachelor's Degree | 0 (0.0%) | 0.0 |
| Graduate Degree | 17 (37.8%) | 1,000.0 |
| Total | 45 (100.0%) | 49.0 |
Fertility by Education by Marriage Status in Craig County
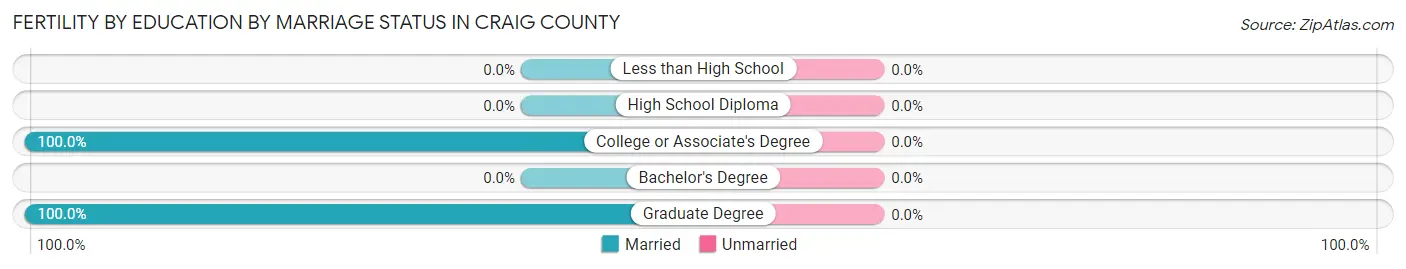
| Educational Attainment | Married | Unmarried |
| Less than High School | 0 (0.0%) | 0 (0.0%) |
| High School Diploma | 0 (0.0%) | 0 (0.0%) |
| College or Associate's Degree | 28 (100.0%) | 0 (0.0%) |
| Bachelor's Degree | 0 (0.0%) | 0 (0.0%) |
| Graduate Degree | 17 (100.0%) | 0 (0.0%) |
| Total | 45 (100.0%) | 0 (0.0%) |
Employment Characteristics in Craig County
Employment by Class of Employer in Craig County
Among the 1,964 employed individuals in Craig County, private company employees (1,393 | 70.9%), not-for-profit organizations (157 | 8.0%), and state government employees (127 | 6.5%) make up the most common classes of employment.
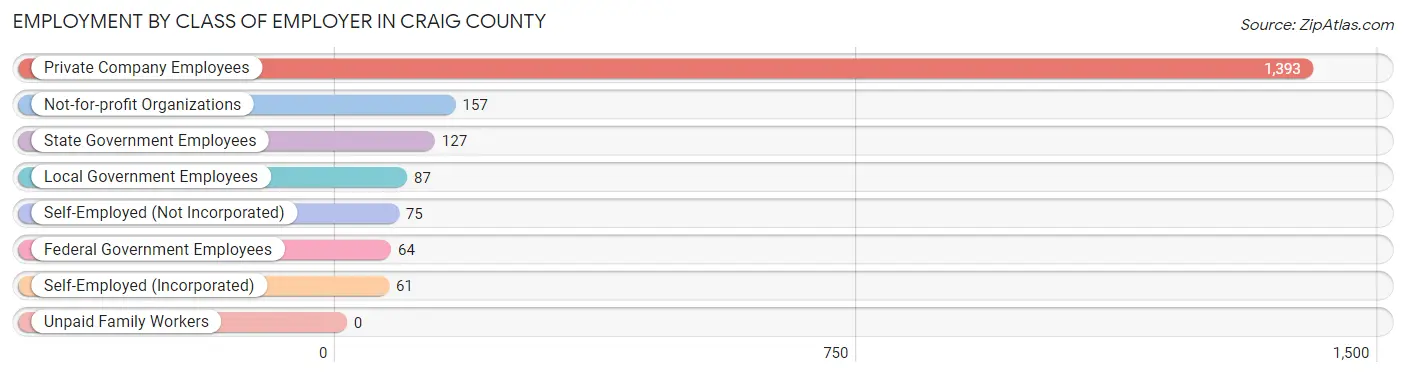
| Employer Class | # Employees | % Employees |
| Private Company Employees | 1,393 | 70.9% |
| Self-Employed (Incorporated) | 61 | 3.1% |
| Self-Employed (Not Incorporated) | 75 | 3.8% |
| Not-for-profit Organizations | 157 | 8.0% |
| Local Government Employees | 87 | 4.4% |
| State Government Employees | 127 | 6.5% |
| Federal Government Employees | 64 | 3.3% |
| Unpaid Family Workers | 0 | 0.0% |
| Total | 1,964 | 100.0% |
Employment Status by Age in Craig County
According to the labor force statistics for Craig County, out of the total population over 16 years of age (3,805), 54.0% or 2,055 individuals are in the labor force, with 1.9% or 39 of them unemployed. The age group with the highest labor force participation rate is 55 to 59 years, with 99.2% or 471 individuals in the labor force. Within the labor force, the 16 to 19 years age range has the highest percentage of unemployed individuals, with 10.5% or 2 of them being unemployed.
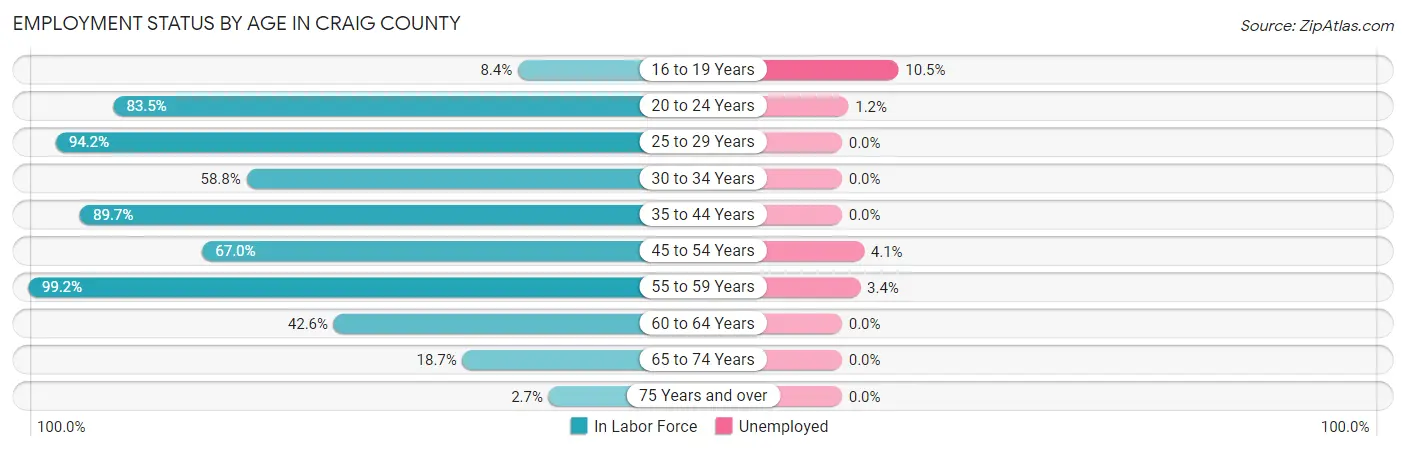
| Age Bracket | In Labor Force | Unemployed |
| 16 to 19 Years | 19 (8.4%) | 2 (10.5%) |
| 20 to 24 Years | 86 (83.5%) | 1 (1.2%) |
| 25 to 29 Years | 194 (94.2%) | 0 (0.0%) |
| 30 to 34 Years | 223 (58.8%) | 0 (0.0%) |
| 35 to 44 Years | 314 (89.7%) | 0 (0.0%) |
| 45 to 54 Years | 469 (67.0%) | 19 (4.1%) |
| 55 to 59 Years | 471 (99.2%) | 16 (3.4%) |
| 60 to 64 Years | 181 (42.6%) | 0 (0.0%) |
| 65 to 74 Years | 85 (18.7%) | 0 (0.0%) |
| 75 Years and over | 13 (2.7%) | 0 (0.0%) |
| Total | 2,055 (54.0%) | 39 (1.9%) |
Employment Status by Educational Attainment in Craig County
According to labor force statistics for Craig County, 73.1% of individuals (1,853) out of the total population between 25 and 64 years of age (2,535) are in the labor force, with 1.9% or 35 of them being unemployed. The group with the highest labor force participation rate are those with the educational attainment of bachelor's degree or higher, with 90.4% or 375 individuals in the labor force. Within the labor force, individuals with less than high school education have the highest percentage of unemployment, with 35.6% or 16 of them being unemployed.
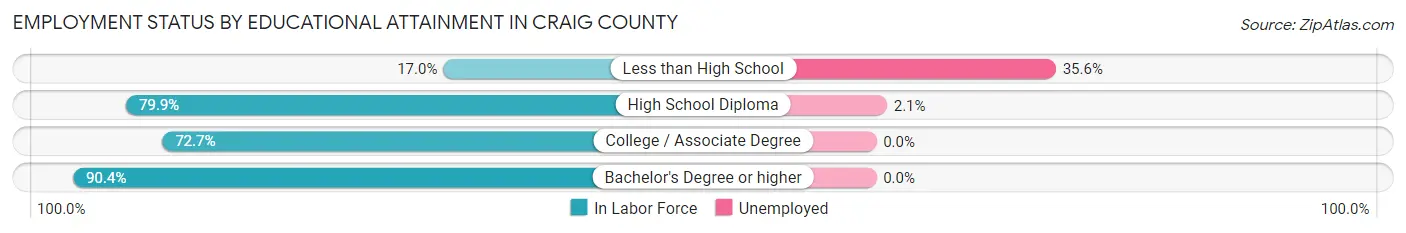
| Educational Attainment | In Labor Force | Unemployed |
| Less than High School | 45 (17.0%) | 94 (35.6%) |
| High School Diploma | 920 (79.9%) | 24 (2.1%) |
| College / Associate Degree | 512 (72.7%) | 0 (0.0%) |
| Bachelor's Degree or higher | 375 (90.4%) | 0 (0.0%) |
| Total | 1,853 (73.1%) | 48 (1.9%) |
Employment Occupations by Sex in Craig County
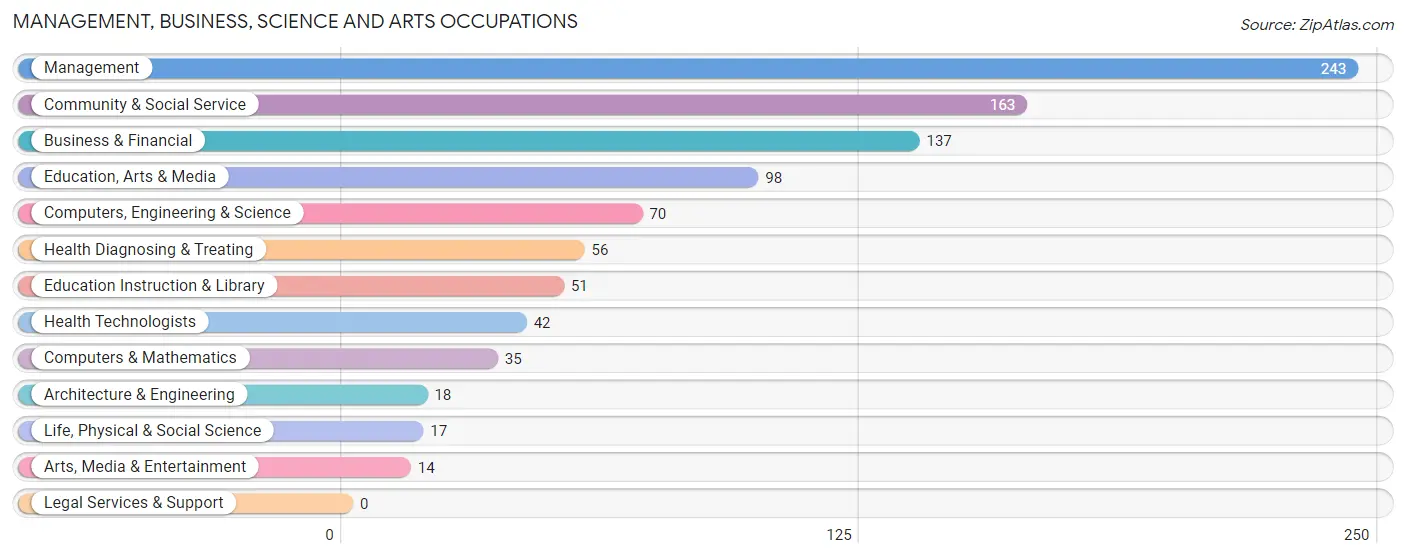
Management, Business, Science and Arts Occupations
The most common Management, Business, Science and Arts occupations in Craig County are Management (243 | 12.2%), Community & Social Service (163 | 8.2%), Business & Financial (137 | 6.9%), Education, Arts & Media (98 | 4.9%), and Computers, Engineering & Science (70 | 3.5%).
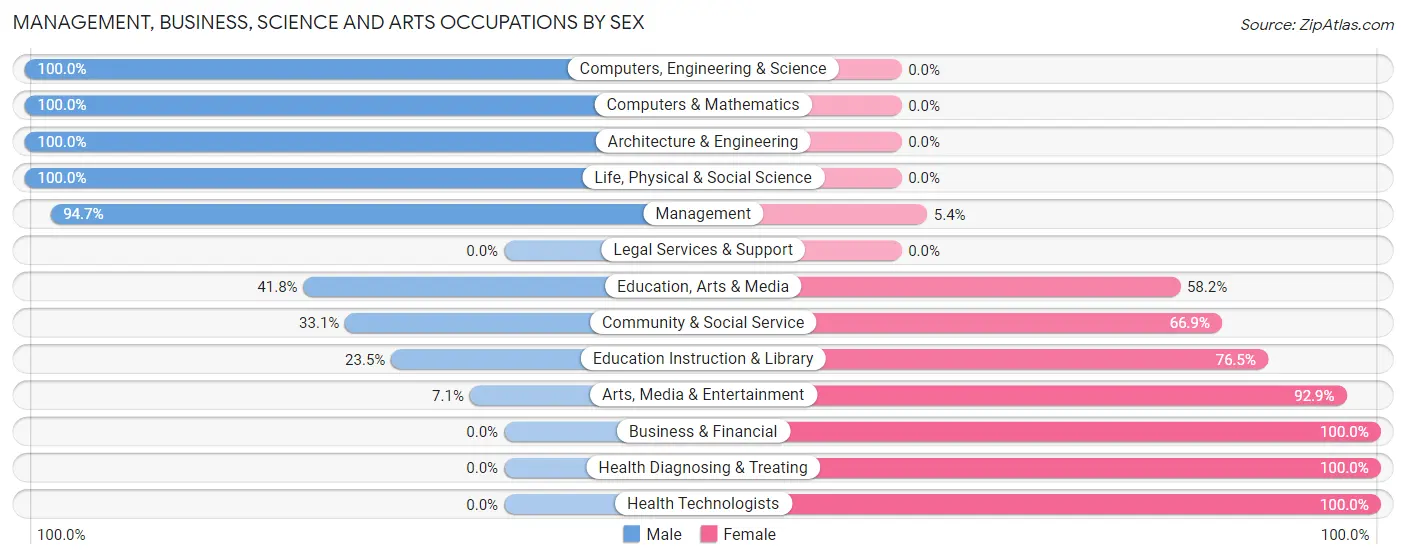
Management, Business, Science and Arts Occupations by Sex
Within the Management, Business, Science and Arts occupations in Craig County, the most male-oriented occupations are Computers, Engineering & Science (100.0%), Computers & Mathematics (100.0%), and Architecture & Engineering (100.0%), while the most female-oriented occupations are Business & Financial (100.0%), Health Diagnosing & Treating (100.0%), and Health Technologists (100.0%).
| Occupation | Male | Female |
| Management | 230 (94.7%) | 13 (5.3%) |
| Business & Financial | 0 (0.0%) | 137 (100.0%) |
| Computers, Engineering & Science | 70 (100.0%) | 0 (0.0%) |
| Computers & Mathematics | 35 (100.0%) | 0 (0.0%) |
| Architecture & Engineering | 18 (100.0%) | 0 (0.0%) |
| Life, Physical & Social Science | 17 (100.0%) | 0 (0.0%) |
| Community & Social Service | 54 (33.1%) | 109 (66.9%) |
| Education, Arts & Media | 41 (41.8%) | 57 (58.2%) |
| Legal Services & Support | 0 (0.0%) | 0 (0.0%) |
| Education Instruction & Library | 12 (23.5%) | 39 (76.5%) |
| Arts, Media & Entertainment | 1 (7.1%) | 13 (92.9%) |
| Health Diagnosing & Treating | 0 (0.0%) | 56 (100.0%) |
| Health Technologists | 0 (0.0%) | 42 (100.0%) |
| Total (Category) | 354 (52.9%) | 315 (47.1%) |
| Total (Overall) | 1,028 (51.5%) | 969 (48.5%) |
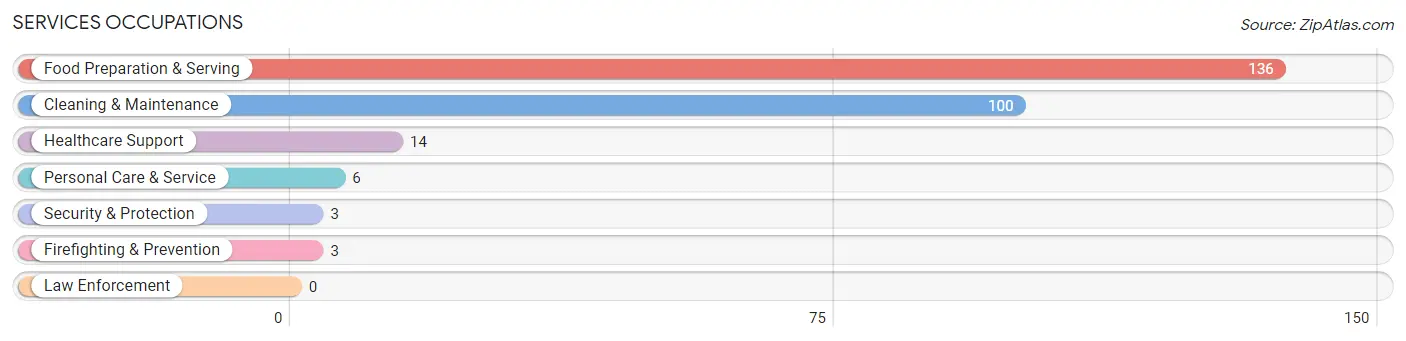
Services Occupations
The most common Services occupations in Craig County are Food Preparation & Serving (136 | 6.8%), Cleaning & Maintenance (100 | 5.0%), Healthcare Support (14 | 0.7%), Personal Care & Service (6 | 0.3%), and Security & Protection (3 | 0.2%).
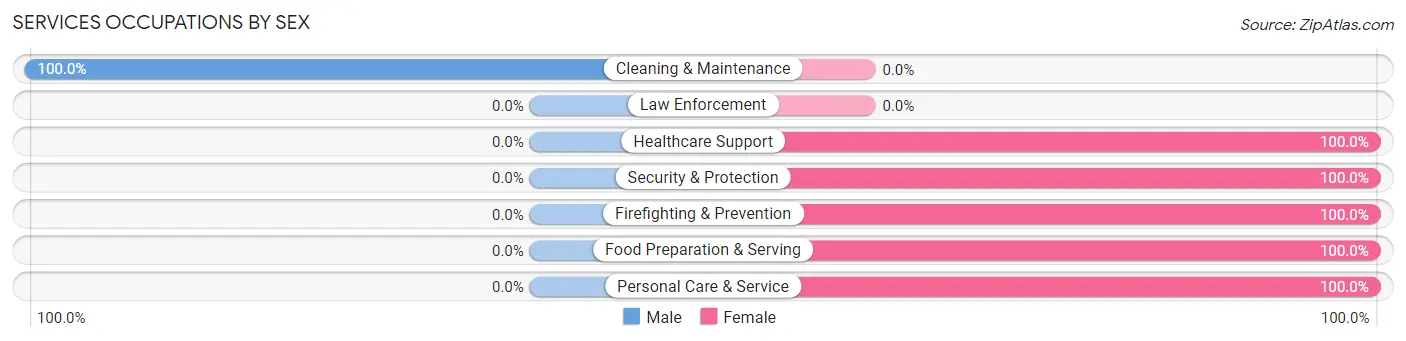
Services Occupations by Sex
| Occupation | Male | Female |
| Healthcare Support | 0 (0.0%) | 14 (100.0%) |
| Security & Protection | 0 (0.0%) | 3 (100.0%) |
| Firefighting & Prevention | 0 (0.0%) | 3 (100.0%) |
| Law Enforcement | 0 (0.0%) | 0 (0.0%) |
| Food Preparation & Serving | 0 (0.0%) | 136 (100.0%) |
| Cleaning & Maintenance | 100 (100.0%) | 0 (0.0%) |
| Personal Care & Service | 0 (0.0%) | 6 (100.0%) |
| Total (Category) | 100 (38.6%) | 159 (61.4%) |
| Total (Overall) | 1,028 (51.5%) | 969 (48.5%) |
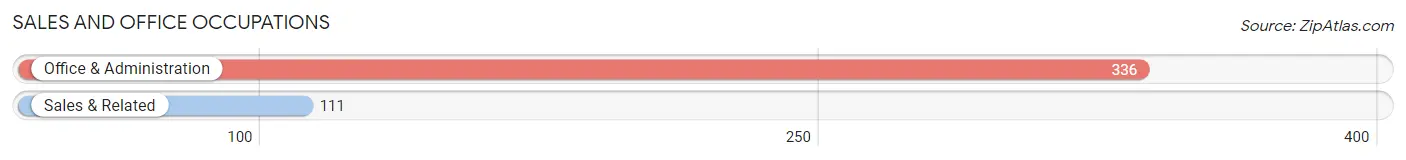
Sales and Office Occupations
The most common Sales and Office occupations in Craig County are Office & Administration (336 | 16.8%), and Sales & Related (111 | 5.6%).
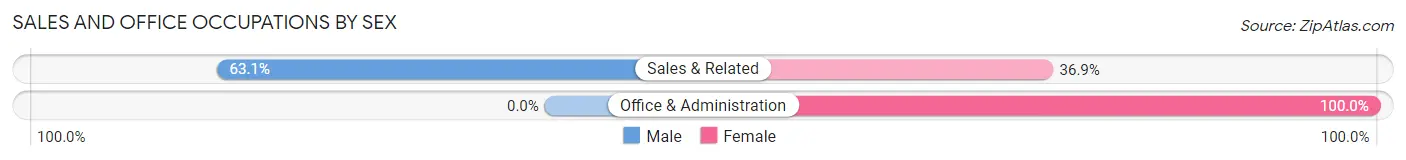
Sales and Office Occupations by Sex
| Occupation | Male | Female |
| Sales & Related | 70 (63.1%) | 41 (36.9%) |
| Office & Administration | 0 (0.0%) | 336 (100.0%) |
| Total (Category) | 70 (15.7%) | 377 (84.3%) |
| Total (Overall) | 1,028 (51.5%) | 969 (48.5%) |
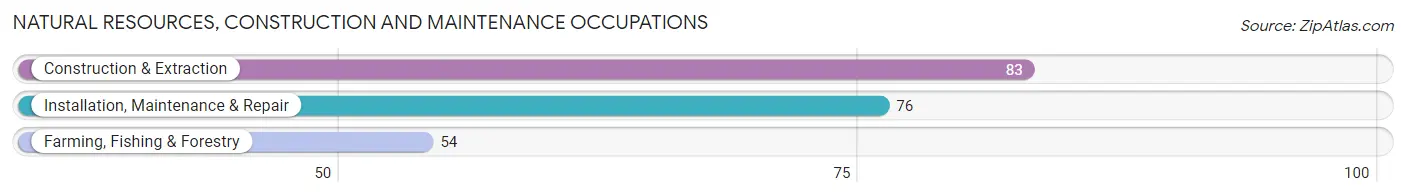
Natural Resources, Construction and Maintenance Occupations
The most common Natural Resources, Construction and Maintenance occupations in Craig County are Construction & Extraction (83 | 4.2%), Installation, Maintenance & Repair (76 | 3.8%), and Farming, Fishing & Forestry (54 | 2.7%).
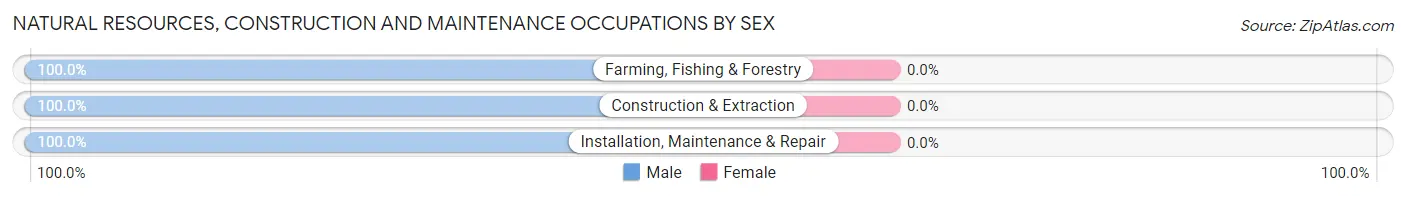
Natural Resources, Construction and Maintenance Occupations by Sex
| Occupation | Male | Female |
| Farming, Fishing & Forestry | 54 (100.0%) | 0 (0.0%) |
| Construction & Extraction | 83 (100.0%) | 0 (0.0%) |
| Installation, Maintenance & Repair | 76 (100.0%) | 0 (0.0%) |
| Total (Category) | 213 (100.0%) | 0 (0.0%) |
| Total (Overall) | 1,028 (51.5%) | 969 (48.5%) |
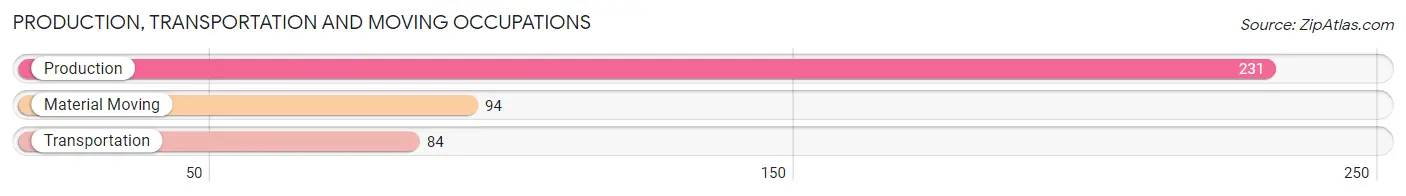
Production, Transportation and Moving Occupations
The most common Production, Transportation and Moving occupations in Craig County are Production (231 | 11.6%), Material Moving (94 | 4.7%), and Transportation (84 | 4.2%).
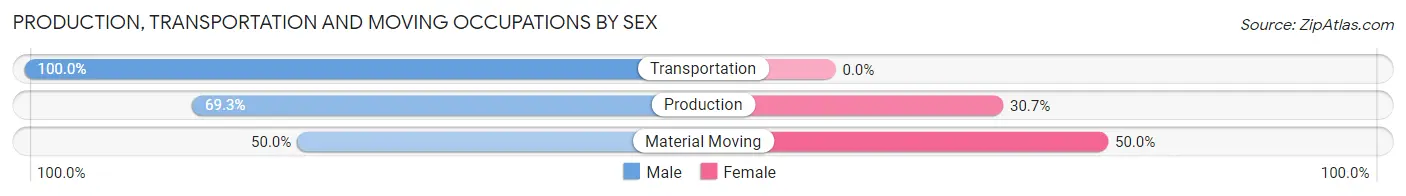
Production, Transportation and Moving Occupations by Sex
| Occupation | Male | Female |
| Production | 160 (69.3%) | 71 (30.7%) |
| Transportation | 84 (100.0%) | 0 (0.0%) |
| Material Moving | 47 (50.0%) | 47 (50.0%) |
| Total (Category) | 291 (71.2%) | 118 (28.8%) |
| Total (Overall) | 1,028 (51.5%) | 969 (48.5%) |
Employment Industries by Sex in Craig County
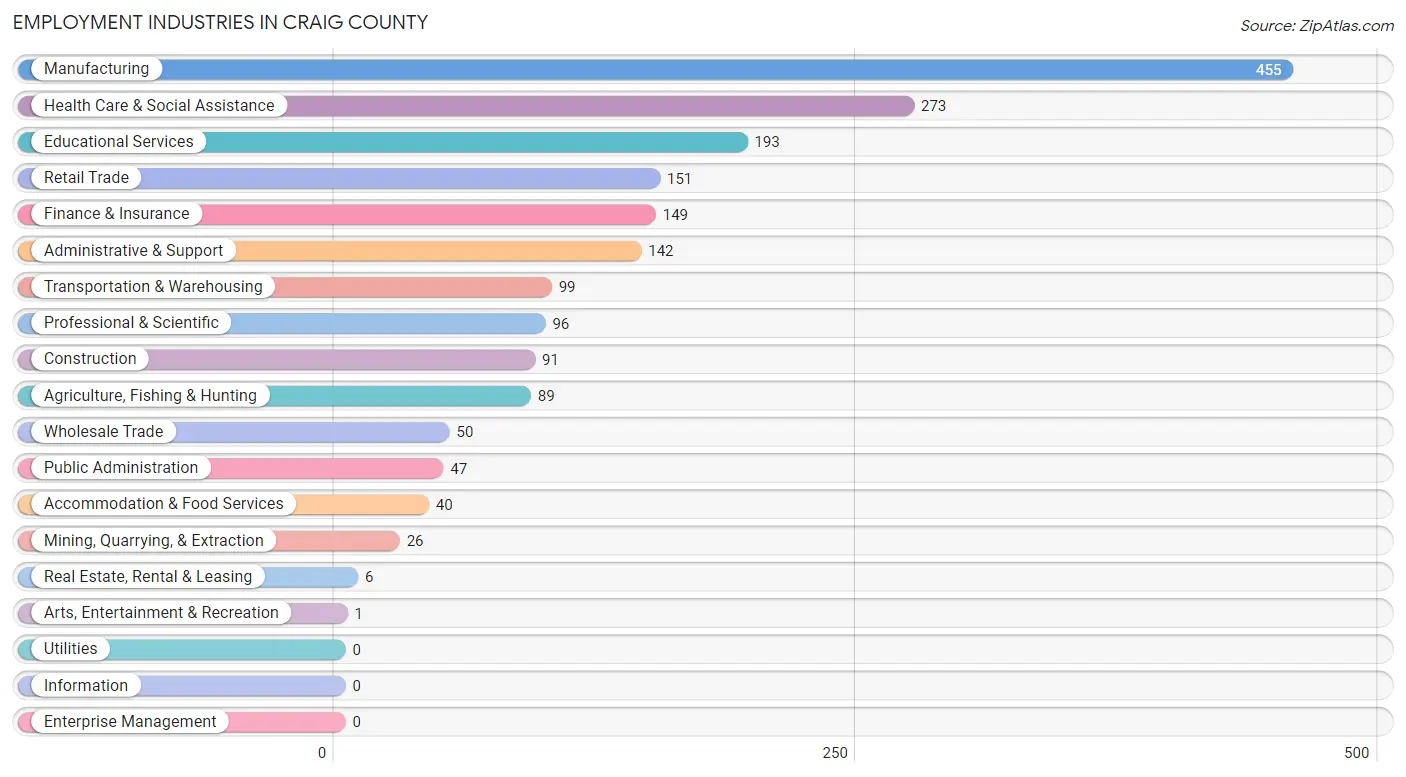
Employment Industries in Craig County
The major employment industries in Craig County include Manufacturing (455 | 22.8%), Health Care & Social Assistance (273 | 13.7%), Educational Services (193 | 9.7%), Retail Trade (151 | 7.6%), and Finance & Insurance (149 | 7.5%).
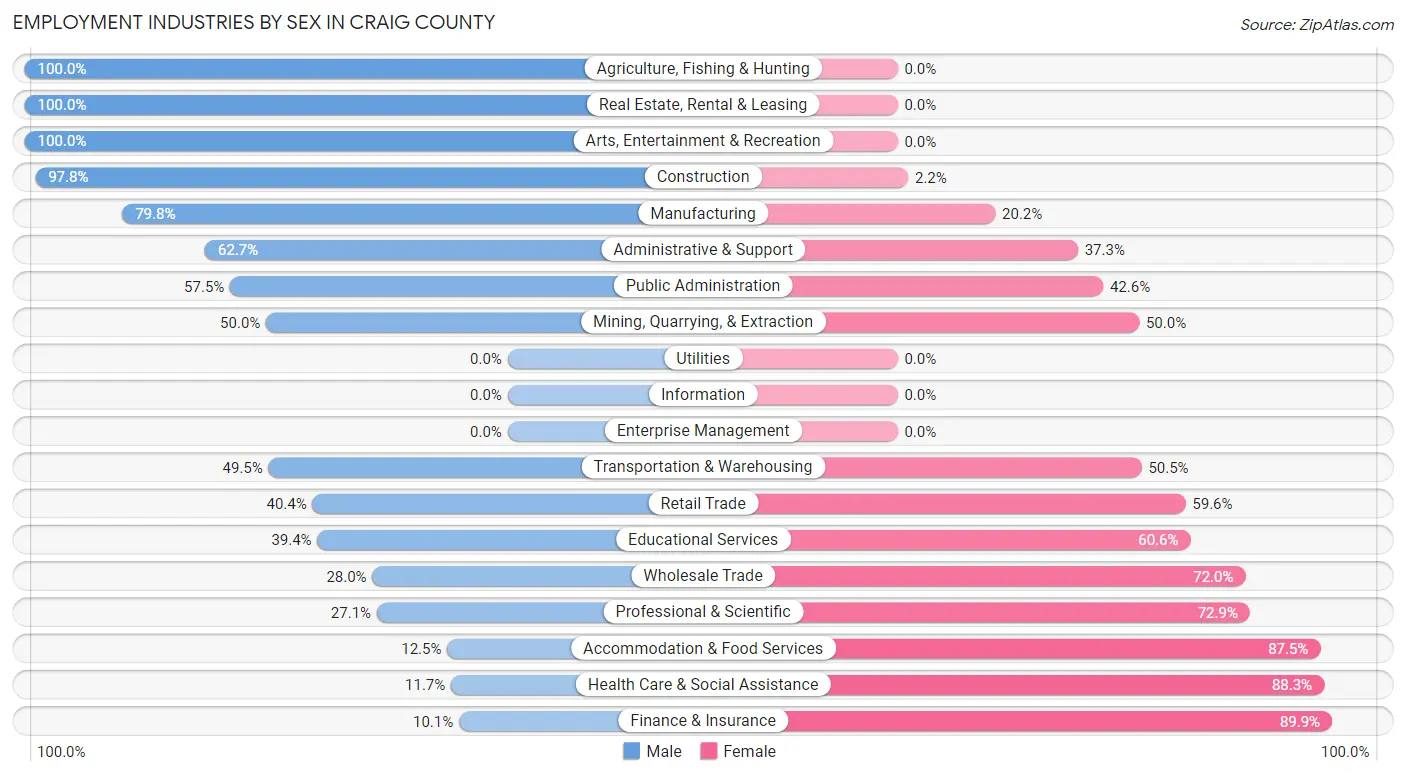
Employment Industries by Sex in Craig County
The Craig County industries that see more men than women are Agriculture, Fishing & Hunting (100.0%), Real Estate, Rental & Leasing (100.0%), and Arts, Entertainment & Recreation (100.0%), whereas the industries that tend to have a higher number of women are Finance & Insurance (89.9%), Health Care & Social Assistance (88.3%), and Accommodation & Food Services (87.5%).
| Industry | Male | Female |
| Agriculture, Fishing & Hunting | 89 (100.0%) | 0 (0.0%) |
| Mining, Quarrying, & Extraction | 13 (50.0%) | 13 (50.0%) |
| Construction | 89 (97.8%) | 2 (2.2%) |
| Manufacturing | 363 (79.8%) | 92 (20.2%) |
| Wholesale Trade | 14 (28.0%) | 36 (72.0%) |
| Retail Trade | 61 (40.4%) | 90 (59.6%) |
| Transportation & Warehousing | 49 (49.5%) | 50 (50.5%) |
| Utilities | 0 (0.0%) | 0 (0.0%) |
| Information | 0 (0.0%) | 0 (0.0%) |
| Finance & Insurance | 15 (10.1%) | 134 (89.9%) |
| Real Estate, Rental & Leasing | 6 (100.0%) | 0 (0.0%) |
| Professional & Scientific | 26 (27.1%) | 70 (72.9%) |
| Enterprise Management | 0 (0.0%) | 0 (0.0%) |
| Administrative & Support | 89 (62.7%) | 53 (37.3%) |
| Educational Services | 76 (39.4%) | 117 (60.6%) |
| Health Care & Social Assistance | 32 (11.7%) | 241 (88.3%) |
| Arts, Entertainment & Recreation | 1 (100.0%) | 0 (0.0%) |
| Accommodation & Food Services | 5 (12.5%) | 35 (87.5%) |
| Public Administration | 27 (57.5%) | 20 (42.5%) |
| Total | 1,028 (51.5%) | 969 (48.5%) |
Education in Craig County
School Enrollment in Craig County
The most common levels of schooling among the 1,084 students in Craig County are elementary school (338 | 31.2%), middle school (243 | 22.4%), and high school (205 | 18.9%).
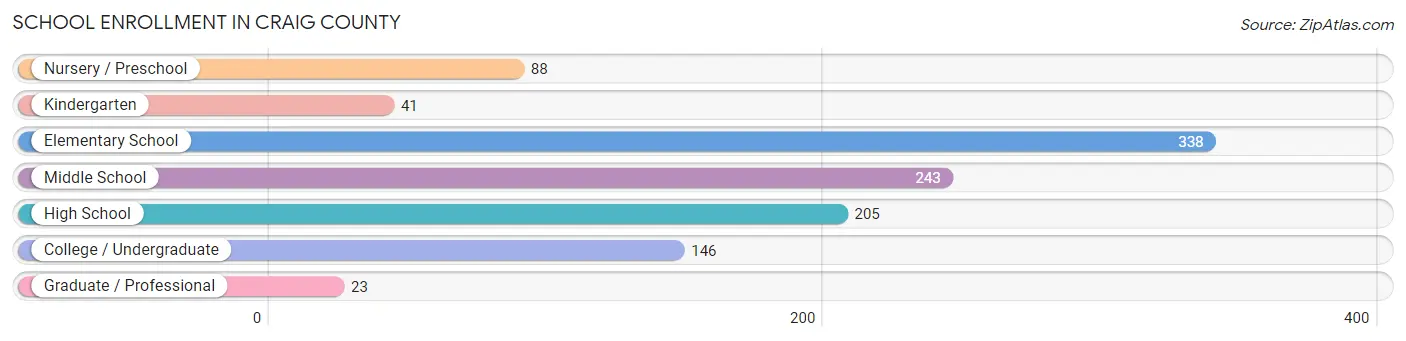
| School Level | # Students | % Students |
| Nursery / Preschool | 88 | 8.1% |
| Kindergarten | 41 | 3.8% |
| Elementary School | 338 | 31.2% |
| Middle School | 243 | 22.4% |
| High School | 205 | 18.9% |
| College / Undergraduate | 146 | 13.5% |
| Graduate / Professional | 23 | 2.1% |
| Total | 1,084 | 100.0% |
School Enrollment by Age by Funding Source in Craig County
Out of a total of 1,084 students who are enrolled in schools in Craig County, 88 (8.1%) attend a private institution, while the remaining 996 (91.9%) are enrolled in public schools. The age group of 35 years and over has the highest likelihood of being enrolled in private schools, with 23 (31.9% in the age bracket) enrolled. Conversely, the age group of 3 to 4 year olds has the lowest likelihood of being enrolled in a private school, with 73 (100.0% in the age bracket) attending a public institution.
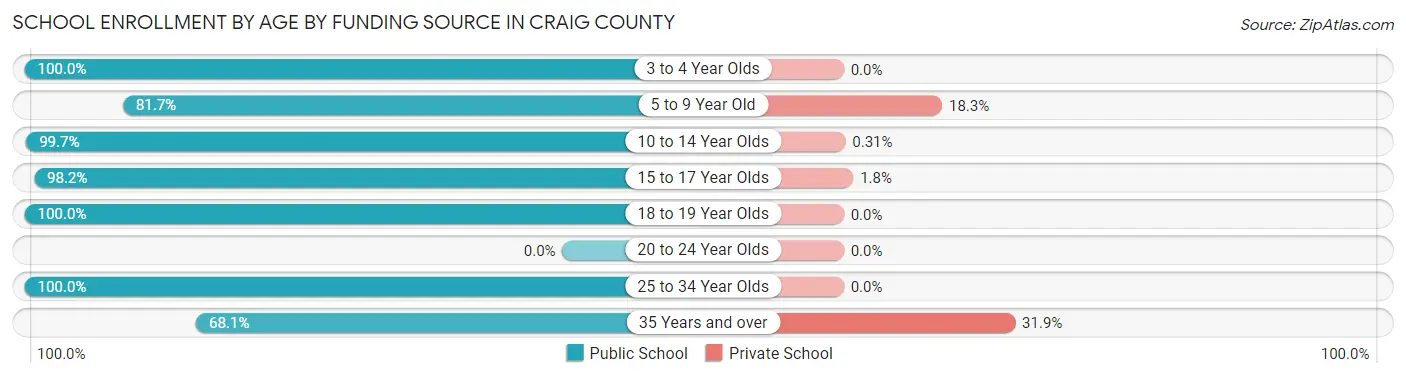
| Age Bracket | Public School | Private School |
| 3 to 4 Year Olds | 73 (100.0%) | 0 (0.0%) |
| 5 to 9 Year Old | 272 (81.7%) | 61 (18.3%) |
| 10 to 14 Year Olds | 320 (99.7%) | 1 (0.3%) |
| 15 to 17 Year Olds | 166 (98.2%) | 3 (1.8%) |
| 18 to 19 Year Olds | 88 (100.0%) | 0 (0.0%) |
| 20 to 24 Year Olds | 0 (0.0%) | 0 (0.0%) |
| 25 to 34 Year Olds | 28 (100.0%) | 0 (0.0%) |
| 35 Years and over | 49 (68.1%) | 23 (31.9%) |
| Total | 996 (91.9%) | 88 (8.1%) |
Educational Attainment by Field of Study in Craig County
Liberal arts & history (113 | 18.1%), arts & humanities (83 | 13.3%), bio, nature & agricultural (70 | 11.2%), literature & languages (69 | 11.1%), and physical & health sciences (44 | 7.0%) are the most common fields of study among 624 individuals in Craig County who have obtained a bachelor's degree or higher.
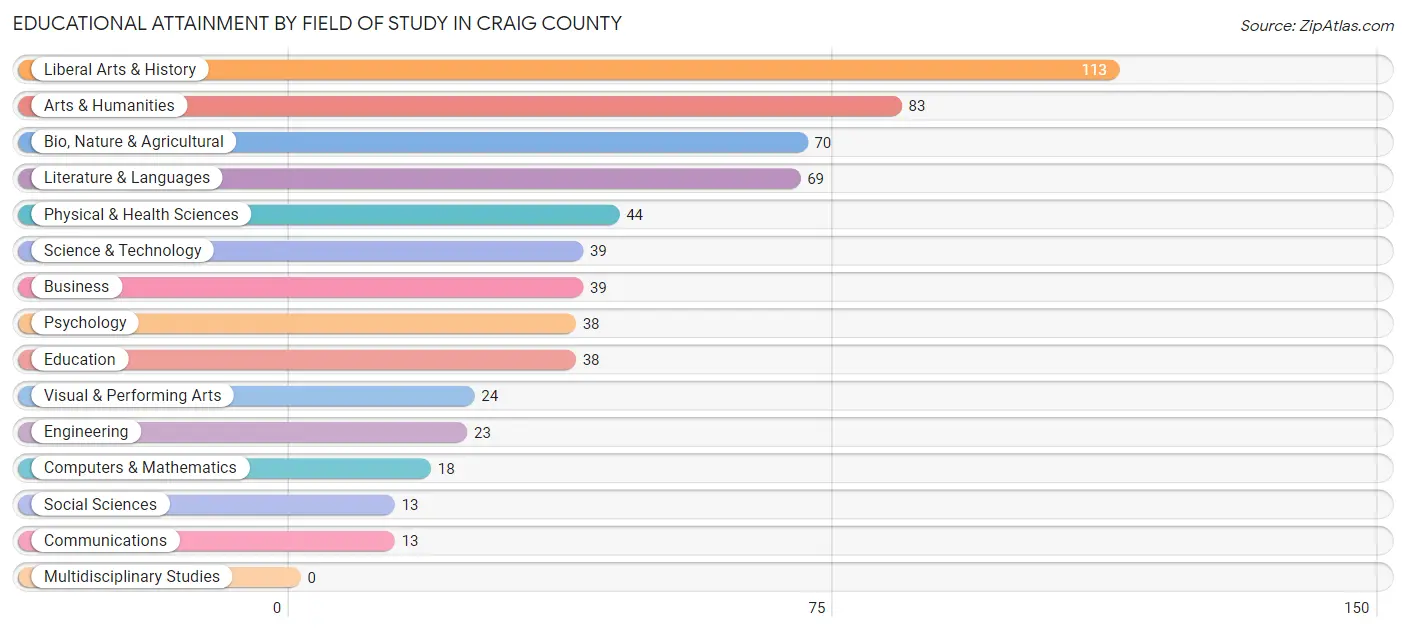
| Field of Study | # Graduates | % Graduates |
| Computers & Mathematics | 18 | 2.9% |
| Bio, Nature & Agricultural | 70 | 11.2% |
| Physical & Health Sciences | 44 | 7.0% |
| Psychology | 38 | 6.1% |
| Social Sciences | 13 | 2.1% |
| Engineering | 23 | 3.7% |
| Multidisciplinary Studies | 0 | 0.0% |
| Science & Technology | 39 | 6.2% |
| Business | 39 | 6.2% |
| Education | 38 | 6.1% |
| Literature & Languages | 69 | 11.1% |
| Liberal Arts & History | 113 | 18.1% |
| Visual & Performing Arts | 24 | 3.8% |
| Communications | 13 | 2.1% |
| Arts & Humanities | 83 | 13.3% |
| Total | 624 | 100.0% |
Transportation & Commute in Craig County
Vehicle Availability by Sex in Craig County
The most prevalent vehicle ownership categories in Craig County are males with 3 vehicles (405, accounting for 39.5%) and females with 3 vehicles (452, making up 43.3%).
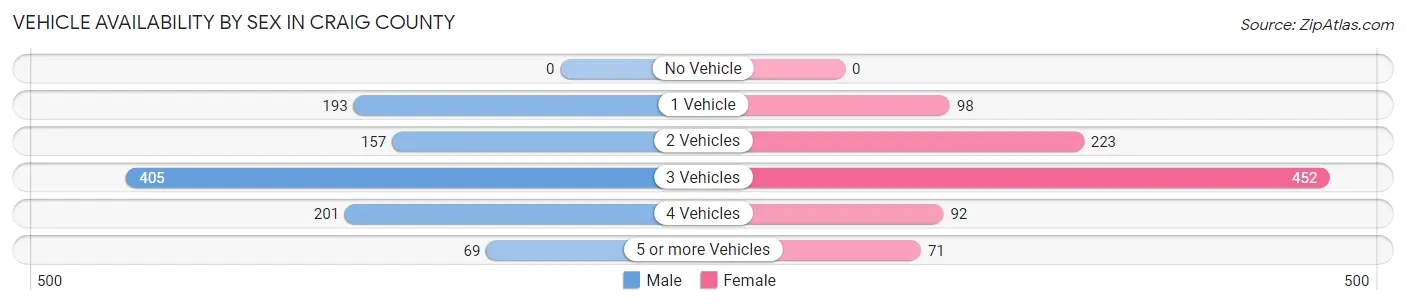
| Vehicles Available | Male | Female |
| No Vehicle | 0 (0.0%) | 0 (0.0%) |
| 1 Vehicle | 193 (18.8%) | 98 (10.5%) |
| 2 Vehicles | 157 (15.3%) | 223 (23.8%) |
| 3 Vehicles | 405 (39.5%) | 452 (48.3%) |
| 4 Vehicles | 201 (19.6%) | 92 (9.8%) |
| 5 or more Vehicles | 69 (6.7%) | 71 (7.6%) |
| Total | 1,025 (100.0%) | 936 (100.0%) |
Commute Time in Craig County
The most frequently occuring commute durations in Craig County are 45 to 59 minutes (545 commuters, 29.0%), 40 to 44 minutes (259 commuters, 13.8%), and 30 to 34 minutes (226 commuters, 12.0%).
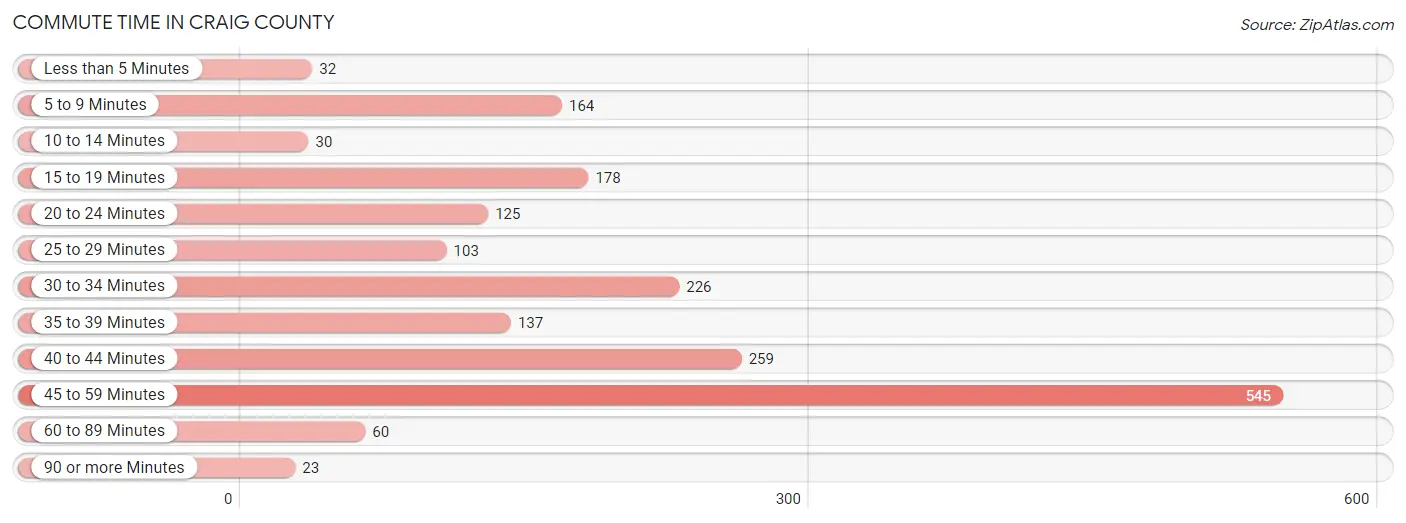
| Commute Time | # Commuters | % Commuters |
| Less than 5 Minutes | 32 | 1.7% |
| 5 to 9 Minutes | 164 | 8.7% |
| 10 to 14 Minutes | 30 | 1.6% |
| 15 to 19 Minutes | 178 | 9.5% |
| 20 to 24 Minutes | 125 | 6.6% |
| 25 to 29 Minutes | 103 | 5.5% |
| 30 to 34 Minutes | 226 | 12.0% |
| 35 to 39 Minutes | 137 | 7.3% |
| 40 to 44 Minutes | 259 | 13.8% |
| 45 to 59 Minutes | 545 | 29.0% |
| 60 to 89 Minutes | 60 | 3.2% |
| 90 or more Minutes | 23 | 1.2% |
Commute Time by Sex in Craig County
The most common commute times in Craig County are 45 to 59 minutes (326 commuters, 32.3%) for males and 45 to 59 minutes (219 commuters, 25.1%) for females.
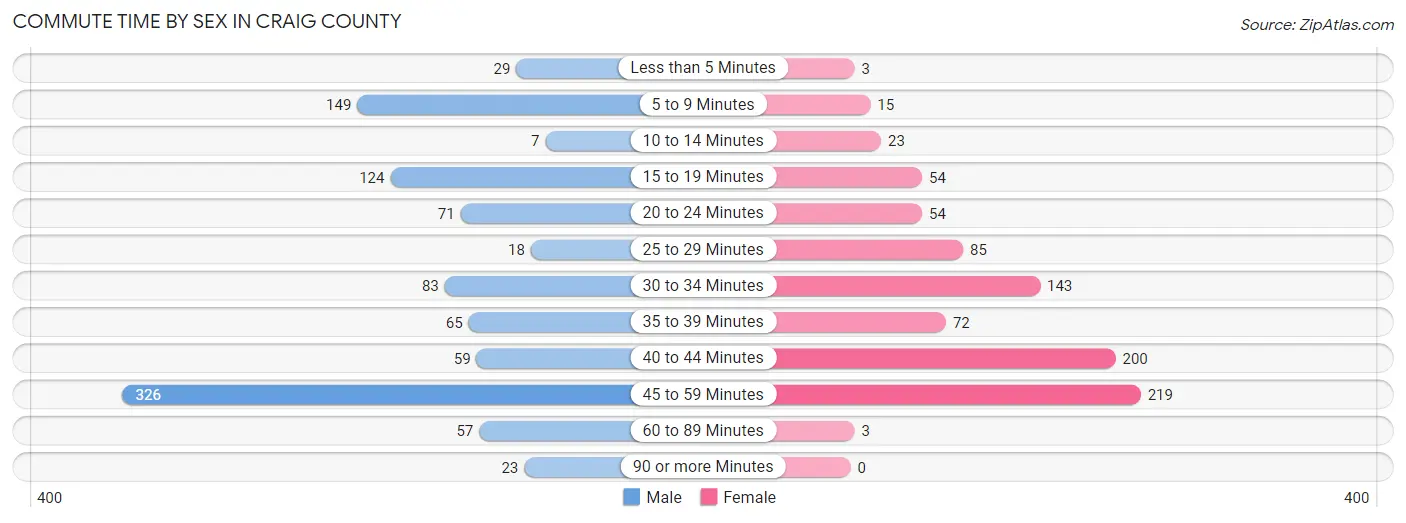
| Commute Time | Male | Female |
| Less than 5 Minutes | 29 (2.9%) | 3 (0.3%) |
| 5 to 9 Minutes | 149 (14.7%) | 15 (1.7%) |
| 10 to 14 Minutes | 7 (0.7%) | 23 (2.6%) |
| 15 to 19 Minutes | 124 (12.3%) | 54 (6.2%) |
| 20 to 24 Minutes | 71 (7.0%) | 54 (6.2%) |
| 25 to 29 Minutes | 18 (1.8%) | 85 (9.8%) |
| 30 to 34 Minutes | 83 (8.2%) | 143 (16.4%) |
| 35 to 39 Minutes | 65 (6.4%) | 72 (8.3%) |
| 40 to 44 Minutes | 59 (5.8%) | 200 (23.0%) |
| 45 to 59 Minutes | 326 (32.3%) | 219 (25.1%) |
| 60 to 89 Minutes | 57 (5.6%) | 3 (0.3%) |
| 90 or more Minutes | 23 (2.3%) | 0 (0.0%) |
Time of Departure to Work by Sex in Craig County
The most frequent times of departure to work in Craig County are 7:00 AM to 7:29 AM (204, 20.2%) for males and 7:00 AM to 7:29 AM (241, 27.7%) for females.
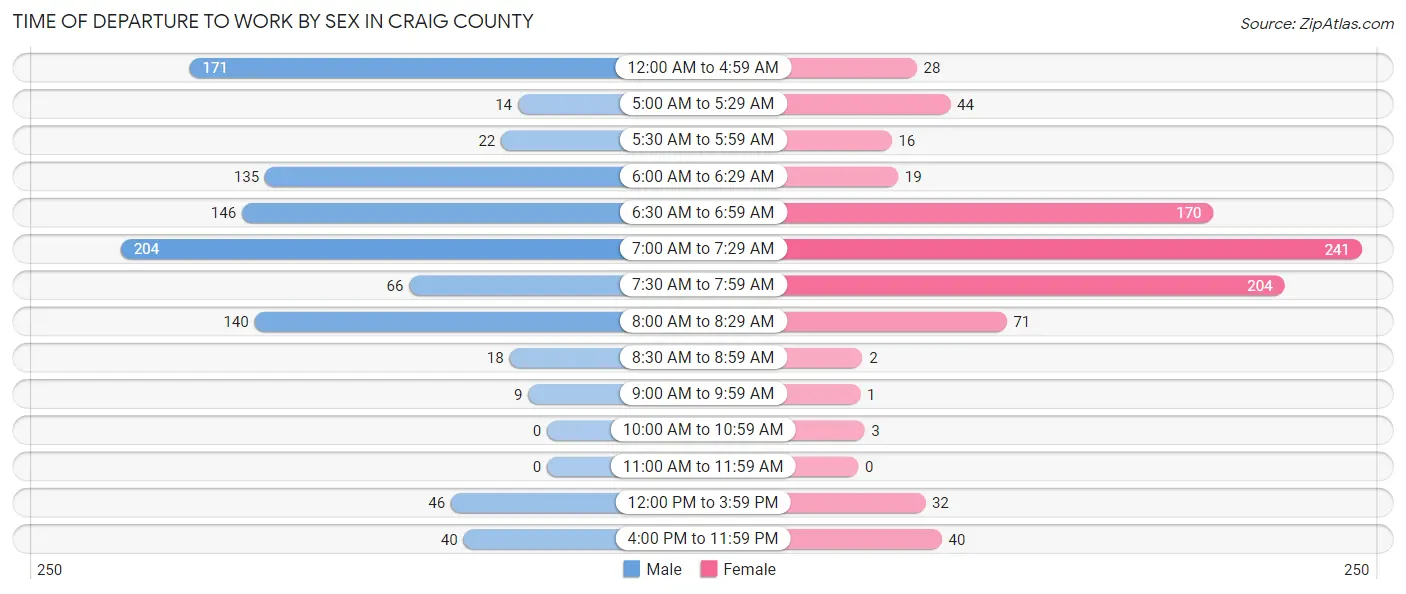
| Time of Departure | Male | Female |
| 12:00 AM to 4:59 AM | 171 (16.9%) | 28 (3.2%) |
| 5:00 AM to 5:29 AM | 14 (1.4%) | 44 (5.1%) |
| 5:30 AM to 5:59 AM | 22 (2.2%) | 16 (1.8%) |
| 6:00 AM to 6:29 AM | 135 (13.4%) | 19 (2.2%) |
| 6:30 AM to 6:59 AM | 146 (14.4%) | 170 (19.5%) |
| 7:00 AM to 7:29 AM | 204 (20.2%) | 241 (27.7%) |
| 7:30 AM to 7:59 AM | 66 (6.5%) | 204 (23.4%) |
| 8:00 AM to 8:29 AM | 140 (13.9%) | 71 (8.2%) |
| 8:30 AM to 8:59 AM | 18 (1.8%) | 2 (0.2%) |
| 9:00 AM to 9:59 AM | 9 (0.9%) | 1 (0.1%) |
| 10:00 AM to 10:59 AM | 0 (0.0%) | 3 (0.3%) |
| 11:00 AM to 11:59 AM | 0 (0.0%) | 0 (0.0%) |
| 12:00 PM to 3:59 PM | 46 (4.5%) | 32 (3.7%) |
| 4:00 PM to 11:59 PM | 40 (4.0%) | 40 (4.6%) |
| Total | 1,011 (100.0%) | 871 (100.0%) |
Housing Occupancy in Craig County
Occupancy by Ownership in Craig County
Of the total 1,810 dwellings in Craig County, owner-occupied units account for 1,465 (80.9%), while renter-occupied units make up 345 (19.1%).
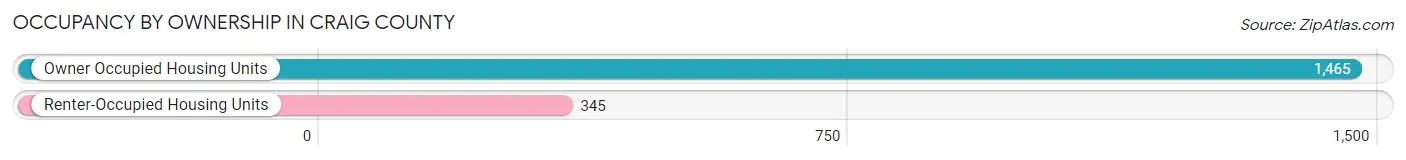
| Occupancy | # Housing Units | % Housing Units |
| Owner Occupied Housing Units | 1,465 | 80.9% |
| Renter-Occupied Housing Units | 345 | 19.1% |
| Total Occupied Housing Units | 1,810 | 100.0% |
Occupancy by Household Size in Craig County
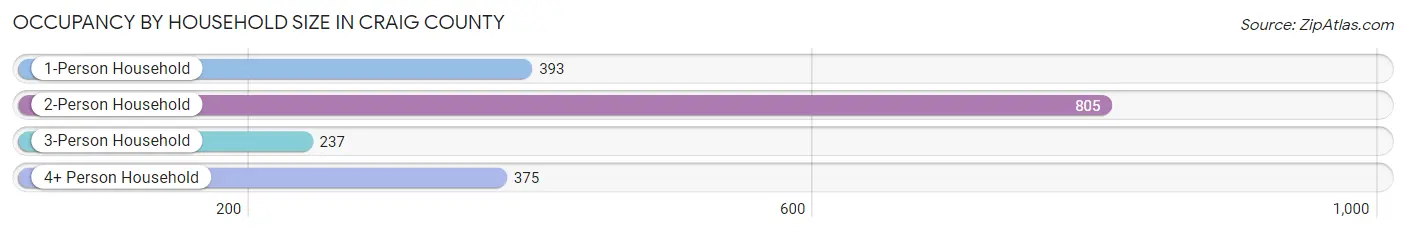
| Household Size | # Housing Units | % Housing Units |
| 1-Person Household | 393 | 21.7% |
| 2-Person Household | 805 | 44.5% |
| 3-Person Household | 237 | 13.1% |
| 4+ Person Household | 375 | 20.7% |
| Total Housing Units | 1,810 | 100.0% |
Occupancy by Ownership by Household Size in Craig County
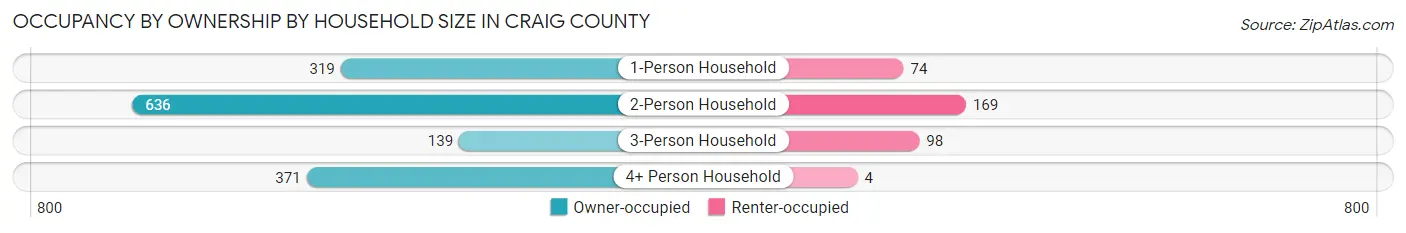
| Household Size | Owner-occupied | Renter-occupied |
| 1-Person Household | 319 (81.2%) | 74 (18.8%) |
| 2-Person Household | 636 (79.0%) | 169 (21.0%) |
| 3-Person Household | 139 (58.7%) | 98 (41.3%) |
| 4+ Person Household | 371 (98.9%) | 4 (1.1%) |
| Total Housing Units | 1,465 (80.9%) | 345 (19.1%) |
Occupancy by Educational Attainment in Craig County
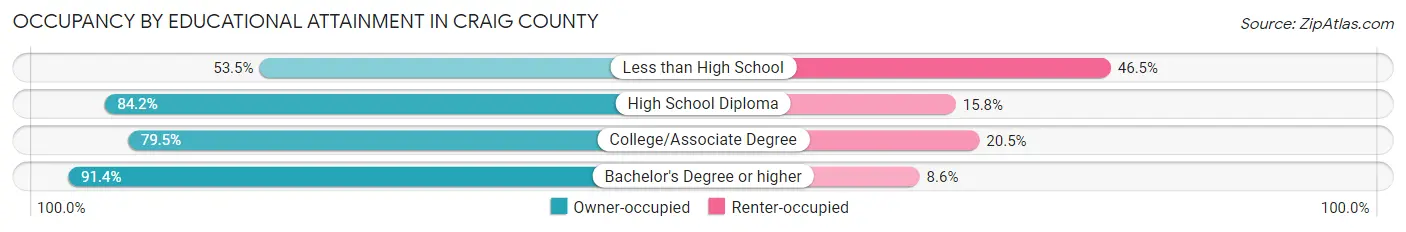
| Household Size | Owner-occupied | Renter-occupied |
| Less than High School | 77 (53.5%) | 67 (46.5%) |
| High School Diploma | 517 (84.2%) | 97 (15.8%) |
| College/Associate Degree | 606 (79.5%) | 156 (20.5%) |
| Bachelor's Degree or higher | 265 (91.4%) | 25 (8.6%) |
Occupancy by Age of Householder in Craig County
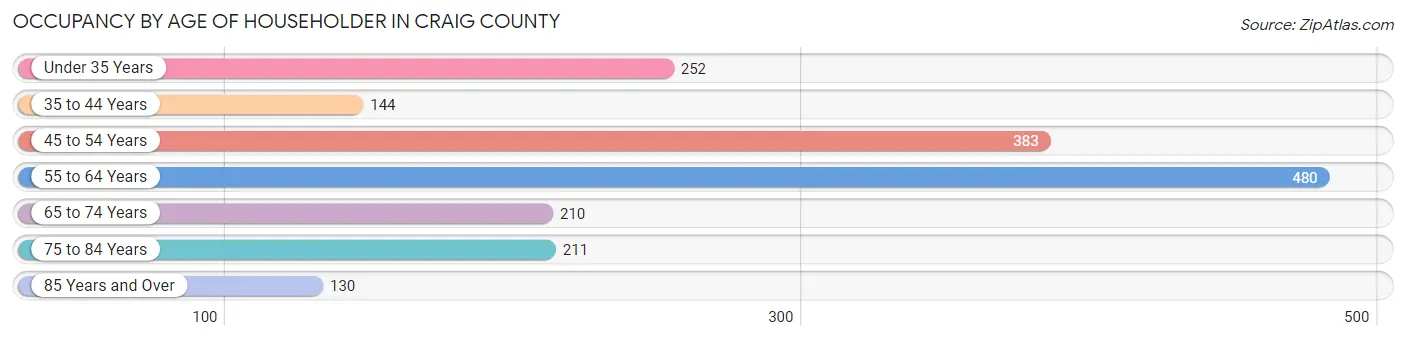
| Age Bracket | # Households | % Households |
| Under 35 Years | 252 | 13.9% |
| 35 to 44 Years | 144 | 8.0% |
| 45 to 54 Years | 383 | 21.2% |
| 55 to 64 Years | 480 | 26.5% |
| 65 to 74 Years | 210 | 11.6% |
| 75 to 84 Years | 211 | 11.7% |
| 85 Years and Over | 130 | 7.2% |
| Total | 1,810 | 100.0% |
Housing Finances in Craig County
Median Income by Occupancy in Craig County
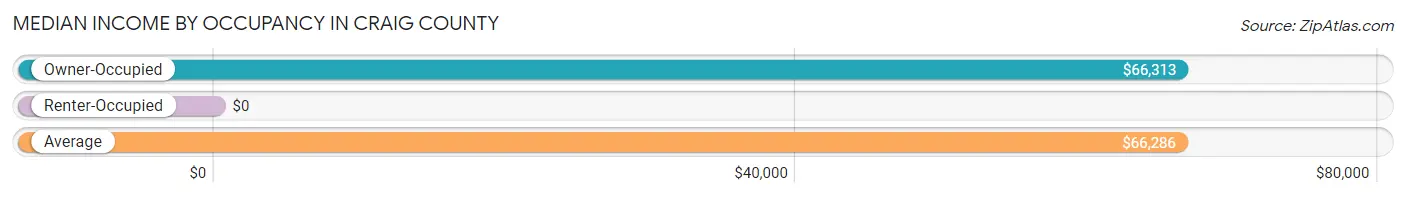
| Occupancy Type | # Households | Median Income |
| Owner-Occupied | 1,465 (80.9%) | $66,313 |
| Renter-Occupied | 345 (19.1%) | $0 |
| Average | 1,810 (100.0%) | $66,286 |
Occupancy by Householder Income Bracket in Craig County
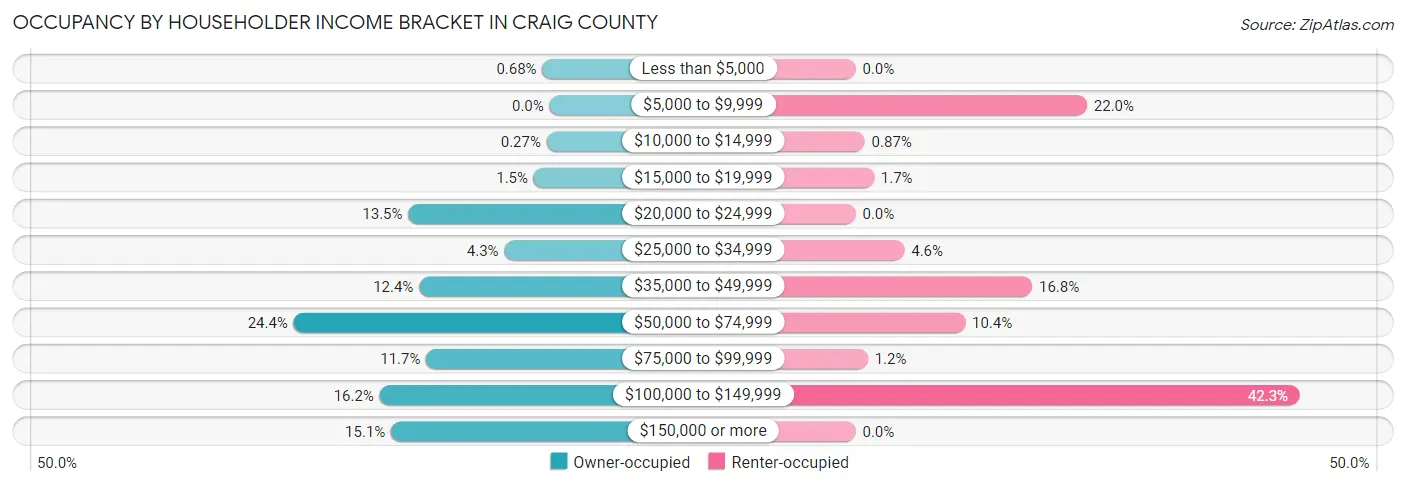
| Income Bracket | Owner-occupied | Renter-occupied |
| Less than $5,000 | 10 (0.7%) | 0 (0.0%) |
| $5,000 to $9,999 | 0 (0.0%) | 76 (22.0%) |
| $10,000 to $14,999 | 4 (0.3%) | 3 (0.9%) |
| $15,000 to $19,999 | 22 (1.5%) | 6 (1.7%) |
| $20,000 to $24,999 | 197 (13.5%) | 0 (0.0%) |
| $25,000 to $34,999 | 63 (4.3%) | 16 (4.6%) |
| $35,000 to $49,999 | 182 (12.4%) | 58 (16.8%) |
| $50,000 to $74,999 | 357 (24.4%) | 36 (10.4%) |
| $75,000 to $99,999 | 172 (11.7%) | 4 (1.2%) |
| $100,000 to $149,999 | 237 (16.2%) | 146 (42.3%) |
| $150,000 or more | 221 (15.1%) | 0 (0.0%) |
| Total | 1,465 (100.0%) | 345 (100.0%) |
Monthly Housing Cost Tiers in Craig County
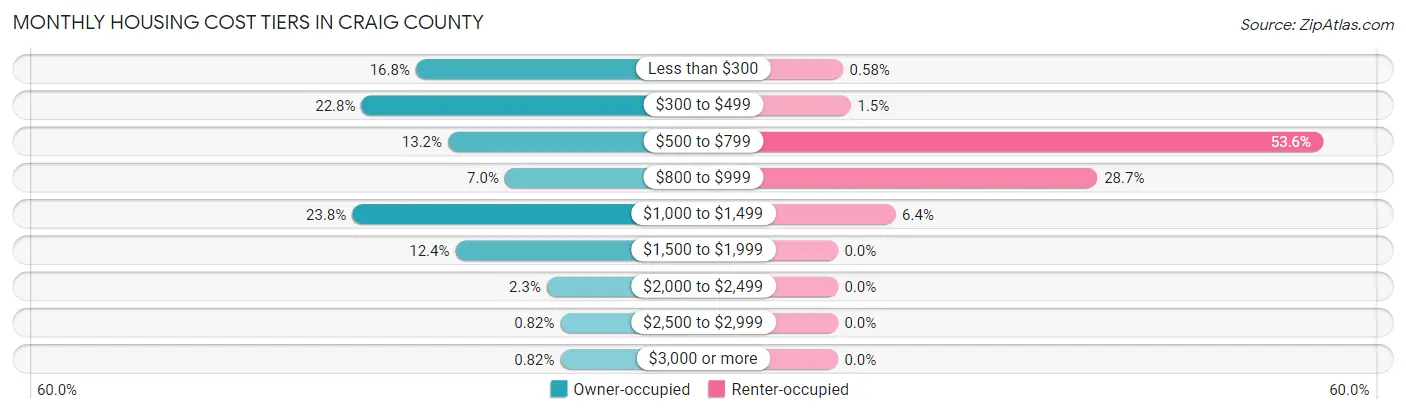
| Monthly Cost | Owner-occupied | Renter-occupied |
| Less than $300 | 246 (16.8%) | 2 (0.6%) |
| $300 to $499 | 334 (22.8%) | 5 (1.5%) |
| $500 to $799 | 194 (13.2%) | 185 (53.6%) |
| $800 to $999 | 102 (7.0%) | 99 (28.7%) |
| $1,000 to $1,499 | 349 (23.8%) | 22 (6.4%) |
| $1,500 to $1,999 | 182 (12.4%) | 0 (0.0%) |
| $2,000 to $2,499 | 34 (2.3%) | 0 (0.0%) |
| $2,500 to $2,999 | 12 (0.8%) | 0 (0.0%) |
| $3,000 or more | 12 (0.8%) | 0 (0.0%) |
| Total | 1,465 (100.0%) | 345 (100.0%) |
Physical Housing Characteristics in Craig County
Housing Structures in Craig County
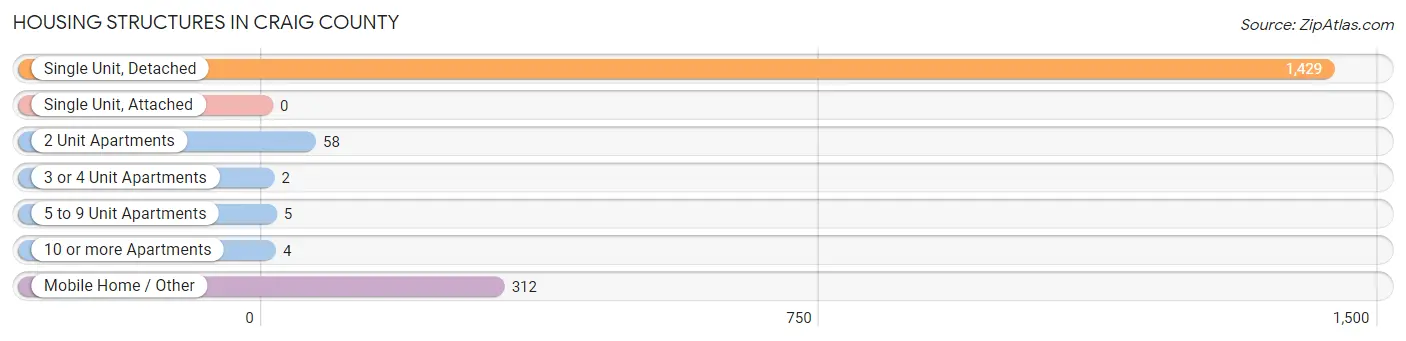
| Structure Type | # Housing Units | % Housing Units |
| Single Unit, Detached | 1,429 | 78.9% |
| Single Unit, Attached | 0 | 0.0% |
| 2 Unit Apartments | 58 | 3.2% |
| 3 or 4 Unit Apartments | 2 | 0.1% |
| 5 to 9 Unit Apartments | 5 | 0.3% |
| 10 or more Apartments | 4 | 0.2% |
| Mobile Home / Other | 312 | 17.2% |
| Total | 1,810 | 100.0% |
Housing Structures by Occupancy in Craig County
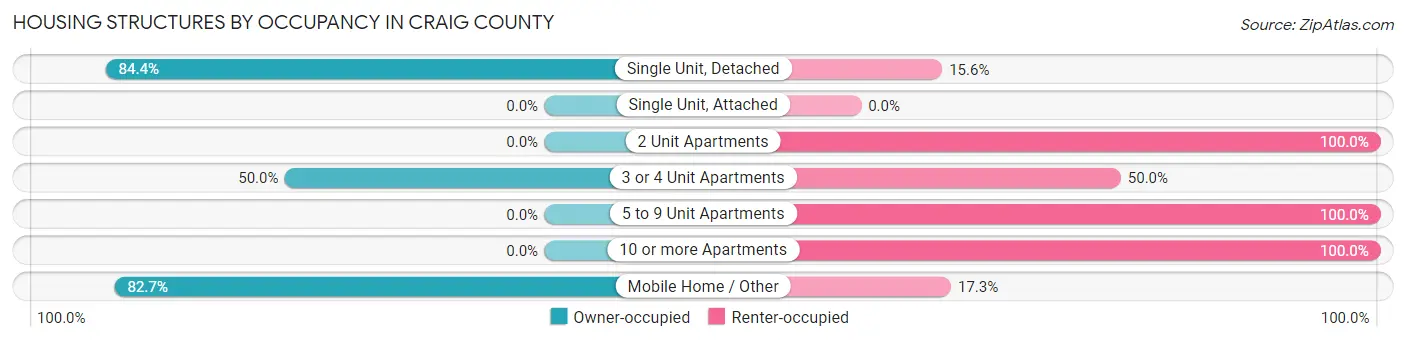
| Structure Type | Owner-occupied | Renter-occupied |
| Single Unit, Detached | 1,206 (84.4%) | 223 (15.6%) |
| Single Unit, Attached | 0 (0.0%) | 0 (0.0%) |
| 2 Unit Apartments | 0 (0.0%) | 58 (100.0%) |
| 3 or 4 Unit Apartments | 1 (50.0%) | 1 (50.0%) |
| 5 to 9 Unit Apartments | 0 (0.0%) | 5 (100.0%) |
| 10 or more Apartments | 0 (0.0%) | 4 (100.0%) |
| Mobile Home / Other | 258 (82.7%) | 54 (17.3%) |
| Total | 1,465 (80.9%) | 345 (19.1%) |
Housing Structures by Number of Rooms in Craig County
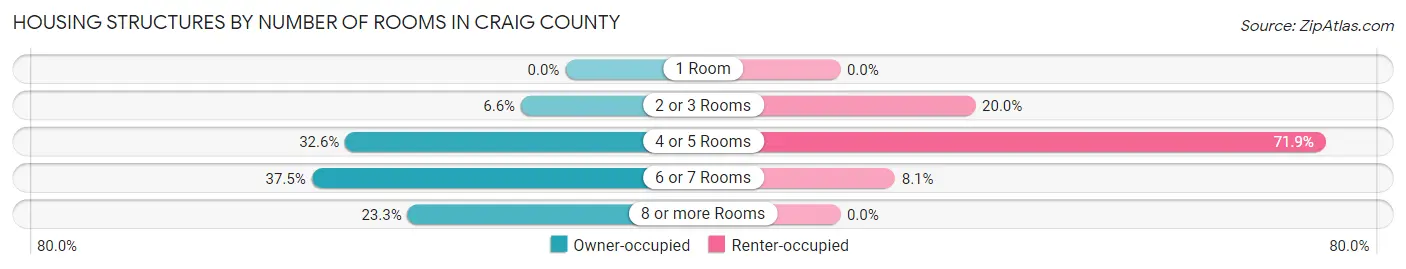
| Number of Rooms | Owner-occupied | Renter-occupied |
| 1 Room | 0 (0.0%) | 0 (0.0%) |
| 2 or 3 Rooms | 96 (6.6%) | 69 (20.0%) |
| 4 or 5 Rooms | 477 (32.6%) | 248 (71.9%) |
| 6 or 7 Rooms | 550 (37.5%) | 28 (8.1%) |
| 8 or more Rooms | 342 (23.3%) | 0 (0.0%) |
| Total | 1,465 (100.0%) | 345 (100.0%) |
Housing Structure by Heating Type in Craig County
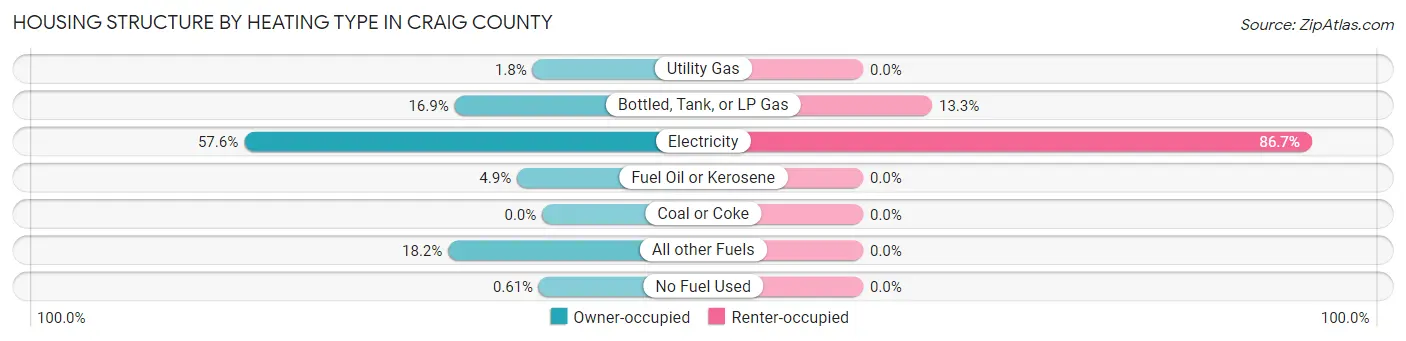
| Heating Type | Owner-occupied | Renter-occupied |
| Utility Gas | 27 (1.8%) | 0 (0.0%) |
| Bottled, Tank, or LP Gas | 248 (16.9%) | 46 (13.3%) |
| Electricity | 844 (57.6%) | 299 (86.7%) |
| Fuel Oil or Kerosene | 71 (4.9%) | 0 (0.0%) |
| Coal or Coke | 0 (0.0%) | 0 (0.0%) |
| All other Fuels | 266 (18.2%) | 0 (0.0%) |
| No Fuel Used | 9 (0.6%) | 0 (0.0%) |
| Total | 1,465 (100.0%) | 345 (100.0%) |
Household Vehicle Usage in Craig County
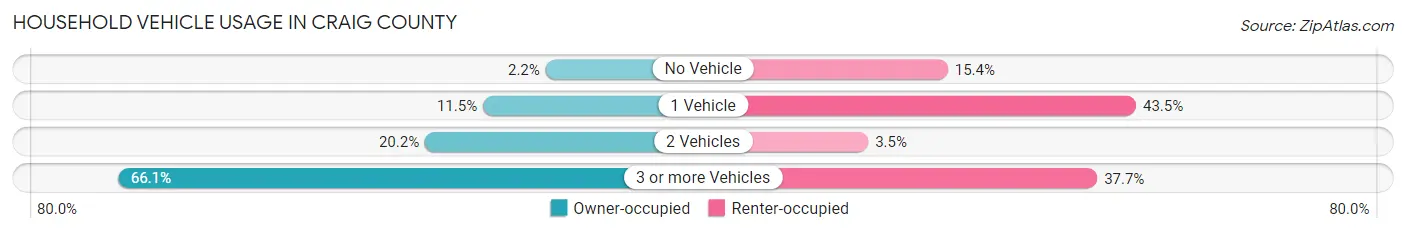
| Vehicles per Household | Owner-occupied | Renter-occupied |
| No Vehicle | 32 (2.2%) | 53 (15.4%) |
| 1 Vehicle | 169 (11.5%) | 150 (43.5%) |
| 2 Vehicles | 296 (20.2%) | 12 (3.5%) |
| 3 or more Vehicles | 968 (66.1%) | 130 (37.7%) |
| Total | 1,465 (100.0%) | 345 (100.0%) |
Real Estate & Mortgages in Craig County
Real Estate and Mortgage Overview in Craig County
| Characteristic | Without Mortgage | With Mortgage |
| Housing Units | 758 | 707 |
| Median Property Value | $164,300 | $218,900 |
| Median Household Income | $61,439 | $164 |
| Monthly Housing Costs | $383 | $12 |
| Real Estate Taxes | $784 | $0 |
Property Value by Mortgage Status in Craig County
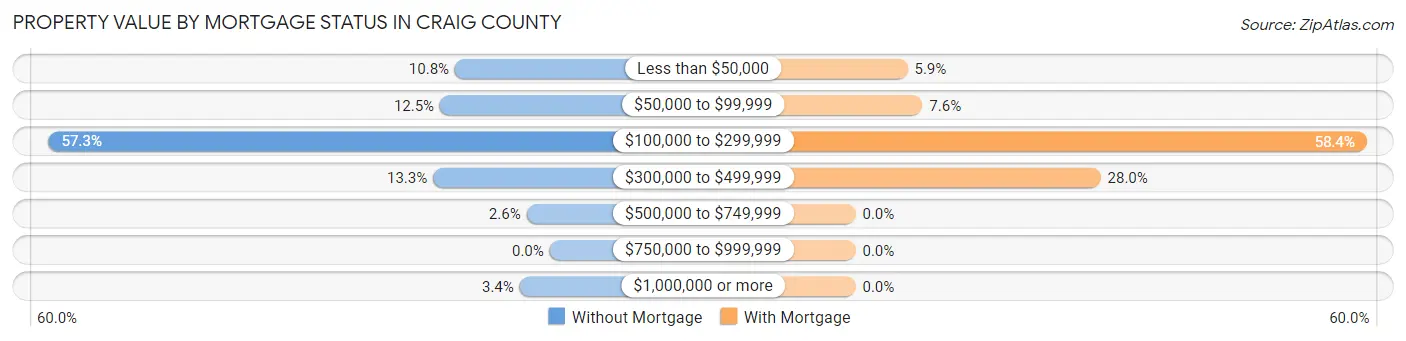
| Property Value | Without Mortgage | With Mortgage |
| Less than $50,000 | 82 (10.8%) | 42 (5.9%) |
| $50,000 to $99,999 | 95 (12.5%) | 54 (7.6%) |
| $100,000 to $299,999 | 434 (57.3%) | 413 (58.4%) |
| $300,000 to $499,999 | 101 (13.3%) | 198 (28.0%) |
| $500,000 to $749,999 | 20 (2.6%) | 0 (0.0%) |
| $750,000 to $999,999 | 0 (0.0%) | 0 (0.0%) |
| $1,000,000 or more | 26 (3.4%) | 0 (0.0%) |
| Total | 758 (100.0%) | 707 (100.0%) |
Household Income by Mortgage Status in Craig County
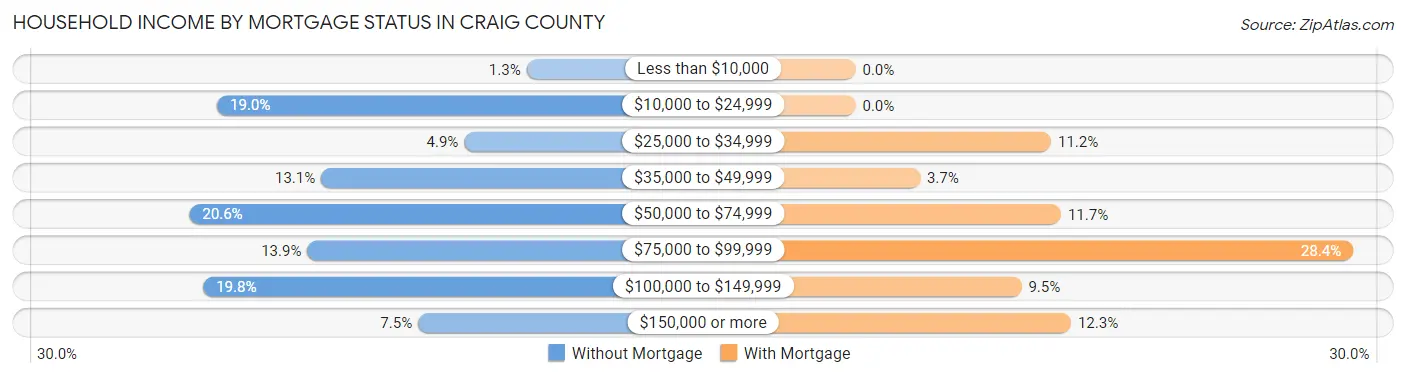
| Household Income | Without Mortgage | With Mortgage |
| Less than $10,000 | 10 (1.3%) | 0 (0.0%) |
| $10,000 to $24,999 | 144 (19.0%) | 0 (0.0%) |
| $25,000 to $34,999 | 37 (4.9%) | 79 (11.2%) |
| $35,000 to $49,999 | 99 (13.1%) | 26 (3.7%) |
| $50,000 to $74,999 | 156 (20.6%) | 83 (11.7%) |
| $75,000 to $99,999 | 105 (13.9%) | 201 (28.4%) |
| $100,000 to $149,999 | 150 (19.8%) | 67 (9.5%) |
| $150,000 or more | 57 (7.5%) | 87 (12.3%) |
| Total | 758 (100.0%) | 707 (100.0%) |
Property Value to Household Income Ratio in Craig County
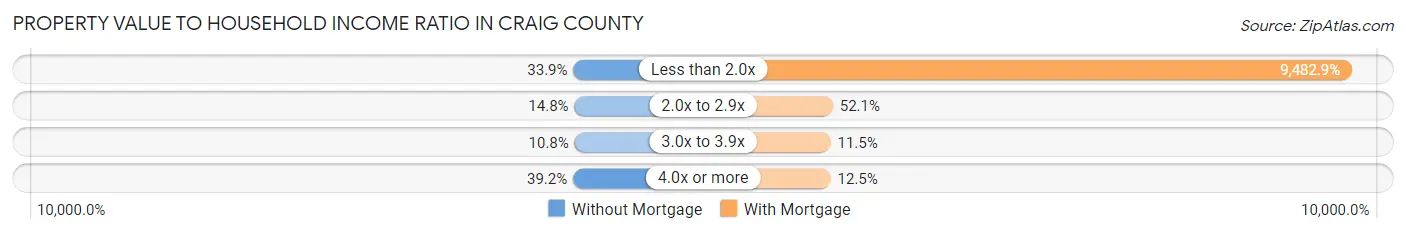
| Value-to-Income Ratio | Without Mortgage | With Mortgage |
| Less than 2.0x | 257 (33.9%) | 67,044 (9,482.9%) |
| 2.0x to 2.9x | 112 (14.8%) | 368 (52.0%) |
| 3.0x to 3.9x | 82 (10.8%) | 81 (11.5%) |
| 4.0x or more | 297 (39.2%) | 88 (12.4%) |
| Total | 758 (100.0%) | 707 (100.0%) |
Real Estate Taxes by Mortgage Status in Craig County
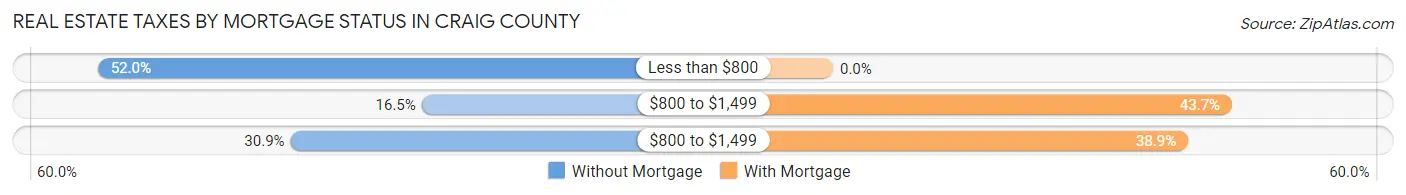
| Property Taxes | Without Mortgage | With Mortgage |
| Less than $800 | 394 (52.0%) | 0 (0.0%) |
| $800 to $1,499 | 125 (16.5%) | 309 (43.7%) |
| $800 to $1,499 | 234 (30.9%) | 275 (38.9%) |
| Total | 758 (100.0%) | 707 (100.0%) |
Health & Disability in Craig County
Health Insurance Coverage by Age in Craig County
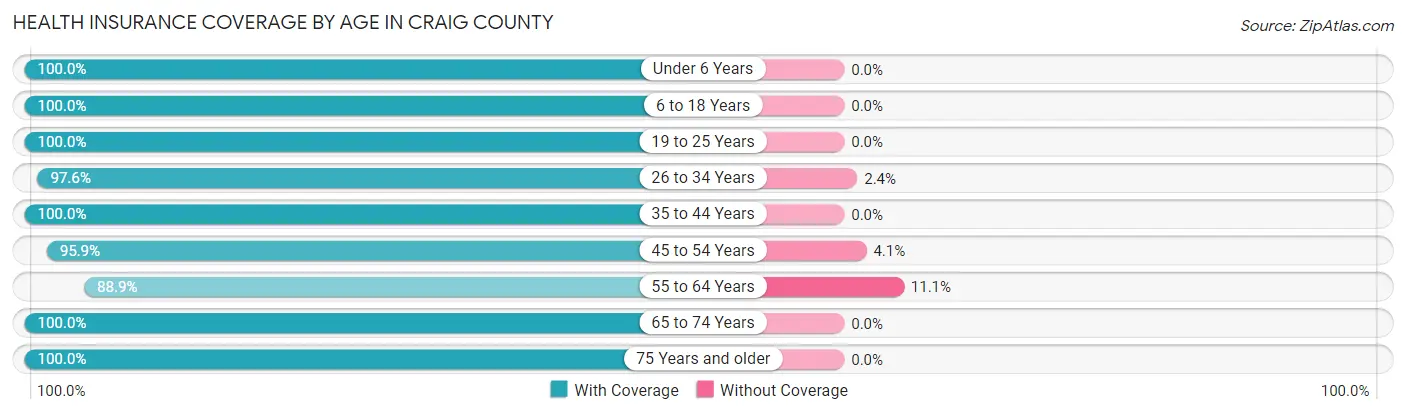
| Age Bracket | With Coverage | Without Coverage |
| Under 6 Years | 439 (100.0%) | 0 (0.0%) |
| 6 to 18 Years | 812 (100.0%) | 0 (0.0%) |
| 19 to 25 Years | 234 (100.0%) | 0 (0.0%) |
| 26 to 34 Years | 484 (97.6%) | 12 (2.4%) |
| 35 to 44 Years | 350 (100.0%) | 0 (0.0%) |
| 45 to 54 Years | 671 (95.9%) | 29 (4.1%) |
| 55 to 64 Years | 800 (88.9%) | 100 (11.1%) |
| 65 to 74 Years | 454 (100.0%) | 0 (0.0%) |
| 75 Years and older | 487 (100.0%) | 0 (0.0%) |
| Total | 4,731 (97.1%) | 141 (2.9%) |
Health Insurance Coverage by Citizenship Status in Craig County
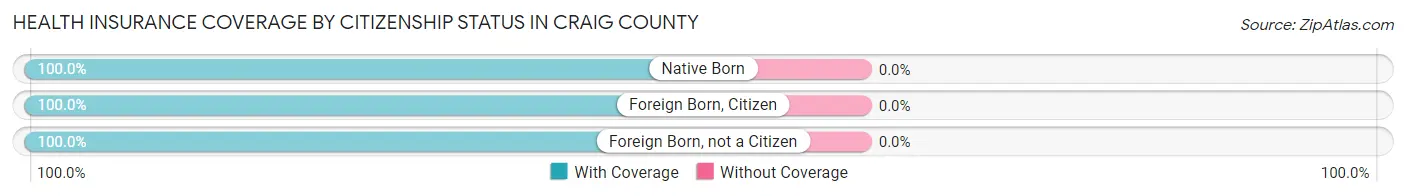
| Citizenship Status | With Coverage | Without Coverage |
| Native Born | 439 (100.0%) | 0 (0.0%) |
| Foreign Born, Citizen | 812 (100.0%) | 0 (0.0%) |
| Foreign Born, not a Citizen | 234 (100.0%) | 0 (0.0%) |
Health Insurance Coverage by Household Income in Craig County
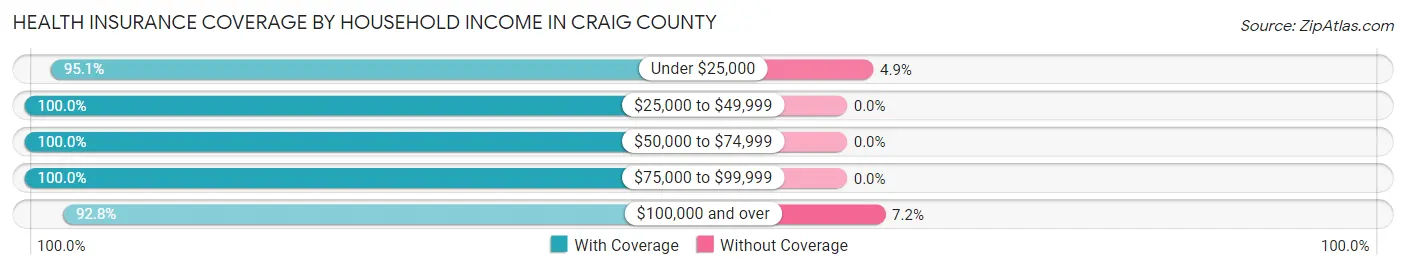
| Household Income | With Coverage | Without Coverage |
| Under $25,000 | 424 (95.1%) | 22 (4.9%) |
| $25,000 to $49,999 | 785 (100.0%) | 0 (0.0%) |
| $50,000 to $74,999 | 1,497 (100.0%) | 0 (0.0%) |
| $75,000 to $99,999 | 485 (100.0%) | 0 (0.0%) |
| $100,000 and over | 1,537 (92.8%) | 119 (7.2%) |
Public vs Private Health Insurance Coverage by Age in Craig County
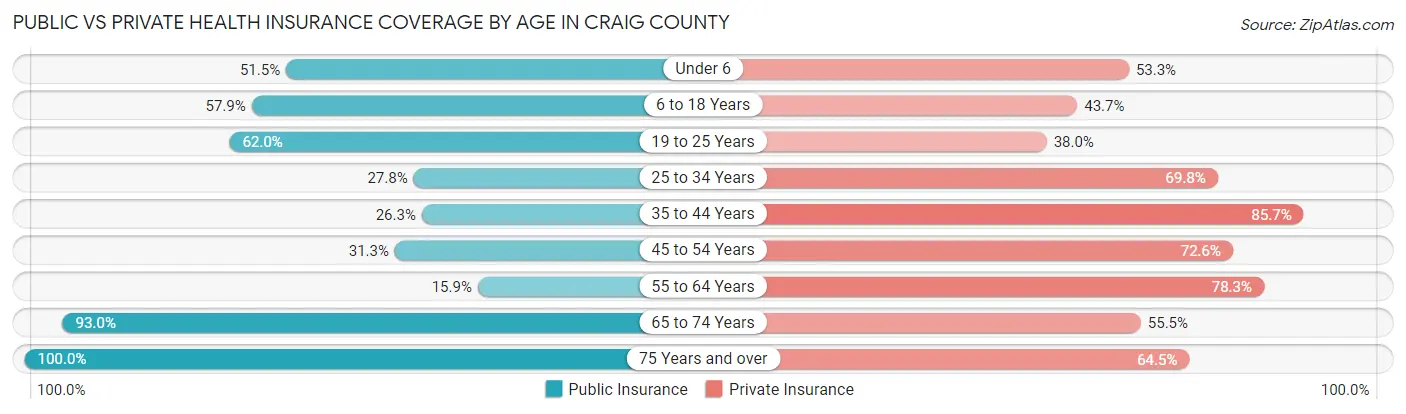
| Age Bracket | Public Insurance | Private Insurance |
| Under 6 | 226 (51.5%) | 234 (53.3%) |
| 6 to 18 Years | 470 (57.9%) | 355 (43.7%) |
| 19 to 25 Years | 145 (62.0%) | 89 (38.0%) |
| 25 to 34 Years | 138 (27.8%) | 346 (69.8%) |
| 35 to 44 Years | 92 (26.3%) | 300 (85.7%) |
| 45 to 54 Years | 219 (31.3%) | 508 (72.6%) |
| 55 to 64 Years | 143 (15.9%) | 705 (78.3%) |
| 65 to 74 Years | 422 (92.9%) | 252 (55.5%) |
| 75 Years and over | 487 (100.0%) | 314 (64.5%) |
| Total | 2,342 (48.1%) | 3,103 (63.7%) |
Disability Status by Sex by Age in Craig County
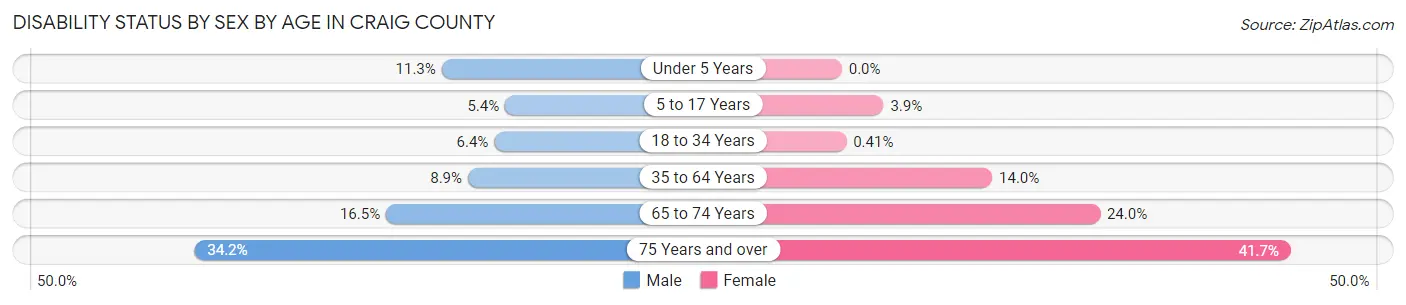
| Age Bracket | Male | Female |
| Under 5 Years | 20 (11.3%) | 0 (0.0%) |
| 5 to 17 Years | 25 (5.4%) | 15 (3.9%) |
| 18 to 34 Years | 17 (6.4%) | 2 (0.4%) |
| 35 to 64 Years | 89 (8.9%) | 132 (14.0%) |
| 65 to 74 Years | 39 (16.5%) | 52 (24.0%) |
| 75 Years and over | 101 (34.2%) | 80 (41.7%) |
Disability Class by Sex by Age in Craig County
Disability Class: Hearing Difficulty
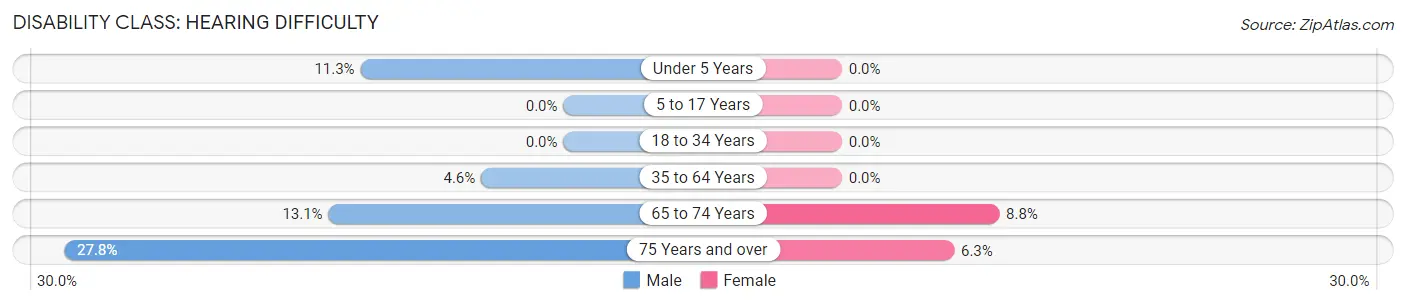
| Age Bracket | Male | Female |
| Under 5 Years | 20 (11.3%) | 0 (0.0%) |
| 5 to 17 Years | 0 (0.0%) | 0 (0.0%) |
| 18 to 34 Years | 0 (0.0%) | 0 (0.0%) |
| 35 to 64 Years | 46 (4.6%) | 0 (0.0%) |
| 65 to 74 Years | 31 (13.1%) | 19 (8.8%) |
| 75 Years and over | 82 (27.8%) | 12 (6.2%) |
Disability Class: Vision Difficulty
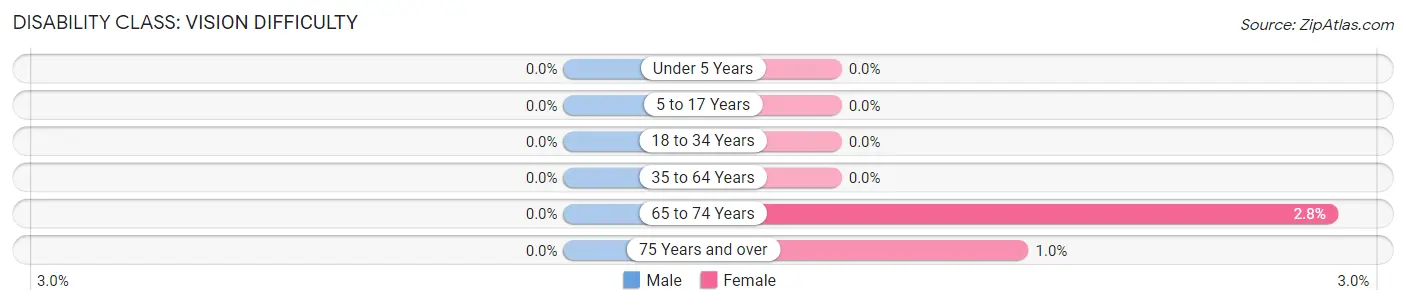
| Age Bracket | Male | Female |
| Under 5 Years | 0 (0.0%) | 0 (0.0%) |
| 5 to 17 Years | 0 (0.0%) | 0 (0.0%) |
| 18 to 34 Years | 0 (0.0%) | 0 (0.0%) |
| 35 to 64 Years | 0 (0.0%) | 0 (0.0%) |
| 65 to 74 Years | 0 (0.0%) | 6 (2.8%) |
| 75 Years and over | 0 (0.0%) | 2 (1.0%) |
Disability Class: Cognitive Difficulty
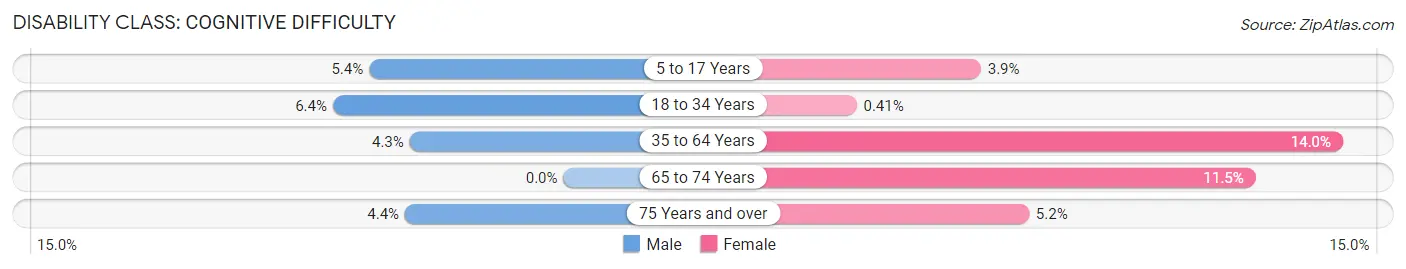
| Age Bracket | Male | Female |
| 5 to 17 Years | 25 (5.4%) | 15 (3.9%) |
| 18 to 34 Years | 17 (6.4%) | 2 (0.4%) |
| 35 to 64 Years | 43 (4.3%) | 132 (14.0%) |
| 65 to 74 Years | 0 (0.0%) | 25 (11.5%) |
| 75 Years and over | 13 (4.4%) | 10 (5.2%) |
Disability Class: Ambulatory Difficulty
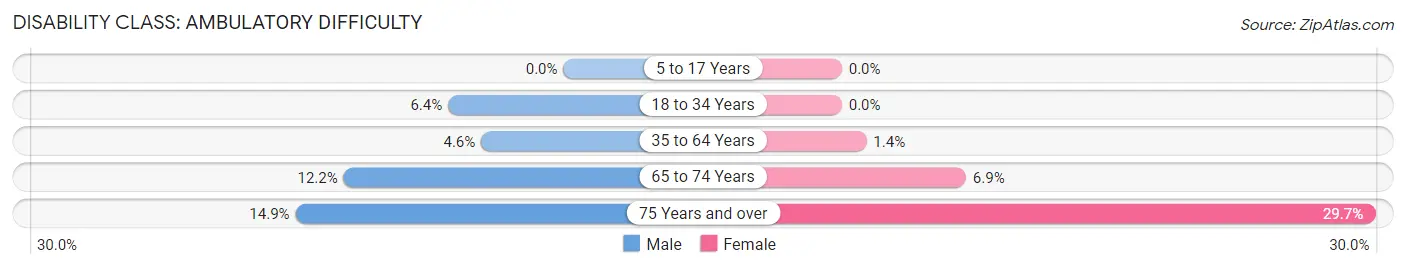
| Age Bracket | Male | Female |
| 5 to 17 Years | 0 (0.0%) | 0 (0.0%) |
| 18 to 34 Years | 17 (6.4%) | 0 (0.0%) |
| 35 to 64 Years | 46 (4.6%) | 13 (1.4%) |
| 65 to 74 Years | 29 (12.2%) | 15 (6.9%) |
| 75 Years and over | 44 (14.9%) | 57 (29.7%) |
Disability Class: Self-Care Difficulty
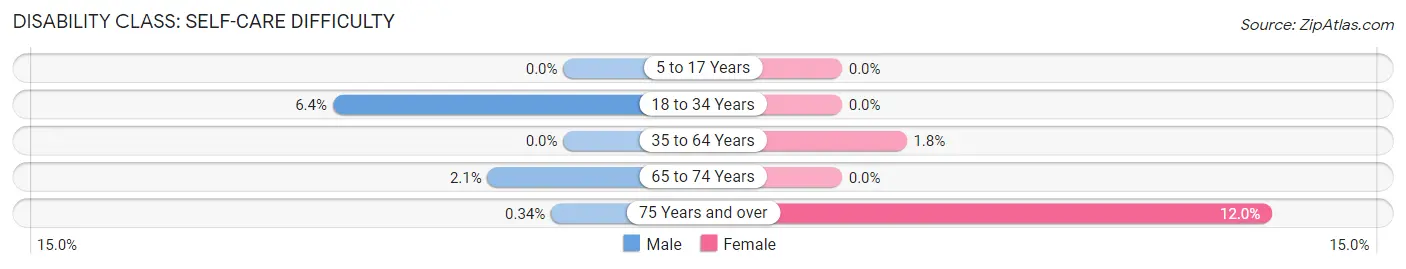
| Age Bracket | Male | Female |
| 5 to 17 Years | 0 (0.0%) | 0 (0.0%) |
| 18 to 34 Years | 17 (6.4%) | 0 (0.0%) |
| 35 to 64 Years | 0 (0.0%) | 17 (1.8%) |
| 65 to 74 Years | 5 (2.1%) | 0 (0.0%) |
| 75 Years and over | 1 (0.3%) | 23 (12.0%) |
Technology Access in Craig County
Computing Device Access in Craig County
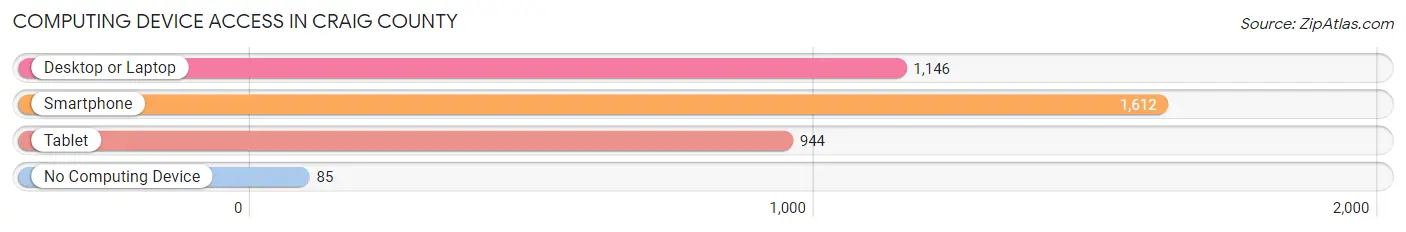
| Device Type | # Households | % Households |
| Desktop or Laptop | 1,146 | 63.3% |
| Smartphone | 1,612 | 89.1% |
| Tablet | 944 | 52.1% |
| No Computing Device | 85 | 4.7% |
| Total | 1,810 | 100.0% |
Internet Access in Craig County
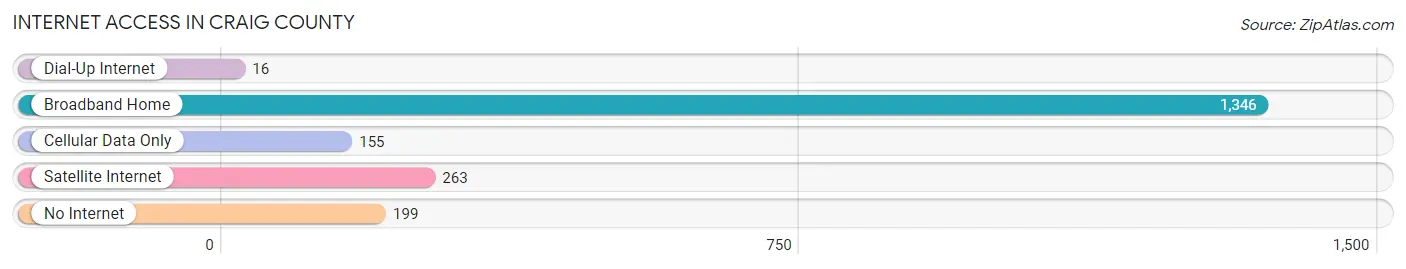
| Internet Type | # Households | % Households |
| Dial-Up Internet | 16 | 0.9% |
| Broadband Home | 1,346 | 74.4% |
| Cellular Data Only | 155 | 8.6% |
| Satellite Internet | 263 | 14.5% |
| No Internet | 199 | 11.0% |
| Total | 1,810 | 100.0% |
Craig County Summary
Introduction
Craig County is a county located in the Commonwealth of Virginia. It is located in the western part of the state, and is part of the Roanoke Metropolitan Statistical Area. The county was established in 1851 and is named after Virginia statesman and Revolutionary War hero, General William Craig. The county seat is New Castle, and the population was 5,190 as of the 2010 census.
History
Craig County was formed in 1851 from parts of Botetourt, Giles, and Monroe counties. It was named for General William Craig, a Revolutionary War hero and Virginia statesman. The county was originally part of the vast holdings of Lord Fairfax, and the first settlers arrived in the 1740s. The county was largely agricultural, with some small-scale industry.
The county was the site of the Battle of New Castle during the Civil War. The battle was fought on May 15, 1864, and resulted in a Confederate victory. The county was also the site of the Battle of Craig Creek, which was fought on October 13, 1864. This battle resulted in a Union victory.
Geography
Craig County is located in the western part of the Commonwealth of Virginia. It is bordered by Botetourt County to the north, Roanoke County to the east, Montgomery County to the south, and Giles County to the west. The county is located in the Blue Ridge Mountains and is part of the Roanoke Valley. The county is home to several mountain peaks, including Craig Mountain, which is the highest point in the county at 3,890 feet.
The county is drained by the New River, which flows through the county from north to south. The county is also home to several creeks, including Craig Creek, which flows through the county from east to west.
Economy
Craig County is largely rural and agricultural. The county is home to several small farms, which produce a variety of crops, including corn, soybeans, hay, and wheat. The county is also home to several small businesses, including a few restaurants, a few retail stores, and a few service businesses.
The county is home to several manufacturing companies, including a furniture manufacturer, a wood products manufacturer, and a plastics manufacturer. The county is also home to several mining operations, including a coal mine and a limestone quarry.
Demographics
As of the 2010 census, the population of Craig County was 5,190. The population is largely white (94.3%), with small percentages of African Americans (2.7%), Hispanics (1.2%), and Asians (0.7%). The median household income is $41,945, and the median family income is $50,938. The per capita income is $20,945.
Conclusion
Craig County is a rural county located in the western part of the Commonwealth of Virginia. The county was established in 1851 and is named after Virginia statesman and Revolutionary War hero, General William Craig. The county is largely agricultural, with some small-scale industry. The population of the county is 5,190, and the median household income is $41,945. The county is home to several small businesses, manufacturing companies, and mining operations.
Common Questions
What is Per Capita Income in Craig County?
Per Capita income in Craig County is $32,020.
What is the Median Family Income in Craig County?
Median Family Income in Craig County is $88,125.
What is the Median Household income in Craig County?
Median Household Income in Craig County is $66,286.
What is Income or Wage Gap in Craig County?
Income or Wage Gap in Craig County is 36.0%.
Women in Craig County earn 64.0 cents for every dollar earned by a man.
What is Inequality or Gini Index in Craig County?
Inequality or Gini Index in Craig County is 0.39.
What is the Total Population of Craig County?
Total Population of Craig County is 4,898.
What is the Total Male Population of Craig County?
Total Male Population of Craig County is 2,446.
What is the Total Female Population of Craig County?
Total Female Population of Craig County is 2,452.
What is the Ratio of Males per 100 Females in Craig County?
There are 99.76 Males per 100 Females in Craig County.
What is the Ratio of Females per 100 Males in Craig County?
There are 100.25 Females per 100 Males in Craig County.
What is the Median Population Age in Craig County?
Median Population Age in Craig County is 46.1 Years.
What is the Average Family Size in Craig County
Average Family Size in Craig County is 2.9 People.
What is the Average Household Size in Craig County
Average Household Size in Craig County is 2.7 People.
How Large is the Labor Force in Craig County?
There are 2,055 People in the Labor Forcein in Craig County.
What is the Percentage of People in the Labor Force in Craig County?
54.0% of People are in the Labor Force in Craig County.
What is the Unemployment Rate in Craig County?
Unemployment Rate in Craig County is 1.9%.