Chesterfield County, VA Map & Demographics
Chesterfield County Overview
$45,041
PER CAPITA INCOME
$113,336
AVG FAMILY INCOME
$95,757
AVG HOUSEHOLD INCOME
22.9%
WAGE / INCOME GAP [ % ]
77.1¢/ $1
WAGE / INCOME GAP [ $ ]
$12,259
FAMILY INCOME DEFICIT
0.42
INEQUALITY / GINI INDEX
366,019
TOTAL POPULATION
177,338
MALE POPULATION
188,681
FEMALE POPULATION
93.99
MALES / 100 FEMALES
106.40
FEMALES / 100 MALES
38.9
MEDIAN AGE
3.2
AVG FAMILY SIZE
2.7
AVG HOUSEHOLD SIZE
197,088
LABOR FORCE [ PEOPLE ]
67.9%
PERCENT IN LABOR FORCE
4.7%
UNEMPLOYMENT RATE
Chesterfield County Area Codes
Income in Chesterfield County
Income Overview in Chesterfield County
Per Capita Income in Chesterfield County is $45,041, while median incomes of families and households are $113,336 and $95,757 respectively.
| Characteristic | Number | Measure |
| Per Capita Income | 366,019 | $45,041 |
| Median Family Income | 97,317 | $113,336 |
| Mean Family Income | 97,317 | $137,671 |
| Median Household Income | 134,144 | $95,757 |
| Mean Household Income | 134,144 | $120,588 |
| Income Deficit | 97,317 | $12,259 |
| Wage / Income Gap (%) | 366,019 | 22.85% |
| Wage / Income Gap ($) | 366,019 | 77.15¢ per $1 |
| Gini / Inequality Index | 366,019 | 0.42 |
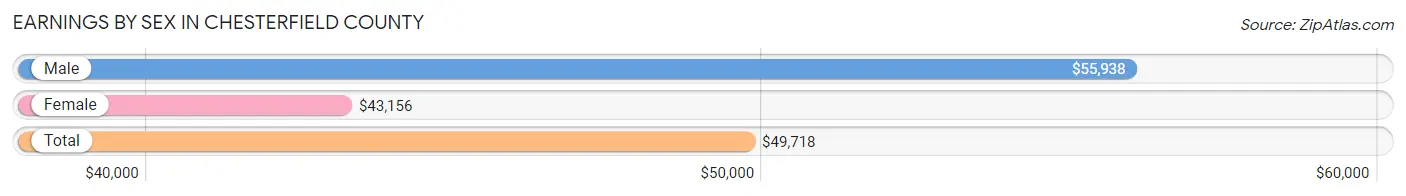
Earnings by Sex in Chesterfield County
Average Earnings in Chesterfield County are $49,718, $55,938 for men and $43,156 for women, a difference of 22.9%.
| Sex | Number | Average Earnings |
| Male | 105,219 (51.8%) | $55,938 |
| Female | 97,836 (48.2%) | $43,156 |
| Total | 203,055 (100.0%) | $49,718 |
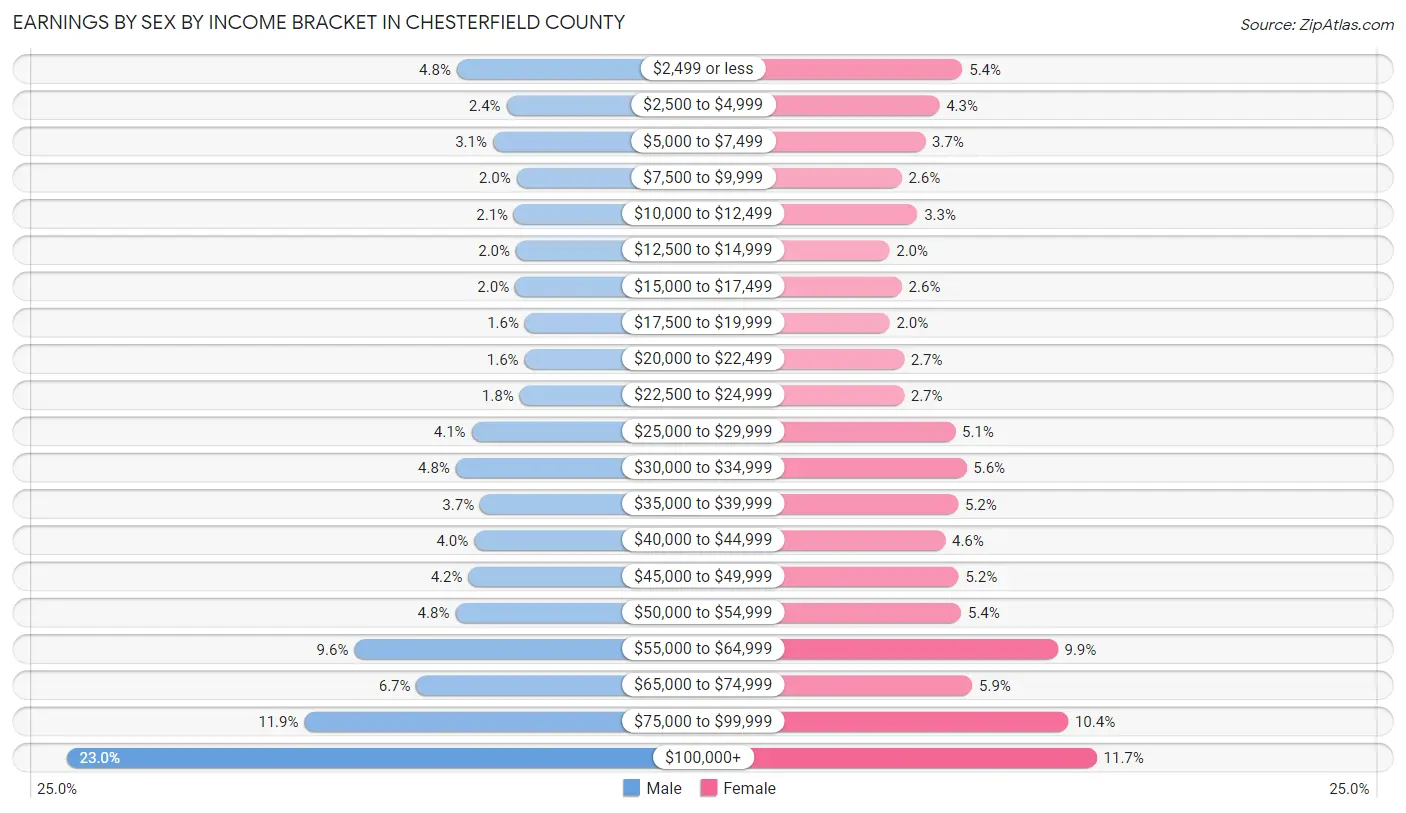
Earnings by Sex by Income Bracket in Chesterfield County
The most common earnings brackets in Chesterfield County are $100,000+ for men (24,235 | 23.0%) and $100,000+ for women (11,447 | 11.7%).
| Income | Male | Female |
| $2,499 or less | 5,007 (4.8%) | 5,291 (5.4%) |
| $2,500 to $4,999 | 2,555 (2.4%) | 4,235 (4.3%) |
| $5,000 to $7,499 | 3,229 (3.1%) | 3,577 (3.7%) |
| $7,500 to $9,999 | 2,058 (2.0%) | 2,508 (2.6%) |
| $10,000 to $12,499 | 2,185 (2.1%) | 3,224 (3.3%) |
| $12,500 to $14,999 | 2,094 (2.0%) | 1,949 (2.0%) |
| $15,000 to $17,499 | 2,141 (2.0%) | 2,510 (2.6%) |
| $17,500 to $19,999 | 1,653 (1.6%) | 1,959 (2.0%) |
| $20,000 to $22,499 | 1,676 (1.6%) | 2,611 (2.7%) |
| $22,500 to $24,999 | 1,920 (1.8%) | 2,608 (2.7%) |
| $25,000 to $29,999 | 4,287 (4.1%) | 4,956 (5.1%) |
| $30,000 to $34,999 | 5,064 (4.8%) | 5,481 (5.6%) |
| $35,000 to $39,999 | 3,857 (3.7%) | 5,093 (5.2%) |
| $40,000 to $44,999 | 4,159 (4.0%) | 4,499 (4.6%) |
| $45,000 to $49,999 | 4,437 (4.2%) | 5,119 (5.2%) |
| $50,000 to $54,999 | 5,082 (4.8%) | 5,234 (5.3%) |
| $55,000 to $64,999 | 10,058 (9.6%) | 9,654 (9.9%) |
| $65,000 to $74,999 | 7,002 (6.7%) | 5,745 (5.9%) |
| $75,000 to $99,999 | 12,520 (11.9%) | 10,136 (10.4%) |
| $100,000+ | 24,235 (23.0%) | 11,447 (11.7%) |
| Total | 105,219 (100.0%) | 97,836 (100.0%) |
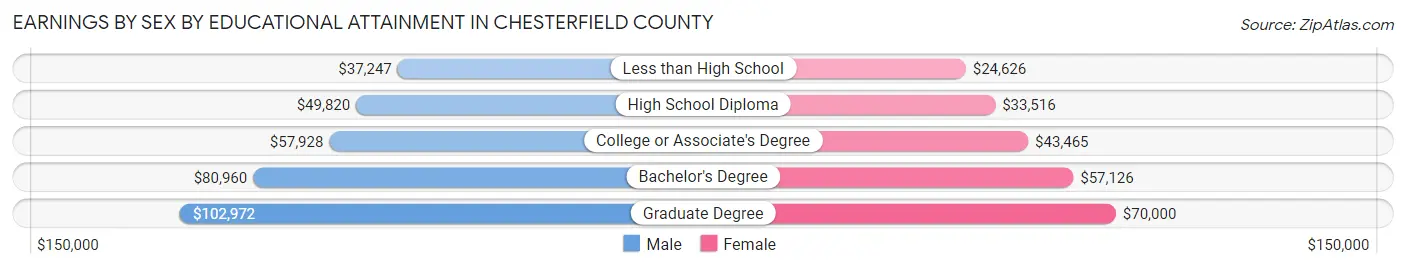
Earnings by Sex by Educational Attainment in Chesterfield County
Average earnings in Chesterfield County are $63,043 for men and $50,410 for women, a difference of 20.0%. Men with an educational attainment of graduate degree enjoy the highest average annual earnings of $102,972, while those with less than high school education earn the least with $37,247. Women with an educational attainment of graduate degree earn the most with the average annual earnings of $70,000, while those with less than high school education have the smallest earnings of $24,626.
| Educational Attainment | Male Income | Female Income |
| Less than High School | $37,247 | $24,626 |
| High School Diploma | $49,820 | $33,516 |
| College or Associate's Degree | $57,928 | $43,465 |
| Bachelor's Degree | $80,960 | $57,126 |
| Graduate Degree | $102,972 | $70,000 |
| Total | $63,043 | $50,410 |
Family Income in Chesterfield County
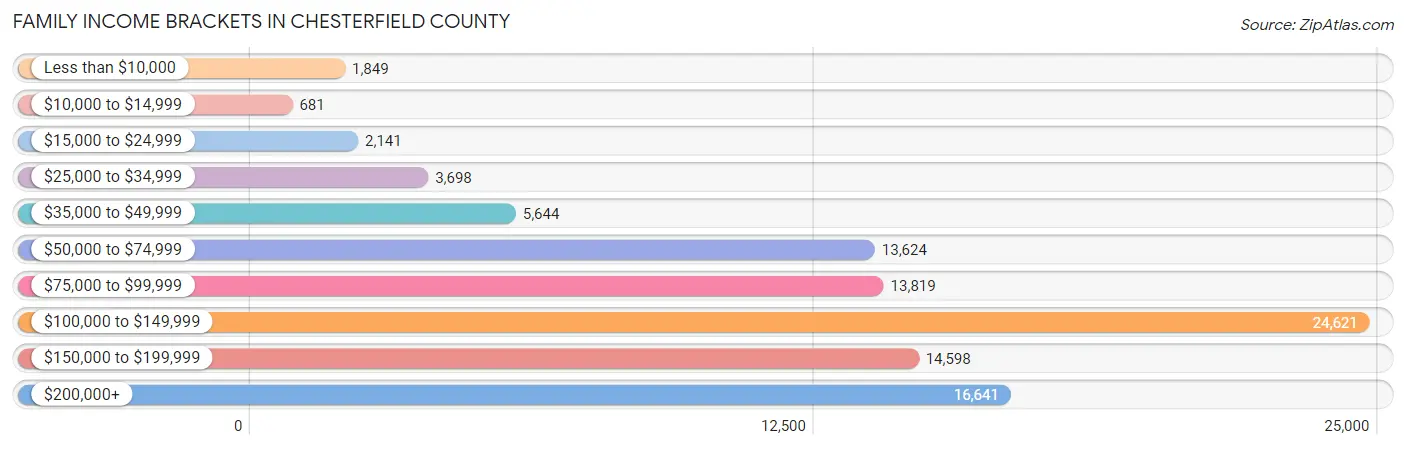
Family Income Brackets in Chesterfield County
According to the Chesterfield County family income data, there are 24,621 families falling into the $100,000 to $149,999 income range, which is the most common income bracket and makes up 25.3% of all families. Conversely, the $10,000 to $14,999 income bracket is the least frequent group with only 681 families (0.7%) belonging to this category.
| Income Bracket | # Families | % Families |
| Less than $10,000 | 1,849 | 1.9% |
| $10,000 to $14,999 | 681 | 0.7% |
| $15,000 to $24,999 | 2,141 | 2.2% |
| $25,000 to $34,999 | 3,698 | 3.8% |
| $35,000 to $49,999 | 5,644 | 5.8% |
| $50,000 to $74,999 | 13,624 | 14.0% |
| $75,000 to $99,999 | 13,819 | 14.2% |
| $100,000 to $149,999 | 24,621 | 25.3% |
| $150,000 to $199,999 | 14,598 | 15.0% |
| $200,000+ | 16,641 | 17.1% |
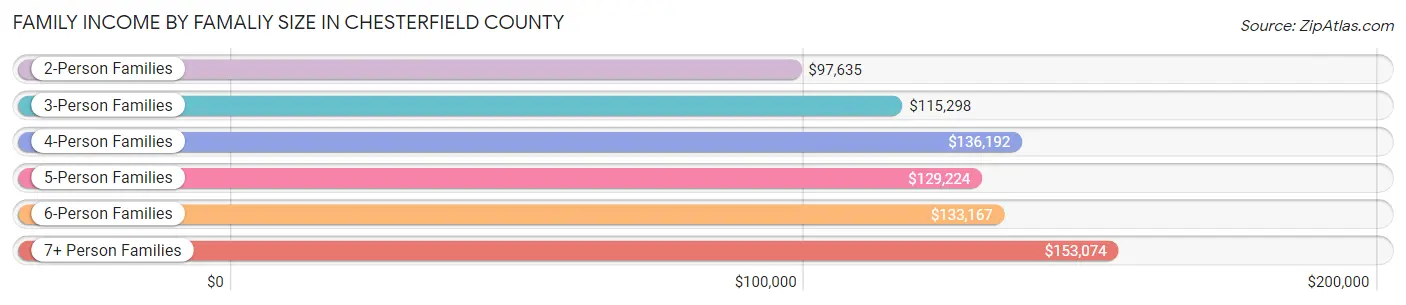
Family Income by Famaliy Size in Chesterfield County
7+ person families (1,345 | 1.4%) account for the highest median family income in Chesterfield County with $153,074 per family, while 2-person families (43,965 | 45.2%) have the highest median income of $48,818 per family member.
| Income Bracket | # Families | Median Income |
| 2-Person Families | 43,965 (45.2%) | $97,635 |
| 3-Person Families | 21,396 (22.0%) | $115,298 |
| 4-Person Families | 18,983 (19.5%) | $136,192 |
| 5-Person Families | 8,572 (8.8%) | $129,224 |
| 6-Person Families | 3,056 (3.1%) | $133,167 |
| 7+ Person Families | 1,345 (1.4%) | $153,074 |
| Total | 97,317 (100.0%) | $113,336 |
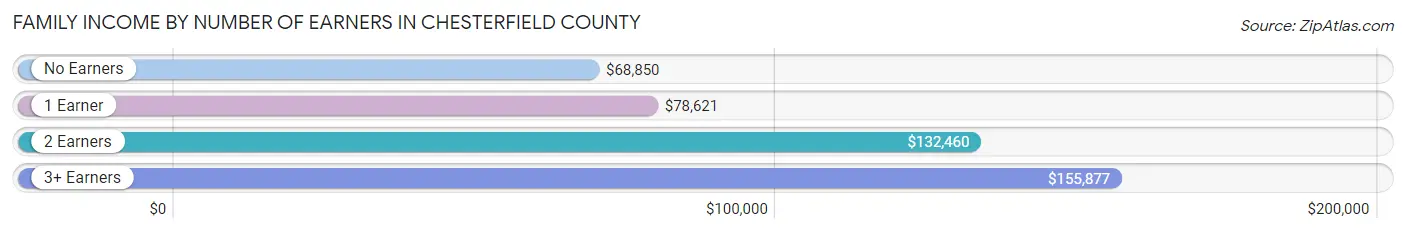
Family Income by Number of Earners in Chesterfield County
The median family income in Chesterfield County is $113,336, with families comprising 3+ earners (13,062) having the highest median family income of $155,877, while families with no earners (11,923) have the lowest median family income of $68,850, accounting for 13.4% and 12.2% of families, respectively.
| Number of Earners | # Families | Median Income |
| No Earners | 11,923 (12.2%) | $68,850 |
| 1 Earner | 28,666 (29.5%) | $78,621 |
| 2 Earners | 43,666 (44.9%) | $132,460 |
| 3+ Earners | 13,062 (13.4%) | $155,877 |
| Total | 97,317 (100.0%) | $113,336 |
Household Income in Chesterfield County
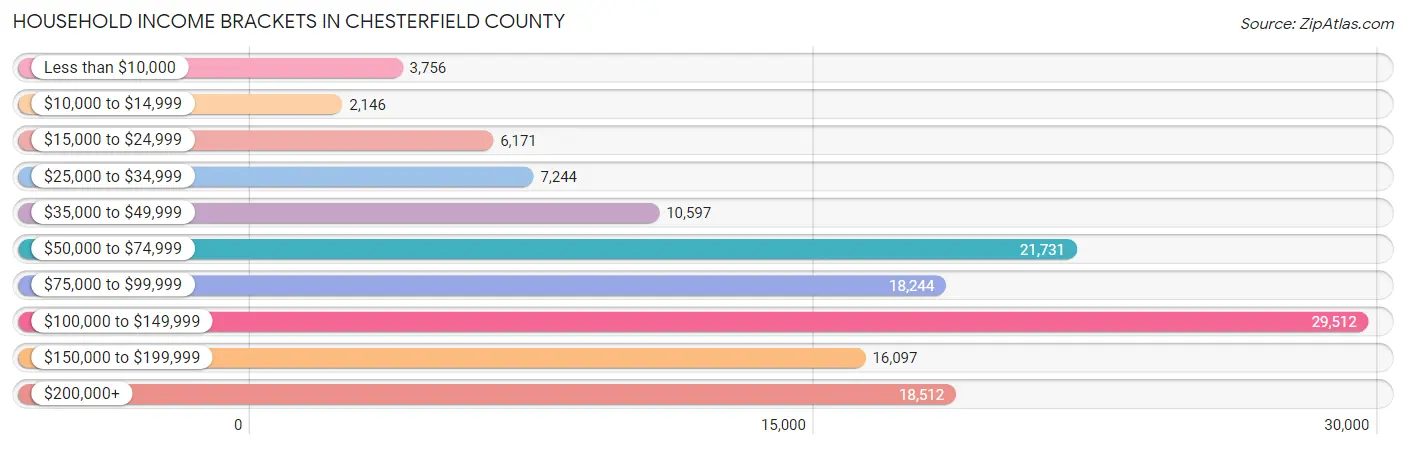
Household Income Brackets in Chesterfield County
With 29,512 households falling in the category, the $100,000 to $149,999 income range is the most frequent in Chesterfield County, accounting for 22.0% of all households. In contrast, only 2,146 households (1.6%) fall into the $10,000 to $14,999 income bracket, making it the least populous group.
| Income Bracket | # Households | % Households |
| Less than $10,000 | 3,756 | 2.8% |
| $10,000 to $14,999 | 2,146 | 1.6% |
| $15,000 to $24,999 | 6,171 | 4.6% |
| $25,000 to $34,999 | 7,244 | 5.4% |
| $35,000 to $49,999 | 10,597 | 7.9% |
| $50,000 to $74,999 | 21,731 | 16.2% |
| $75,000 to $99,999 | 18,244 | 13.6% |
| $100,000 to $149,999 | 29,512 | 22.0% |
| $150,000 to $199,999 | 16,097 | 12.0% |
| $200,000+ | 18,512 | 13.8% |
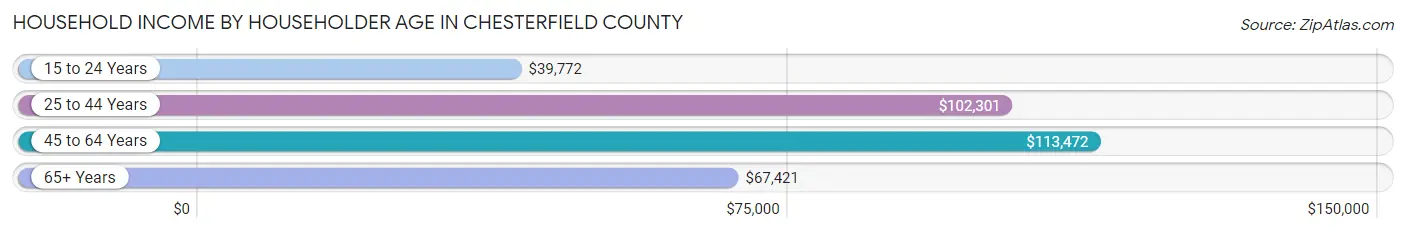
Household Income by Householder Age in Chesterfield County
The median household income in Chesterfield County is $95,757, with the highest median household income of $113,472 found in the 45 to 64 years age bracket for the primary householder. A total of 53,853 households (40.2%) fall into this category. Meanwhile, the 15 to 24 years age bracket for the primary householder has the lowest median household income of $39,772, with 1,797 households (1.3%) in this group.
| Income Bracket | # Households | Median Income |
| 15 to 24 Years | 1,797 (1.3%) | $39,772 |
| 25 to 44 Years | 43,567 (32.5%) | $102,301 |
| 45 to 64 Years | 53,853 (40.2%) | $113,472 |
| 65+ Years | 34,927 (26.0%) | $67,421 |
| Total | 134,144 (100.0%) | $95,757 |
Poverty in Chesterfield County
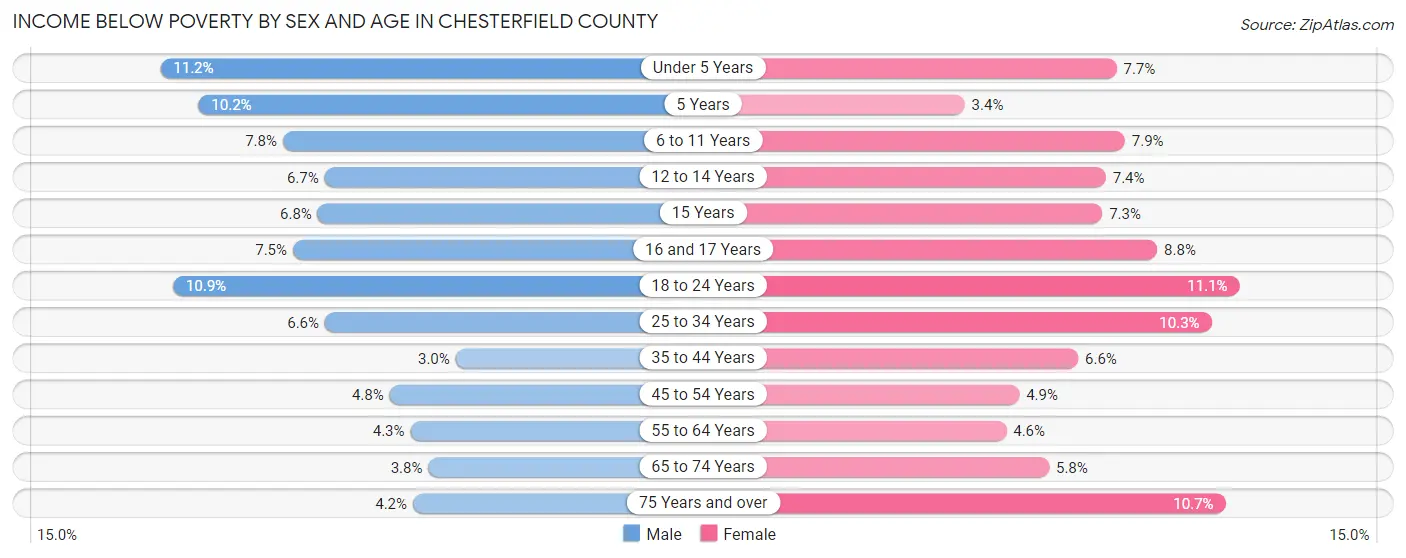
Income Below Poverty by Sex and Age in Chesterfield County
With 6.0% poverty level for males and 7.3% for females among the residents of Chesterfield County, under 5 year old males and 18 to 24 year old females are the most vulnerable to poverty, with 1,232 males (11.2%) and 1,724 females (11.1%) in their respective age groups living below the poverty level.
| Age Bracket | Male | Female |
| Under 5 Years | 1,232 (11.2%) | 765 (7.6%) |
| 5 Years | 242 (10.2%) | 76 (3.4%) |
| 6 to 11 Years | 1,168 (7.8%) | 1,006 (7.9%) |
| 12 to 14 Years | 478 (6.7%) | 605 (7.3%) |
| 15 Years | 167 (6.8%) | 215 (7.2%) |
| 16 and 17 Years | 425 (7.5%) | 413 (8.8%) |
| 18 to 24 Years | 1,644 (10.9%) | 1,724 (11.1%) |
| 25 to 34 Years | 1,408 (6.6%) | 2,311 (10.3%) |
| 35 to 44 Years | 723 (3.0%) | 1,698 (6.6%) |
| 45 to 54 Years | 1,146 (4.8%) | 1,233 (4.9%) |
| 55 to 64 Years | 959 (4.3%) | 1,141 (4.6%) |
| 65 to 74 Years | 613 (3.8%) | 1,104 (5.8%) |
| 75 Years and over | 364 (4.2%) | 1,303 (10.7%) |
| Total | 10,569 (6.0%) | 13,594 (7.3%) |
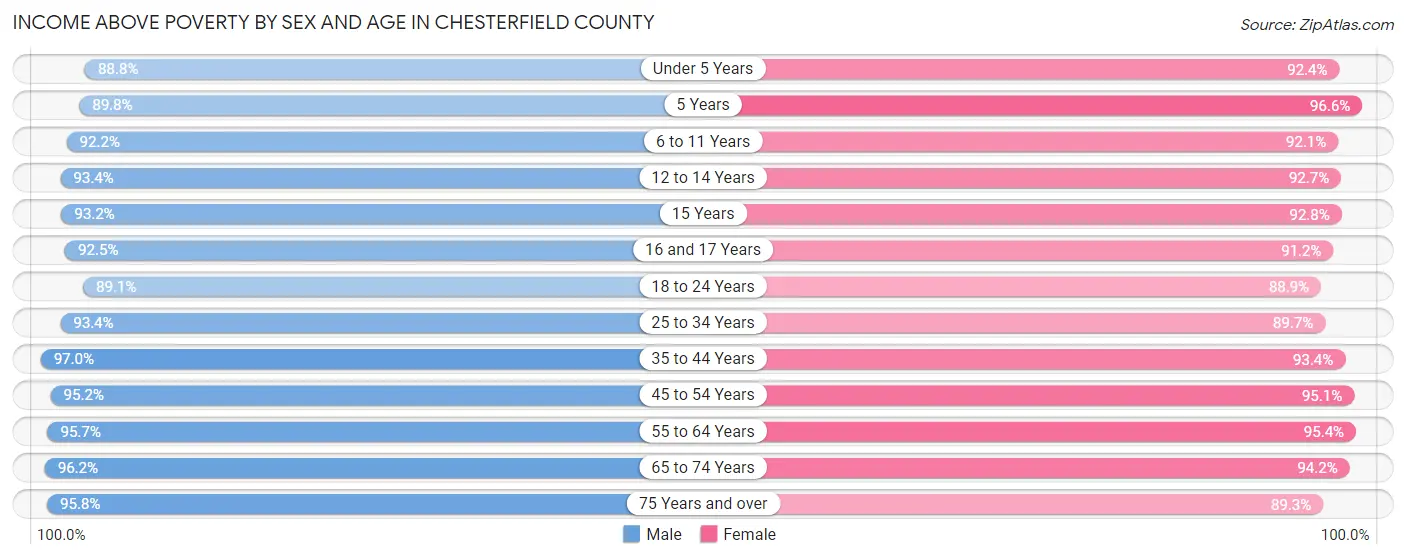
Income Above Poverty by Sex and Age in Chesterfield County
According to the poverty statistics in Chesterfield County, males aged 35 to 44 years and females aged 5 years are the age groups that are most secure financially, with 97.0% of males and 96.6% of females in these age groups living above the poverty line.
| Age Bracket | Male | Female |
| Under 5 Years | 9,751 (88.8%) | 9,232 (92.3%) |
| 5 Years | 2,140 (89.8%) | 2,146 (96.6%) |
| 6 to 11 Years | 13,782 (92.2%) | 11,753 (92.1%) |
| 12 to 14 Years | 6,711 (93.3%) | 7,625 (92.6%) |
| 15 Years | 2,273 (93.2%) | 2,752 (92.7%) |
| 16 and 17 Years | 5,221 (92.5%) | 4,293 (91.2%) |
| 18 to 24 Years | 13,481 (89.1%) | 13,854 (88.9%) |
| 25 to 34 Years | 19,803 (93.4%) | 20,155 (89.7%) |
| 35 to 44 Years | 23,357 (97.0%) | 24,106 (93.4%) |
| 45 to 54 Years | 22,519 (95.2%) | 23,722 (95.1%) |
| 55 to 64 Years | 21,559 (95.7%) | 23,773 (95.4%) |
| 65 to 74 Years | 15,671 (96.2%) | 18,035 (94.2%) |
| 75 Years and over | 8,320 (95.8%) | 10,894 (89.3%) |
| Total | 164,588 (94.0%) | 172,340 (92.7%) |
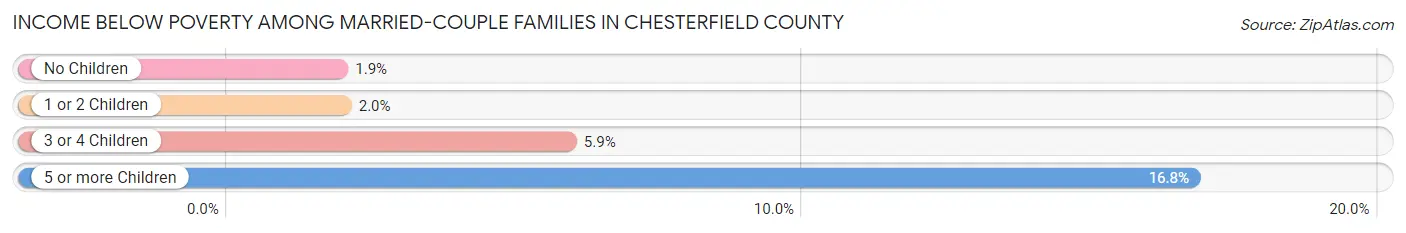
Income Below Poverty Among Married-Couple Families in Chesterfield County
The poverty statistics for married-couple families in Chesterfield County show that 2.3% or 1,751 of the total 74,712 families live below the poverty line. Families with 5 or more children have the highest poverty rate of 16.8%, comprising of 59 families. On the other hand, families with no children have the lowest poverty rate of 1.9%, which includes 798 families.
| Children | Above Poverty | Below Poverty |
| No Children | 40,844 (98.1%) | 798 (1.9%) |
| 1 or 2 Children | 25,889 (98.0%) | 522 (2.0%) |
| 3 or 4 Children | 5,935 (94.1%) | 372 (5.9%) |
| 5 or more Children | 293 (83.2%) | 59 (16.8%) |
| Total | 72,961 (97.7%) | 1,751 (2.3%) |
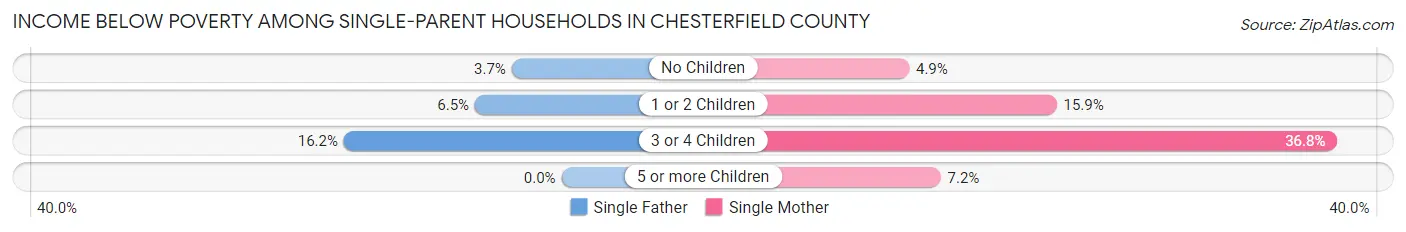
Income Below Poverty Among Single-Parent Households in Chesterfield County
According to the poverty data in Chesterfield County, 6.4% or 378 single-father households and 13.3% or 2,213 single-mother households are living below the poverty line. Among single-father households, those with 3 or 4 children have the highest poverty rate, with 96 households (16.2%) experiencing poverty. Likewise, among single-mother households, those with 3 or 4 children have the highest poverty rate, with 485 households (36.8%) falling below the poverty line.
| Children | Single Father | Single Mother |
| No Children | 86 (3.7%) | 308 (4.9%) |
| 1 or 2 Children | 196 (6.5%) | 1,413 (15.9%) |
| 3 or 4 Children | 96 (16.2%) | 485 (36.8%) |
| 5 or more Children | 0 (0.0%) | 7 (7.2%) |
| Total | 378 (6.4%) | 2,213 (13.3%) |
Income Below Poverty Among Married-Couple vs Single-Parent Households in Chesterfield County
The poverty data for Chesterfield County shows that 1,751 of the married-couple family households (2.3%) and 2,591 of the single-parent households (11.5%) are living below the poverty level. Within the married-couple family households, those with 5 or more children have the highest poverty rate, with 59 households (16.8%) falling below the poverty line. Among the single-parent households, those with 3 or 4 children have the highest poverty rate, with 581 household (30.4%) living below poverty.
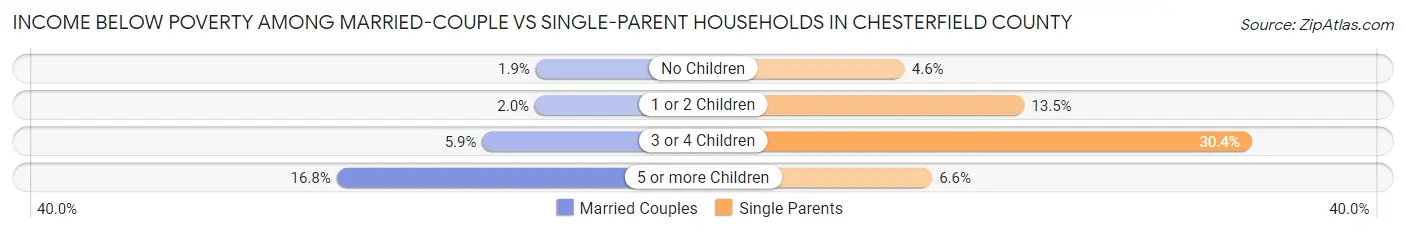
| Children | Married-Couple Families | Single-Parent Households |
| No Children | 798 (1.9%) | 394 (4.6%) |
| 1 or 2 Children | 522 (2.0%) | 1,609 (13.5%) |
| 3 or 4 Children | 372 (5.9%) | 581 (30.4%) |
| 5 or more Children | 59 (16.8%) | 7 (6.6%) |
| Total | 1,751 (2.3%) | 2,591 (11.5%) |
Race in Chesterfield County
The most populous races in Chesterfield County are White / Caucasian (226,434 | 61.9%), Black / African American (86,495 | 23.6%), and Hispanic or Latino (36,094 | 9.9%).
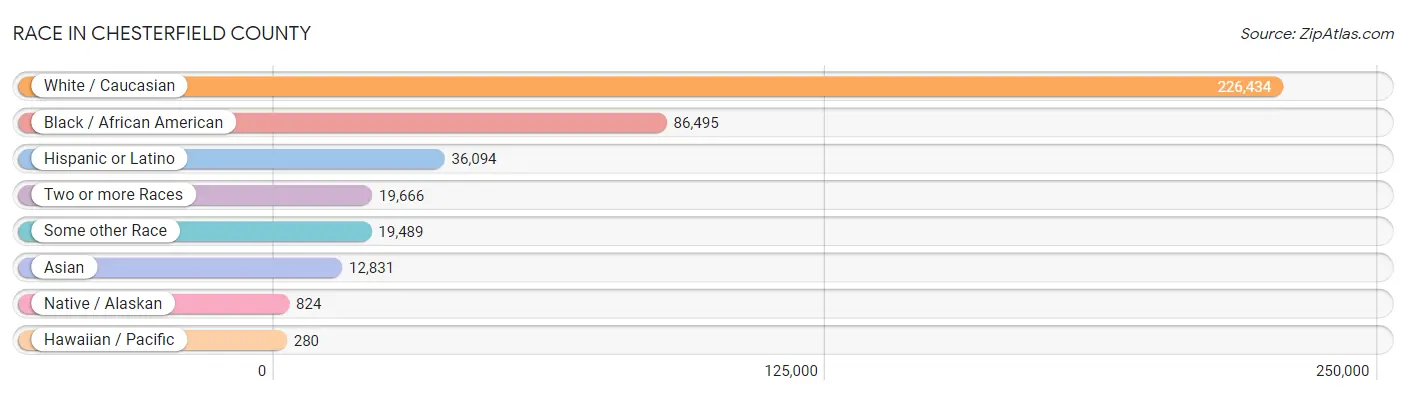
| Race | # Population | % Population |
| Asian | 12,831 | 3.5% |
| Black / African American | 86,495 | 23.6% |
| Hawaiian / Pacific | 280 | 0.1% |
| Hispanic or Latino | 36,094 | 9.9% |
| Native / Alaskan | 824 | 0.2% |
| White / Caucasian | 226,434 | 61.9% |
| Two or more Races | 19,666 | 5.4% |
| Some other Race | 19,489 | 5.3% |
| Total | 366,019 | 100.0% |
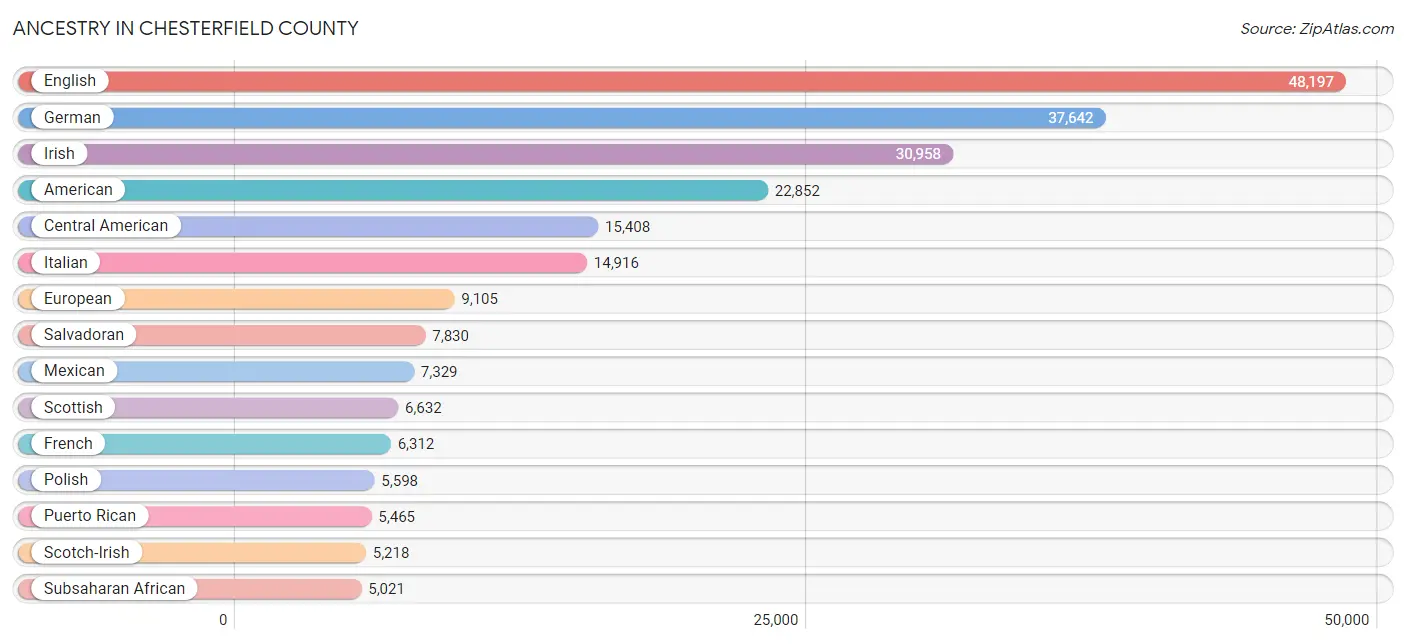
Ancestry in Chesterfield County
The most populous ancestries reported in Chesterfield County are English (48,197 | 13.2%), German (37,642 | 10.3%), Irish (30,958 | 8.5%), American (22,852 | 6.2%), and Central American (15,408 | 4.2%), together accounting for 42.4% of all Chesterfield County residents.
| Ancestry | # Population | % Population |
| Afghan | 320 | 0.1% |
| African | 3,292 | 0.9% |
| Alaska Native | 3 | 0.0% |
| Aleut | 1 | 0.0% |
| Alsatian | 25 | 0.0% |
| American | 22,852 | 6.2% |
| Apache | 121 | 0.0% |
| Arab | 2,398 | 0.7% |
| Argentinean | 89 | 0.0% |
| Armenian | 231 | 0.1% |
| Australian | 24 | 0.0% |
| Austrian | 362 | 0.1% |
| Barbadian | 92 | 0.0% |
| Basque | 29 | 0.0% |
| Belgian | 320 | 0.1% |
| Belizean | 123 | 0.0% |
| Bhutanese | 1,018 | 0.3% |
| Blackfeet | 206 | 0.1% |
| Bolivian | 229 | 0.1% |
| Brazilian | 151 | 0.0% |
| British | 2,825 | 0.8% |
| British West Indian | 121 | 0.0% |
| Bulgarian | 16 | 0.0% |
| Burmese | 2,254 | 0.6% |
| Canadian | 741 | 0.2% |
| Cape Verdean | 32 | 0.0% |
| Celtic | 17 | 0.0% |
| Central American | 15,408 | 4.2% |
| Central American Indian | 667 | 0.2% |
| Cherokee | 935 | 0.3% |
| Chilean | 178 | 0.1% |
| Chippewa | 7 | 0.0% |
| Choctaw | 124 | 0.0% |
| Colombian | 1,071 | 0.3% |
| Comanche | 97 | 0.0% |
| Costa Rican | 101 | 0.0% |
| Creek | 1 | 0.0% |
| Croatian | 106 | 0.0% |
| Cuban | 976 | 0.3% |
| Czech | 813 | 0.2% |
| Czechoslovakian | 209 | 0.1% |
| Danish | 617 | 0.2% |
| Delaware | 9 | 0.0% |
| Dominican | 1,096 | 0.3% |
| Dutch | 2,756 | 0.7% |
| Eastern European | 641 | 0.2% |
| Ecuadorian | 348 | 0.1% |
| Egyptian | 274 | 0.1% |
| English | 48,197 | 13.2% |
| Estonian | 26 | 0.0% |
| Ethiopian | 80 | 0.0% |
| European | 9,105 | 2.5% |
| Filipino | 167 | 0.1% |
| Finnish | 120 | 0.0% |
| French | 6,312 | 1.7% |
| French American Indian | 11 | 0.0% |
| French Canadian | 1,323 | 0.4% |
| German | 37,642 | 10.3% |
| Ghanaian | 60 | 0.0% |
| Greek | 1,022 | 0.3% |
| Guamanian / Chamorro | 260 | 0.1% |
| Guatemalan | 4,145 | 1.1% |
| Guyanese | 68 | 0.0% |
| Haitian | 179 | 0.1% |
| Honduran | 2,235 | 0.6% |
| Hungarian | 1,154 | 0.3% |
| Icelander | 370 | 0.1% |
| Indian (Asian) | 2,210 | 0.6% |
| Indonesian | 45 | 0.0% |
| Inupiat | 19 | 0.0% |
| Iranian | 111 | 0.0% |
| Iraqi | 11 | 0.0% |
| Irish | 30,958 | 8.5% |
| Iroquois | 18 | 0.0% |
| Israeli | 150 | 0.0% |
| Italian | 14,916 | 4.1% |
| Jamaican | 1,315 | 0.4% |
| Japanese | 818 | 0.2% |
| Jordanian | 93 | 0.0% |
| Kenyan | 20 | 0.0% |
| Korean | 3,403 | 0.9% |
| Latvian | 107 | 0.0% |
| Lebanese | 810 | 0.2% |
| Liberian | 23 | 0.0% |
| Lithuanian | 509 | 0.1% |
| Lumbee | 27 | 0.0% |
| Luxembourger | 33 | 0.0% |
| Malaysian | 61 | 0.0% |
| Mexican | 7,329 | 2.0% |
| Mexican American Indian | 31 | 0.0% |
| Moroccan | 73 | 0.0% |
| Native Hawaiian | 208 | 0.1% |
| Navajo | 49 | 0.0% |
| Nicaraguan | 151 | 0.0% |
| Nigerian | 518 | 0.1% |
| Northern European | 207 | 0.1% |
| Norwegian | 1,972 | 0.5% |
| Osage | 41 | 0.0% |
| Pakistani | 423 | 0.1% |
| Palestinian | 69 | 0.0% |
| Panamanian | 666 | 0.2% |
| Paraguayan | 152 | 0.0% |
| Pennsylvania German | 56 | 0.0% |
| Peruvian | 471 | 0.1% |
| Polish | 5,598 | 1.5% |
| Portuguese | 1,014 | 0.3% |
| Puerto Rican | 5,465 | 1.5% |
| Romanian | 310 | 0.1% |
| Russian | 1,110 | 0.3% |
| Salvadoran | 7,830 | 2.1% |
| Samoan | 27 | 0.0% |
| Scandinavian | 834 | 0.2% |
| Scotch-Irish | 5,218 | 1.4% |
| Scottish | 6,632 | 1.8% |
| Seminole | 4 | 0.0% |
| Senegalese | 55 | 0.0% |
| Serbian | 58 | 0.0% |
| Sierra Leonean | 174 | 0.1% |
| Sioux | 1 | 0.0% |
| Slavic | 153 | 0.0% |
| Slovak | 687 | 0.2% |
| Slovene | 92 | 0.0% |
| South African | 85 | 0.0% |
| South American | 3,414 | 0.9% |
| South American Indian | 17 | 0.0% |
| Spaniard | 544 | 0.2% |
| Spanish | 372 | 0.1% |
| Spanish American | 25 | 0.0% |
| Sri Lankan | 1,488 | 0.4% |
| Subsaharan African | 5,021 | 1.4% |
| Sudanese | 78 | 0.0% |
| Swedish | 2,444 | 0.7% |
| Swiss | 598 | 0.2% |
| Syrian | 24 | 0.0% |
| Thai | 3,123 | 0.9% |
| Trinidadian and Tobagonian | 100 | 0.0% |
| Turkish | 136 | 0.0% |
| U.S. Virgin Islander | 134 | 0.0% |
| Ugandan | 45 | 0.0% |
| Ukrainian | 734 | 0.2% |
| Uruguayan | 54 | 0.0% |
| Venezuelan | 794 | 0.2% |
| Vietnamese | 53 | 0.0% |
| Welsh | 2,829 | 0.8% |
| West Indian | 357 | 0.1% |
| Yugoslavian | 175 | 0.1% | View All 146 Rows |
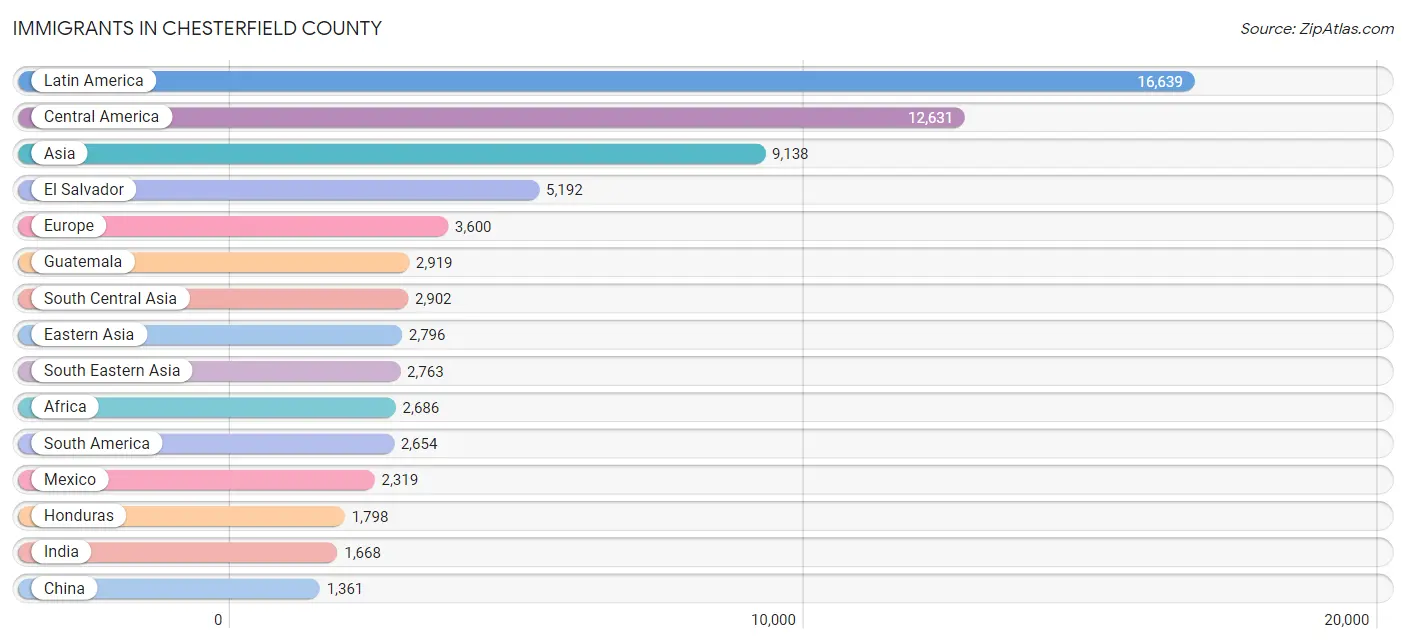
Immigrants in Chesterfield County
The most numerous immigrant groups reported in Chesterfield County came from Latin America (16,639 | 4.5%), Central America (12,631 | 3.5%), Asia (9,138 | 2.5%), El Salvador (5,192 | 1.4%), and Europe (3,600 | 1.0%), together accounting for 12.9% of all Chesterfield County residents.
| Immigration Origin | # Population | % Population |
| Afghanistan | 232 | 0.1% |
| Africa | 2,686 | 0.7% |
| Argentina | 52 | 0.0% |
| Armenia | 5 | 0.0% |
| Asia | 9,138 | 2.5% |
| Australia | 53 | 0.0% |
| Austria | 8 | 0.0% |
| Bahamas | 19 | 0.0% |
| Bangladesh | 103 | 0.0% |
| Barbados | 39 | 0.0% |
| Belarus | 33 | 0.0% |
| Belgium | 106 | 0.0% |
| Belize | 164 | 0.0% |
| Bolivia | 132 | 0.0% |
| Bosnia and Herzegovina | 40 | 0.0% |
| Brazil | 147 | 0.0% |
| Bulgaria | 4 | 0.0% |
| Cabo Verde | 19 | 0.0% |
| Cambodia | 278 | 0.1% |
| Cameroon | 288 | 0.1% |
| Canada | 378 | 0.1% |
| Caribbean | 1,354 | 0.4% |
| Central America | 12,631 | 3.5% |
| Chile | 128 | 0.0% |
| China | 1,361 | 0.4% |
| Colombia | 726 | 0.2% |
| Congo | 21 | 0.0% |
| Costa Rica | 61 | 0.0% |
| Croatia | 15 | 0.0% |
| Cuba | 208 | 0.1% |
| Czechoslovakia | 65 | 0.0% |
| Denmark | 11 | 0.0% |
| Dominican Republic | 239 | 0.1% |
| Eastern Africa | 435 | 0.1% |
| Eastern Asia | 2,796 | 0.8% |
| Eastern Europe | 886 | 0.2% |
| Ecuador | 161 | 0.0% |
| Egypt | 174 | 0.1% |
| El Salvador | 5,192 | 1.4% |
| England | 438 | 0.1% |
| Ethiopia | 91 | 0.0% |
| Europe | 3,600 | 1.0% |
| France | 249 | 0.1% |
| Germany | 728 | 0.2% |
| Ghana | 126 | 0.0% |
| Greece | 26 | 0.0% |
| Guatemala | 2,919 | 0.8% |
| Guyana | 132 | 0.0% |
| Haiti | 193 | 0.1% |
| Honduras | 1,798 | 0.5% |
| Hong Kong | 77 | 0.0% |
| Hungary | 68 | 0.0% |
| India | 1,668 | 0.5% |
| Iran | 36 | 0.0% |
| Iraq | 51 | 0.0% |
| Ireland | 84 | 0.0% |
| Israel | 51 | 0.0% |
| Italy | 230 | 0.1% |
| Jamaica | 364 | 0.1% |
| Japan | 184 | 0.1% |
| Jordan | 151 | 0.0% |
| Kazakhstan | 35 | 0.0% |
| Kenya | 132 | 0.0% |
| Korea | 1,251 | 0.3% |
| Kuwait | 21 | 0.0% |
| Laos | 30 | 0.0% |
| Latin America | 16,639 | 4.5% |
| Lebanon | 178 | 0.1% |
| Liberia | 33 | 0.0% |
| Malaysia | 15 | 0.0% |
| Mexico | 2,319 | 0.6% |
| Middle Africa | 309 | 0.1% |
| Moldova | 12 | 0.0% |
| Morocco | 120 | 0.0% |
| Nepal | 12 | 0.0% |
| Netherlands | 67 | 0.0% |
| Nicaragua | 76 | 0.0% |
| Nigeria | 588 | 0.2% |
| Northern Africa | 607 | 0.2% |
| Northern Europe | 1,074 | 0.3% |
| Oceania | 61 | 0.0% |
| Pakistan | 793 | 0.2% |
| Panama | 102 | 0.0% |
| Peru | 358 | 0.1% |
| Philippines | 1,202 | 0.3% |
| Poland | 128 | 0.0% |
| Portugal | 62 | 0.0% |
| Romania | 203 | 0.1% |
| Russia | 199 | 0.1% |
| Scotland | 43 | 0.0% |
| Serbia | 39 | 0.0% |
| Sierra Leone | 100 | 0.0% |
| Singapore | 69 | 0.0% |
| South Africa | 13 | 0.0% |
| South America | 2,654 | 0.7% |
| South Central Asia | 2,902 | 0.8% |
| South Eastern Asia | 2,763 | 0.7% |
| Southern Europe | 465 | 0.1% |
| Spain | 147 | 0.0% |
| St. Vincent and the Grenadines | 90 | 0.0% |
| Sudan | 15 | 0.0% |
| Sweden | 79 | 0.0% |
| Switzerland | 17 | 0.0% |
| Syria | 15 | 0.0% |
| Taiwan | 210 | 0.1% |
| Thailand | 324 | 0.1% |
| Trinidad and Tobago | 140 | 0.0% |
| Turkey | 29 | 0.0% |
| Uganda | 51 | 0.0% |
| Ukraine | 32 | 0.0% |
| Uzbekistan | 23 | 0.0% |
| Venezuela | 712 | 0.2% |
| Vietnam | 809 | 0.2% |
| Western Africa | 1,242 | 0.3% |
| Western Asia | 666 | 0.2% |
| Western Europe | 1,175 | 0.3% |
| Yemen | 138 | 0.0% |
| Zimbabwe | 13 | 0.0% | View All 118 Rows |
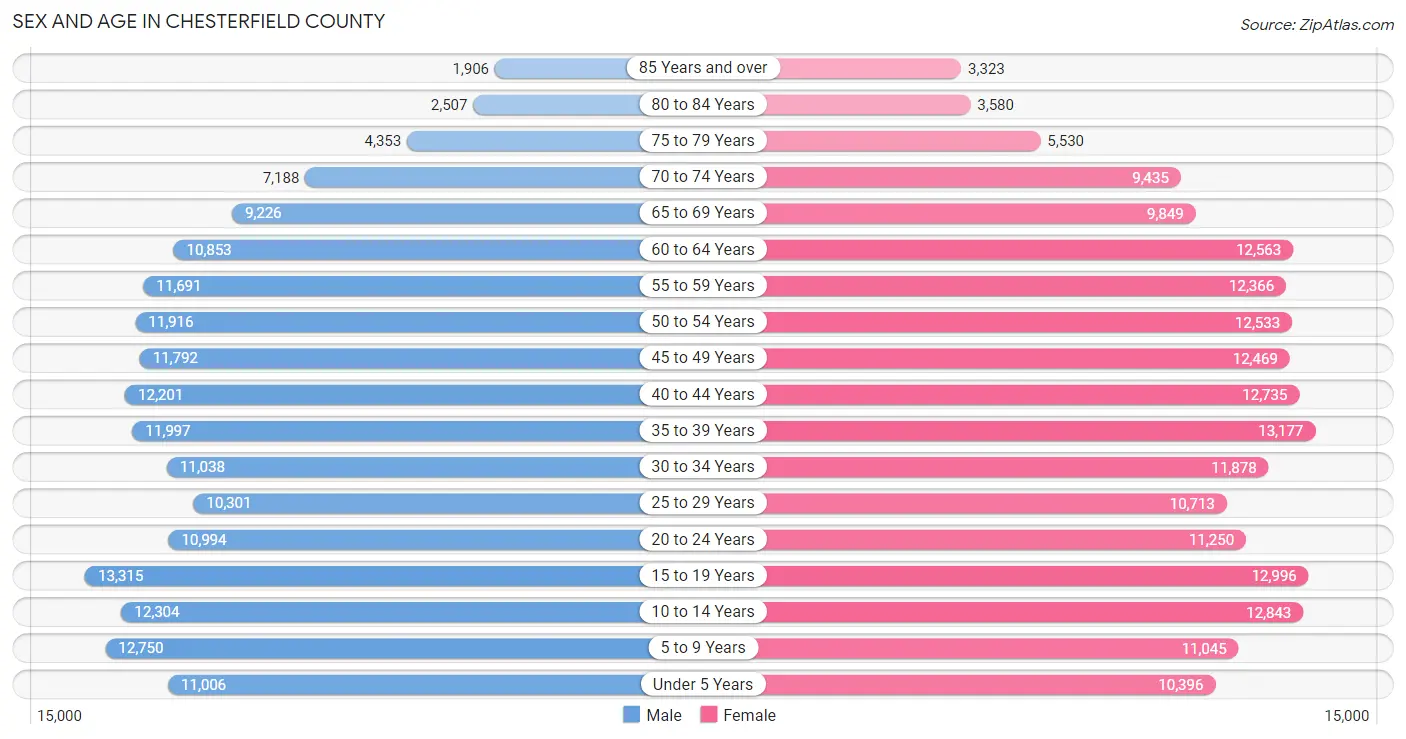
Sex and Age in Chesterfield County
Sex and Age in Chesterfield County
The most populous age groups in Chesterfield County are 15 to 19 Years (13,315 | 7.5%) for men and 35 to 39 Years (13,177 | 7.0%) for women.
| Age Bracket | Male | Female |
| Under 5 Years | 11,006 (6.2%) | 10,396 (5.5%) |
| 5 to 9 Years | 12,750 (7.2%) | 11,045 (5.9%) |
| 10 to 14 Years | 12,304 (6.9%) | 12,843 (6.8%) |
| 15 to 19 Years | 13,315 (7.5%) | 12,996 (6.9%) |
| 20 to 24 Years | 10,994 (6.2%) | 11,250 (6.0%) |
| 25 to 29 Years | 10,301 (5.8%) | 10,713 (5.7%) |
| 30 to 34 Years | 11,038 (6.2%) | 11,878 (6.3%) |
| 35 to 39 Years | 11,997 (6.8%) | 13,177 (7.0%) |
| 40 to 44 Years | 12,201 (6.9%) | 12,735 (6.8%) |
| 45 to 49 Years | 11,792 (6.7%) | 12,469 (6.6%) |
| 50 to 54 Years | 11,916 (6.7%) | 12,533 (6.6%) |
| 55 to 59 Years | 11,691 (6.6%) | 12,366 (6.6%) |
| 60 to 64 Years | 10,853 (6.1%) | 12,563 (6.7%) |
| 65 to 69 Years | 9,226 (5.2%) | 9,849 (5.2%) |
| 70 to 74 Years | 7,188 (4.1%) | 9,435 (5.0%) |
| 75 to 79 Years | 4,353 (2.5%) | 5,530 (2.9%) |
| 80 to 84 Years | 2,507 (1.4%) | 3,580 (1.9%) |
| 85 Years and over | 1,906 (1.1%) | 3,323 (1.8%) |
| Total | 177,338 (100.0%) | 188,681 (100.0%) |
Families and Households in Chesterfield County
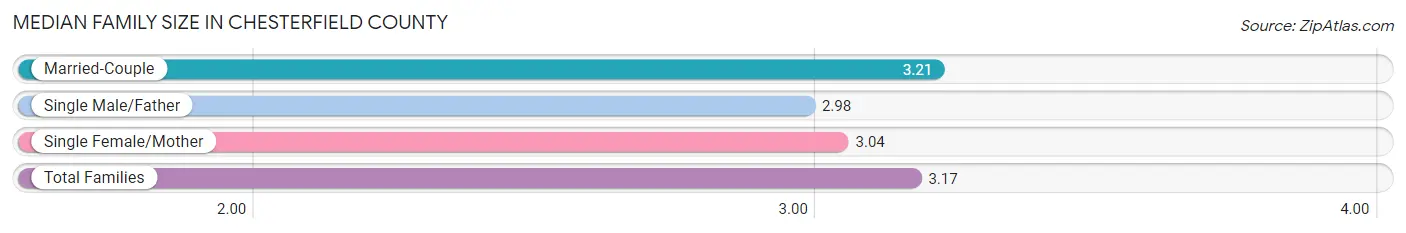
Median Family Size in Chesterfield County
The median family size in Chesterfield County is 3.17 persons per family, with married-couple families (74,712 | 76.8%) accounting for the largest median family size of 3.21 persons per family. On the other hand, single male/father families (5,955 | 6.1%) represent the smallest median family size with 2.98 persons per family.
| Family Type | # Families | Family Size |
| Married-Couple | 74,712 (76.8%) | 3.21 |
| Single Male/Father | 5,955 (6.1%) | 2.98 |
| Single Female/Mother | 16,650 (17.1%) | 3.04 |
| Total Families | 97,317 (100.0%) | 3.17 |
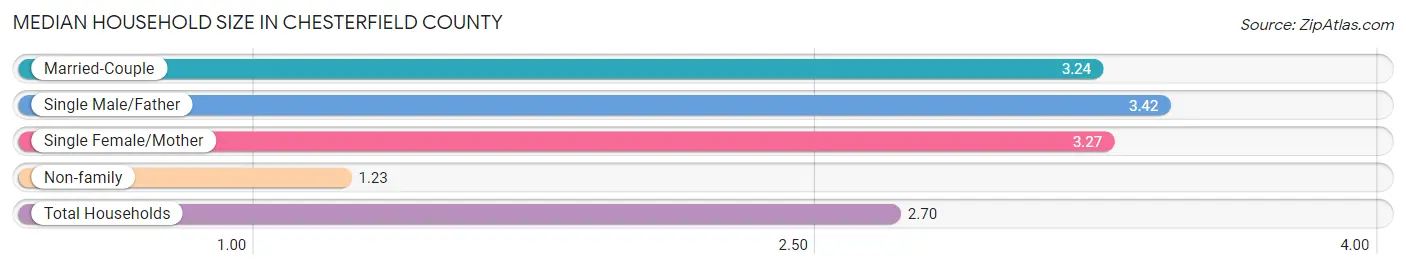
Median Household Size in Chesterfield County
The median household size in Chesterfield County is 2.70 persons per household, with single male/father households (5,955 | 4.4%) accounting for the largest median household size of 3.42 persons per household. non-family households (36,827 | 27.5%) represent the smallest median household size with 1.23 persons per household.
| Household Type | # Households | Household Size |
| Married-Couple | 74,712 (55.7%) | 3.24 |
| Single Male/Father | 5,955 (4.4%) | 3.42 |
| Single Female/Mother | 16,650 (12.4%) | 3.27 |
| Non-family | 36,827 (27.5%) | 1.23 |
| Total Households | 134,144 (100.0%) | 2.70 |
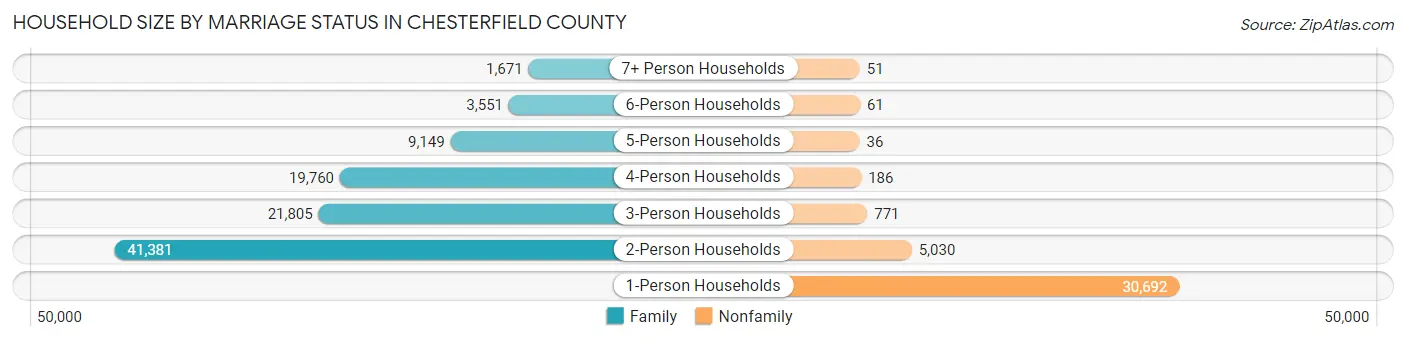
Household Size by Marriage Status in Chesterfield County
Out of a total of 134,144 households in Chesterfield County, 97,317 (72.6%) are family households, while 36,827 (27.5%) are nonfamily households. The most numerous type of family households are 2-person households, comprising 41,381, and the most common type of nonfamily households are 1-person households, comprising 30,692.
| Household Size | Family Households | Nonfamily Households |
| 1-Person Households | - | 30,692 (22.9%) |
| 2-Person Households | 41,381 (30.8%) | 5,030 (3.7%) |
| 3-Person Households | 21,805 (16.3%) | 771 (0.6%) |
| 4-Person Households | 19,760 (14.7%) | 186 (0.1%) |
| 5-Person Households | 9,149 (6.8%) | 36 (0.0%) |
| 6-Person Households | 3,551 (2.6%) | 61 (0.1%) |
| 7+ Person Households | 1,671 (1.3%) | 51 (0.0%) |
| Total | 97,317 (72.6%) | 36,827 (27.5%) |
Female Fertility in Chesterfield County
Fertility by Age in Chesterfield County
Average fertility rate in Chesterfield County is 50.0 births per 1,000 women. Women in the age bracket of 20 to 34 years have the highest fertility rate with 94.0 births per 1,000 women. Women in the age bracket of 20 to 34 years acount for 71.7% of all women with births.
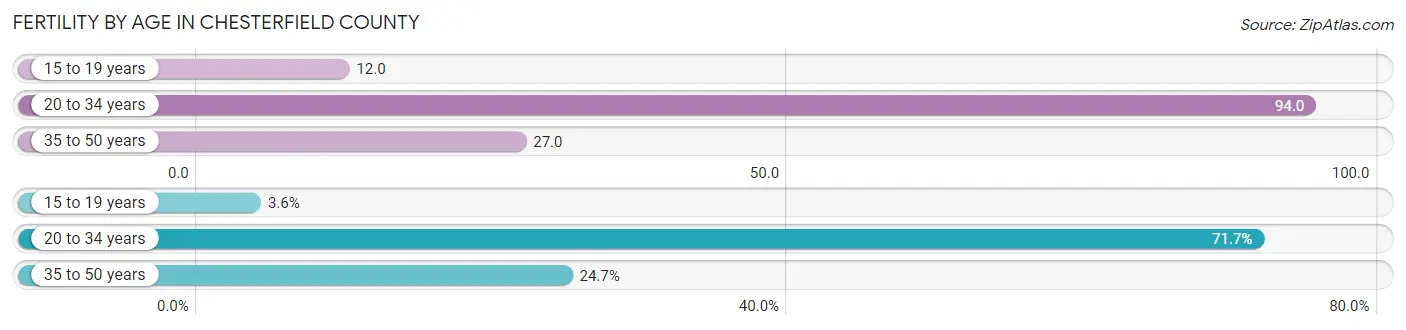
| Age Bracket | Women with Births | Births / 1,000 Women |
| 15 to 19 years | 160 (3.6%) | 12.0 |
| 20 to 34 years | 3,190 (71.7%) | 94.0 |
| 35 to 50 years | 1,101 (24.7%) | 27.0 |
| Total | 4,451 (100.0%) | 50.0 |
Fertility by Age by Marriage Status in Chesterfield County
65.3% of women with births (4,451) in Chesterfield County are married. The highest percentage of unmarried women with births falls into 15 to 19 years age bracket with 100.0% of them unmarried at the time of birth, while the lowest percentage of unmarried women with births belong to 35 to 50 years age bracket with 19.9% of them unmarried.
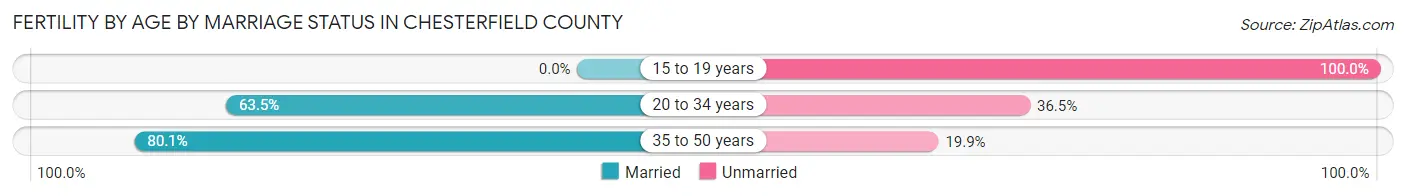
| Age Bracket | Married | Unmarried |
| 15 to 19 years | 0 (0.0%) | 160 (100.0%) |
| 20 to 34 years | 2,026 (63.5%) | 1,164 (36.5%) |
| 35 to 50 years | 882 (80.1%) | 219 (19.9%) |
| Total | 2,907 (65.3%) | 1,544 (34.7%) |
Fertility by Education in Chesterfield County
Average fertility rate in Chesterfield County is 50.0 births per 1,000 women. Women with the education attainment of graduate degree have the highest fertility rate of 70.0 births per 1,000 women, while women with the education attainment of less than high school have the lowest fertility at 21.0 births per 1,000 women. Women with the education attainment of college or associate's degree represent 26.2% of all women with births.
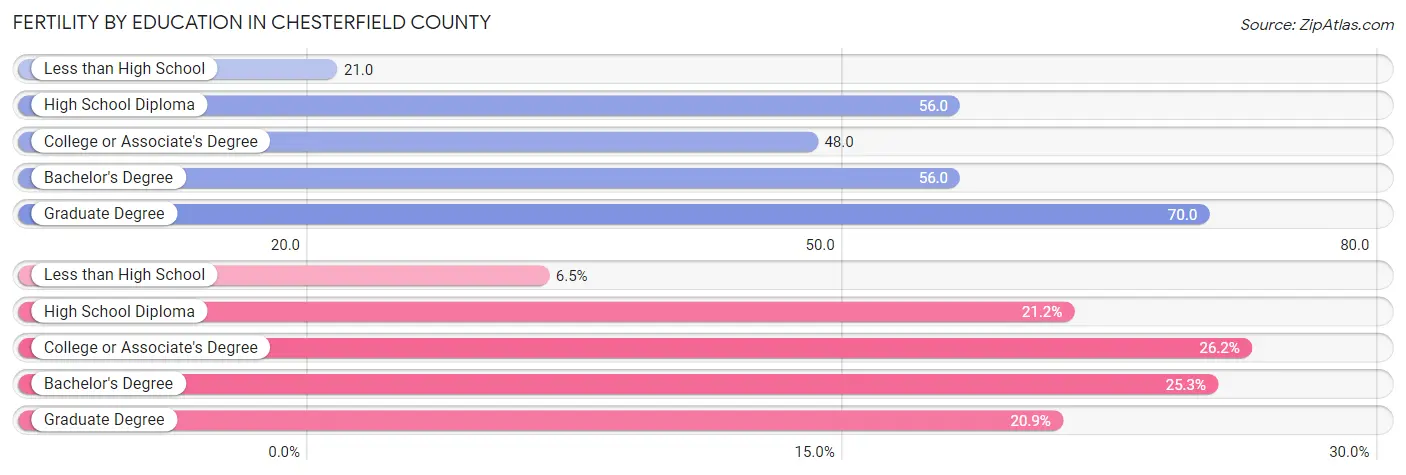
| Educational Attainment | Women with Births | Births / 1,000 Women |
| Less than High School | 287 (6.5%) | 21.0 |
| High School Diploma | 944 (21.2%) | 56.0 |
| College or Associate's Degree | 1,166 (26.2%) | 48.0 |
| Bachelor's Degree | 1,124 (25.3%) | 56.0 |
| Graduate Degree | 930 (20.9%) | 70.0 |
| Total | 4,451 (100.0%) | 50.0 |
Fertility by Education by Marriage Status in Chesterfield County
34.7% of women with births in Chesterfield County are unmarried. Women with the educational attainment of graduate degree are most likely to be married with 84.0% of them married at childbirth, while women with the educational attainment of high school diploma are least likely to be married with 56.0% of them unmarried at childbirth.
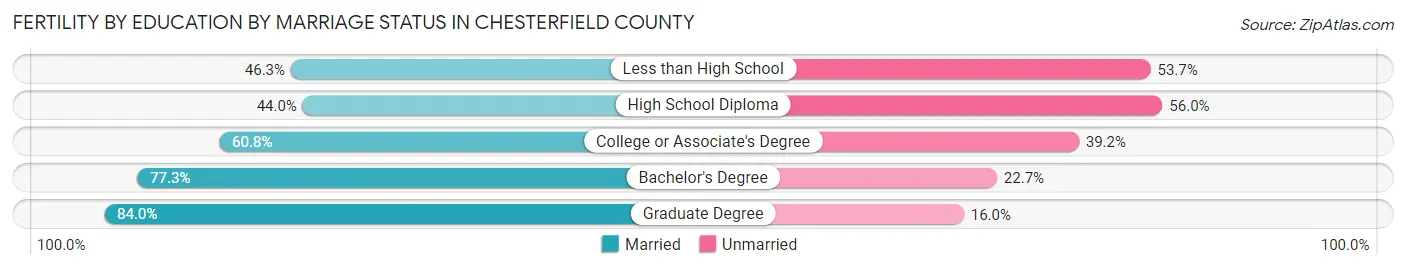
| Educational Attainment | Married | Unmarried |
| Less than High School | 133 (46.3%) | 154 (53.7%) |
| High School Diploma | 415 (44.0%) | 529 (56.0%) |
| College or Associate's Degree | 709 (60.8%) | 457 (39.2%) |
| Bachelor's Degree | 869 (77.3%) | 255 (22.7%) |
| Graduate Degree | 781 (84.0%) | 149 (16.0%) |
| Total | 2,907 (65.3%) | 1,544 (34.7%) |
Employment Characteristics in Chesterfield County
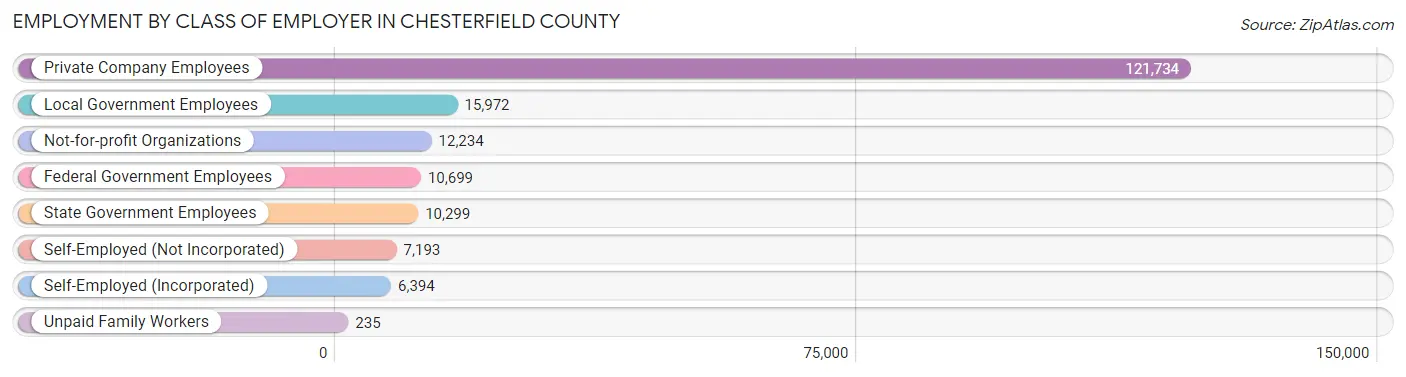
Employment by Class of Employer in Chesterfield County
Among the 184,760 employed individuals in Chesterfield County, private company employees (121,734 | 65.9%), local government employees (15,972 | 8.6%), and not-for-profit organizations (12,234 | 6.6%) make up the most common classes of employment.
| Employer Class | # Employees | % Employees |
| Private Company Employees | 121,734 | 65.9% |
| Self-Employed (Incorporated) | 6,394 | 3.5% |
| Self-Employed (Not Incorporated) | 7,193 | 3.9% |
| Not-for-profit Organizations | 12,234 | 6.6% |
| Local Government Employees | 15,972 | 8.6% |
| State Government Employees | 10,299 | 5.6% |
| Federal Government Employees | 10,699 | 5.8% |
| Unpaid Family Workers | 235 | 0.1% |
| Total | 184,760 | 100.0% |
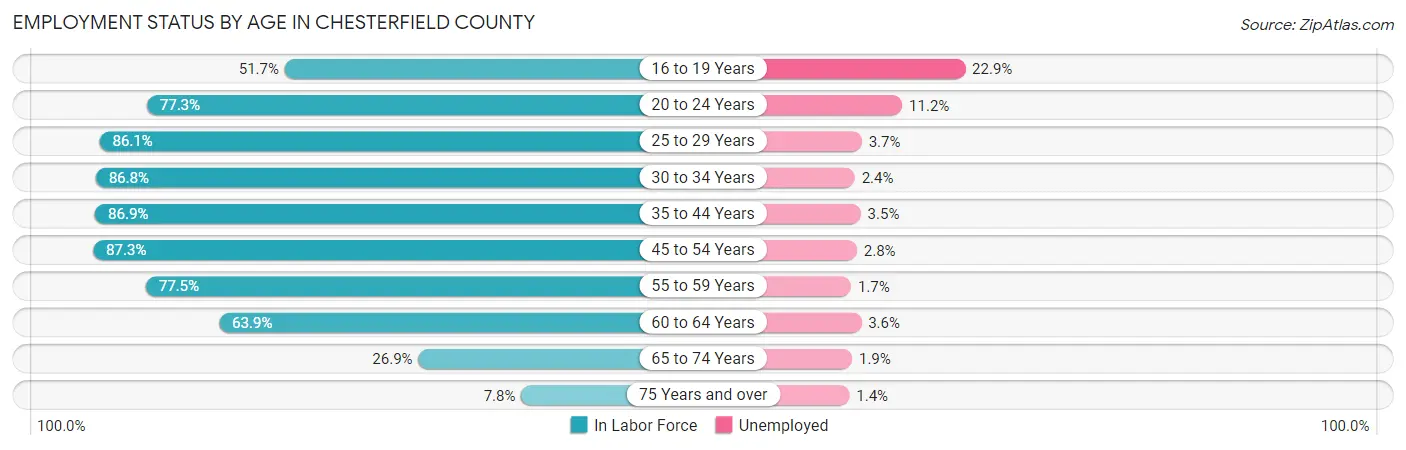
Employment Status by Age in Chesterfield County
According to the labor force statistics for Chesterfield County, out of the total population over 16 years of age (290,262), 67.9% or 197,088 individuals are in the labor force, with 4.7% or 9,263 of them unemployed. The age group with the highest labor force participation rate is 45 to 54 years, with 87.3% or 42,524 individuals in the labor force. Within the labor force, the 16 to 19 years age range has the highest percentage of unemployed individuals, with 22.9% or 2,474 of them being unemployed.
| Age Bracket | In Labor Force | Unemployed |
| 16 to 19 Years | 10,804 (51.7%) | 2,474 (22.9%) |
| 20 to 24 Years | 17,195 (77.3%) | 1,926 (11.2%) |
| 25 to 29 Years | 18,093 (86.1%) | 669 (3.7%) |
| 30 to 34 Years | 19,891 (86.8%) | 477 (2.4%) |
| 35 to 44 Years | 43,546 (86.9%) | 1,524 (3.5%) |
| 45 to 54 Years | 42,524 (87.3%) | 1,191 (2.8%) |
| 55 to 59 Years | 18,644 (77.5%) | 317 (1.7%) |
| 60 to 64 Years | 14,963 (63.9%) | 539 (3.6%) |
| 65 to 74 Years | 9,603 (26.9%) | 182 (1.9%) |
| 75 Years and over | 1,654 (7.8%) | 23 (1.4%) |
| Total | 197,088 (67.9%) | 9,263 (4.7%) |
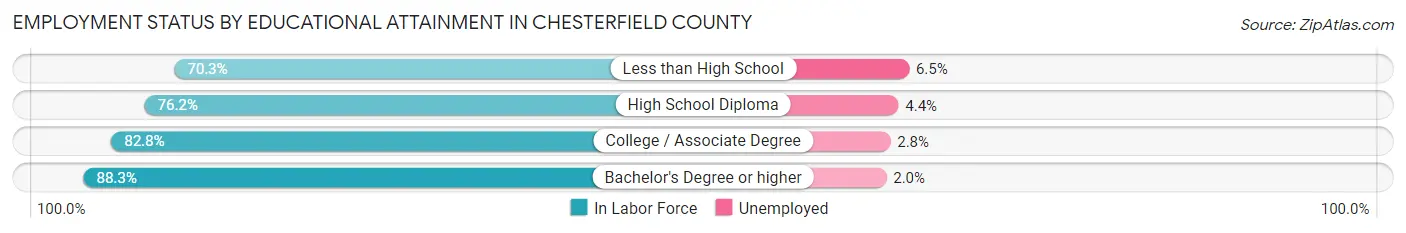
Employment Status by Educational Attainment in Chesterfield County
According to labor force statistics for Chesterfield County, 82.9% of individuals (157,695) out of the total population between 25 and 64 years of age (190,223) are in the labor force, with 3.0% or 4,731 of them being unemployed. The group with the highest labor force participation rate are those with the educational attainment of bachelor's degree or higher, with 88.3% or 73,301 individuals in the labor force. Within the labor force, individuals with less than high school education have the highest percentage of unemployment, with 6.5% or 607 of them being unemployed.
| Educational Attainment | In Labor Force | Unemployed |
| Less than High School | 9,342 (70.3%) | 864 (6.5%) |
| High School Diploma | 31,099 (76.2%) | 1,796 (4.4%) |
| College / Associate Degree | 43,973 (82.8%) | 1,487 (2.8%) |
| Bachelor's Degree or higher | 73,301 (88.3%) | 1,660 (2.0%) |
| Total | 157,695 (82.9%) | 5,707 (3.0%) |
Employment Occupations by Sex in Chesterfield County
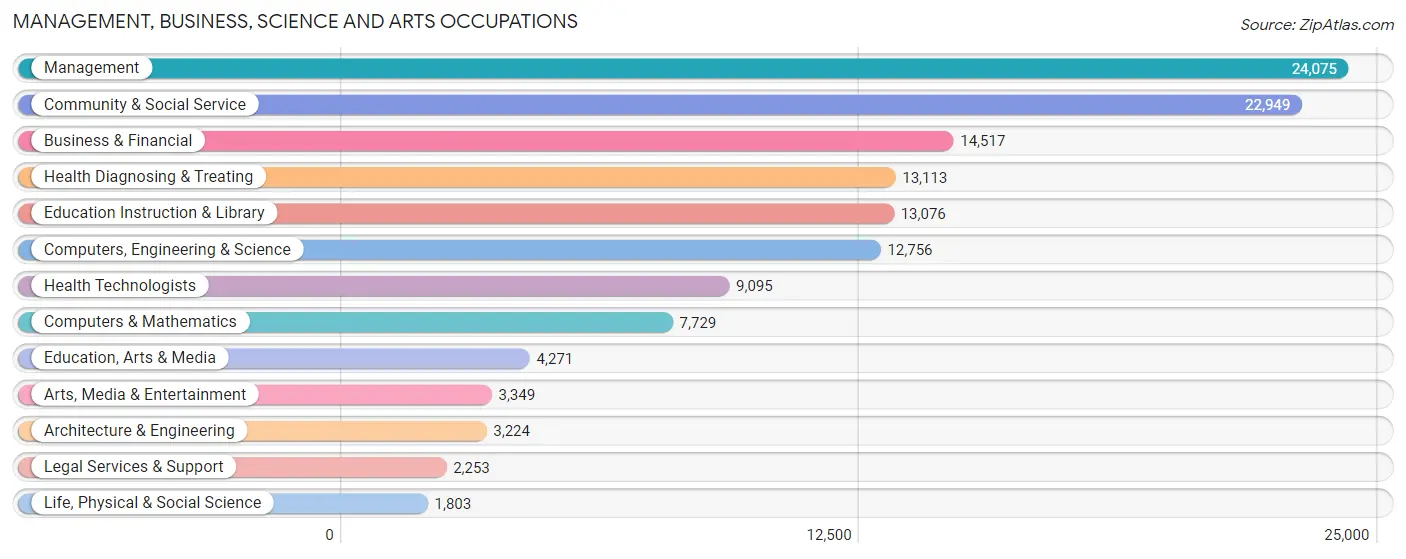
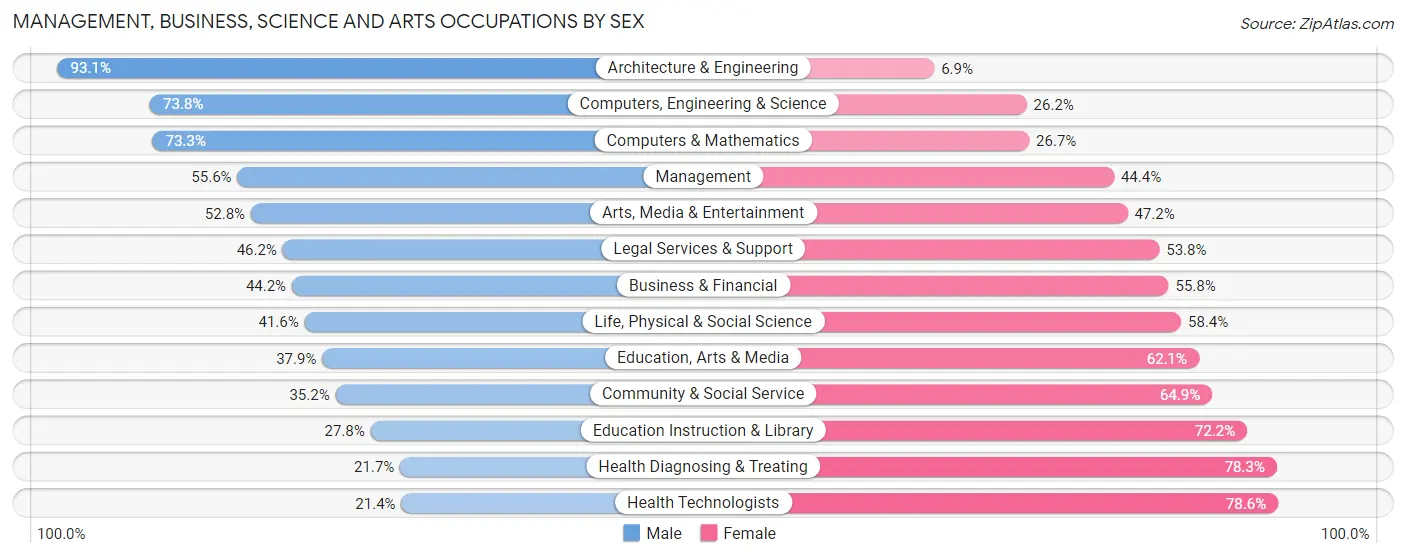
Management, Business, Science and Arts Occupations
The most common Management, Business, Science and Arts occupations in Chesterfield County are Management (24,075 | 12.9%), Community & Social Service (22,949 | 12.3%), Business & Financial (14,517 | 7.8%), Health Diagnosing & Treating (13,113 | 7.0%), and Education Instruction & Library (13,076 | 7.0%).
Management, Business, Science and Arts Occupations by Sex
Within the Management, Business, Science and Arts occupations in Chesterfield County, the most male-oriented occupations are Architecture & Engineering (93.1%), Computers, Engineering & Science (73.8%), and Computers & Mathematics (73.3%), while the most female-oriented occupations are Health Technologists (78.6%), Health Diagnosing & Treating (78.3%), and Education Instruction & Library (72.2%).
| Occupation | Male | Female |
| Management | 13,389 (55.6%) | 10,686 (44.4%) |
| Business & Financial | 6,421 (44.2%) | 8,096 (55.8%) |
| Computers, Engineering & Science | 9,417 (73.8%) | 3,339 (26.2%) |
| Computers & Mathematics | 5,665 (73.3%) | 2,064 (26.7%) |
| Architecture & Engineering | 3,002 (93.1%) | 222 (6.9%) |
| Life, Physical & Social Science | 750 (41.6%) | 1,053 (58.4%) |
| Community & Social Service | 8,067 (35.1%) | 14,882 (64.8%) |
| Education, Arts & Media | 1,619 (37.9%) | 2,652 (62.1%) |
| Legal Services & Support | 1,040 (46.2%) | 1,213 (53.8%) |
| Education Instruction & Library | 3,640 (27.8%) | 9,436 (72.2%) |
| Arts, Media & Entertainment | 1,768 (52.8%) | 1,581 (47.2%) |
| Health Diagnosing & Treating | 2,840 (21.7%) | 10,273 (78.3%) |
| Health Technologists | 1,946 (21.4%) | 7,149 (78.6%) |
| Total (Category) | 40,134 (45.9%) | 47,276 (54.1%) |
| Total (Overall) | 96,145 (51.6%) | 90,026 (48.4%) |
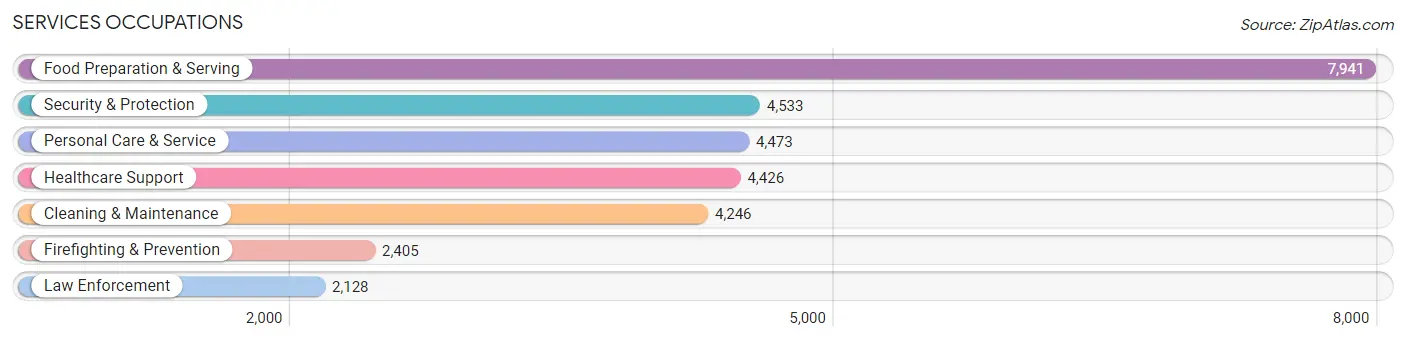
Services Occupations
The most common Services occupations in Chesterfield County are Food Preparation & Serving (7,941 | 4.3%), Security & Protection (4,533 | 2.4%), Personal Care & Service (4,473 | 2.4%), Healthcare Support (4,426 | 2.4%), and Cleaning & Maintenance (4,246 | 2.3%).
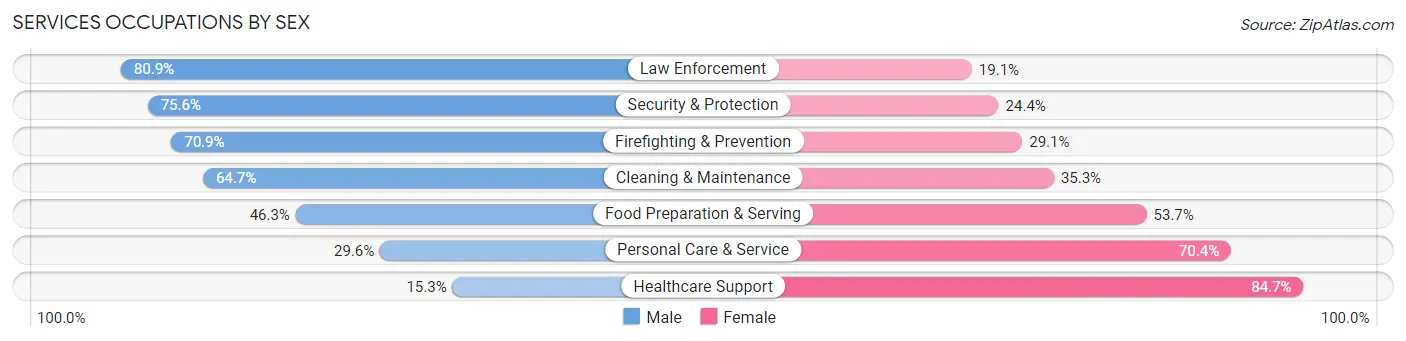
Services Occupations by Sex
Within the Services occupations in Chesterfield County, the most male-oriented occupations are Law Enforcement (80.9%), Security & Protection (75.6%), and Firefighting & Prevention (70.9%), while the most female-oriented occupations are Healthcare Support (84.7%), Personal Care & Service (70.4%), and Food Preparation & Serving (53.7%).
| Occupation | Male | Female |
| Healthcare Support | 676 (15.3%) | 3,750 (84.7%) |
| Security & Protection | 3,428 (75.6%) | 1,105 (24.4%) |
| Firefighting & Prevention | 1,706 (70.9%) | 699 (29.1%) |
| Law Enforcement | 1,722 (80.9%) | 406 (19.1%) |
| Food Preparation & Serving | 3,678 (46.3%) | 4,263 (53.7%) |
| Cleaning & Maintenance | 2,746 (64.7%) | 1,500 (35.3%) |
| Personal Care & Service | 1,324 (29.6%) | 3,149 (70.4%) |
| Total (Category) | 11,852 (46.3%) | 13,767 (53.7%) |
| Total (Overall) | 96,145 (51.6%) | 90,026 (48.4%) |
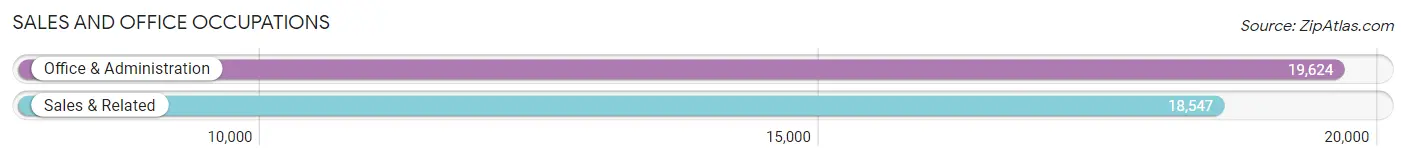
Sales and Office Occupations
The most common Sales and Office occupations in Chesterfield County are Office & Administration (19,624 | 10.5%), and Sales & Related (18,547 | 10.0%).
Sales and Office Occupations by Sex
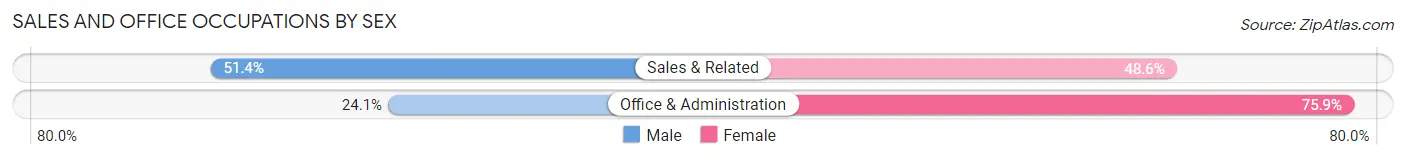
| Occupation | Male | Female |
| Sales & Related | 9,529 (51.4%) | 9,018 (48.6%) |
| Office & Administration | 4,731 (24.1%) | 14,893 (75.9%) |
| Total (Category) | 14,260 (37.4%) | 23,911 (62.6%) |
| Total (Overall) | 96,145 (51.6%) | 90,026 (48.4%) |
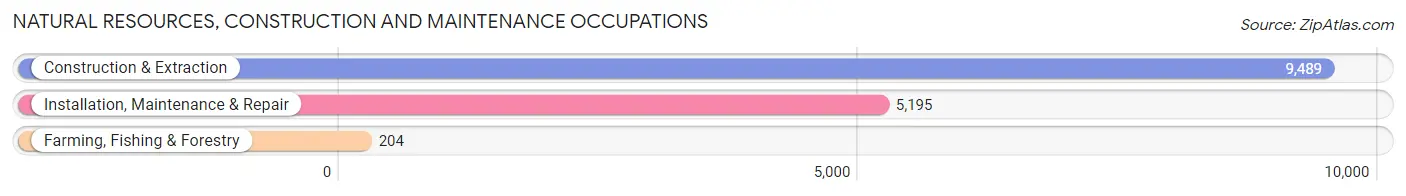
Natural Resources, Construction and Maintenance Occupations
The most common Natural Resources, Construction and Maintenance occupations in Chesterfield County are Construction & Extraction (9,489 | 5.1%), Installation, Maintenance & Repair (5,195 | 2.8%), and Farming, Fishing & Forestry (204 | 0.1%).
Natural Resources, Construction and Maintenance Occupations by Sex
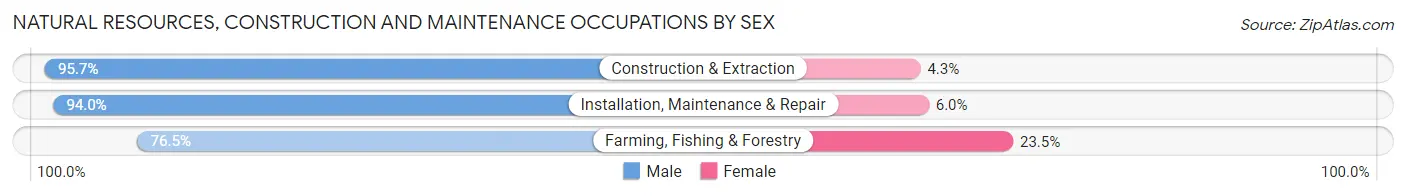
| Occupation | Male | Female |
| Farming, Fishing & Forestry | 156 (76.5%) | 48 (23.5%) |
| Construction & Extraction | 9,084 (95.7%) | 405 (4.3%) |
| Installation, Maintenance & Repair | 4,883 (94.0%) | 312 (6.0%) |
| Total (Category) | 14,123 (94.9%) | 765 (5.1%) |
| Total (Overall) | 96,145 (51.6%) | 90,026 (48.4%) |
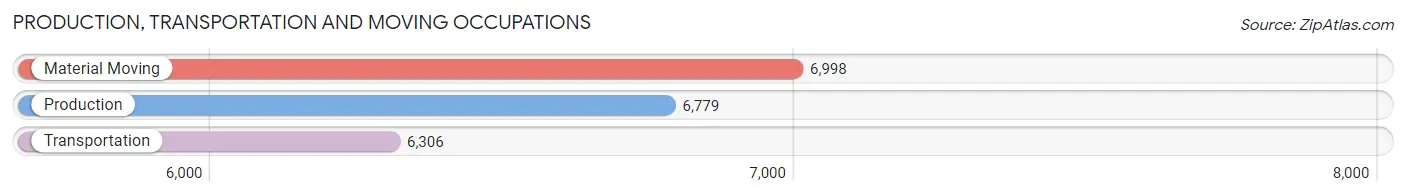
Production, Transportation and Moving Occupations
The most common Production, Transportation and Moving occupations in Chesterfield County are Material Moving (6,998 | 3.8%), Production (6,779 | 3.6%), and Transportation (6,306 | 3.4%).
Production, Transportation and Moving Occupations by Sex
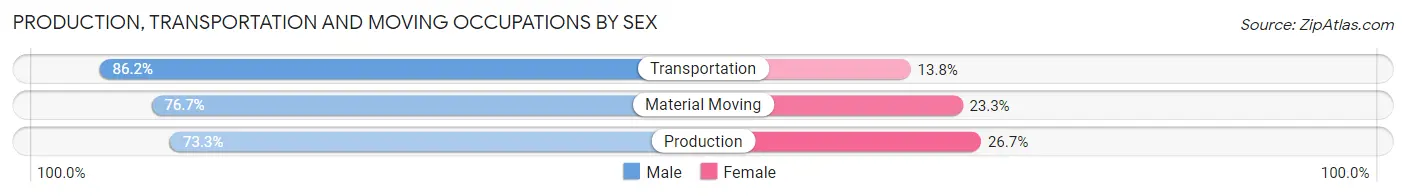
| Occupation | Male | Female |
| Production | 4,970 (73.3%) | 1,809 (26.7%) |
| Transportation | 5,437 (86.2%) | 869 (13.8%) |
| Material Moving | 5,369 (76.7%) | 1,629 (23.3%) |
| Total (Category) | 15,776 (78.5%) | 4,307 (21.4%) |
| Total (Overall) | 96,145 (51.6%) | 90,026 (48.4%) |
Employment Industries by Sex in Chesterfield County
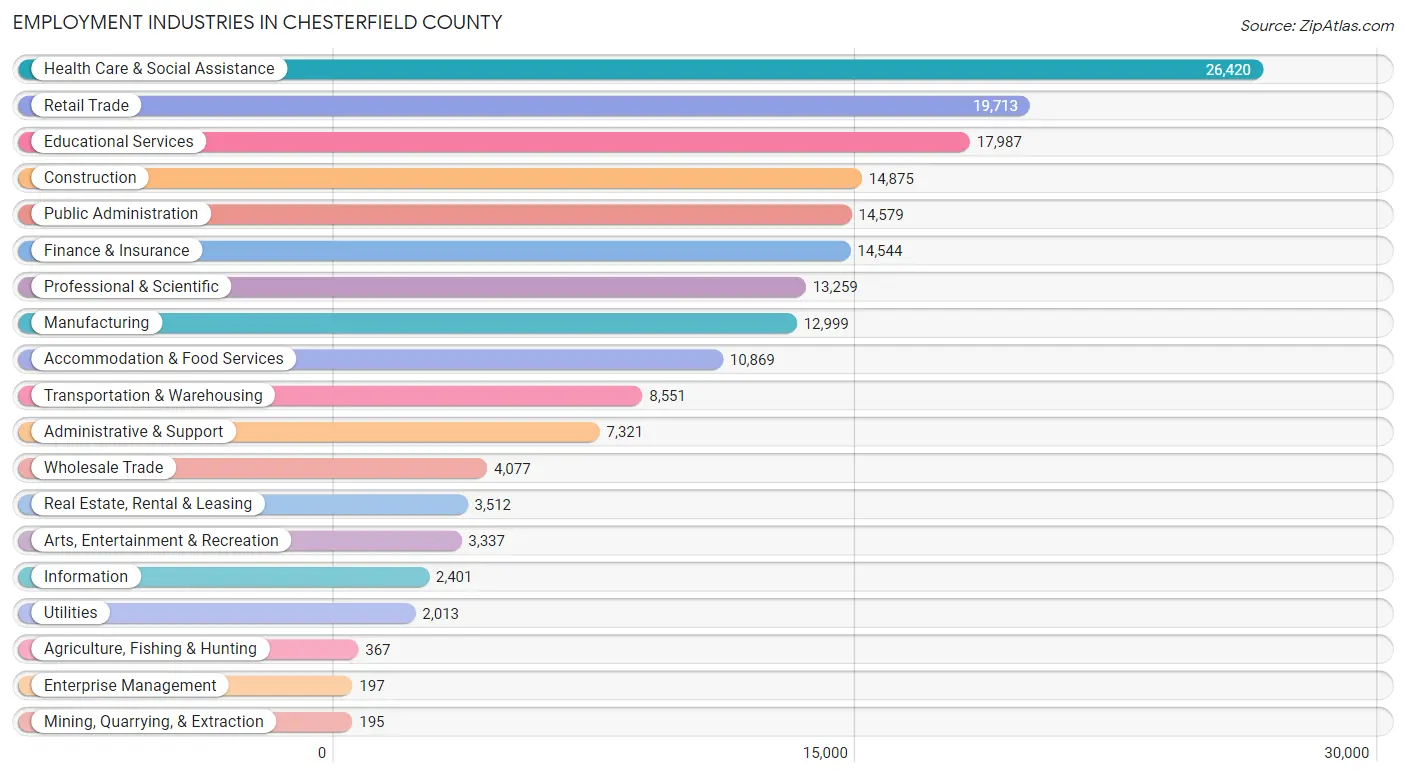
Employment Industries in Chesterfield County
The major employment industries in Chesterfield County include Health Care & Social Assistance (26,420 | 14.2%), Retail Trade (19,713 | 10.6%), Educational Services (17,987 | 9.7%), Construction (14,875 | 8.0%), and Public Administration (14,579 | 7.8%).
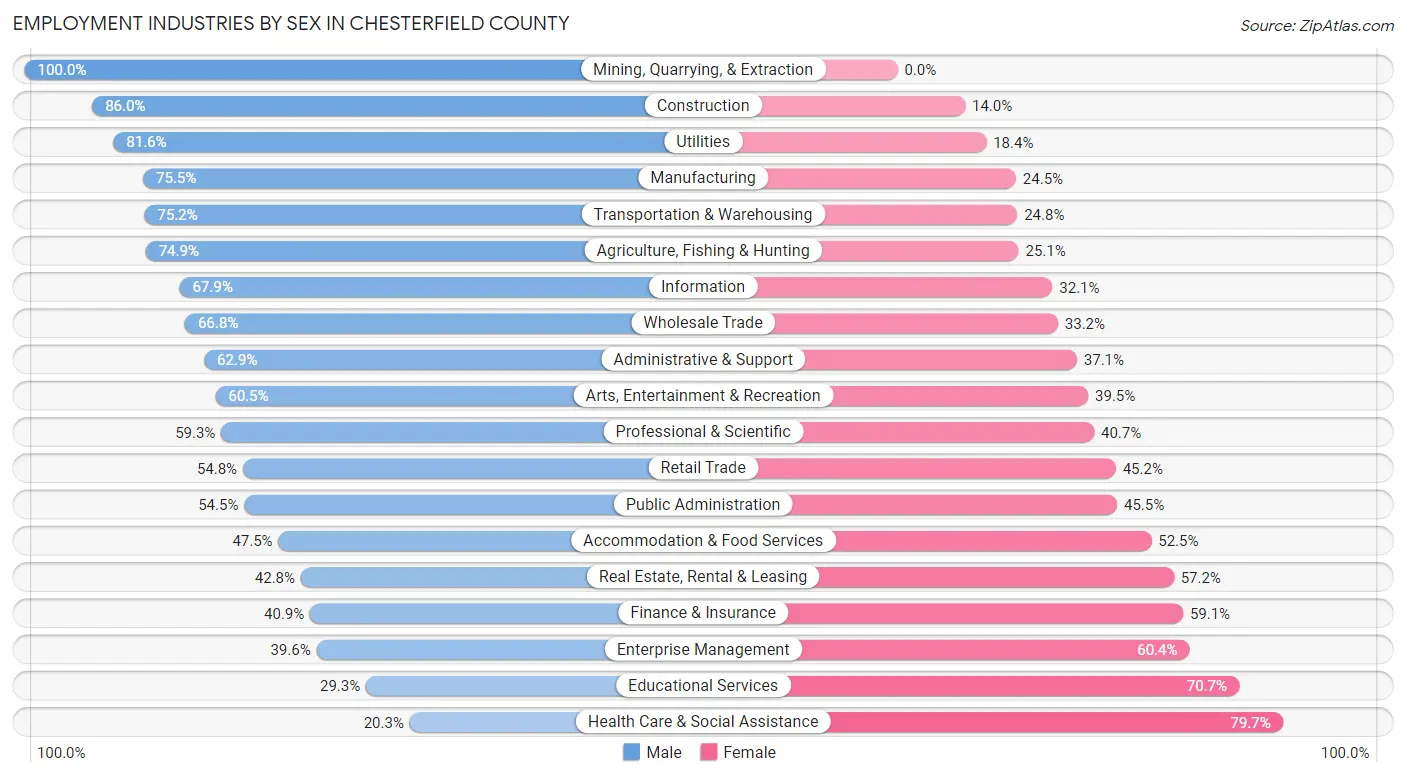
Employment Industries by Sex in Chesterfield County
The Chesterfield County industries that see more men than women are Mining, Quarrying, & Extraction (100.0%), Construction (86.0%), and Utilities (81.6%), whereas the industries that tend to have a higher number of women are Health Care & Social Assistance (79.7%), Educational Services (70.7%), and Enterprise Management (60.4%).
| Industry | Male | Female |
| Agriculture, Fishing & Hunting | 275 (74.9%) | 92 (25.1%) |
| Mining, Quarrying, & Extraction | 195 (100.0%) | 0 (0.0%) |
| Construction | 12,793 (86.0%) | 2,082 (14.0%) |
| Manufacturing | 9,812 (75.5%) | 3,187 (24.5%) |
| Wholesale Trade | 2,723 (66.8%) | 1,354 (33.2%) |
| Retail Trade | 10,804 (54.8%) | 8,909 (45.2%) |
| Transportation & Warehousing | 6,430 (75.2%) | 2,121 (24.8%) |
| Utilities | 1,643 (81.6%) | 370 (18.4%) |
| Information | 1,631 (67.9%) | 770 (32.1%) |
| Finance & Insurance | 5,948 (40.9%) | 8,596 (59.1%) |
| Real Estate, Rental & Leasing | 1,504 (42.8%) | 2,008 (57.2%) |
| Professional & Scientific | 7,864 (59.3%) | 5,395 (40.7%) |
| Enterprise Management | 78 (39.6%) | 119 (60.4%) |
| Administrative & Support | 4,602 (62.9%) | 2,719 (37.1%) |
| Educational Services | 5,275 (29.3%) | 12,712 (70.7%) |
| Health Care & Social Assistance | 5,359 (20.3%) | 21,061 (79.7%) |
| Arts, Entertainment & Recreation | 2,020 (60.5%) | 1,317 (39.5%) |
| Accommodation & Food Services | 5,158 (47.5%) | 5,711 (52.5%) |
| Public Administration | 7,952 (54.5%) | 6,627 (45.5%) |
| Total | 96,145 (51.6%) | 90,026 (48.4%) |
Education in Chesterfield County
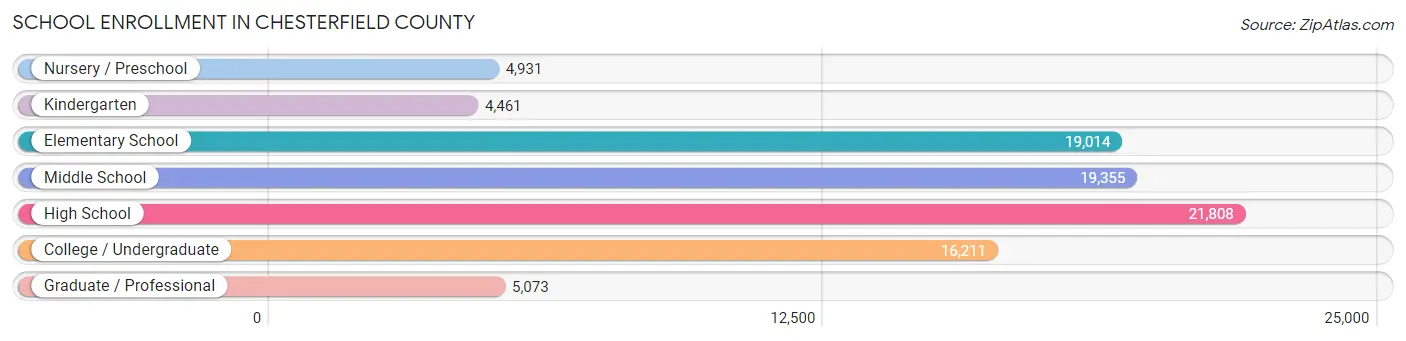
School Enrollment in Chesterfield County
The most common levels of schooling among the 90,853 students in Chesterfield County are high school (21,808 | 24.0%), middle school (19,355 | 21.3%), and elementary school (19,014 | 20.9%).
| School Level | # Students | % Students |
| Nursery / Preschool | 4,931 | 5.4% |
| Kindergarten | 4,461 | 4.9% |
| Elementary School | 19,014 | 20.9% |
| Middle School | 19,355 | 21.3% |
| High School | 21,808 | 24.0% |
| College / Undergraduate | 16,211 | 17.8% |
| Graduate / Professional | 5,073 | 5.6% |
| Total | 90,853 | 100.0% |
School Enrollment by Age by Funding Source in Chesterfield County
Out of a total of 90,853 students who are enrolled in schools in Chesterfield County, 14,991 (16.5%) attend a private institution, while the remaining 75,862 (83.5%) are enrolled in public schools. The age group of 3 to 4 year olds has the highest likelihood of being enrolled in private schools, with 2,246 (61.1% in the age bracket) enrolled. Conversely, the age group of 15 to 17 year olds has the lowest likelihood of being enrolled in a private school, with 13,943 (91.5% in the age bracket) attending a public institution.
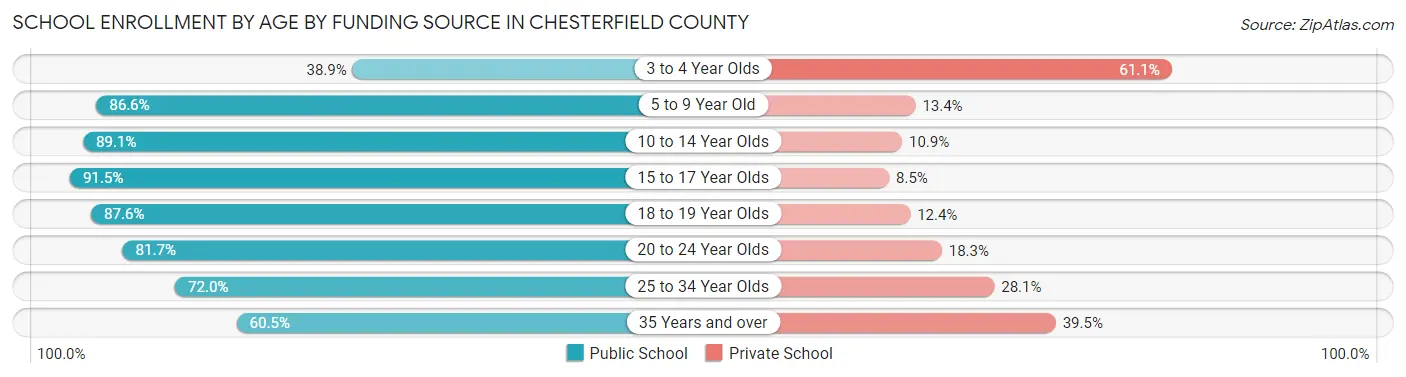
| Age Bracket | Public School | Private School |
| 3 to 4 Year Olds | 1,431 (38.9%) | 2,246 (61.1%) |
| 5 to 9 Year Old | 18,889 (86.6%) | 2,916 (13.4%) |
| 10 to 14 Year Olds | 21,805 (89.1%) | 2,661 (10.9%) |
| 15 to 17 Year Olds | 13,943 (91.5%) | 1,289 (8.5%) |
| 18 to 19 Year Olds | 6,348 (87.6%) | 898 (12.4%) |
| 20 to 24 Year Olds | 7,095 (81.7%) | 1,586 (18.3%) |
| 25 to 34 Year Olds | 3,089 (72.0%) | 1,204 (28.1%) |
| 35 Years and over | 3,299 (60.5%) | 2,154 (39.5%) |
| Total | 75,862 (83.5%) | 14,991 (16.5%) |
Educational Attainment by Field of Study in Chesterfield County
Business (25,312 | 22.2%), education (12,138 | 10.7%), science & technology (10,909 | 9.6%), social sciences (10,043 | 8.8%), and arts & humanities (8,245 | 7.2%) are the most common fields of study among 113,818 individuals in Chesterfield County who have obtained a bachelor's degree or higher.
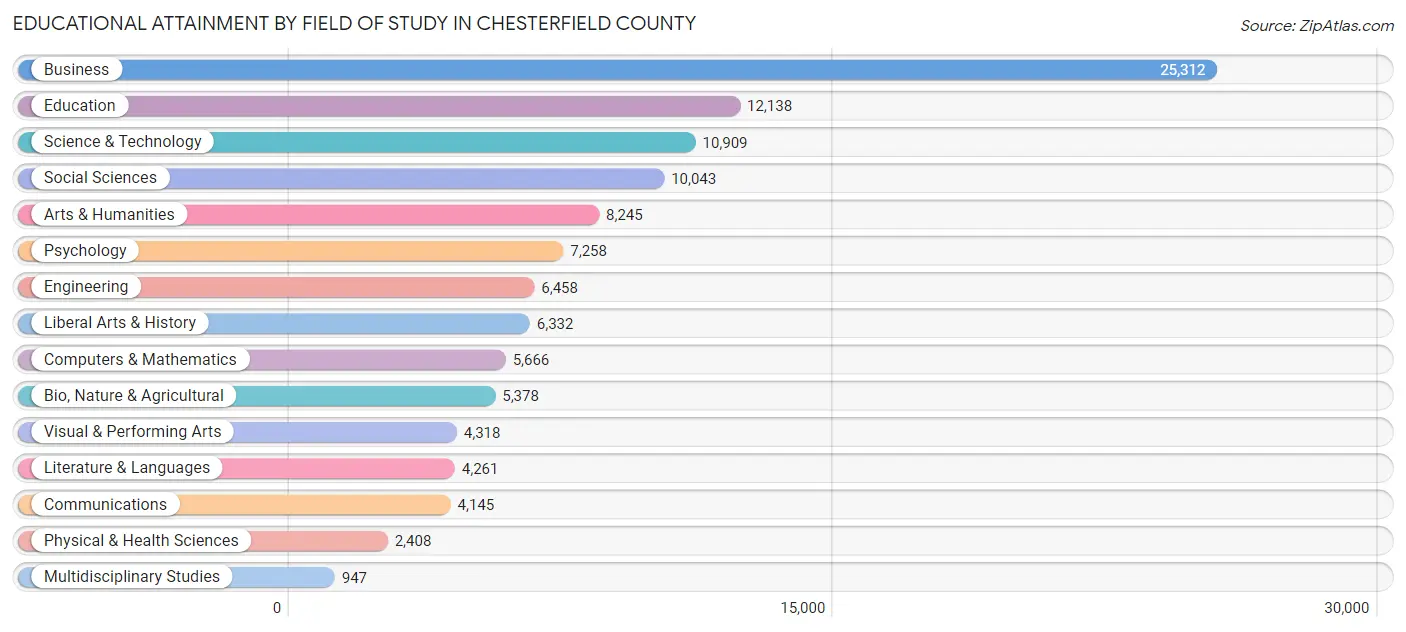
| Field of Study | # Graduates | % Graduates |
| Computers & Mathematics | 5,666 | 5.0% |
| Bio, Nature & Agricultural | 5,378 | 4.7% |
| Physical & Health Sciences | 2,408 | 2.1% |
| Psychology | 7,258 | 6.4% |
| Social Sciences | 10,043 | 8.8% |
| Engineering | 6,458 | 5.7% |
| Multidisciplinary Studies | 947 | 0.8% |
| Science & Technology | 10,909 | 9.6% |
| Business | 25,312 | 22.2% |
| Education | 12,138 | 10.7% |
| Literature & Languages | 4,261 | 3.7% |
| Liberal Arts & History | 6,332 | 5.6% |
| Visual & Performing Arts | 4,318 | 3.8% |
| Communications | 4,145 | 3.6% |
| Arts & Humanities | 8,245 | 7.2% |
| Total | 113,818 | 100.0% |
Transportation & Commute in Chesterfield County
Vehicle Availability by Sex in Chesterfield County
The most prevalent vehicle ownership categories in Chesterfield County are males with 2 vehicles (40,987, accounting for 42.7%) and females with 2 vehicles (34,310, making up 46.5%).
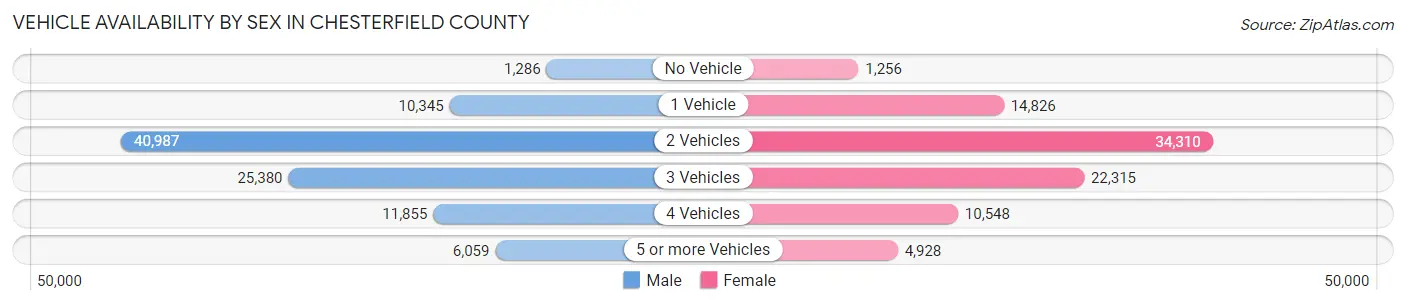
| Vehicles Available | Male | Female |
| No Vehicle | 1,286 (1.3%) | 1,256 (1.4%) |
| 1 Vehicle | 10,345 (10.8%) | 14,826 (16.8%) |
| 2 Vehicles | 40,987 (42.7%) | 34,310 (38.9%) |
| 3 Vehicles | 25,380 (26.5%) | 22,315 (25.3%) |
| 4 Vehicles | 11,855 (12.4%) | 10,548 (12.0%) |
| 5 or more Vehicles | 6,059 (6.3%) | 4,928 (5.6%) |
| Total | 95,912 (100.0%) | 88,183 (100.0%) |
Commute Time in Chesterfield County
The most frequently occuring commute durations in Chesterfield County are 30 to 34 minutes (30,962 commuters, 19.5%), 20 to 24 minutes (30,312 commuters, 19.1%), and 15 to 19 minutes (22,226 commuters, 14.0%).
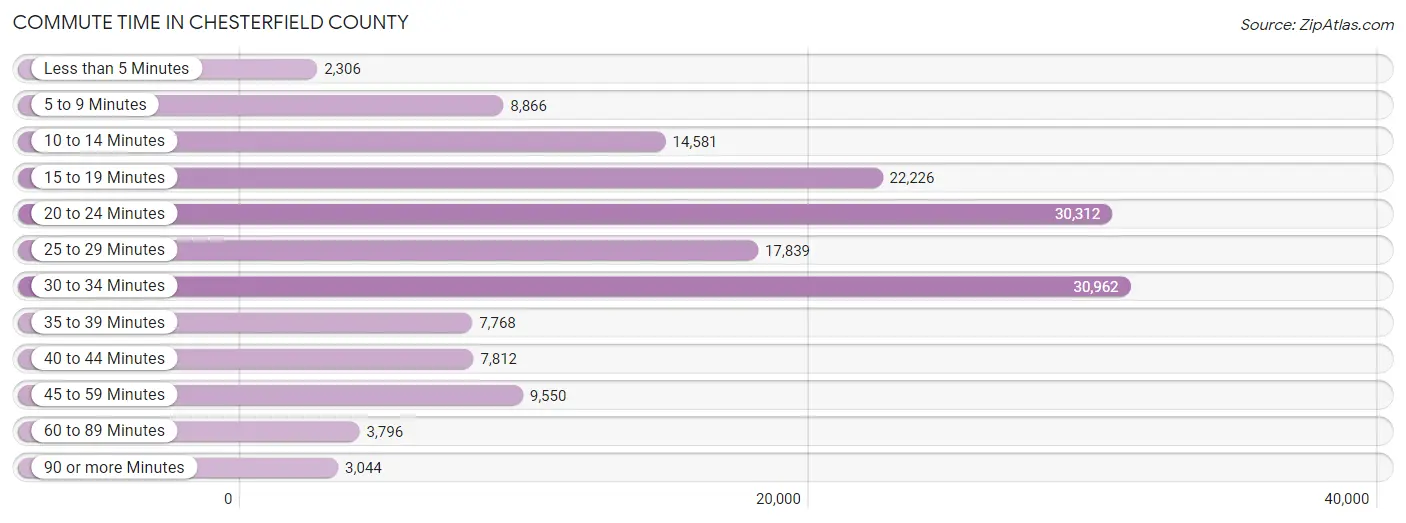
| Commute Time | # Commuters | % Commuters |
| Less than 5 Minutes | 2,306 | 1.5% |
| 5 to 9 Minutes | 8,866 | 5.6% |
| 10 to 14 Minutes | 14,581 | 9.2% |
| 15 to 19 Minutes | 22,226 | 14.0% |
| 20 to 24 Minutes | 30,312 | 19.1% |
| 25 to 29 Minutes | 17,839 | 11.2% |
| 30 to 34 Minutes | 30,962 | 19.5% |
| 35 to 39 Minutes | 7,768 | 4.9% |
| 40 to 44 Minutes | 7,812 | 4.9% |
| 45 to 59 Minutes | 9,550 | 6.0% |
| 60 to 89 Minutes | 3,796 | 2.4% |
| 90 or more Minutes | 3,044 | 1.9% |
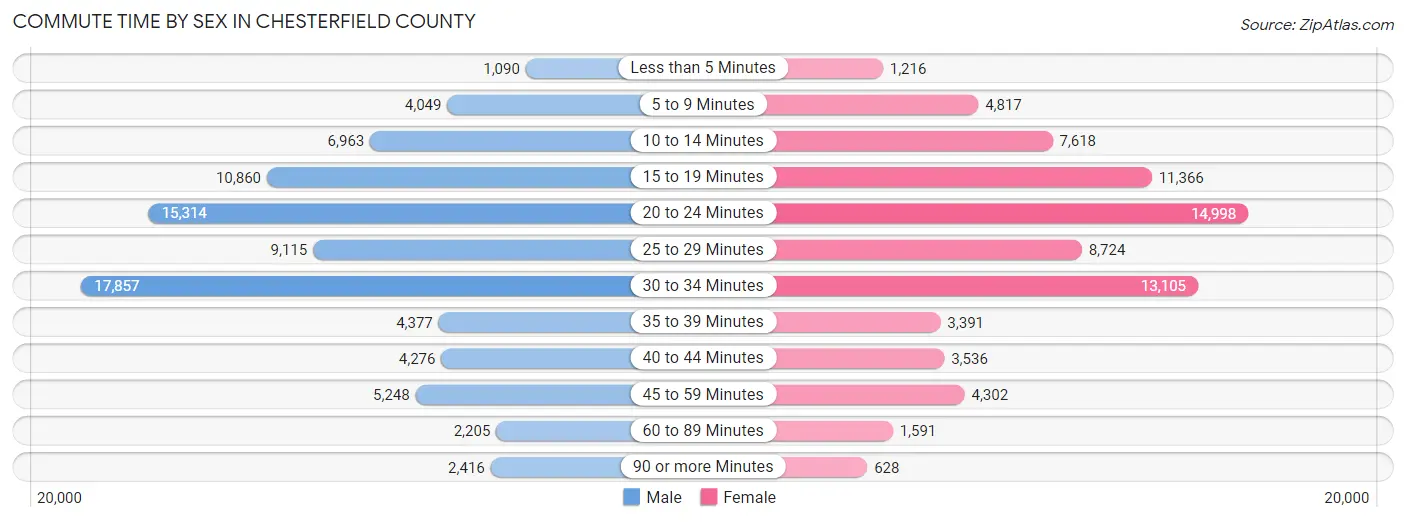
Commute Time by Sex in Chesterfield County
The most common commute times in Chesterfield County are 30 to 34 minutes (17,857 commuters, 21.3%) for males and 20 to 24 minutes (14,998 commuters, 19.9%) for females.
| Commute Time | Male | Female |
| Less than 5 Minutes | 1,090 (1.3%) | 1,216 (1.6%) |
| 5 to 9 Minutes | 4,049 (4.8%) | 4,817 (6.4%) |
| 10 to 14 Minutes | 6,963 (8.3%) | 7,618 (10.1%) |
| 15 to 19 Minutes | 10,860 (13.0%) | 11,366 (15.1%) |
| 20 to 24 Minutes | 15,314 (18.3%) | 14,998 (19.9%) |
| 25 to 29 Minutes | 9,115 (10.9%) | 8,724 (11.6%) |
| 30 to 34 Minutes | 17,857 (21.3%) | 13,105 (17.4%) |
| 35 to 39 Minutes | 4,377 (5.2%) | 3,391 (4.5%) |
| 40 to 44 Minutes | 4,276 (5.1%) | 3,536 (4.7%) |
| 45 to 59 Minutes | 5,248 (6.3%) | 4,302 (5.7%) |
| 60 to 89 Minutes | 2,205 (2.6%) | 1,591 (2.1%) |
| 90 or more Minutes | 2,416 (2.9%) | 628 (0.8%) |
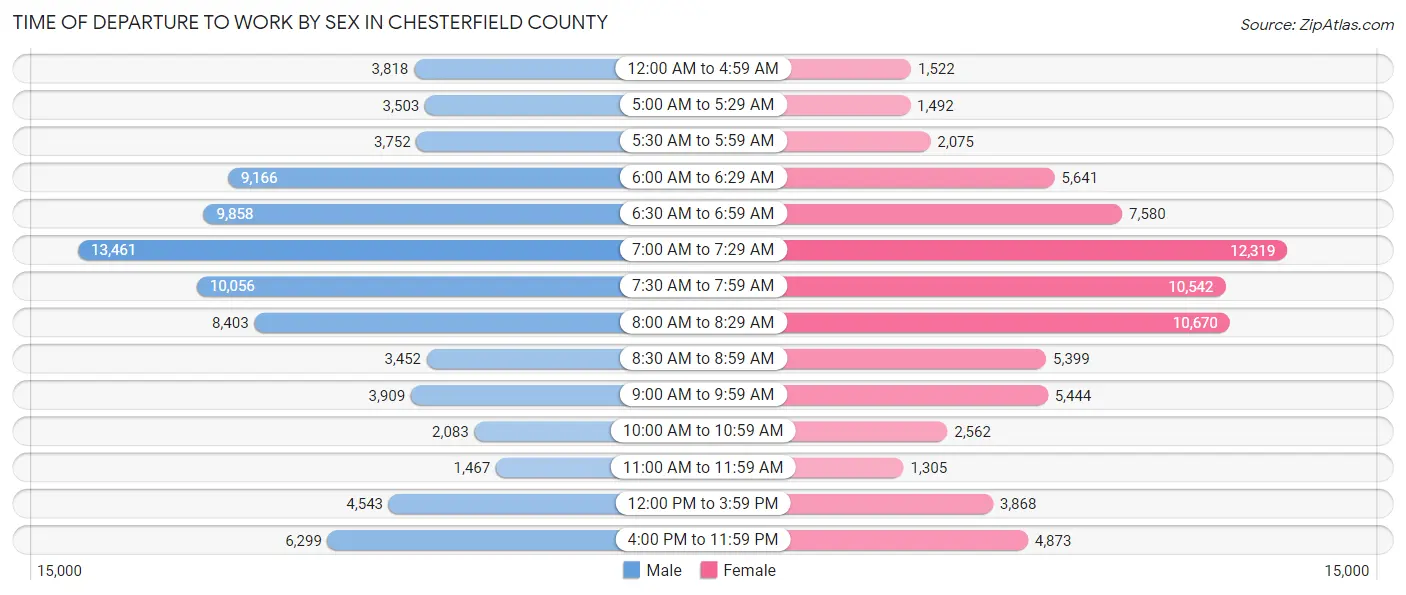
Time of Departure to Work by Sex in Chesterfield County
The most frequent times of departure to work in Chesterfield County are 7:00 AM to 7:29 AM (13,461, 16.1%) for males and 7:00 AM to 7:29 AM (12,319, 16.4%) for females.
| Time of Departure | Male | Female |
| 12:00 AM to 4:59 AM | 3,818 (4.6%) | 1,522 (2.0%) |
| 5:00 AM to 5:29 AM | 3,503 (4.2%) | 1,492 (2.0%) |
| 5:30 AM to 5:59 AM | 3,752 (4.5%) | 2,075 (2.8%) |
| 6:00 AM to 6:29 AM | 9,166 (10.9%) | 5,641 (7.5%) |
| 6:30 AM to 6:59 AM | 9,858 (11.8%) | 7,580 (10.1%) |
| 7:00 AM to 7:29 AM | 13,461 (16.1%) | 12,319 (16.4%) |
| 7:30 AM to 7:59 AM | 10,056 (12.0%) | 10,542 (14.0%) |
| 8:00 AM to 8:29 AM | 8,403 (10.0%) | 10,670 (14.2%) |
| 8:30 AM to 8:59 AM | 3,452 (4.1%) | 5,399 (7.2%) |
| 9:00 AM to 9:59 AM | 3,909 (4.7%) | 5,444 (7.2%) |
| 10:00 AM to 10:59 AM | 2,083 (2.5%) | 2,562 (3.4%) |
| 11:00 AM to 11:59 AM | 1,467 (1.8%) | 1,305 (1.7%) |
| 12:00 PM to 3:59 PM | 4,543 (5.4%) | 3,868 (5.1%) |
| 4:00 PM to 11:59 PM | 6,299 (7.5%) | 4,873 (6.5%) |
| Total | 83,770 (100.0%) | 75,292 (100.0%) |
Housing Occupancy in Chesterfield County
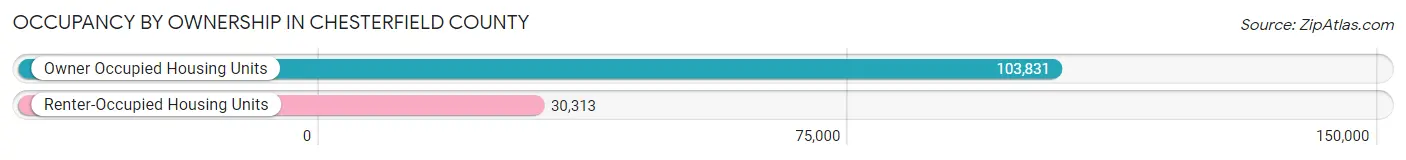
Occupancy by Ownership in Chesterfield County
Of the total 134,144 dwellings in Chesterfield County, owner-occupied units account for 103,831 (77.4%), while renter-occupied units make up 30,313 (22.6%).
| Occupancy | # Housing Units | % Housing Units |
| Owner Occupied Housing Units | 103,831 | 77.4% |
| Renter-Occupied Housing Units | 30,313 | 22.6% |
| Total Occupied Housing Units | 134,144 | 100.0% |
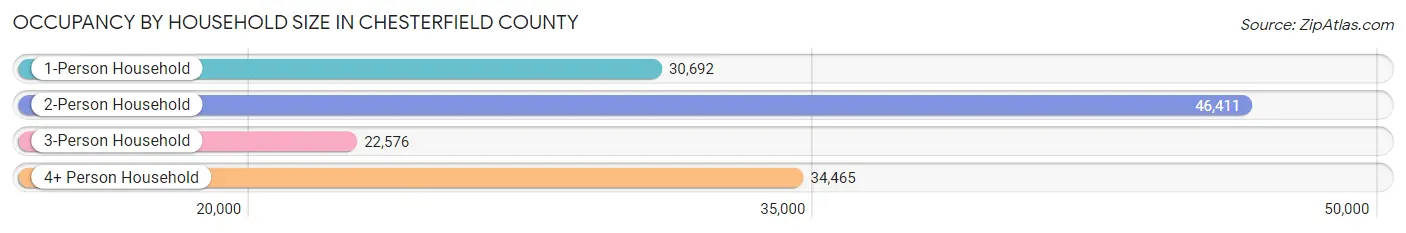
Occupancy by Household Size in Chesterfield County
| Household Size | # Housing Units | % Housing Units |
| 1-Person Household | 30,692 | 22.9% |
| 2-Person Household | 46,411 | 34.6% |
| 3-Person Household | 22,576 | 16.8% |
| 4+ Person Household | 34,465 | 25.7% |
| Total Housing Units | 134,144 | 100.0% |
Occupancy by Ownership by Household Size in Chesterfield County
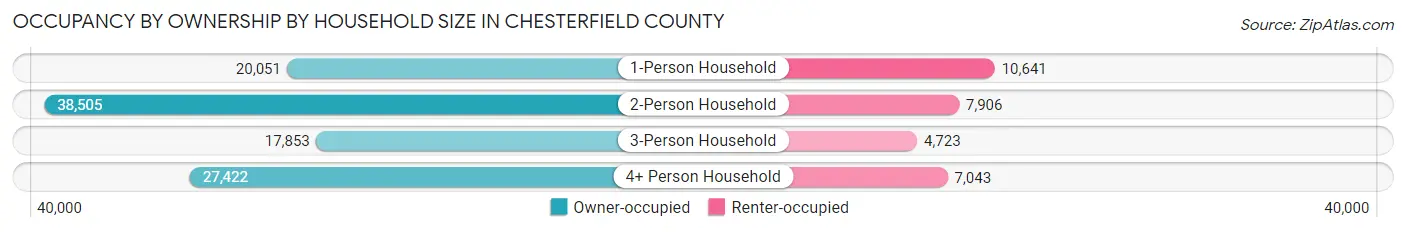
| Household Size | Owner-occupied | Renter-occupied |
| 1-Person Household | 20,051 (65.3%) | 10,641 (34.7%) |
| 2-Person Household | 38,505 (83.0%) | 7,906 (17.0%) |
| 3-Person Household | 17,853 (79.1%) | 4,723 (20.9%) |
| 4+ Person Household | 27,422 (79.6%) | 7,043 (20.4%) |
| Total Housing Units | 103,831 (77.4%) | 30,313 (22.6%) |
Occupancy by Educational Attainment in Chesterfield County
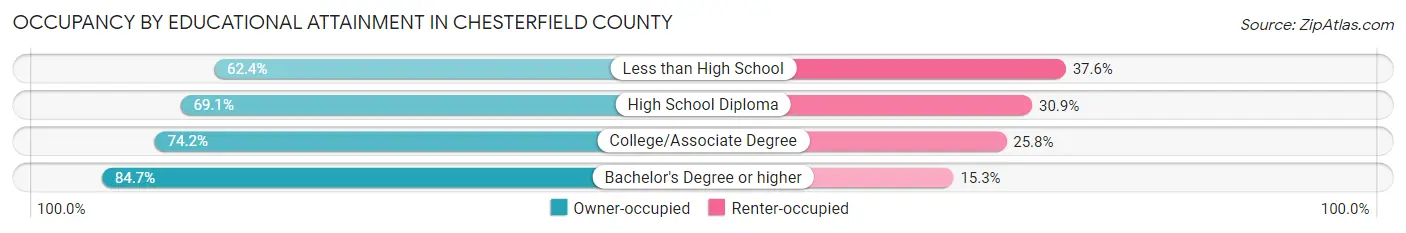
| Household Size | Owner-occupied | Renter-occupied |
| Less than High School | 5,090 (62.4%) | 3,065 (37.6%) |
| High School Diploma | 17,314 (69.1%) | 7,746 (30.9%) |
| College/Associate Degree | 28,648 (74.2%) | 9,957 (25.8%) |
| Bachelor's Degree or higher | 52,779 (84.7%) | 9,545 (15.3%) |
Occupancy by Age of Householder in Chesterfield County
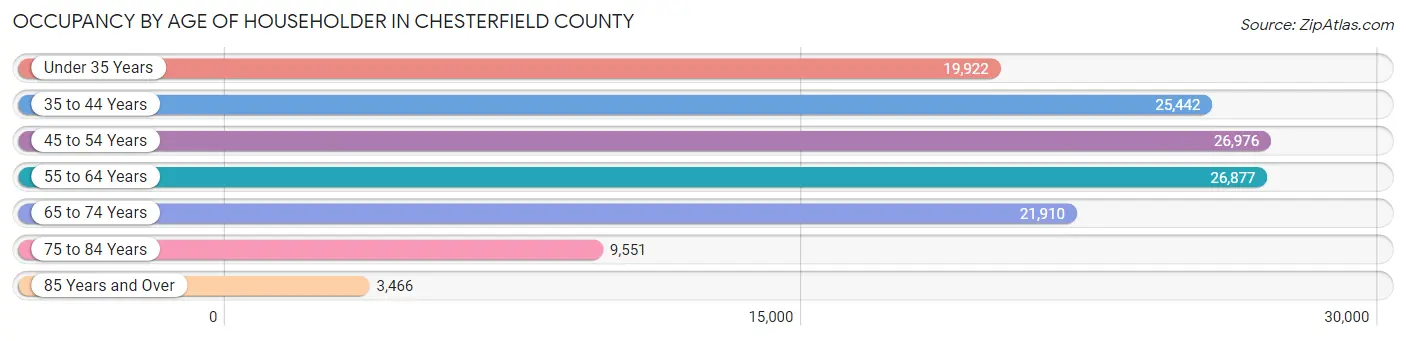
| Age Bracket | # Households | % Households |
| Under 35 Years | 19,922 | 14.8% |
| 35 to 44 Years | 25,442 | 19.0% |
| 45 to 54 Years | 26,976 | 20.1% |
| 55 to 64 Years | 26,877 | 20.0% |
| 65 to 74 Years | 21,910 | 16.3% |
| 75 to 84 Years | 9,551 | 7.1% |
| 85 Years and Over | 3,466 | 2.6% |
| Total | 134,144 | 100.0% |
Housing Finances in Chesterfield County
Median Income by Occupancy in Chesterfield County
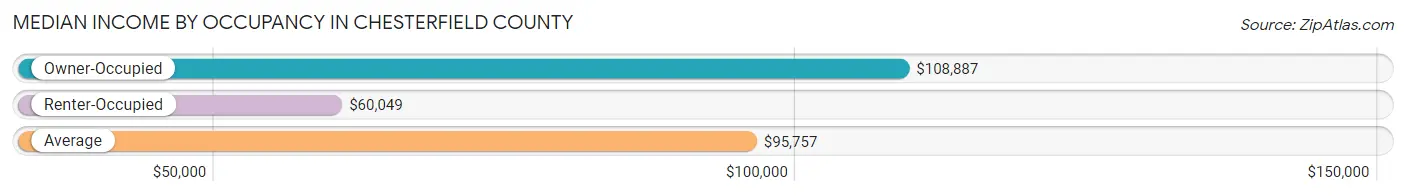
| Occupancy Type | # Households | Median Income |
| Owner-Occupied | 103,831 (77.4%) | $108,887 |
| Renter-Occupied | 30,313 (22.6%) | $60,049 |
| Average | 134,144 (100.0%) | $95,757 |
Occupancy by Householder Income Bracket in Chesterfield County
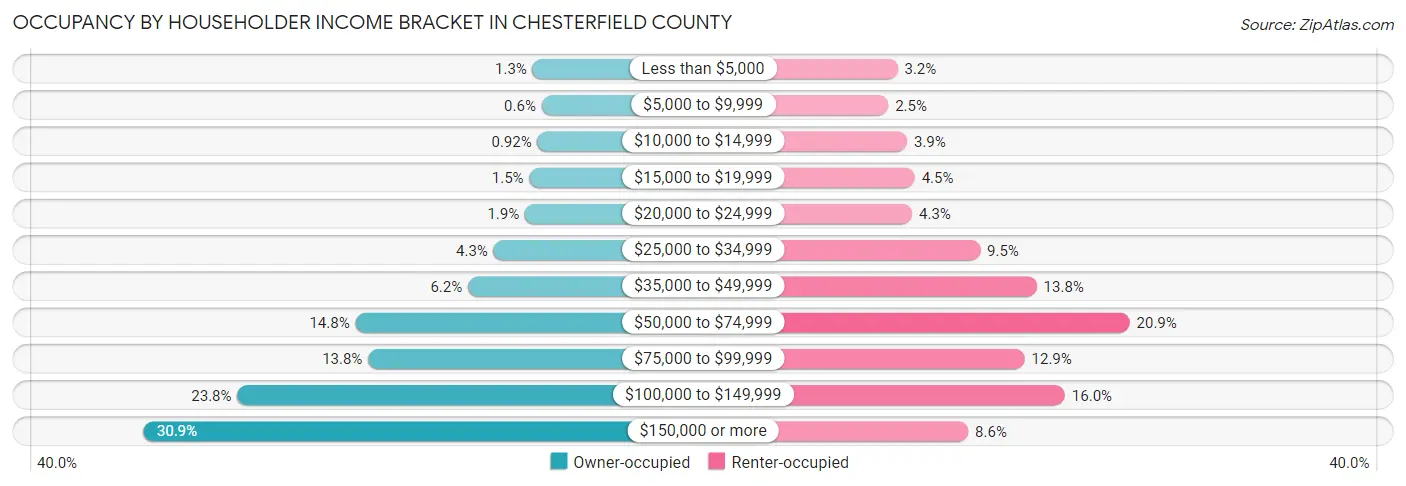
| Income Bracket | Owner-occupied | Renter-occupied |
| Less than $5,000 | 1,344 (1.3%) | 969 (3.2%) |
| $5,000 to $9,999 | 628 (0.6%) | 755 (2.5%) |
| $10,000 to $14,999 | 953 (0.9%) | 1,188 (3.9%) |
| $15,000 to $19,999 | 1,600 (1.5%) | 1,366 (4.5%) |
| $20,000 to $24,999 | 1,938 (1.9%) | 1,308 (4.3%) |
| $25,000 to $34,999 | 4,423 (4.3%) | 2,877 (9.5%) |
| $35,000 to $49,999 | 6,450 (6.2%) | 4,183 (13.8%) |
| $50,000 to $74,999 | 15,352 (14.8%) | 6,328 (20.9%) |
| $75,000 to $99,999 | 14,348 (13.8%) | 3,904 (12.9%) |
| $100,000 to $149,999 | 24,704 (23.8%) | 4,835 (16.0%) |
| $150,000 or more | 32,091 (30.9%) | 2,600 (8.6%) |
| Total | 103,831 (100.0%) | 30,313 (100.0%) |
Monthly Housing Cost Tiers in Chesterfield County
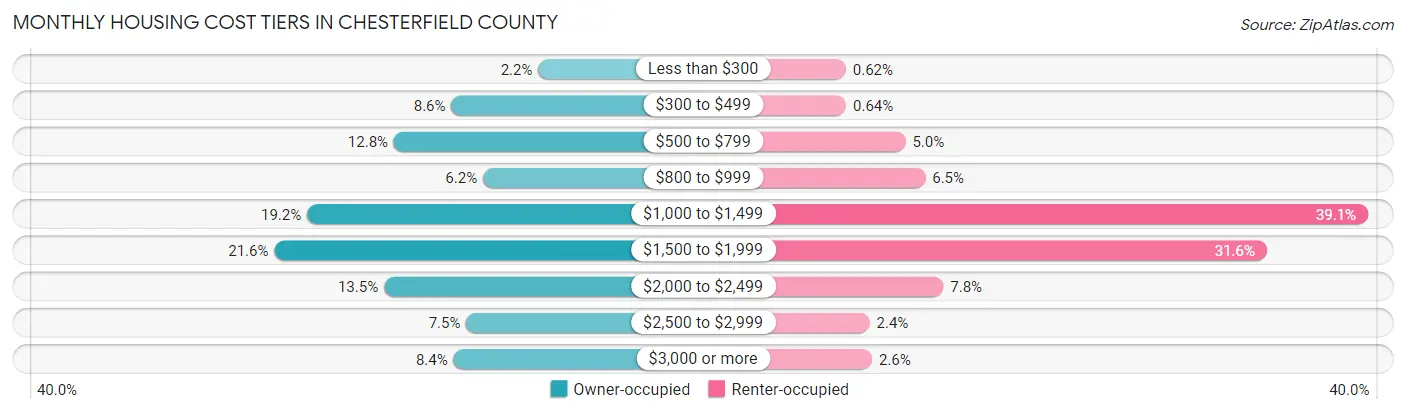
| Monthly Cost | Owner-occupied | Renter-occupied |
| Less than $300 | 2,258 (2.2%) | 189 (0.6%) |
| $300 to $499 | 8,898 (8.6%) | 194 (0.6%) |
| $500 to $799 | 13,288 (12.8%) | 1,520 (5.0%) |
| $800 to $999 | 6,476 (6.2%) | 1,960 (6.5%) |
| $1,000 to $1,499 | 19,934 (19.2%) | 11,843 (39.1%) |
| $1,500 to $1,999 | 22,443 (21.6%) | 9,586 (31.6%) |
| $2,000 to $2,499 | 14,053 (13.5%) | 2,363 (7.8%) |
| $2,500 to $2,999 | 7,754 (7.5%) | 718 (2.4%) |
| $3,000 or more | 8,727 (8.4%) | 774 (2.5%) |
| Total | 103,831 (100.0%) | 30,313 (100.0%) |
Physical Housing Characteristics in Chesterfield County
Housing Structures in Chesterfield County
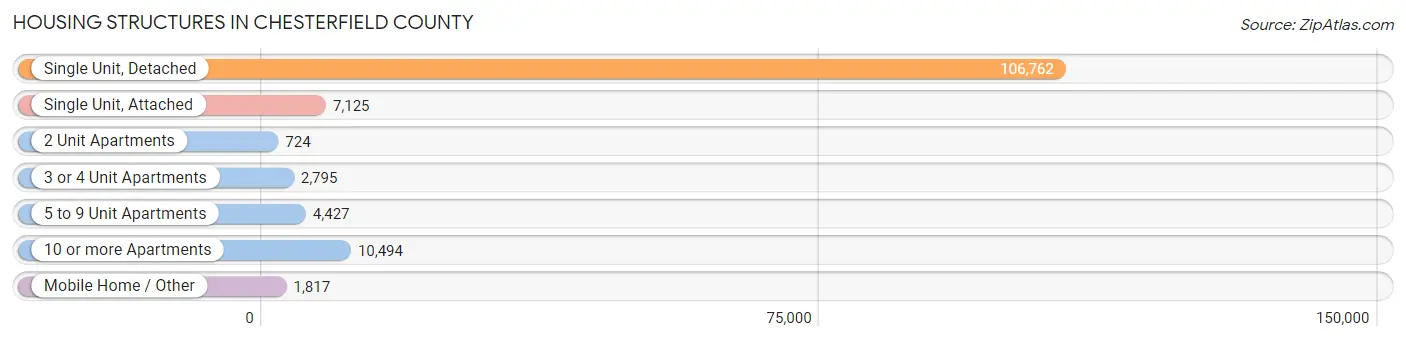
| Structure Type | # Housing Units | % Housing Units |
| Single Unit, Detached | 106,762 | 79.6% |
| Single Unit, Attached | 7,125 | 5.3% |
| 2 Unit Apartments | 724 | 0.5% |
| 3 or 4 Unit Apartments | 2,795 | 2.1% |
| 5 to 9 Unit Apartments | 4,427 | 3.3% |
| 10 or more Apartments | 10,494 | 7.8% |
| Mobile Home / Other | 1,817 | 1.3% |
| Total | 134,144 | 100.0% |
Housing Structures by Occupancy in Chesterfield County
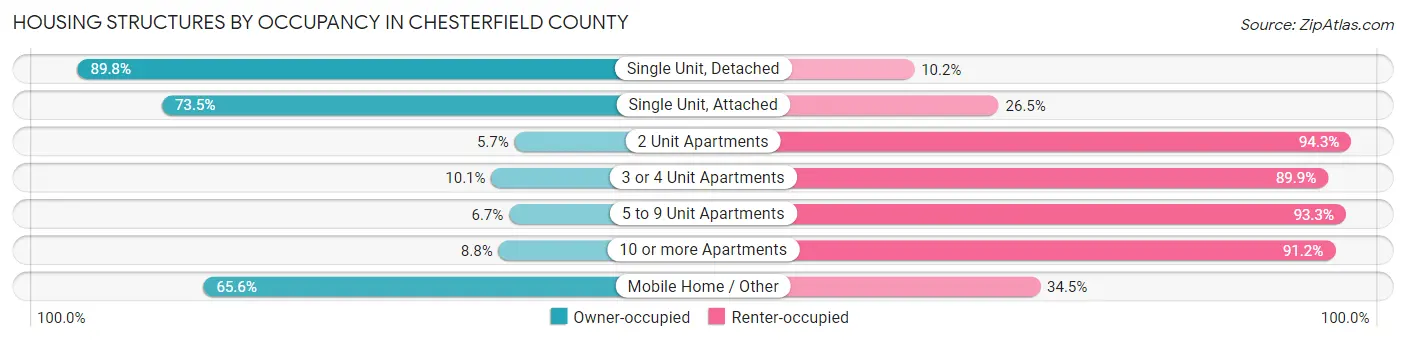
| Structure Type | Owner-occupied | Renter-occupied |
| Single Unit, Detached | 95,860 (89.8%) | 10,902 (10.2%) |
| Single Unit, Attached | 5,240 (73.5%) | 1,885 (26.5%) |
| 2 Unit Apartments | 41 (5.7%) | 683 (94.3%) |
| 3 or 4 Unit Apartments | 283 (10.1%) | 2,512 (89.9%) |
| 5 to 9 Unit Apartments | 297 (6.7%) | 4,130 (93.3%) |
| 10 or more Apartments | 919 (8.8%) | 9,575 (91.2%) |
| Mobile Home / Other | 1,191 (65.5%) | 626 (34.4%) |
| Total | 103,831 (77.4%) | 30,313 (22.6%) |
Housing Structures by Number of Rooms in Chesterfield County
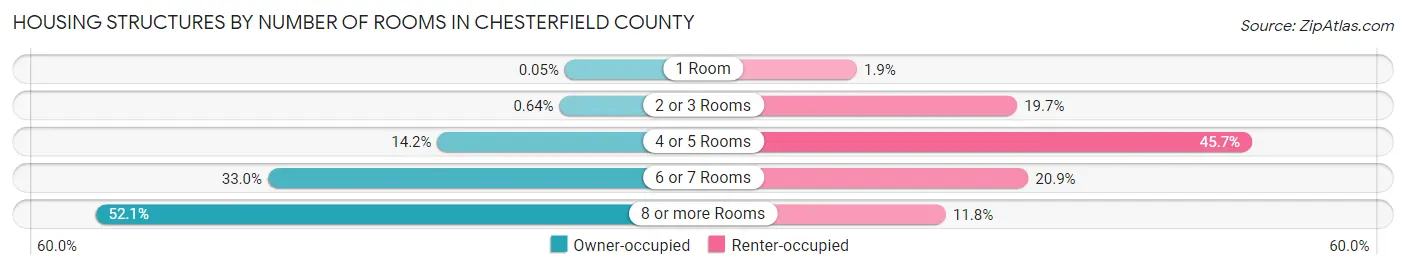
| Number of Rooms | Owner-occupied | Renter-occupied |
| 1 Room | 47 (0.1%) | 576 (1.9%) |
| 2 or 3 Rooms | 662 (0.6%) | 5,967 (19.7%) |
| 4 or 5 Rooms | 14,733 (14.2%) | 13,860 (45.7%) |
| 6 or 7 Rooms | 34,271 (33.0%) | 6,340 (20.9%) |
| 8 or more Rooms | 54,118 (52.1%) | 3,570 (11.8%) |
| Total | 103,831 (100.0%) | 30,313 (100.0%) |
Housing Structure by Heating Type in Chesterfield County
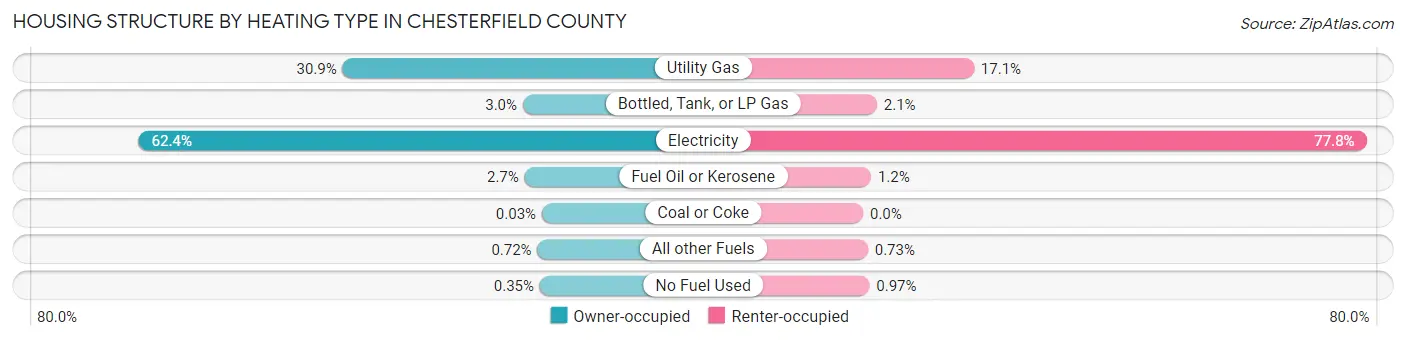
| Heating Type | Owner-occupied | Renter-occupied |
| Utility Gas | 32,032 (30.8%) | 5,197 (17.1%) |
| Bottled, Tank, or LP Gas | 3,087 (3.0%) | 646 (2.1%) |
| Electricity | 64,761 (62.4%) | 23,586 (77.8%) |
| Fuel Oil or Kerosene | 2,807 (2.7%) | 369 (1.2%) |
| Coal or Coke | 34 (0.0%) | 0 (0.0%) |
| All other Fuels | 744 (0.7%) | 222 (0.7%) |
| No Fuel Used | 366 (0.4%) | 293 (1.0%) |
| Total | 103,831 (100.0%) | 30,313 (100.0%) |
Household Vehicle Usage in Chesterfield County
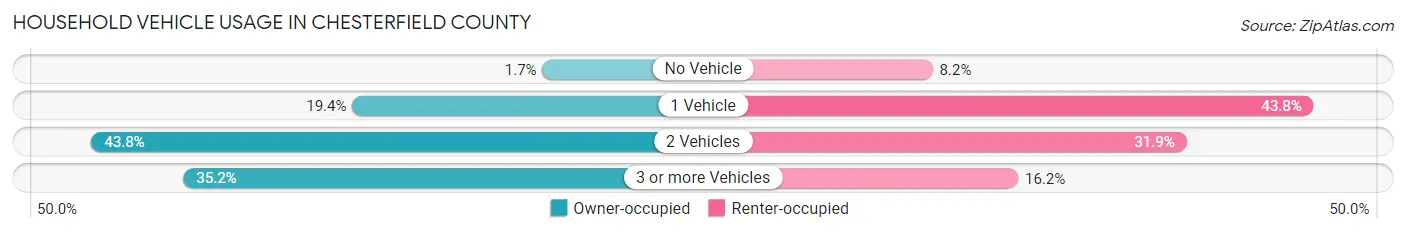
| Vehicles per Household | Owner-occupied | Renter-occupied |
| No Vehicle | 1,722 (1.7%) | 2,483 (8.2%) |
| 1 Vehicle | 20,151 (19.4%) | 13,263 (43.8%) |
| 2 Vehicles | 45,438 (43.8%) | 9,664 (31.9%) |
| 3 or more Vehicles | 36,520 (35.2%) | 4,903 (16.2%) |
| Total | 103,831 (100.0%) | 30,313 (100.0%) |
Real Estate & Mortgages in Chesterfield County
Real Estate and Mortgage Overview in Chesterfield County
| Characteristic | Without Mortgage | With Mortgage |
| Housing Units | 27,456 | 76,375 |
| Median Property Value | $293,600 | $311,800 |
| Median Household Income | $80,735 | $26,103 |
| Monthly Housing Costs | $563 | $8,672 |
| Real Estate Taxes | $2,506 | $2,257 |
Property Value by Mortgage Status in Chesterfield County
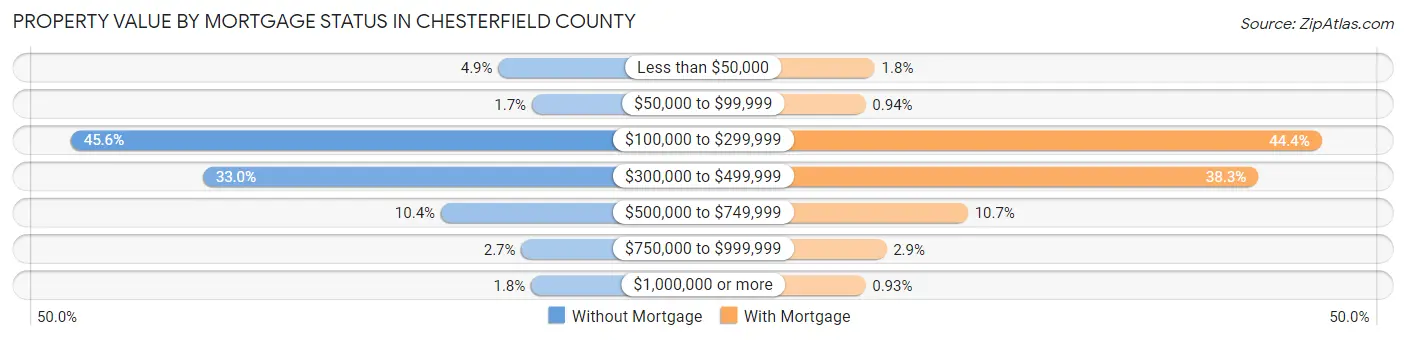
| Property Value | Without Mortgage | With Mortgage |
| Less than $50,000 | 1,340 (4.9%) | 1,387 (1.8%) |
| $50,000 to $99,999 | 460 (1.7%) | 719 (0.9%) |
| $100,000 to $299,999 | 12,521 (45.6%) | 33,889 (44.4%) |
| $300,000 to $499,999 | 9,069 (33.0%) | 29,282 (38.3%) |
| $500,000 to $749,999 | 2,843 (10.3%) | 8,155 (10.7%) |
| $750,000 to $999,999 | 739 (2.7%) | 2,231 (2.9%) |
| $1,000,000 or more | 484 (1.8%) | 712 (0.9%) |
| Total | 27,456 (100.0%) | 76,375 (100.0%) |
Household Income by Mortgage Status in Chesterfield County
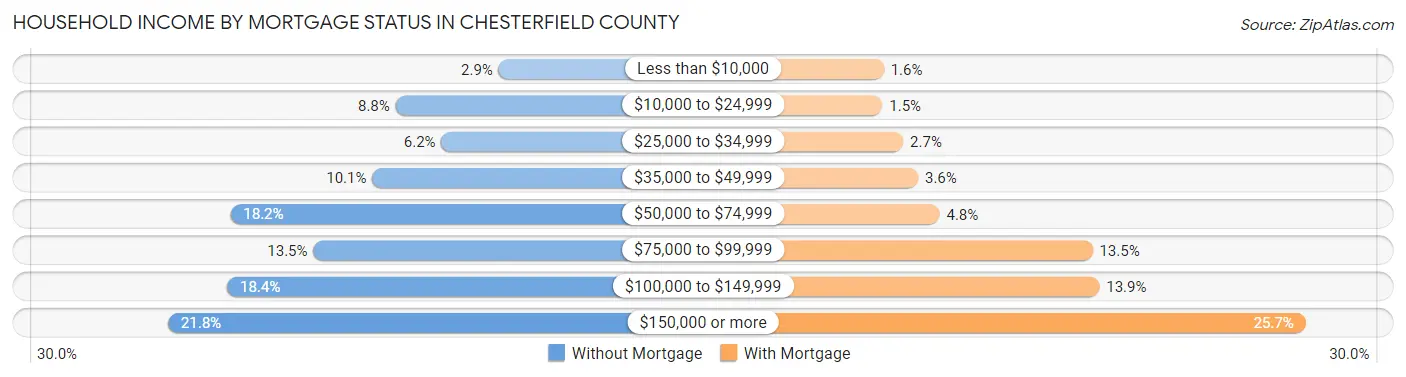
| Household Income | Without Mortgage | With Mortgage |
| Less than $10,000 | 800 (2.9%) | 1,228 (1.6%) |
| $10,000 to $24,999 | 2,416 (8.8%) | 1,172 (1.5%) |
| $25,000 to $34,999 | 1,697 (6.2%) | 2,075 (2.7%) |
| $35,000 to $49,999 | 2,781 (10.1%) | 2,726 (3.6%) |
| $50,000 to $74,999 | 5,008 (18.2%) | 3,669 (4.8%) |
| $75,000 to $99,999 | 3,706 (13.5%) | 10,344 (13.5%) |
| $100,000 to $149,999 | 5,060 (18.4%) | 10,642 (13.9%) |
| $150,000 or more | 5,988 (21.8%) | 19,644 (25.7%) |
| Total | 27,456 (100.0%) | 76,375 (100.0%) |
Property Value to Household Income Ratio in Chesterfield County
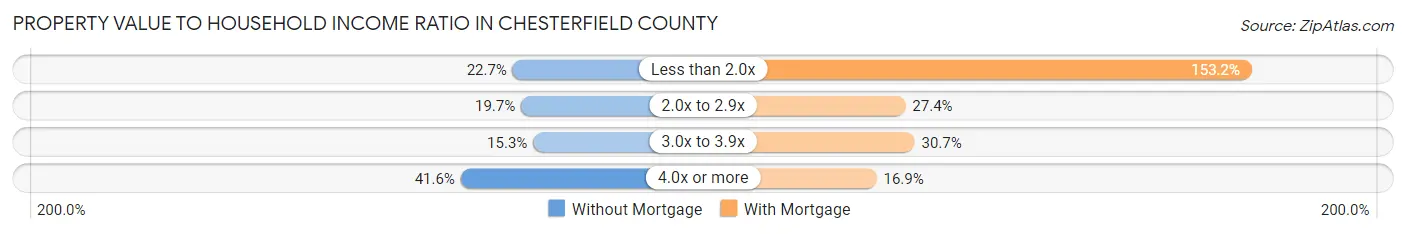
| Value-to-Income Ratio | Without Mortgage | With Mortgage |
| Less than 2.0x | 6,235 (22.7%) | 117,025 (153.2%) |
| 2.0x to 2.9x | 5,401 (19.7%) | 20,943 (27.4%) |
| 3.0x to 3.9x | 4,194 (15.3%) | 23,476 (30.7%) |
| 4.0x or more | 11,423 (41.6%) | 12,930 (16.9%) |
| Total | 27,456 (100.0%) | 76,375 (100.0%) |
Real Estate Taxes by Mortgage Status in Chesterfield County
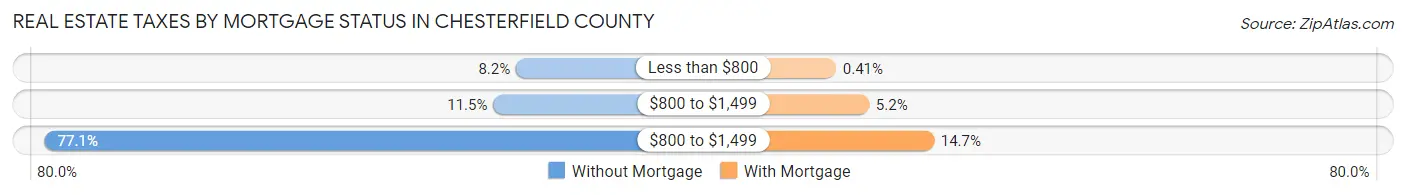
| Property Taxes | Without Mortgage | With Mortgage |
| Less than $800 | 2,250 (8.2%) | 311 (0.4%) |
| $800 to $1,499 | 3,163 (11.5%) | 4,005 (5.2%) |
| $800 to $1,499 | 21,159 (77.1%) | 11,240 (14.7%) |
| Total | 27,456 (100.0%) | 76,375 (100.0%) |
Health & Disability in Chesterfield County
Health Insurance Coverage by Age in Chesterfield County
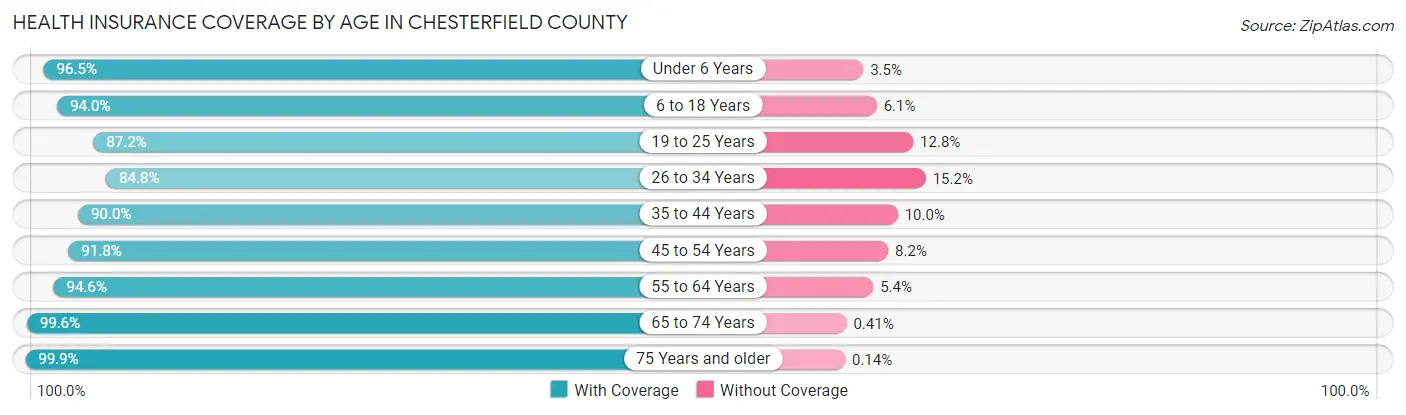
| Age Bracket | With Coverage | Without Coverage |
| Under 6 Years | 25,139 (96.5%) | 920 (3.5%) |
| 6 to 18 Years | 62,264 (94.0%) | 4,009 (6.0%) |
| 19 to 25 Years | 25,981 (87.2%) | 3,829 (12.8%) |
| 26 to 34 Years | 33,417 (84.8%) | 5,987 (15.2%) |
| 35 to 44 Years | 44,501 (90.0%) | 4,922 (10.0%) |
| 45 to 54 Years | 44,400 (91.8%) | 3,957 (8.2%) |
| 55 to 64 Years | 44,816 (94.6%) | 2,557 (5.4%) |
| 65 to 74 Years | 35,276 (99.6%) | 147 (0.4%) |
| 75 Years and older | 20,852 (99.9%) | 29 (0.1%) |
| Total | 336,646 (92.7%) | 26,357 (7.3%) |
Health Insurance Coverage by Citizenship Status in Chesterfield County
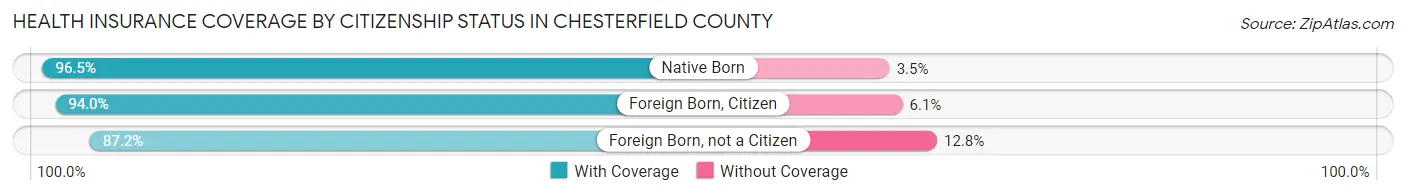
| Citizenship Status | With Coverage | Without Coverage |
| Native Born | 25,139 (96.5%) | 920 (3.5%) |
| Foreign Born, Citizen | 62,264 (94.0%) | 4,009 (6.0%) |
| Foreign Born, not a Citizen | 25,981 (87.2%) | 3,829 (12.8%) |
Health Insurance Coverage by Household Income in Chesterfield County
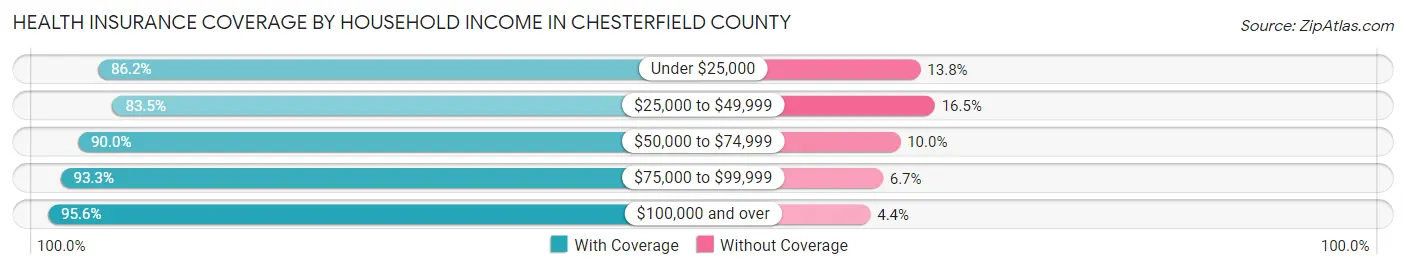
| Household Income | With Coverage | Without Coverage |
| Under $25,000 | 18,170 (86.2%) | 2,907 (13.8%) |
| $25,000 to $49,999 | 29,935 (83.5%) | 5,905 (16.5%) |
| $50,000 to $74,999 | 45,639 (90.0%) | 5,077 (10.0%) |
| $75,000 to $99,999 | 46,364 (93.3%) | 3,351 (6.7%) |
| $100,000 and over | 194,255 (95.6%) | 8,947 (4.4%) |
Public vs Private Health Insurance Coverage by Age in Chesterfield County
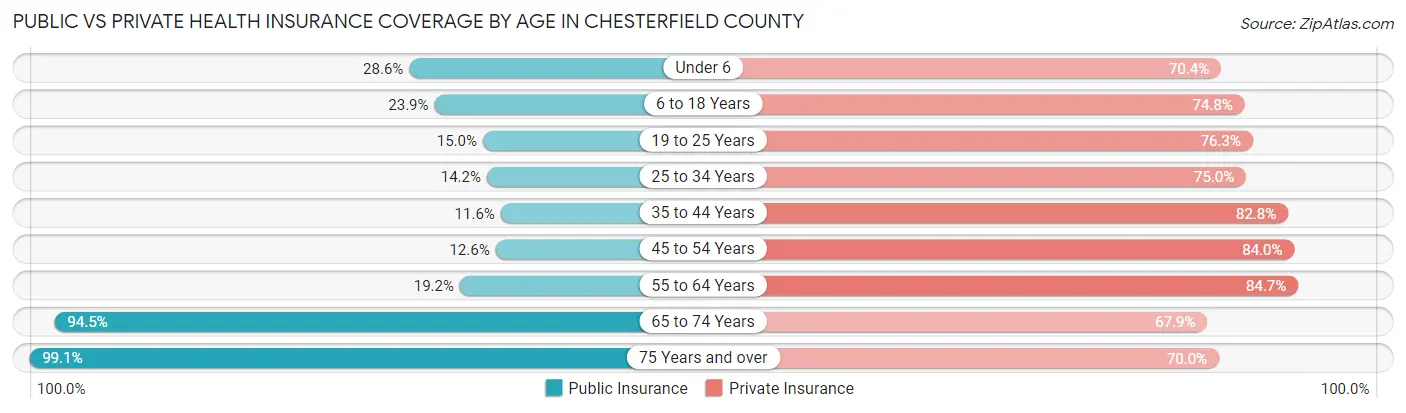
| Age Bracket | Public Insurance | Private Insurance |
| Under 6 | 7,459 (28.6%) | 18,346 (70.4%) |
| 6 to 18 Years | 15,866 (23.9%) | 49,552 (74.8%) |
| 19 to 25 Years | 4,457 (14.9%) | 22,737 (76.3%) |
| 25 to 34 Years | 5,601 (14.2%) | 29,564 (75.0%) |
| 35 to 44 Years | 5,754 (11.6%) | 40,939 (82.8%) |
| 45 to 54 Years | 6,095 (12.6%) | 40,609 (84.0%) |
| 55 to 64 Years | 9,107 (19.2%) | 40,121 (84.7%) |
| 65 to 74 Years | 33,459 (94.5%) | 24,036 (67.8%) |
| 75 Years and over | 20,699 (99.1%) | 14,617 (70.0%) |
| Total | 108,497 (29.9%) | 280,521 (77.3%) |
Disability Status by Sex by Age in Chesterfield County
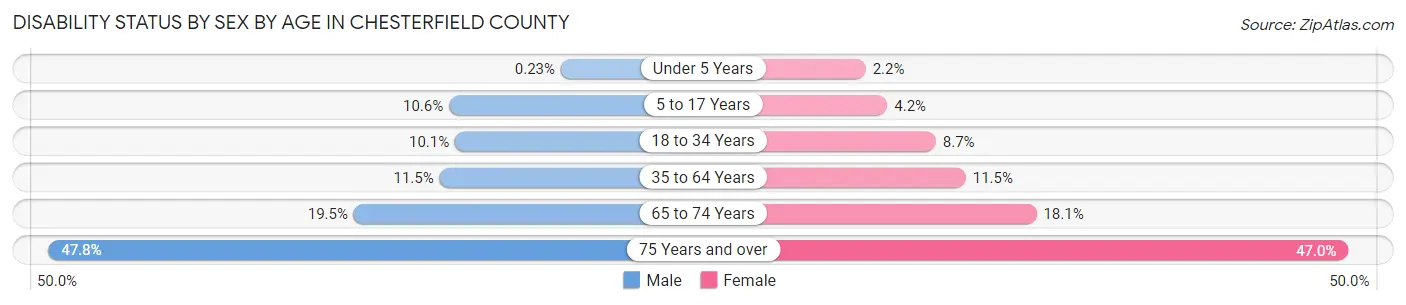
| Age Bracket | Male | Female |
| Under 5 Years | 25 (0.2%) | 231 (2.2%) |
| 5 to 17 Years | 3,509 (10.6%) | 1,335 (4.2%) |
| 18 to 34 Years | 3,679 (10.1%) | 3,398 (8.7%) |
| 35 to 64 Years | 7,996 (11.5%) | 8,695 (11.5%) |
| 65 to 74 Years | 3,168 (19.5%) | 3,458 (18.1%) |
| 75 Years and over | 4,151 (47.8%) | 5,732 (47.0%) |
Disability Class by Sex by Age in Chesterfield County
Disability Class: Hearing Difficulty
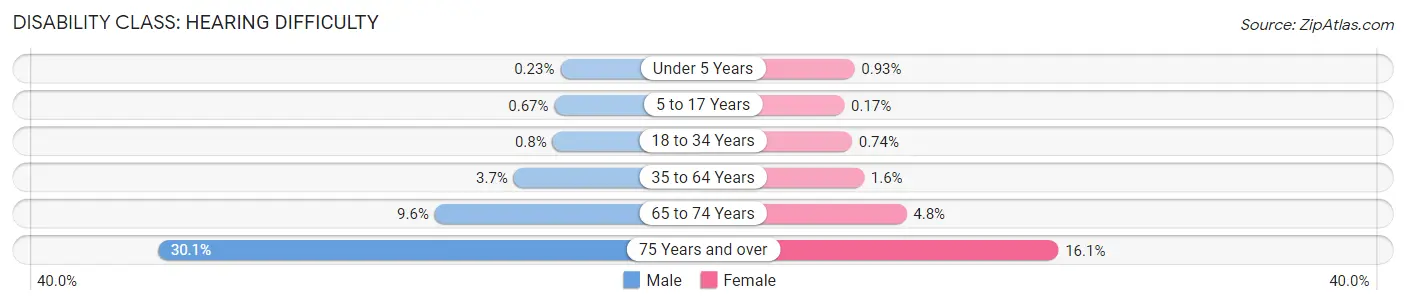
| Age Bracket | Male | Female |
| Under 5 Years | 25 (0.2%) | 97 (0.9%) |
| 5 to 17 Years | 223 (0.7%) | 53 (0.2%) |
| 18 to 34 Years | 292 (0.8%) | 288 (0.7%) |
| 35 to 64 Years | 2,571 (3.7%) | 1,236 (1.6%) |
| 65 to 74 Years | 1,555 (9.6%) | 916 (4.8%) |
| 75 Years and over | 2,615 (30.1%) | 1,960 (16.1%) |
Disability Class: Vision Difficulty
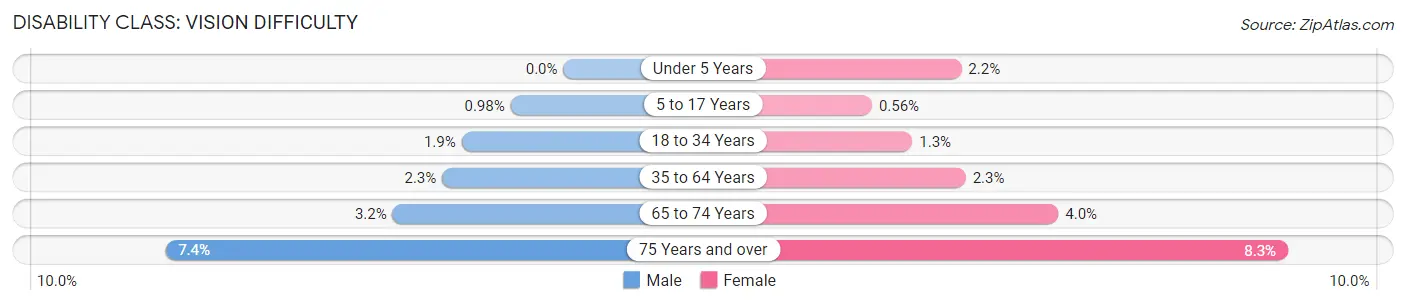
| Age Bracket | Male | Female |
| Under 5 Years | 0 (0.0%) | 231 (2.2%) |
| 5 to 17 Years | 325 (1.0%) | 178 (0.6%) |
| 18 to 34 Years | 690 (1.9%) | 511 (1.3%) |
| 35 to 64 Years | 1,567 (2.2%) | 1,735 (2.3%) |
| 65 to 74 Years | 516 (3.2%) | 769 (4.0%) |
| 75 Years and over | 642 (7.4%) | 1,010 (8.3%) |
Disability Class: Cognitive Difficulty
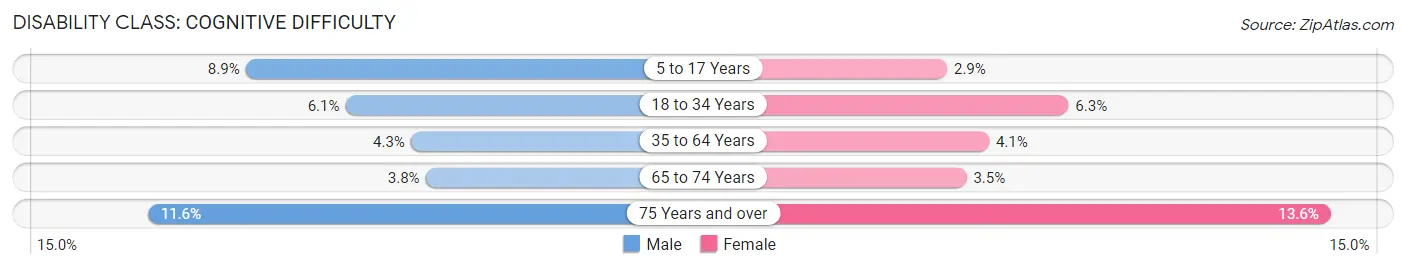
| Age Bracket | Male | Female |
| 5 to 17 Years | 2,929 (8.8%) | 924 (2.9%) |
| 18 to 34 Years | 2,223 (6.1%) | 2,456 (6.3%) |
| 35 to 64 Years | 2,955 (4.3%) | 3,098 (4.1%) |
| 65 to 74 Years | 625 (3.8%) | 664 (3.5%) |
| 75 Years and over | 1,005 (11.6%) | 1,660 (13.6%) |
Disability Class: Ambulatory Difficulty
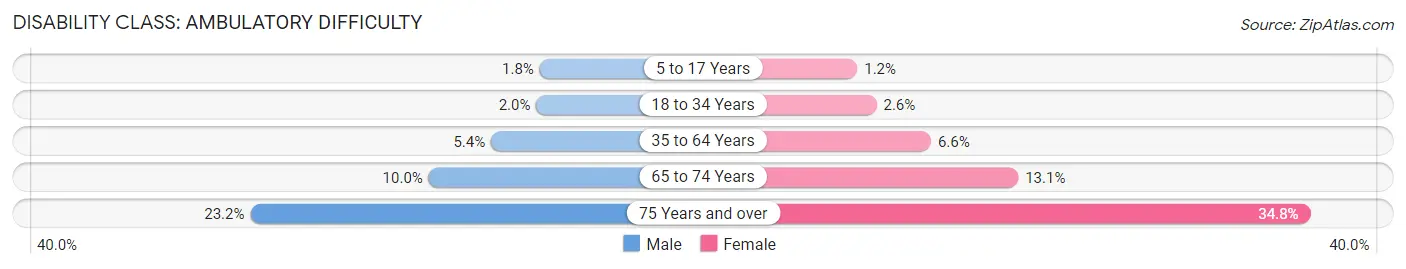
| Age Bracket | Male | Female |
| 5 to 17 Years | 581 (1.8%) | 364 (1.1%) |
| 18 to 34 Years | 736 (2.0%) | 1,004 (2.6%) |
| 35 to 64 Years | 3,740 (5.4%) | 5,003 (6.6%) |
| 65 to 74 Years | 1,629 (10.0%) | 2,507 (13.1%) |
| 75 Years and over | 2,018 (23.2%) | 4,243 (34.8%) |
Disability Class: Self-Care Difficulty
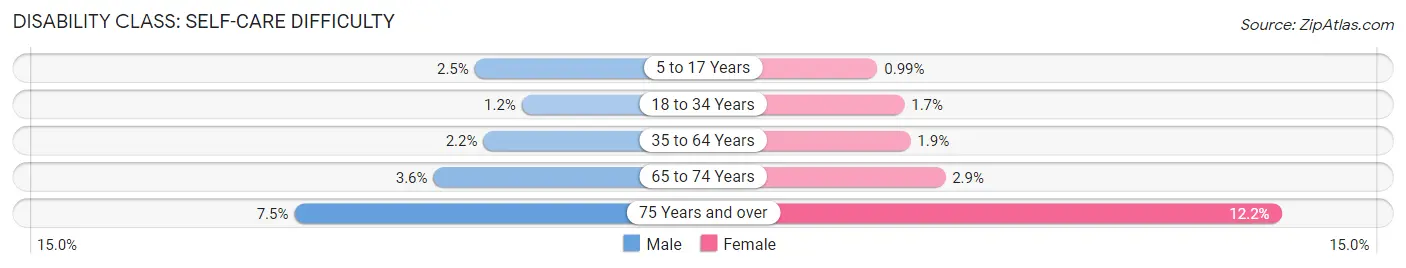
| Age Bracket | Male | Female |
| 5 to 17 Years | 816 (2.5%) | 311 (1.0%) |
| 18 to 34 Years | 425 (1.2%) | 679 (1.7%) |
| 35 to 64 Years | 1,554 (2.2%) | 1,441 (1.9%) |
| 65 to 74 Years | 589 (3.6%) | 552 (2.9%) |
| 75 Years and over | 650 (7.5%) | 1,493 (12.2%) |
Technology Access in Chesterfield County
Computing Device Access in Chesterfield County
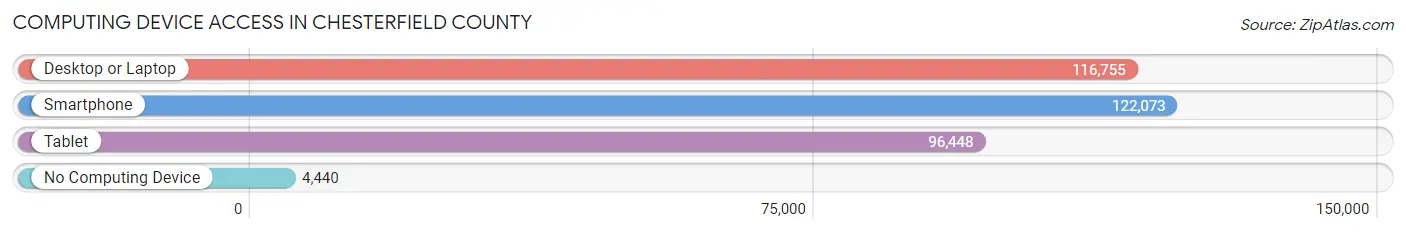
| Device Type | # Households | % Households |
| Desktop or Laptop | 116,755 | 87.0% |
| Smartphone | 122,073 | 91.0% |
| Tablet | 96,448 | 71.9% |
| No Computing Device | 4,440 | 3.3% |
| Total | 134,144 | 100.0% |
Internet Access in Chesterfield County
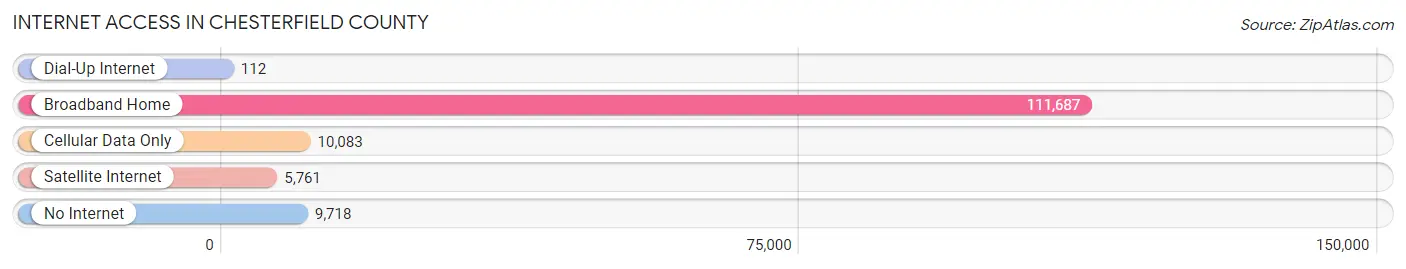
| Internet Type | # Households | % Households |
| Dial-Up Internet | 112 | 0.1% |
| Broadband Home | 111,687 | 83.3% |
| Cellular Data Only | 10,083 | 7.5% |
| Satellite Internet | 5,761 | 4.3% |
| No Internet | 9,718 | 7.2% |
| Total | 134,144 | 100.0% |
Chesterfield County Summary
Chesterfield County, Virginia is located in the central part of the state, just south of the state capital of Richmond. It is bordered by Powhatan County to the north, Amelia County to the east, Dinwiddie County to the south, and the City of Richmond to the west. The county is part of the Greater Richmond Region and is home to over 330,000 people.
History
Chesterfield County was formed in 1749 from parts of Henrico and Prince George Counties. It was named for Philip Stanhope, 4th Earl of Chesterfield, who was a British statesman and diplomat. The county was originally home to the Monacan Indian tribe, who were later displaced by English settlers. The county was an important center of tobacco production in the 18th and 19th centuries, and the county seat of Chesterfield Court House was established in 1752.
During the American Civil War, the county was the site of several battles, including the Battle of Drewry’s Bluff and the Battle of Chesterfield Court House. The county was also the site of the Battle of Appomattox Court House, which marked the end of the war.
Geography
Chesterfield County covers an area of 437 square miles and is located in the Piedmont region of Virginia. The county is mostly flat, with some rolling hills in the northern and western parts of the county. The James River forms the northern border of the county, and the Appomattox River forms the eastern border. The county is home to several state parks, including Pocahontas State Park, Dutch Gap Conservation Area, and James River Park.
Economy
Chesterfield County has a diverse economy, with a mix of manufacturing, retail, and service industries. The county is home to several large employers, including Philip Morris USA, Capital One, and DuPont. The county is also home to several military installations, including Fort Lee and the Defense Supply Center Richmond.
The county’s unemployment rate was 4.2% in 2019, which is lower than the state average of 3.7%. The median household income in the county was $77,845 in 2019, which is higher than the state average of $71,535.
Demographics
As of 2019, Chesterfield County had a population of 330,717 people. The population is racially diverse, with White (71.2%), Black or African American (19.2%), Hispanic or Latino (5.7%), Asian (2.7%), and other races (1.2%) making up the population. The median age in the county is 38.7 years, and the population is evenly split between males and females.
The county is home to several large cities, including Chesterfield (population: 47,717), Midlothian (population: 41,945), and Colonial Heights (population: 17,717). The county also has several smaller towns, including Matoaca (population: 4,845), Ettrick (population: 2,845), and Bon Air (population: 2,717).
Conclusion
Chesterfield County, Virginia is a diverse and vibrant county located in the central part of the state. It has a rich history, with a mix of Native American, English, and African American influences. The county is home to several large employers, military installations, and state parks, and has a diverse economy. The population is racially diverse, with a median age of 38.7 years. Chesterfield County is an important part of the Greater Richmond Region and is an attractive place to live and work.
Common Questions
What is Per Capita Income in Chesterfield County?
Per Capita income in Chesterfield County is $45,041.
What is the Median Family Income in Chesterfield County?
Median Family Income in Chesterfield County is $113,336.
What is the Median Household income in Chesterfield County?
Median Household Income in Chesterfield County is $95,757.
What is Income or Wage Gap in Chesterfield County?
Income or Wage Gap in Chesterfield County is 22.9%.
Women in Chesterfield County earn 77.1 cents for every dollar earned by a man.
What is Family Income Deficit in Chesterfield County?
Family Income Deficit in Chesterfield County is $12,259.
Families that are below poverty line in Chesterfield County earn $12,259 less on average than the poverty threshold level.
What is Inequality or Gini Index in Chesterfield County?
Inequality or Gini Index in Chesterfield County is 0.42.
What is the Total Population of Chesterfield County?
Total Population of Chesterfield County is 366,019.
What is the Total Male Population of Chesterfield County?
Total Male Population of Chesterfield County is 177,338.
What is the Total Female Population of Chesterfield County?
Total Female Population of Chesterfield County is 188,681.
What is the Ratio of Males per 100 Females in Chesterfield County?
There are 93.99 Males per 100 Females in Chesterfield County.
What is the Ratio of Females per 100 Males in Chesterfield County?
There are 106.40 Females per 100 Males in Chesterfield County.
What is the Median Population Age in Chesterfield County?
Median Population Age in Chesterfield County is 38.9 Years.
What is the Average Family Size in Chesterfield County
Average Family Size in Chesterfield County is 3.2 People.
What is the Average Household Size in Chesterfield County
Average Household Size in Chesterfield County is 2.7 People.
How Large is the Labor Force in Chesterfield County?
There are 197,088 People in the Labor Forcein in Chesterfield County.
What is the Percentage of People in the Labor Force in Chesterfield County?
67.9% of People are in the Labor Force in Chesterfield County.
What is the Unemployment Rate in Chesterfield County?
Unemployment Rate in Chesterfield County is 4.7%.