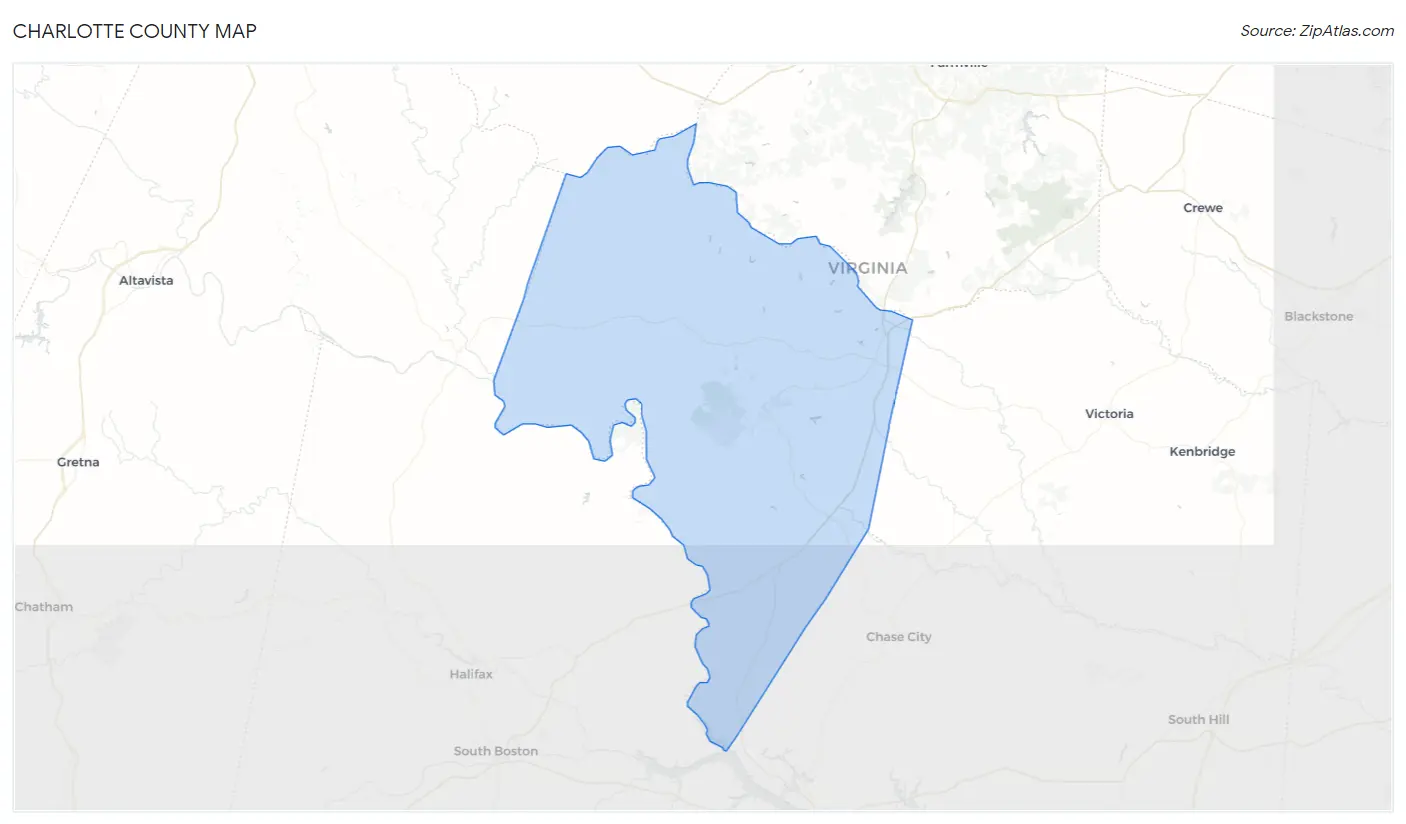
Charlotte County, VA Map & Demographics
Charlotte County Map
Charlotte County Overview
$27,159
PER CAPITA INCOME
$70,183
AVG FAMILY INCOME
$51,548
AVG HOUSEHOLD INCOME
28.3%
WAGE / INCOME GAP [ % ]
71.7¢/ $1
WAGE / INCOME GAP [ $ ]
$9,585
FAMILY INCOME DEFICIT
0.46
INEQUALITY / GINI INDEX
11,563
TOTAL POPULATION
5,865
MALE POPULATION
5,698
FEMALE POPULATION
102.93
MALES / 100 FEMALES
97.15
FEMALES / 100 MALES
45.4
MEDIAN AGE
3.2
AVG FAMILY SIZE
2.5
AVG HOUSEHOLD SIZE
4,867
LABOR FORCE [ PEOPLE ]
52.7%
PERCENT IN LABOR FORCE
3.6%
UNEMPLOYMENT RATE
Charlotte County Area Codes
Income in Charlotte County
Income Overview in Charlotte County
Per Capita Income in Charlotte County is $27,159, while median incomes of families and households are $70,183 and $51,548 respectively.
| Characteristic | Number | Measure |
| Per Capita Income | 11,563 | $27,159 |
| Median Family Income | 2,783 | $70,183 |
| Mean Family Income | 2,783 | $82,169 |
| Median Household Income | 4,540 | $51,548 |
| Mean Household Income | 4,540 | $65,796 |
| Income Deficit | 2,783 | $9,585 |
| Wage / Income Gap (%) | 11,563 | 28.28% |
| Wage / Income Gap ($) | 11,563 | 71.72¢ per $1 |
| Gini / Inequality Index | 11,563 | 0.46 |
Earnings by Sex in Charlotte County
Average Earnings in Charlotte County are $34,379, $40,320 for men and $28,916 for women, a difference of 28.3%.
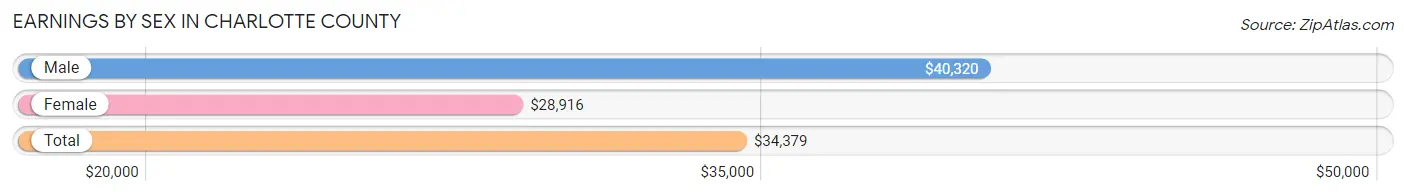
| Sex | Number | Average Earnings |
| Male | 2,443 (49.2%) | $40,320 |
| Female | 2,522 (50.8%) | $28,916 |
| Total | 4,965 (100.0%) | $34,379 |
Earnings by Sex by Income Bracket in Charlotte County
The most common earnings brackets in Charlotte County are $30,000 to $34,999 for men (278 | 11.4%) and $25,000 to $29,999 for women (287 | 11.4%).
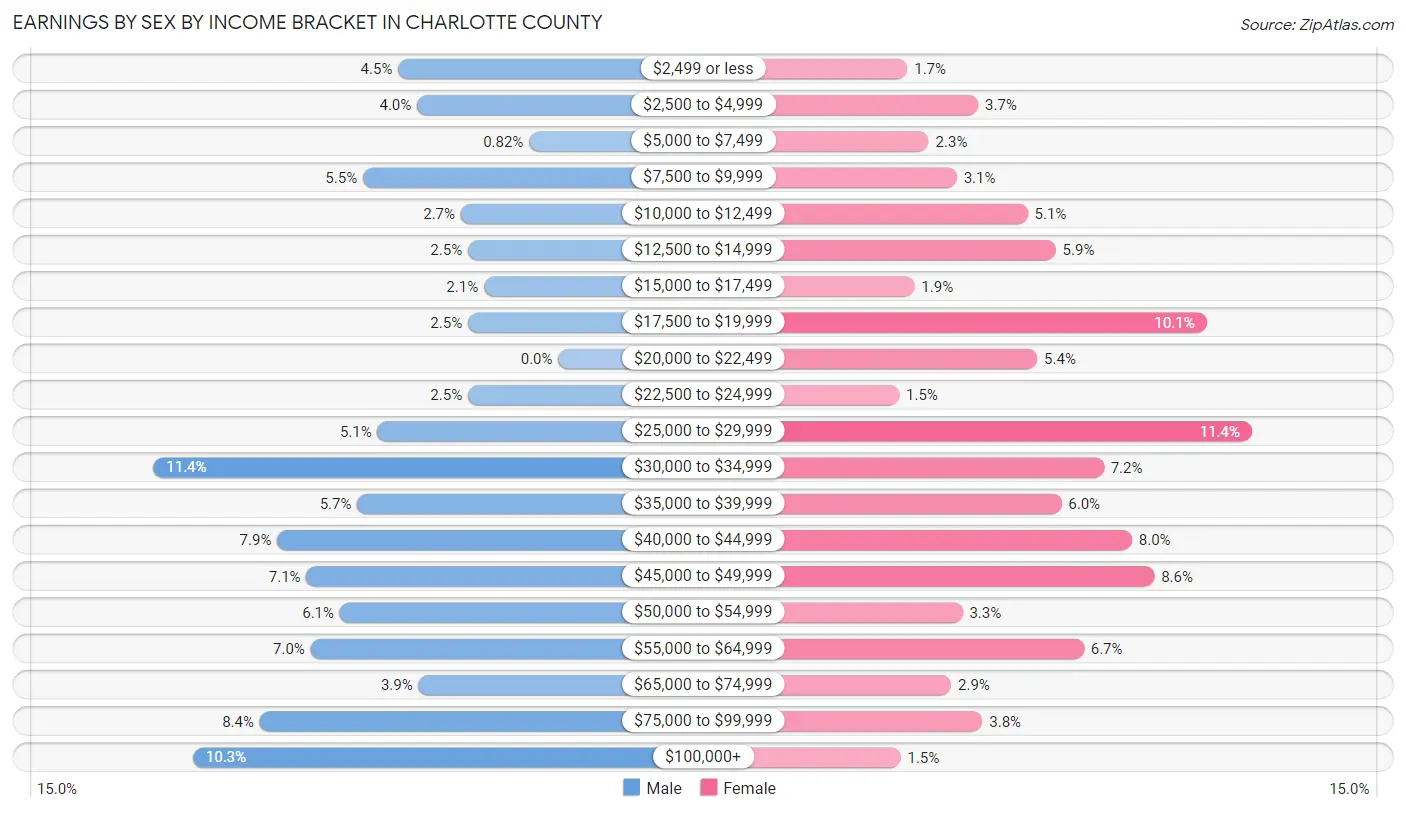
| Income | Male | Female |
| $2,499 or less | 110 (4.5%) | 43 (1.7%) |
| $2,500 to $4,999 | 97 (4.0%) | 93 (3.7%) |
| $5,000 to $7,499 | 20 (0.8%) | 58 (2.3%) |
| $7,500 to $9,999 | 134 (5.5%) | 78 (3.1%) |
| $10,000 to $12,499 | 67 (2.7%) | 128 (5.1%) |
| $12,500 to $14,999 | 62 (2.5%) | 148 (5.9%) |
| $15,000 to $17,499 | 51 (2.1%) | 48 (1.9%) |
| $17,500 to $19,999 | 62 (2.5%) | 255 (10.1%) |
| $20,000 to $22,499 | 0 (0.0%) | 135 (5.3%) |
| $22,500 to $24,999 | 62 (2.5%) | 37 (1.5%) |
| $25,000 to $29,999 | 124 (5.1%) | 287 (11.4%) |
| $30,000 to $34,999 | 278 (11.4%) | 182 (7.2%) |
| $35,000 to $39,999 | 138 (5.7%) | 152 (6.0%) |
| $40,000 to $44,999 | 193 (7.9%) | 202 (8.0%) |
| $45,000 to $49,999 | 173 (7.1%) | 218 (8.6%) |
| $50,000 to $54,999 | 150 (6.1%) | 82 (3.3%) |
| $55,000 to $64,999 | 170 (7.0%) | 168 (6.7%) |
| $65,000 to $74,999 | 96 (3.9%) | 74 (2.9%) |
| $75,000 to $99,999 | 205 (8.4%) | 96 (3.8%) |
| $100,000+ | 251 (10.3%) | 38 (1.5%) |
| Total | 2,443 (100.0%) | 2,522 (100.0%) |
Earnings by Sex by Educational Attainment in Charlotte County
Average earnings in Charlotte County are $42,891 for men and $32,772 for women, a difference of 23.6%. Men with an educational attainment of bachelor's degree enjoy the highest average annual earnings of $82,632, while those with less than high school education earn the least with $35,993. Women with an educational attainment of graduate degree earn the most with the average annual earnings of $50,865, while those with less than high school education have the smallest earnings of $19,205.
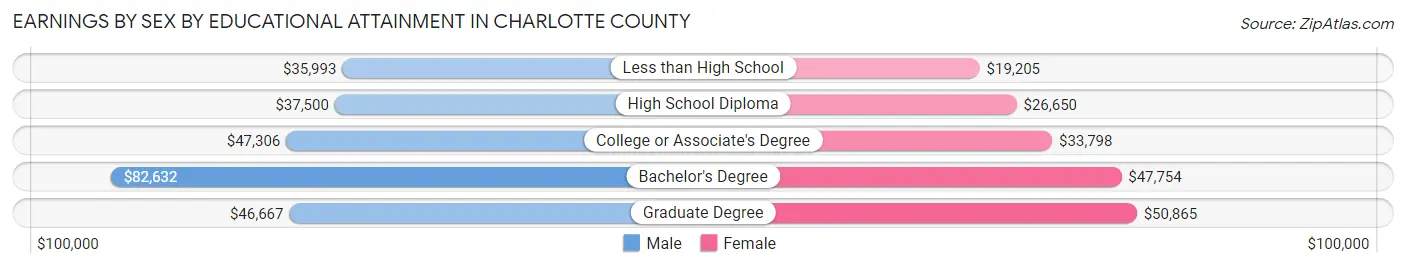
| Educational Attainment | Male Income | Female Income |
| Less than High School | $35,993 | $19,205 |
| High School Diploma | $37,500 | $26,650 |
| College or Associate's Degree | $47,306 | $33,798 |
| Bachelor's Degree | $82,632 | $47,754 |
| Graduate Degree | $46,667 | $50,865 |
| Total | $42,891 | $32,772 |
Family Income in Charlotte County
Family Income Brackets in Charlotte County
According to the Charlotte County family income data, there are 512 families falling into the $100,000 to $149,999 income range, which is the most common income bracket and makes up 18.4% of all families. Conversely, the $200,000+ income bracket is the least frequent group with only 47 families (1.7%) belonging to this category.
| Income Bracket | # Families | % Families |
| Less than $10,000 | 181 | 6.5% |
| $10,000 to $14,999 | 134 | 4.8% |
| $15,000 to $24,999 | 239 | 8.6% |
| $25,000 to $34,999 | 192 | 6.9% |
| $35,000 to $49,999 | 273 | 9.8% |
| $50,000 to $74,999 | 476 | 17.1% |
| $75,000 to $99,999 | 465 | 16.7% |
| $100,000 to $149,999 | 512 | 18.4% |
| $150,000 to $199,999 | 267 | 9.6% |
| $200,000+ | 47 | 1.7% |
Family Income by Famaliy Size in Charlotte County
3-person families (451 | 16.2%) account for the highest median family income in Charlotte County with $88,018 per family, while 2-person families (1,589 | 57.1%) have the highest median income of $32,691 per family member.
| Income Bracket | # Families | Median Income |
| 2-Person Families | 1,589 (57.1%) | $65,382 |
| 3-Person Families | 451 (16.2%) | $88,018 |
| 4-Person Families | 519 (18.6%) | $82,463 |
| 5-Person Families | 124 (4.5%) | $76,583 |
| 6-Person Families | 59 (2.1%) | $0 |
| 7+ Person Families | 41 (1.5%) | $0 |
| Total | 2,783 (100.0%) | $70,183 |
Family Income by Number of Earners in Charlotte County
The median family income in Charlotte County is $70,183, with families comprising 2 earners (1,008) having the highest median family income of $103,438, while families with no earners (721) have the lowest median family income of $24,943, accounting for 36.2% and 25.9% of families, respectively.
| Number of Earners | # Families | Median Income |
| No Earners | 721 (25.9%) | $24,943 |
| 1 Earner | 865 (31.1%) | $41,549 |
| 2 Earners | 1,008 (36.2%) | $103,438 |
| 3+ Earners | 189 (6.8%) | $88,350 |
| Total | 2,783 (100.0%) | $70,183 |
Household Income in Charlotte County
Household Income Brackets in Charlotte County
With 799 households falling in the category, the $50,000 to $74,999 income range is the most frequent in Charlotte County, accounting for 17.6% of all households. In contrast, only 50 households (1.1%) fall into the $200,000+ income bracket, making it the least populous group.
| Income Bracket | # Households | % Households |
| Less than $10,000 | 268 | 5.9% |
| $10,000 to $14,999 | 390 | 8.6% |
| $15,000 to $24,999 | 636 | 14.0% |
| $25,000 to $34,999 | 413 | 9.1% |
| $35,000 to $49,999 | 536 | 11.8% |
| $50,000 to $74,999 | 799 | 17.6% |
| $75,000 to $99,999 | 572 | 12.6% |
| $100,000 to $149,999 | 613 | 13.5% |
| $150,000 to $199,999 | 268 | 5.9% |
| $200,000+ | 50 | 1.1% |
Household Income by Householder Age in Charlotte County
The median household income in Charlotte County is $51,548, with the highest median household income of $69,514 found in the 25 to 44 years age bracket for the primary householder. A total of 1,077 households (23.7%) fall into this category. Meanwhile, the 15 to 24 years age bracket for the primary householder has the lowest median household income of $30,096, with 51 households (1.1%) in this group.
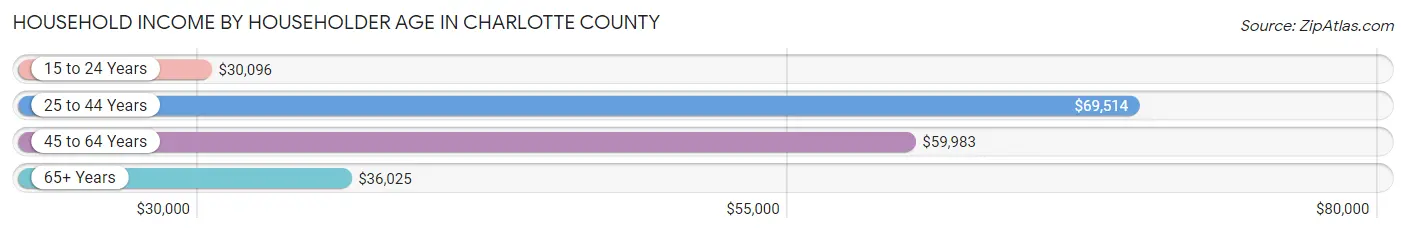
| Income Bracket | # Households | Median Income |
| 15 to 24 Years | 51 (1.1%) | $30,096 |
| 25 to 44 Years | 1,077 (23.7%) | $69,514 |
| 45 to 64 Years | 1,785 (39.3%) | $59,983 |
| 65+ Years | 1,627 (35.8%) | $36,025 |
| Total | 4,540 (100.0%) | $51,548 |
Poverty in Charlotte County
Income Below Poverty by Sex and Age in Charlotte County
With 18.2% poverty level for males and 22.5% for females among the residents of Charlotte County, 15 year old males and 5 year old females are the most vulnerable to poverty, with 87 males (49.7%) and 23 females (47.9%) in their respective age groups living below the poverty level.
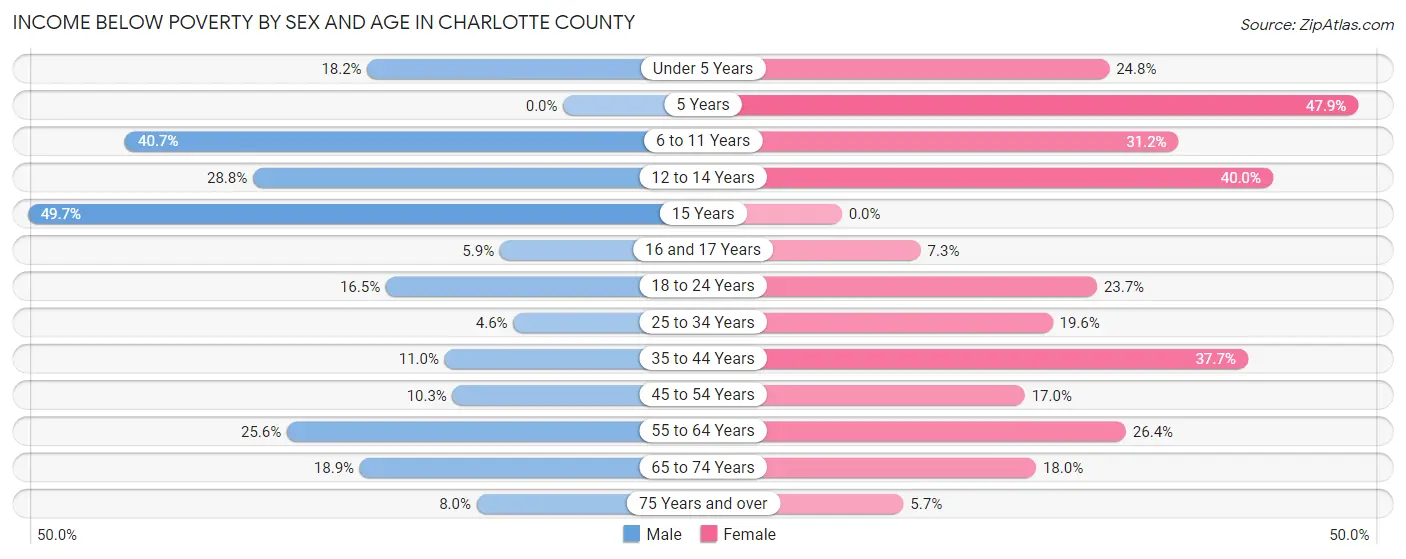
| Age Bracket | Male | Female |
| Under 5 Years | 60 (18.2%) | 70 (24.8%) |
| 5 Years | 0 (0.0%) | 23 (47.9%) |
| 6 to 11 Years | 181 (40.7%) | 144 (31.2%) |
| 12 to 14 Years | 72 (28.8%) | 56 (40.0%) |
| 15 Years | 87 (49.7%) | 0 (0.0%) |
| 16 and 17 Years | 12 (5.9%) | 3 (7.3%) |
| 18 to 24 Years | 79 (16.5%) | 81 (23.7%) |
| 25 to 34 Years | 26 (4.6%) | 125 (19.6%) |
| 35 to 44 Years | 53 (11.0%) | 226 (37.7%) |
| 45 to 54 Years | 72 (10.3%) | 116 (17.0%) |
| 55 to 64 Years | 240 (25.6%) | 240 (26.4%) |
| 65 to 74 Years | 131 (18.9%) | 135 (18.0%) |
| 75 Years and over | 37 (8.0%) | 35 (5.7%) |
| Total | 1,050 (18.2%) | 1,254 (22.5%) |
Income Above Poverty by Sex and Age in Charlotte County
According to the poverty statistics in Charlotte County, males aged 5 years and females aged 15 years are the age groups that are most secure financially, with 100.0% of males and 100.0% of females in these age groups living above the poverty line.
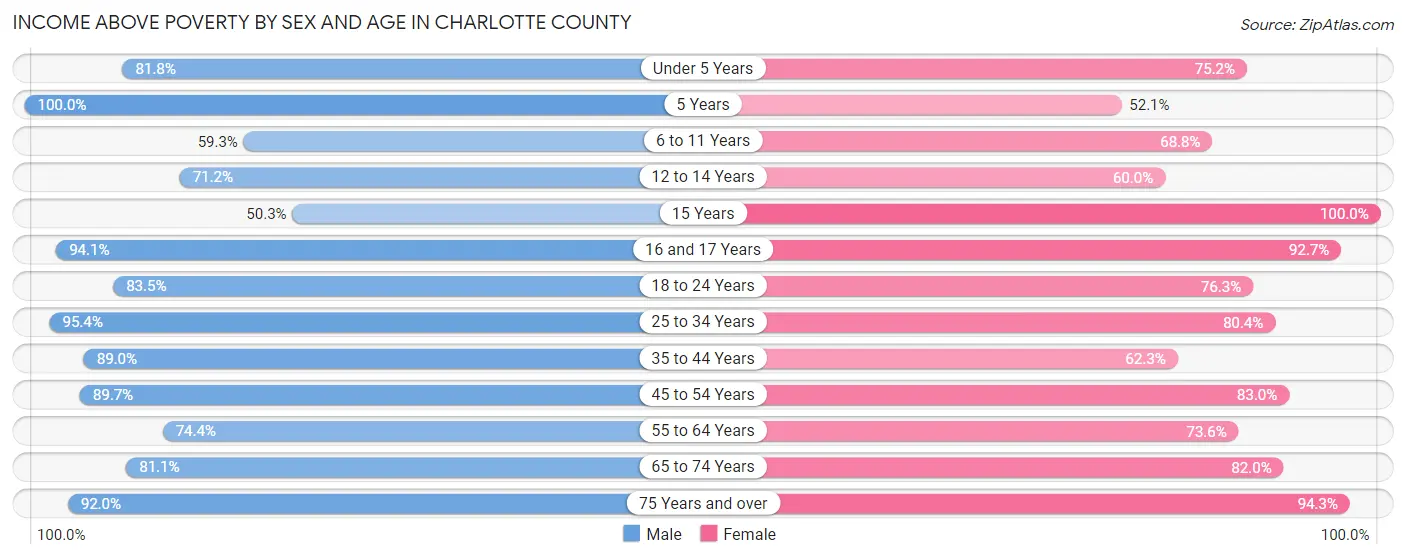
| Age Bracket | Male | Female |
| Under 5 Years | 270 (81.8%) | 212 (75.2%) |
| 5 Years | 45 (100.0%) | 25 (52.1%) |
| 6 to 11 Years | 264 (59.3%) | 317 (68.8%) |
| 12 to 14 Years | 178 (71.2%) | 84 (60.0%) |
| 15 Years | 88 (50.3%) | 71 (100.0%) |
| 16 and 17 Years | 192 (94.1%) | 38 (92.7%) |
| 18 to 24 Years | 401 (83.5%) | 261 (76.3%) |
| 25 to 34 Years | 535 (95.4%) | 514 (80.4%) |
| 35 to 44 Years | 429 (89.0%) | 374 (62.3%) |
| 45 to 54 Years | 629 (89.7%) | 567 (83.0%) |
| 55 to 64 Years | 696 (74.4%) | 670 (73.6%) |
| 65 to 74 Years | 563 (81.1%) | 614 (82.0%) |
| 75 Years and over | 424 (92.0%) | 577 (94.3%) |
| Total | 4,714 (81.8%) | 4,324 (77.5%) |
Income Below Poverty Among Married-Couple Families in Charlotte County
The poverty statistics for married-couple families in Charlotte County show that 5.5% or 101 of the total 1,835 families live below the poverty line. Families with 1 or 2 children have the highest poverty rate of 12.3%, comprising of 70 families. On the other hand, families with 3 or 4 children have the lowest poverty rate of 0.0%, which includes 0 families.
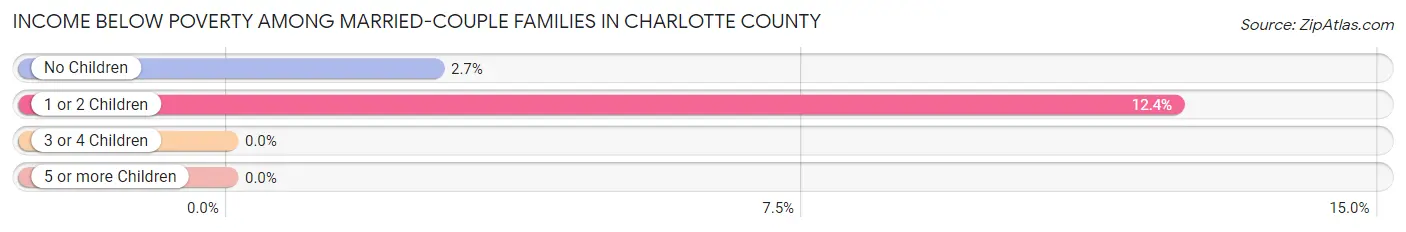
| Children | Above Poverty | Below Poverty |
| No Children | 1,122 (97.3%) | 31 (2.7%) |
| 1 or 2 Children | 497 (87.6%) | 70 (12.3%) |
| 3 or 4 Children | 81 (100.0%) | 0 (0.0%) |
| 5 or more Children | 34 (100.0%) | 0 (0.0%) |
| Total | 1,734 (94.5%) | 101 (5.5%) |
Income Below Poverty Among Single-Parent Households in Charlotte County
According to the poverty data in Charlotte County, 32.5% or 66 single-father households and 48.5% or 361 single-mother households are living below the poverty line. Among single-father households, those with 3 or 4 children have the highest poverty rate, with 3 households (100.0%) experiencing poverty. Likewise, among single-mother households, those with 5 or more children have the highest poverty rate, with 40 households (100.0%) falling below the poverty line.
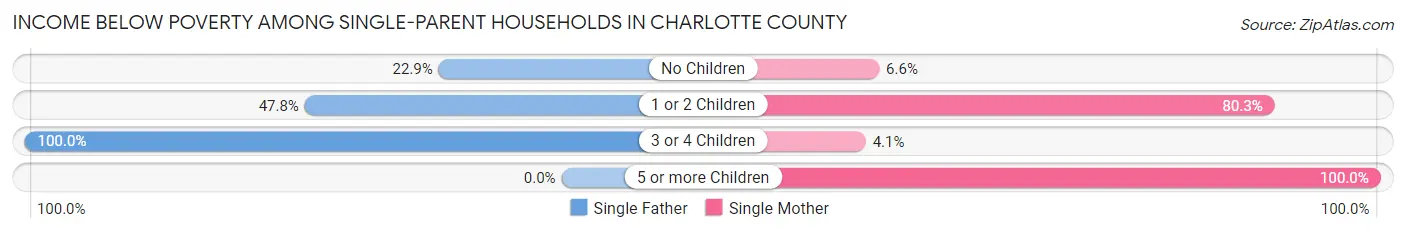
| Children | Single Father | Single Mother |
| No Children | 30 (22.9%) | 17 (6.6%) |
| 1 or 2 Children | 33 (47.8%) | 301 (80.3%) |
| 3 or 4 Children | 3 (100.0%) | 3 (4.1%) |
| 5 or more Children | 0 (0.0%) | 40 (100.0%) |
| Total | 66 (32.5%) | 361 (48.5%) |
Income Below Poverty Among Married-Couple vs Single-Parent Households in Charlotte County
The poverty data for Charlotte County shows that 101 of the married-couple family households (5.5%) and 427 of the single-parent households (45.0%) are living below the poverty level. Within the married-couple family households, those with 1 or 2 children have the highest poverty rate, with 70 households (12.3%) falling below the poverty line. Among the single-parent households, those with 5 or more children have the highest poverty rate, with 40 household (100.0%) living below poverty.
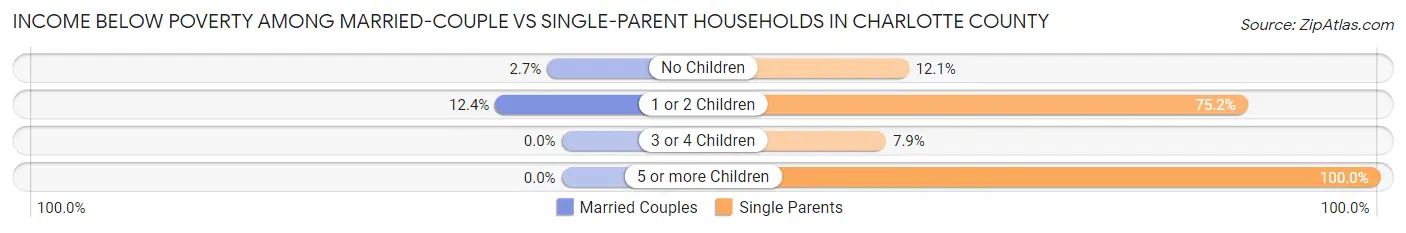
| Children | Married-Couple Families | Single-Parent Households |
| No Children | 31 (2.7%) | 47 (12.1%) |
| 1 or 2 Children | 70 (12.3%) | 334 (75.2%) |
| 3 or 4 Children | 0 (0.0%) | 6 (7.9%) |
| 5 or more Children | 0 (0.0%) | 40 (100.0%) |
| Total | 101 (5.5%) | 427 (45.0%) |
Race in Charlotte County
The most populous races in Charlotte County are White / Caucasian (8,159 | 70.6%), Black / African American (3,019 | 26.1%), and Two or more Races (333 | 2.9%).
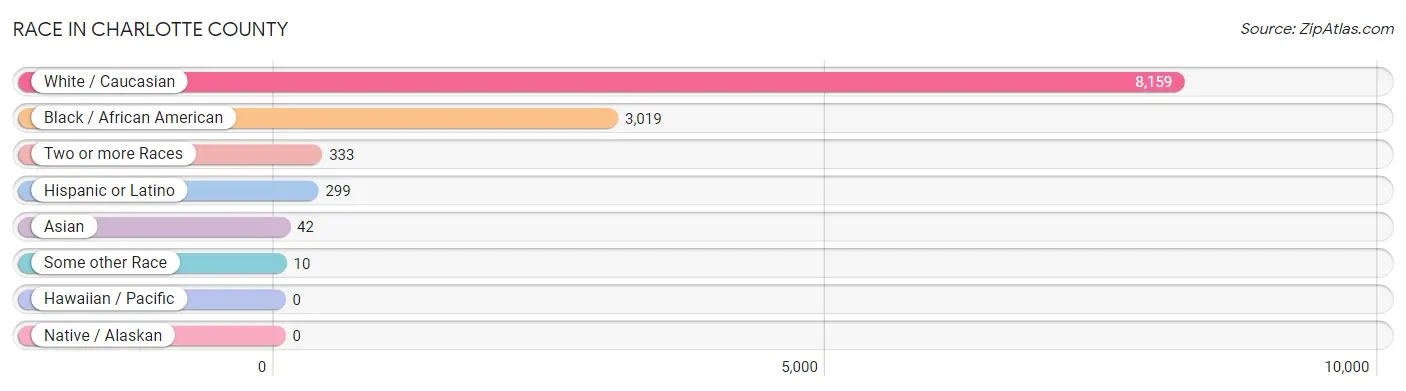
| Race | # Population | % Population |
| Asian | 42 | 0.4% |
| Black / African American | 3,019 | 26.1% |
| Hawaiian / Pacific | 0 | 0.0% |
| Hispanic or Latino | 299 | 2.6% |
| Native / Alaskan | 0 | 0.0% |
| White / Caucasian | 8,159 | 70.6% |
| Two or more Races | 333 | 2.9% |
| Some other Race | 10 | 0.1% |
| Total | 11,563 | 100.0% |
Ancestry in Charlotte County
The most populous ancestries reported in Charlotte County are American (2,672 | 23.1%), English (1,117 | 9.7%), Irish (842 | 7.3%), German (537 | 4.6%), and Scotch-Irish (308 | 2.7%), together accounting for 47.3% of all Charlotte County residents.
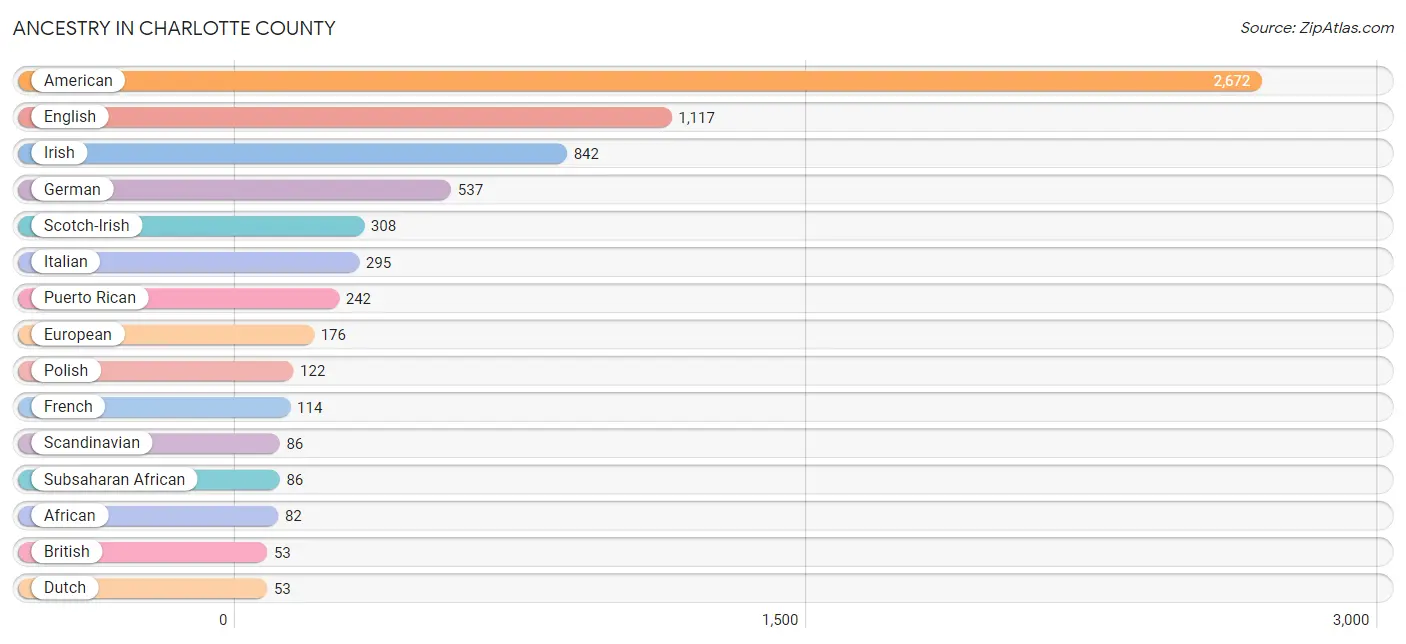
| Ancestry | # Population | % Population |
| African | 82 | 0.7% |
| American | 2,672 | 23.1% |
| Austrian | 10 | 0.1% |
| Bhutanese | 8 | 0.1% |
| British | 53 | 0.5% |
| Burmese | 34 | 0.3% |
| Cape Verdean | 2 | 0.0% |
| Central American | 1 | 0.0% |
| Cherokee | 11 | 0.1% |
| Czechoslovakian | 14 | 0.1% |
| Danish | 5 | 0.0% |
| Dutch | 53 | 0.5% |
| Eastern European | 5 | 0.0% |
| English | 1,117 | 9.7% |
| Ethiopian | 2 | 0.0% |
| European | 176 | 1.5% |
| Finnish | 13 | 0.1% |
| French | 114 | 1.0% |
| French Canadian | 8 | 0.1% |
| German | 537 | 4.6% |
| Greek | 21 | 0.2% |
| Haitian | 7 | 0.1% |
| Honduran | 1 | 0.0% |
| Hungarian | 1 | 0.0% |
| Irish | 842 | 7.3% |
| Italian | 295 | 2.5% |
| Jamaican | 3 | 0.0% |
| Mexican | 51 | 0.4% |
| Norwegian | 31 | 0.3% |
| Pakistani | 4 | 0.0% |
| Pennsylvania German | 8 | 0.1% |
| Polish | 122 | 1.1% |
| Portuguese | 11 | 0.1% |
| Puerto Rican | 242 | 2.1% |
| Russian | 8 | 0.1% |
| Scandinavian | 86 | 0.7% |
| Scotch-Irish | 308 | 2.7% |
| Scottish | 53 | 0.5% |
| Slovak | 9 | 0.1% |
| Sri Lankan | 13 | 0.1% |
| Subsaharan African | 86 | 0.7% |
| Swedish | 37 | 0.3% |
| Swiss | 15 | 0.1% |
| Welsh | 17 | 0.2% | View All 44 Rows |
Immigrants in Charlotte County
The most numerous immigrant groups reported in Charlotte County came from Asia (28 | 0.2%), Latin America (27 | 0.2%), Central America (20 | 0.2%), Eastern Asia (20 | 0.2%), and Korea (20 | 0.2%), together accounting for 1.0% of all Charlotte County residents.
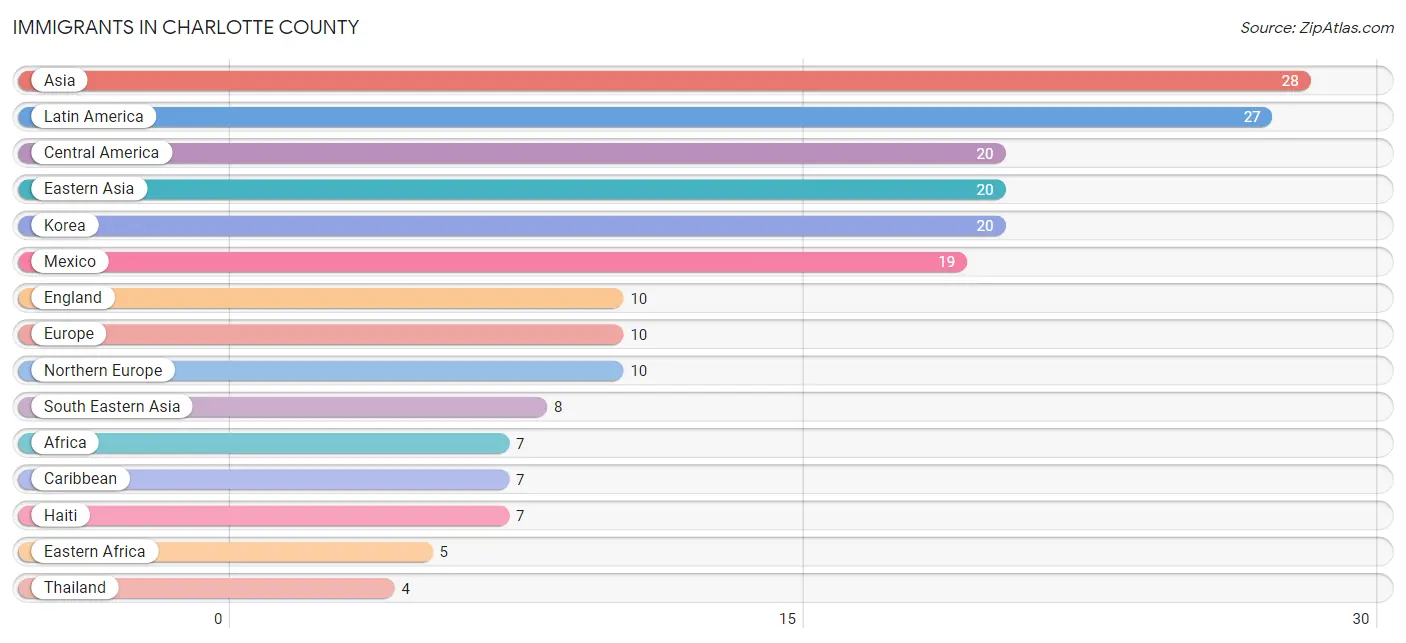
| Immigration Origin | # Population | % Population |
| Africa | 7 | 0.1% |
| Asia | 28 | 0.2% |
| Cabo Verde | 2 | 0.0% |
| Caribbean | 7 | 0.1% |
| Central America | 20 | 0.2% |
| Eastern Africa | 5 | 0.0% |
| Eastern Asia | 20 | 0.2% |
| England | 10 | 0.1% |
| Ethiopia | 2 | 0.0% |
| Europe | 10 | 0.1% |
| Haiti | 7 | 0.1% |
| Honduras | 1 | 0.0% |
| Korea | 20 | 0.2% |
| Latin America | 27 | 0.2% |
| Mexico | 19 | 0.2% |
| Northern Europe | 10 | 0.1% |
| South Eastern Asia | 8 | 0.1% |
| Thailand | 4 | 0.0% |
| Vietnam | 4 | 0.0% |
| Western Africa | 2 | 0.0% | View All 20 Rows |
Sex and Age in Charlotte County
Sex and Age in Charlotte County
The most populous age groups in Charlotte County are 15 to 19 Years (583 | 9.9%) for men and 65 to 69 Years (498 | 8.7%) for women.
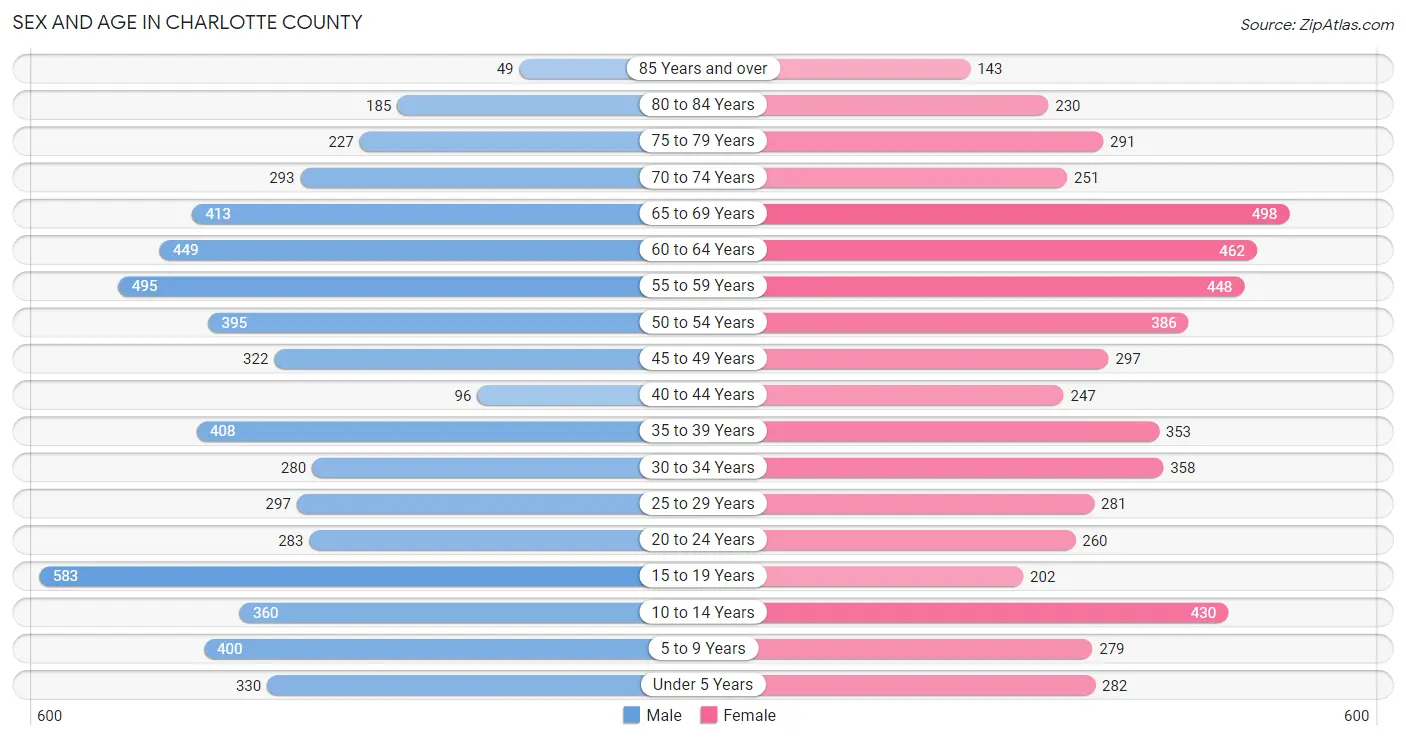
| Age Bracket | Male | Female |
| Under 5 Years | 330 (5.6%) | 282 (5.0%) |
| 5 to 9 Years | 400 (6.8%) | 279 (4.9%) |
| 10 to 14 Years | 360 (6.1%) | 430 (7.5%) |
| 15 to 19 Years | 583 (9.9%) | 202 (3.5%) |
| 20 to 24 Years | 283 (4.8%) | 260 (4.6%) |
| 25 to 29 Years | 297 (5.1%) | 281 (4.9%) |
| 30 to 34 Years | 280 (4.8%) | 358 (6.3%) |
| 35 to 39 Years | 408 (7.0%) | 353 (6.2%) |
| 40 to 44 Years | 96 (1.6%) | 247 (4.3%) |
| 45 to 49 Years | 322 (5.5%) | 297 (5.2%) |
| 50 to 54 Years | 395 (6.7%) | 386 (6.8%) |
| 55 to 59 Years | 495 (8.4%) | 448 (7.9%) |
| 60 to 64 Years | 449 (7.7%) | 462 (8.1%) |
| 65 to 69 Years | 413 (7.0%) | 498 (8.7%) |
| 70 to 74 Years | 293 (5.0%) | 251 (4.4%) |
| 75 to 79 Years | 227 (3.9%) | 291 (5.1%) |
| 80 to 84 Years | 185 (3.2%) | 230 (4.0%) |
| 85 Years and over | 49 (0.8%) | 143 (2.5%) |
| Total | 5,865 (100.0%) | 5,698 (100.0%) |
Families and Households in Charlotte County
Median Family Size in Charlotte County
The median family size in Charlotte County is 3.19 persons per family, with married-couple families (1,835 | 65.9%) accounting for the largest median family size of 3.26 persons per family. On the other hand, single male/father families (203 | 7.3%) represent the smallest median family size with 2.72 persons per family.
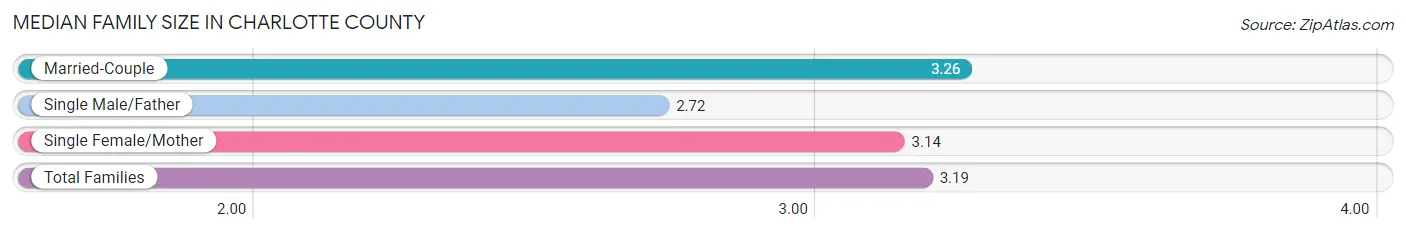
| Family Type | # Families | Family Size |
| Married-Couple | 1,835 (65.9%) | 3.26 |
| Single Male/Father | 203 (7.3%) | 2.72 |
| Single Female/Mother | 745 (26.8%) | 3.14 |
| Total Families | 2,783 (100.0%) | 3.19 |
Median Household Size in Charlotte County
The median household size in Charlotte County is 2.51 persons per household, with single female/mother households (745 | 16.4%) accounting for the largest median household size of 3.37 persons per household. non-family households (1,757 | 38.7%) represent the smallest median household size with 1.27 persons per household.
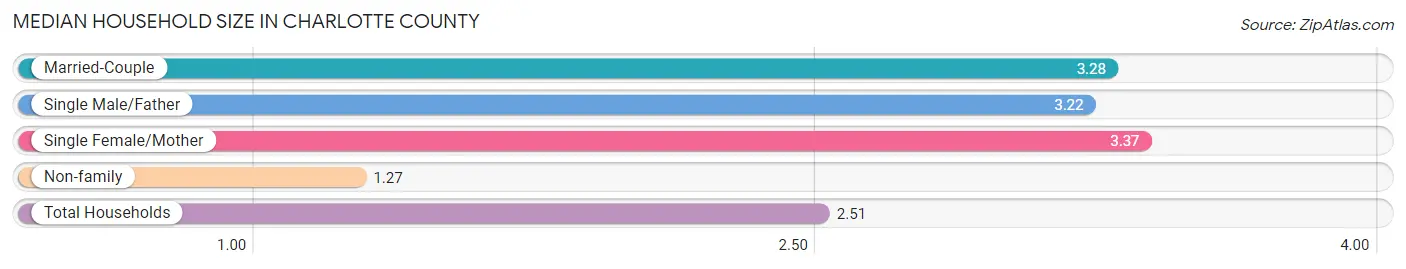
| Household Type | # Households | Household Size |
| Married-Couple | 1,835 (40.4%) | 3.28 |
| Single Male/Father | 203 (4.5%) | 3.22 |
| Single Female/Mother | 745 (16.4%) | 3.37 |
| Non-family | 1,757 (38.7%) | 1.27 |
| Total Households | 4,540 (100.0%) | 2.51 |
Household Size by Marriage Status in Charlotte County
Out of a total of 4,540 households in Charlotte County, 2,783 (61.3%) are family households, while 1,757 (38.7%) are nonfamily households. The most numerous type of family households are 2-person households, comprising 1,437, and the most common type of nonfamily households are 1-person households, comprising 1,552.
| Household Size | Family Households | Nonfamily Households |
| 1-Person Households | - | 1,552 (34.2%) |
| 2-Person Households | 1,437 (31.7%) | 165 (3.6%) |
| 3-Person Households | 567 (12.5%) | 6 (0.1%) |
| 4-Person Households | 532 (11.7%) | 2 (0.0%) |
| 5-Person Households | 146 (3.2%) | 0 (0.0%) |
| 6-Person Households | 59 (1.3%) | 32 (0.7%) |
| 7+ Person Households | 42 (0.9%) | 0 (0.0%) |
| Total | 2,783 (61.3%) | 1,757 (38.7%) |
Female Fertility in Charlotte County
Fertility by Age in Charlotte County
Average fertility rate in Charlotte County is 29.0 births per 1,000 women. Women in the age bracket of 20 to 34 years have the highest fertility rate with 62.0 births per 1,000 women. Women in the age bracket of 20 to 34 years acount for 93.3% of all women with births.
| Age Bracket | Women with Births | Births / 1,000 Women |
| 15 to 19 years | 0 (0.0%) | 0.0 |
| 20 to 34 years | 56 (93.3%) | 62.0 |
| 35 to 50 years | 4 (6.7%) | 4.0 |
| Total | 60 (100.0%) | 29.0 |
Fertility by Age by Marriage Status in Charlotte County
43.3% of women with births (60) in Charlotte County are married. The highest percentage of unmarried women with births falls into 20 to 34 years age bracket with 60.7% of them unmarried at the time of birth, while the lowest percentage of unmarried women with births belong to 35 to 50 years age bracket with 0.0% of them unmarried.
| Age Bracket | Married | Unmarried |
| 15 to 19 years | 0 (0.0%) | 0 (0.0%) |
| 20 to 34 years | 22 (39.3%) | 34 (60.7%) |
| 35 to 50 years | 4 (100.0%) | 0 (0.0%) |
| Total | 26 (43.3%) | 34 (56.7%) |
Fertility by Education in Charlotte County
| Educational Attainment | Women with Births | Births / 1,000 Women |
| Less than High School | 16 (26.7%) | 75.0 |
| High School Diploma | 3 (5.0%) | 5.0 |
| College or Associate's Degree | 25 (41.7%) | 34.0 |
| Bachelor's Degree | 0 (0.0%) | 0.0 |
| Graduate Degree | 16 (26.7%) | 89.0 |
| Total | 60 (100.0%) | 29.0 |
Fertility by Education by Marriage Status in Charlotte County
56.7% of women with births in Charlotte County are unmarried. Women with the educational attainment of graduate degree are most likely to be married with 100.0% of them married at childbirth, while women with the educational attainment of less than high school are least likely to be married with 100.0% of them unmarried at childbirth.
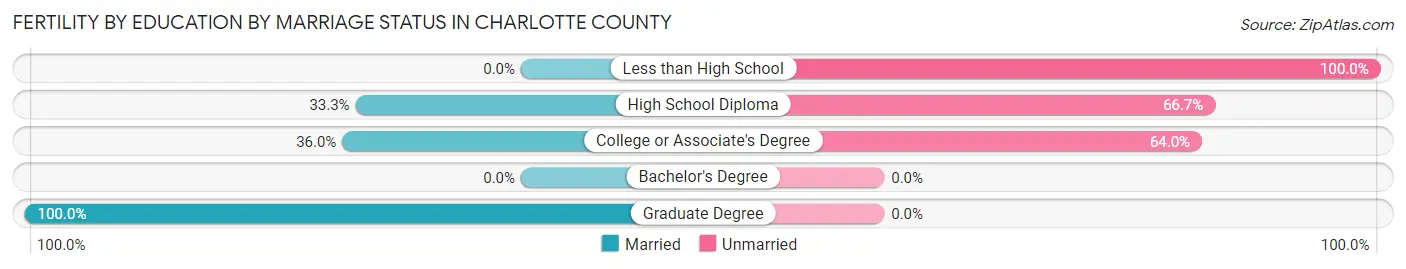
| Educational Attainment | Married | Unmarried |
| Less than High School | 0 (0.0%) | 16 (100.0%) |
| High School Diploma | 1 (33.3%) | 2 (66.7%) |
| College or Associate's Degree | 9 (36.0%) | 16 (64.0%) |
| Bachelor's Degree | 0 (0.0%) | 0 (0.0%) |
| Graduate Degree | 16 (100.0%) | 0 (0.0%) |
| Total | 26 (43.3%) | 34 (56.7%) |
Employment Characteristics in Charlotte County
Employment by Class of Employer in Charlotte County
Among the 4,537 employed individuals in Charlotte County, private company employees (2,421 | 53.4%), local government employees (657 | 14.5%), and self-employed (not incorporated) (612 | 13.5%) make up the most common classes of employment.
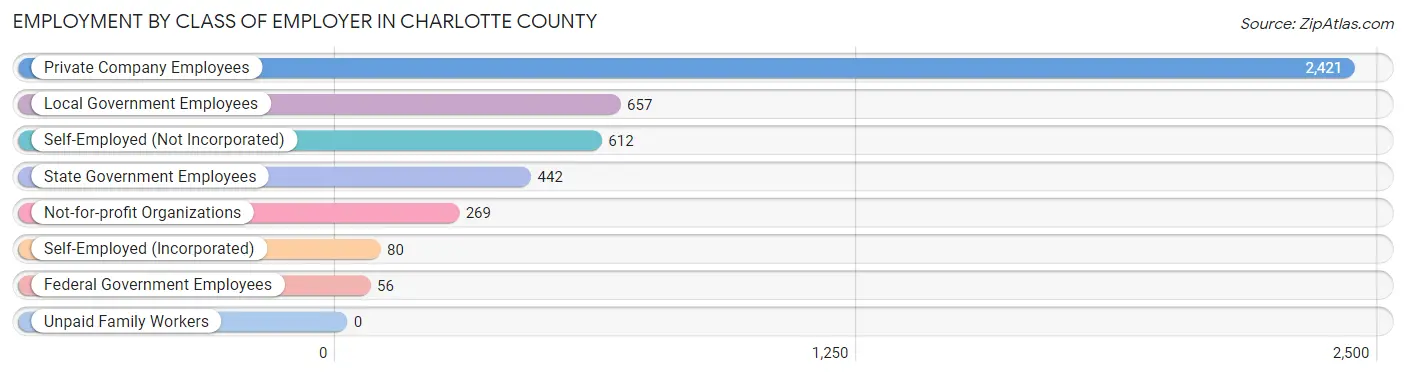
| Employer Class | # Employees | % Employees |
| Private Company Employees | 2,421 | 53.4% |
| Self-Employed (Incorporated) | 80 | 1.8% |
| Self-Employed (Not Incorporated) | 612 | 13.5% |
| Not-for-profit Organizations | 269 | 5.9% |
| Local Government Employees | 657 | 14.5% |
| State Government Employees | 442 | 9.7% |
| Federal Government Employees | 56 | 1.2% |
| Unpaid Family Workers | 0 | 0.0% |
| Total | 4,537 | 100.0% |
Employment Status by Age in Charlotte County
According to the labor force statistics for Charlotte County, out of the total population over 16 years of age (9,235), 52.7% or 4,867 individuals are in the labor force, with 3.6% or 175 of them unemployed. The age group with the highest labor force participation rate is 30 to 34 years, with 85.0% or 542 individuals in the labor force. Within the labor force, the 20 to 24 years age range has the highest percentage of unemployed individuals, with 7.7% or 27 of them being unemployed.
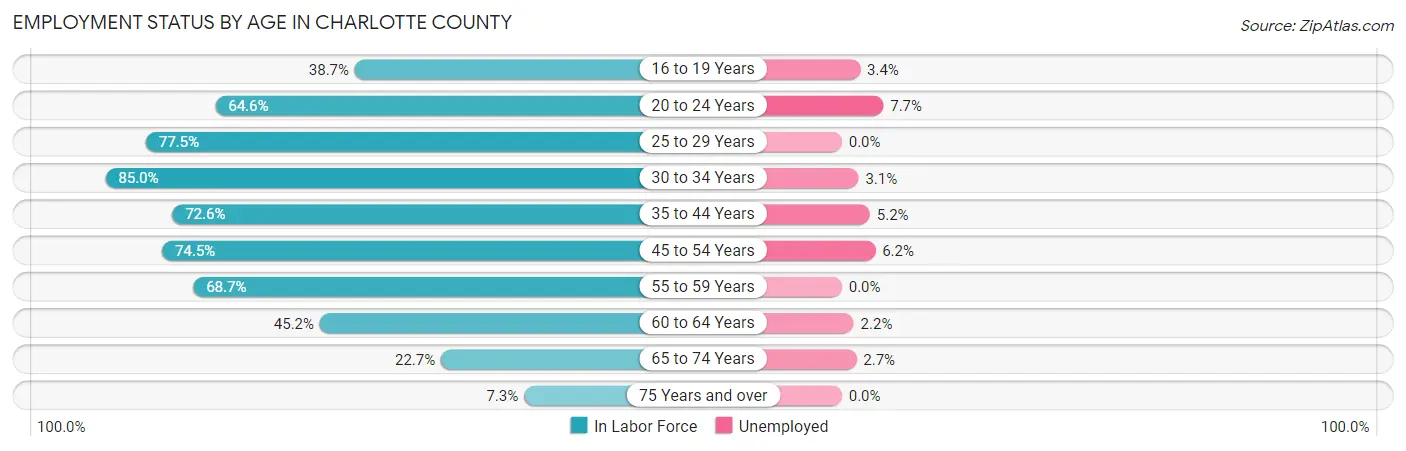
| Age Bracket | In Labor Force | Unemployed |
| 16 to 19 Years | 208 (38.7%) | 7 (3.4%) |
| 20 to 24 Years | 351 (64.6%) | 27 (7.7%) |
| 25 to 29 Years | 448 (77.5%) | 0 (0.0%) |
| 30 to 34 Years | 542 (85.0%) | 17 (3.1%) |
| 35 to 44 Years | 802 (72.6%) | 42 (5.2%) |
| 45 to 54 Years | 1,043 (74.5%) | 65 (6.2%) |
| 55 to 59 Years | 648 (68.7%) | 0 (0.0%) |
| 60 to 64 Years | 412 (45.2%) | 9 (2.2%) |
| 65 to 74 Years | 330 (22.7%) | 9 (2.7%) |
| 75 Years and over | 82 (7.3%) | 0 (0.0%) |
| Total | 4,867 (52.7%) | 175 (3.6%) |
Employment Status by Educational Attainment in Charlotte County
According to labor force statistics for Charlotte County, 69.9% of individuals (3,896) out of the total population between 25 and 64 years of age (5,574) are in the labor force, with 3.4% or 132 of them being unemployed. The group with the highest labor force participation rate are those with the educational attainment of bachelor's degree or higher, with 86.7% or 799 individuals in the labor force. Within the labor force, individuals with high school diploma education have the highest percentage of unemployment, with 4.3% or 63 of them being unemployed.
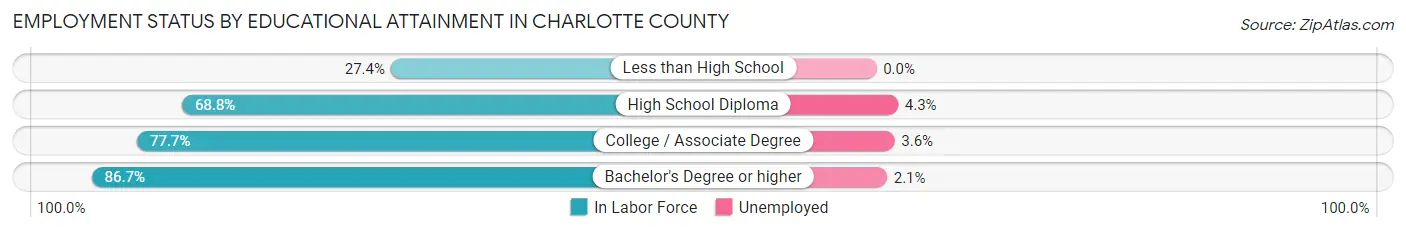
| Educational Attainment | In Labor Force | Unemployed |
| Less than High School | 180 (27.4%) | 0 (0.0%) |
| High School Diploma | 1,456 (68.8%) | 91 (4.3%) |
| College / Associate Degree | 1,459 (77.7%) | 68 (3.6%) |
| Bachelor's Degree or higher | 799 (86.7%) | 19 (2.1%) |
| Total | 3,896 (69.9%) | 190 (3.4%) |
Employment Occupations by Sex in Charlotte County
Management, Business, Science and Arts Occupations
The most common Management, Business, Science and Arts occupations in Charlotte County are Community & Social Service (547 | 11.7%), Management (401 | 8.6%), Education Instruction & Library (313 | 6.7%), Health Diagnosing & Treating (227 | 4.8%), and Business & Financial (193 | 4.1%).
Management, Business, Science and Arts Occupations by Sex
Within the Management, Business, Science and Arts occupations in Charlotte County, the most male-oriented occupations are Life, Physical & Social Science (100.0%), Architecture & Engineering (83.3%), and Computers, Engineering & Science (69.5%), while the most female-oriented occupations are Health Diagnosing & Treating (81.1%), Education Instruction & Library (80.2%), and Education, Arts & Media (76.7%).
| Occupation | Male | Female |
| Management | 223 (55.6%) | 178 (44.4%) |
| Business & Financial | 51 (26.4%) | 142 (73.6%) |
| Computers, Engineering & Science | 57 (69.5%) | 25 (30.5%) |
| Computers & Mathematics | 41 (65.1%) | 22 (34.9%) |
| Architecture & Engineering | 15 (83.3%) | 3 (16.7%) |
| Life, Physical & Social Science | 1 (100.0%) | 0 (0.0%) |
| Community & Social Service | 146 (26.7%) | 401 (73.3%) |
| Education, Arts & Media | 28 (23.3%) | 92 (76.7%) |
| Legal Services & Support | 22 (50.0%) | 22 (50.0%) |
| Education Instruction & Library | 62 (19.8%) | 251 (80.2%) |
| Arts, Media & Entertainment | 34 (48.6%) | 36 (51.4%) |
| Health Diagnosing & Treating | 43 (18.9%) | 184 (81.1%) |
| Health Technologists | 43 (33.1%) | 87 (66.9%) |
| Total (Category) | 520 (35.9%) | 930 (64.1%) |
| Total (Overall) | 2,267 (48.3%) | 2,422 (51.6%) |
Services Occupations
The most common Services occupations in Charlotte County are Healthcare Support (211 | 4.5%), Food Preparation & Serving (152 | 3.2%), Security & Protection (151 | 3.2%), Cleaning & Maintenance (150 | 3.2%), and Law Enforcement (126 | 2.7%).
Services Occupations by Sex
Within the Services occupations in Charlotte County, the most male-oriented occupations are Law Enforcement (95.2%), Security & Protection (92.7%), and Firefighting & Prevention (80.0%), while the most female-oriented occupations are Healthcare Support (100.0%), Food Preparation & Serving (97.4%), and Personal Care & Service (77.4%).
| Occupation | Male | Female |
| Healthcare Support | 0 (0.0%) | 211 (100.0%) |
| Security & Protection | 140 (92.7%) | 11 (7.3%) |
| Firefighting & Prevention | 20 (80.0%) | 5 (20.0%) |
| Law Enforcement | 120 (95.2%) | 6 (4.8%) |
| Food Preparation & Serving | 4 (2.6%) | 148 (97.4%) |
| Cleaning & Maintenance | 47 (31.3%) | 103 (68.7%) |
| Personal Care & Service | 26 (22.6%) | 89 (77.4%) |
| Total (Category) | 217 (27.9%) | 562 (72.1%) |
| Total (Overall) | 2,267 (48.3%) | 2,422 (51.6%) |
Sales and Office Occupations
The most common Sales and Office occupations in Charlotte County are Office & Administration (581 | 12.4%), and Sales & Related (449 | 9.6%).

Sales and Office Occupations by Sex

| Occupation | Male | Female |
| Sales & Related | 284 (63.2%) | 165 (36.7%) |
| Office & Administration | 46 (7.9%) | 535 (92.1%) |
| Total (Category) | 330 (32.0%) | 700 (68.0%) |
| Total (Overall) | 2,267 (48.3%) | 2,422 (51.6%) |
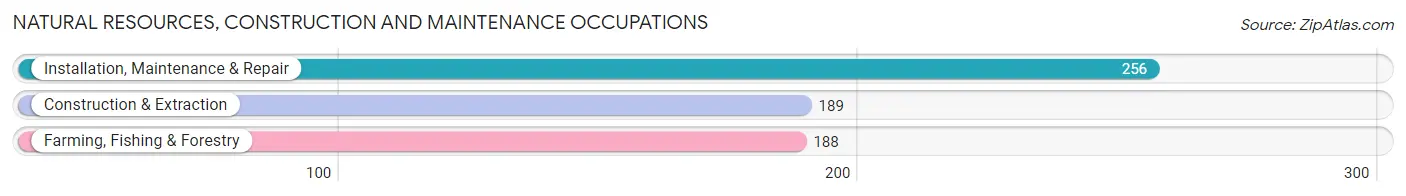
Natural Resources, Construction and Maintenance Occupations
The most common Natural Resources, Construction and Maintenance occupations in Charlotte County are Installation, Maintenance & Repair (256 | 5.5%), Construction & Extraction (189 | 4.0%), and Farming, Fishing & Forestry (188 | 4.0%).
Natural Resources, Construction and Maintenance Occupations by Sex
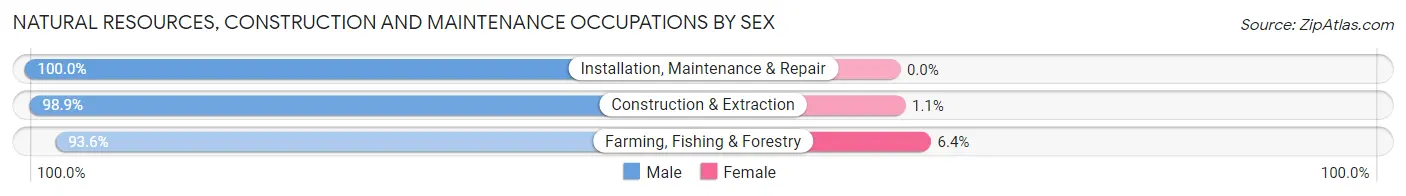
| Occupation | Male | Female |
| Farming, Fishing & Forestry | 176 (93.6%) | 12 (6.4%) |
| Construction & Extraction | 187 (98.9%) | 2 (1.1%) |
| Installation, Maintenance & Repair | 256 (100.0%) | 0 (0.0%) |
| Total (Category) | 619 (97.8%) | 14 (2.2%) |
| Total (Overall) | 2,267 (48.3%) | 2,422 (51.6%) |
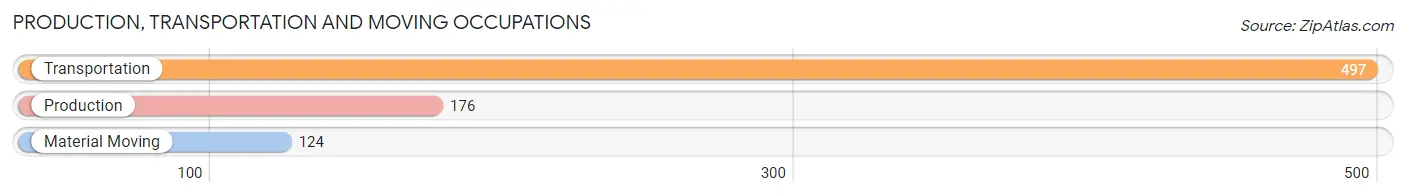
Production, Transportation and Moving Occupations
The most common Production, Transportation and Moving occupations in Charlotte County are Transportation (497 | 10.6%), Production (176 | 3.7%), and Material Moving (124 | 2.6%).
Production, Transportation and Moving Occupations by Sex
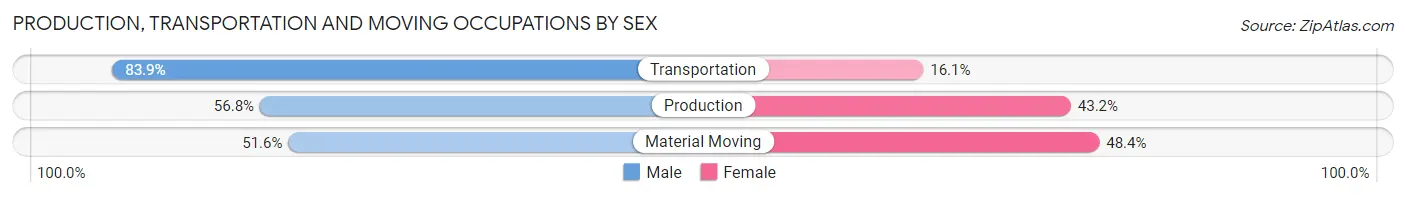
| Occupation | Male | Female |
| Production | 100 (56.8%) | 76 (43.2%) |
| Transportation | 417 (83.9%) | 80 (16.1%) |
| Material Moving | 64 (51.6%) | 60 (48.4%) |
| Total (Category) | 581 (72.9%) | 216 (27.1%) |
| Total (Overall) | 2,267 (48.3%) | 2,422 (51.6%) |
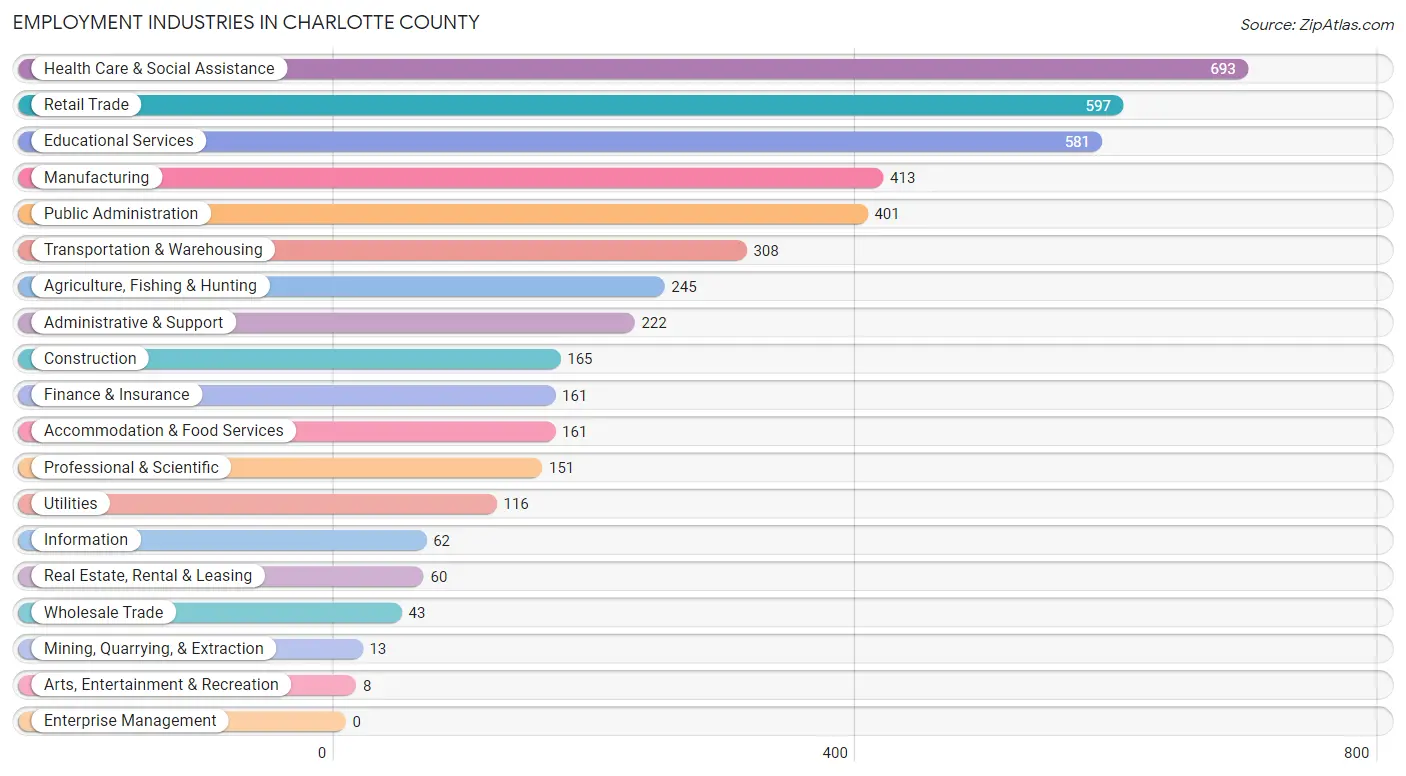
Employment Industries by Sex in Charlotte County
Employment Industries in Charlotte County
The major employment industries in Charlotte County include Health Care & Social Assistance (693 | 14.8%), Retail Trade (597 | 12.7%), Educational Services (581 | 12.4%), Manufacturing (413 | 8.8%), and Public Administration (401 | 8.6%).
Employment Industries by Sex in Charlotte County
The Charlotte County industries that see more men than women are Construction (98.8%), Utilities (93.1%), and Agriculture, Fishing & Hunting (91.0%), whereas the industries that tend to have a higher number of women are Mining, Quarrying, & Extraction (100.0%), Health Care & Social Assistance (93.9%), and Accommodation & Food Services (92.5%).
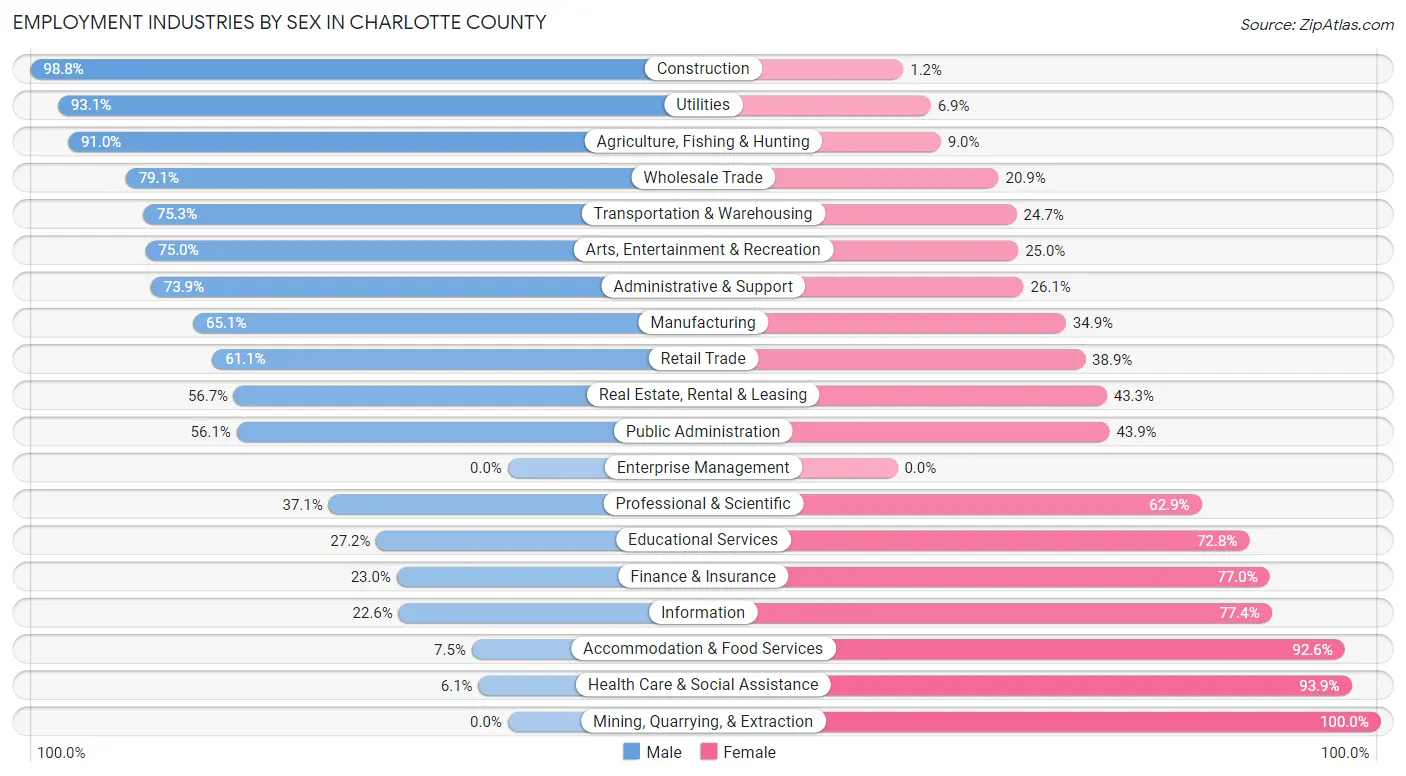
| Industry | Male | Female |
| Agriculture, Fishing & Hunting | 223 (91.0%) | 22 (9.0%) |
| Mining, Quarrying, & Extraction | 0 (0.0%) | 13 (100.0%) |
| Construction | 163 (98.8%) | 2 (1.2%) |
| Manufacturing | 269 (65.1%) | 144 (34.9%) |
| Wholesale Trade | 34 (79.1%) | 9 (20.9%) |
| Retail Trade | 365 (61.1%) | 232 (38.9%) |
| Transportation & Warehousing | 232 (75.3%) | 76 (24.7%) |
| Utilities | 108 (93.1%) | 8 (6.9%) |
| Information | 14 (22.6%) | 48 (77.4%) |
| Finance & Insurance | 37 (23.0%) | 124 (77.0%) |
| Real Estate, Rental & Leasing | 34 (56.7%) | 26 (43.3%) |
| Professional & Scientific | 56 (37.1%) | 95 (62.9%) |
| Enterprise Management | 0 (0.0%) | 0 (0.0%) |
| Administrative & Support | 164 (73.9%) | 58 (26.1%) |
| Educational Services | 158 (27.2%) | 423 (72.8%) |
| Health Care & Social Assistance | 42 (6.1%) | 651 (93.9%) |
| Arts, Entertainment & Recreation | 6 (75.0%) | 2 (25.0%) |
| Accommodation & Food Services | 12 (7.4%) | 149 (92.5%) |
| Public Administration | 225 (56.1%) | 176 (43.9%) |
| Total | 2,267 (48.3%) | 2,422 (51.6%) |
Education in Charlotte County
School Enrollment in Charlotte County
The most common levels of schooling among the 2,470 students in Charlotte County are high school (720 | 29.1%), middle school (583 | 23.6%), and elementary school (571 | 23.1%).
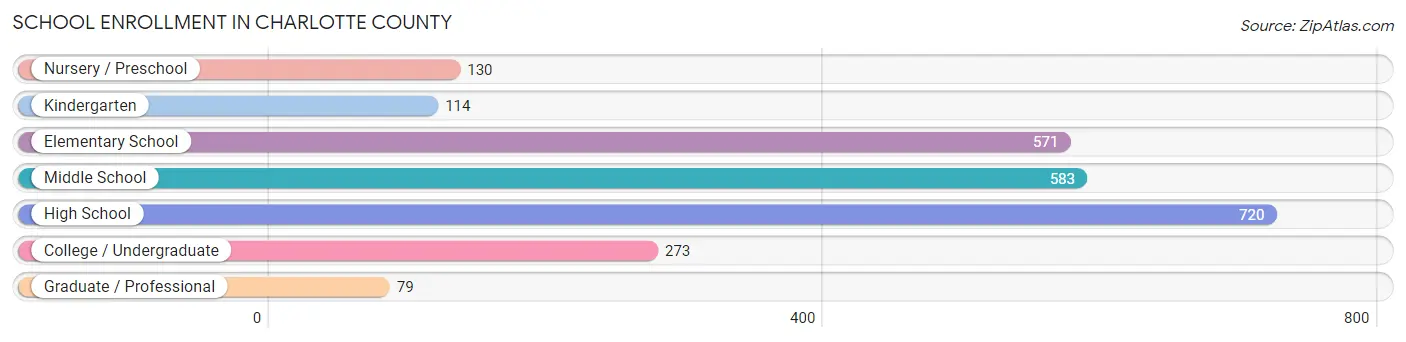
| School Level | # Students | % Students |
| Nursery / Preschool | 130 | 5.3% |
| Kindergarten | 114 | 4.6% |
| Elementary School | 571 | 23.1% |
| Middle School | 583 | 23.6% |
| High School | 720 | 29.1% |
| College / Undergraduate | 273 | 11.1% |
| Graduate / Professional | 79 | 3.2% |
| Total | 2,470 | 100.0% |
School Enrollment by Age by Funding Source in Charlotte County
Out of a total of 2,470 students who are enrolled in schools in Charlotte County, 242 (9.8%) attend a private institution, while the remaining 2,228 (90.2%) are enrolled in public schools. The age group of 35 years and over has the highest likelihood of being enrolled in private schools, with 47 (63.5% in the age bracket) enrolled. Conversely, the age group of 25 to 34 year olds has the lowest likelihood of being enrolled in a private school, with 68 (100.0% in the age bracket) attending a public institution.
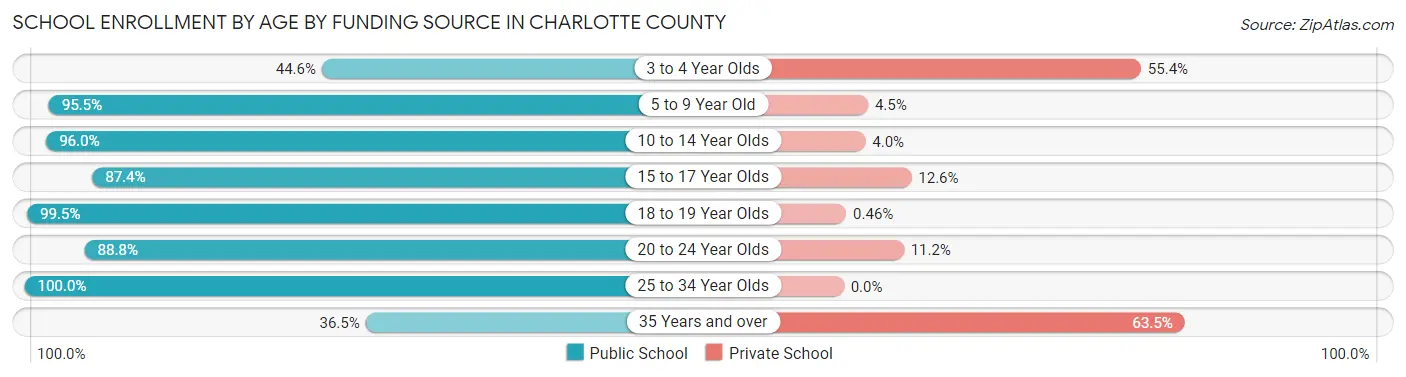
| Age Bracket | Public School | Private School |
| 3 to 4 Year Olds | 50 (44.6%) | 62 (55.4%) |
| 5 to 9 Year Old | 613 (95.5%) | 29 (4.5%) |
| 10 to 14 Year Olds | 736 (96.0%) | 31 (4.0%) |
| 15 to 17 Year Olds | 381 (87.4%) | 55 (12.6%) |
| 18 to 19 Year Olds | 218 (99.5%) | 1 (0.5%) |
| 20 to 24 Year Olds | 135 (88.8%) | 17 (11.2%) |
| 25 to 34 Year Olds | 68 (100.0%) | 0 (0.0%) |
| 35 Years and over | 27 (36.5%) | 47 (63.5%) |
| Total | 2,228 (90.2%) | 242 (9.8%) |
Educational Attainment by Field of Study in Charlotte County
Education (256 | 17.8%), business (223 | 15.5%), arts & humanities (190 | 13.2%), psychology (166 | 11.5%), and bio, nature & agricultural (142 | 9.9%) are the most common fields of study among 1,438 individuals in Charlotte County who have obtained a bachelor's degree or higher.
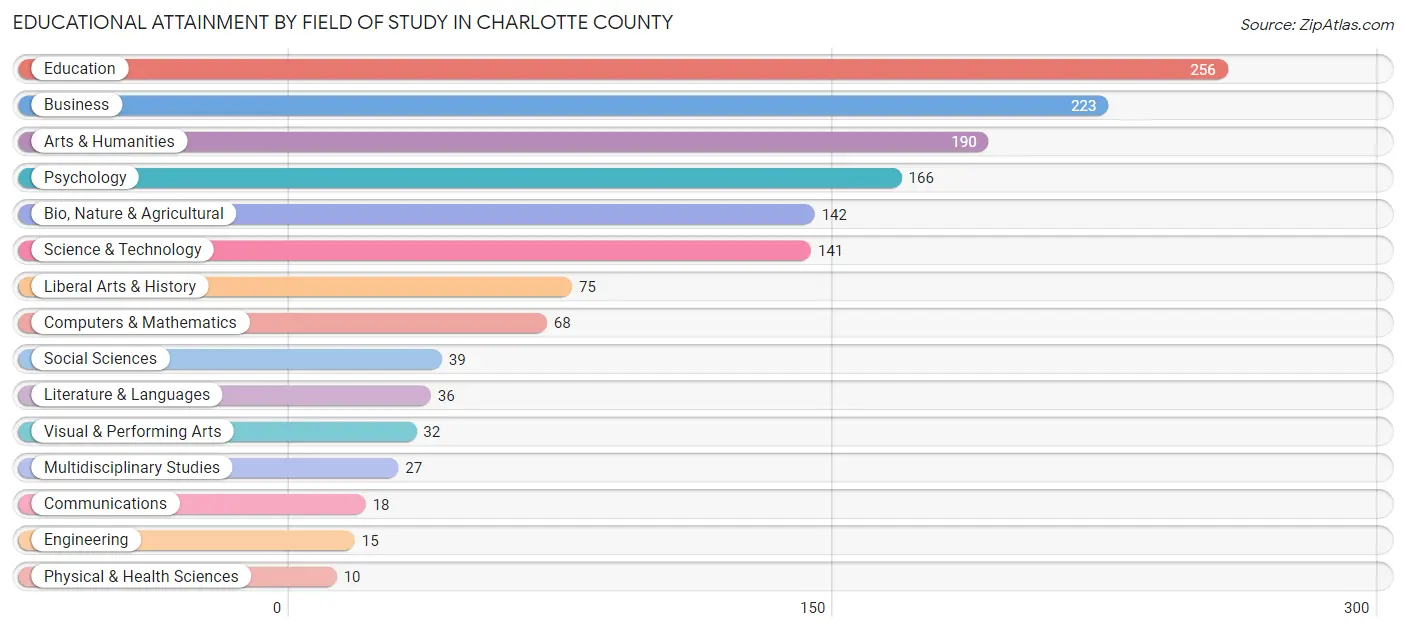
| Field of Study | # Graduates | % Graduates |
| Computers & Mathematics | 68 | 4.7% |
| Bio, Nature & Agricultural | 142 | 9.9% |
| Physical & Health Sciences | 10 | 0.7% |
| Psychology | 166 | 11.5% |
| Social Sciences | 39 | 2.7% |
| Engineering | 15 | 1.0% |
| Multidisciplinary Studies | 27 | 1.9% |
| Science & Technology | 141 | 9.8% |
| Business | 223 | 15.5% |
| Education | 256 | 17.8% |
| Literature & Languages | 36 | 2.5% |
| Liberal Arts & History | 75 | 5.2% |
| Visual & Performing Arts | 32 | 2.2% |
| Communications | 18 | 1.3% |
| Arts & Humanities | 190 | 13.2% |
| Total | 1,438 | 100.0% |
Transportation & Commute in Charlotte County
Vehicle Availability by Sex in Charlotte County
The most prevalent vehicle ownership categories in Charlotte County are males with 3 vehicles (689, accounting for 32.4%) and females with 3 vehicles (609, making up 28.7%).
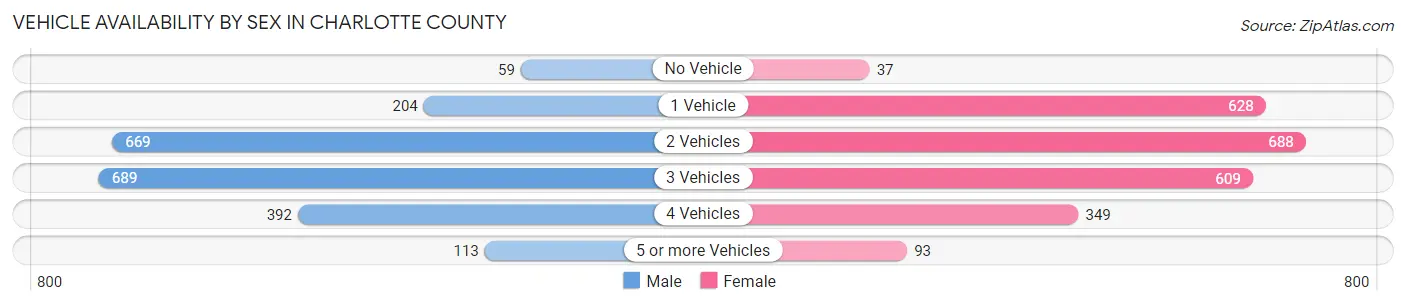
| Vehicles Available | Male | Female |
| No Vehicle | 59 (2.8%) | 37 (1.5%) |
| 1 Vehicle | 204 (9.6%) | 628 (26.1%) |
| 2 Vehicles | 669 (31.5%) | 688 (28.6%) |
| 3 Vehicles | 689 (32.4%) | 609 (25.3%) |
| 4 Vehicles | 392 (18.4%) | 349 (14.5%) |
| 5 or more Vehicles | 113 (5.3%) | 93 (3.9%) |
| Total | 2,126 (100.0%) | 2,404 (100.0%) |
Commute Time in Charlotte County
The most frequently occuring commute durations in Charlotte County are 30 to 34 minutes (645 commuters, 15.1%), 60 to 89 minutes (509 commuters, 11.9%), and 10 to 14 minutes (440 commuters, 10.3%).
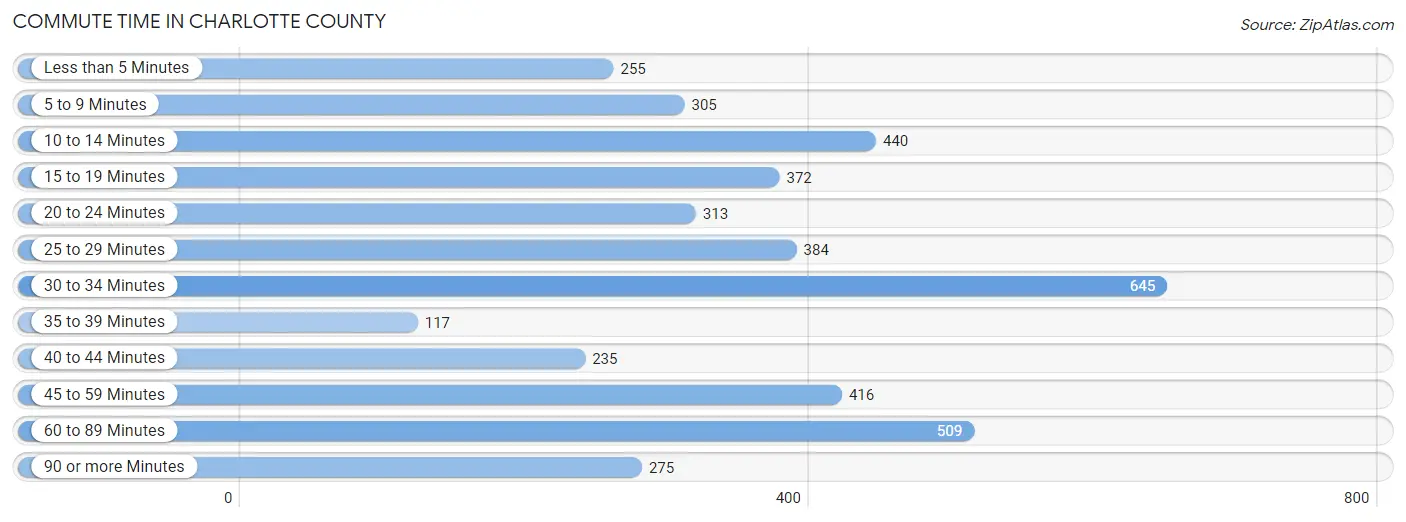
| Commute Time | # Commuters | % Commuters |
| Less than 5 Minutes | 255 | 6.0% |
| 5 to 9 Minutes | 305 | 7.1% |
| 10 to 14 Minutes | 440 | 10.3% |
| 15 to 19 Minutes | 372 | 8.7% |
| 20 to 24 Minutes | 313 | 7.3% |
| 25 to 29 Minutes | 384 | 9.0% |
| 30 to 34 Minutes | 645 | 15.1% |
| 35 to 39 Minutes | 117 | 2.7% |
| 40 to 44 Minutes | 235 | 5.5% |
| 45 to 59 Minutes | 416 | 9.8% |
| 60 to 89 Minutes | 509 | 11.9% |
| 90 or more Minutes | 275 | 6.5% |
Commute Time by Sex in Charlotte County
The most common commute times in Charlotte County are 30 to 34 minutes (349 commuters, 17.6%) for males and 10 to 14 minutes (318 commuters, 13.9%) for females.
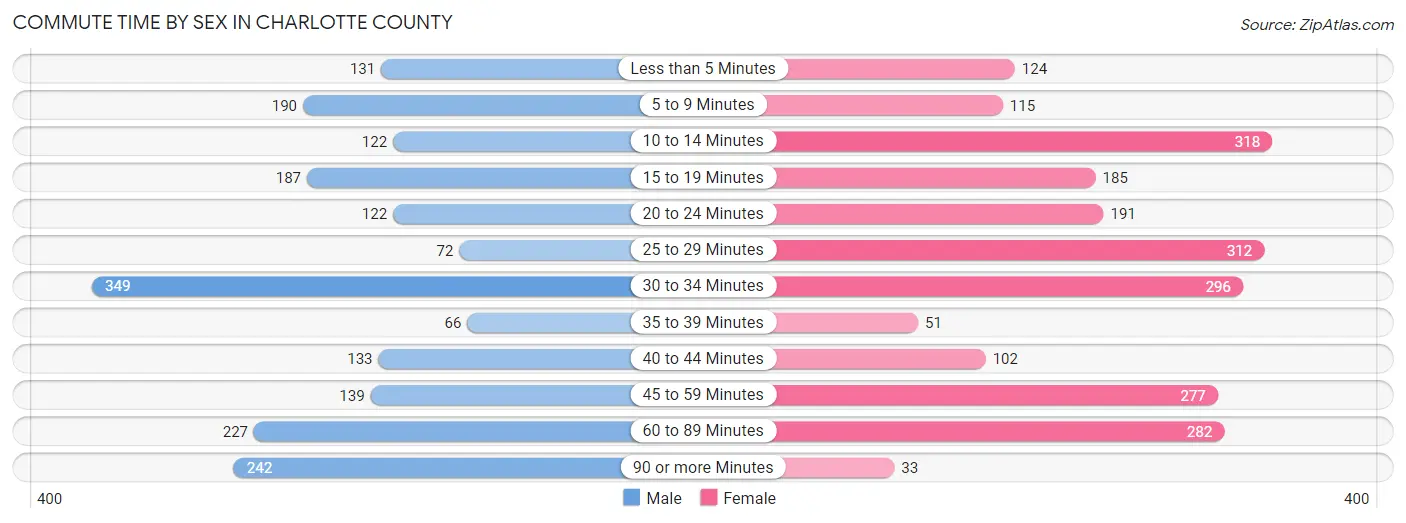
| Commute Time | Male | Female |
| Less than 5 Minutes | 131 (6.6%) | 124 (5.4%) |
| 5 to 9 Minutes | 190 (9.6%) | 115 (5.0%) |
| 10 to 14 Minutes | 122 (6.2%) | 318 (13.9%) |
| 15 to 19 Minutes | 187 (9.4%) | 185 (8.1%) |
| 20 to 24 Minutes | 122 (6.2%) | 191 (8.4%) |
| 25 to 29 Minutes | 72 (3.6%) | 312 (13.7%) |
| 30 to 34 Minutes | 349 (17.6%) | 296 (13.0%) |
| 35 to 39 Minutes | 66 (3.3%) | 51 (2.2%) |
| 40 to 44 Minutes | 133 (6.7%) | 102 (4.5%) |
| 45 to 59 Minutes | 139 (7.0%) | 277 (12.1%) |
| 60 to 89 Minutes | 227 (11.5%) | 282 (12.3%) |
| 90 or more Minutes | 242 (12.2%) | 33 (1.4%) |
Time of Departure to Work by Sex in Charlotte County
The most frequent times of departure to work in Charlotte County are 7:00 AM to 7:29 AM (337, 17.0%) for males and 7:00 AM to 7:29 AM (494, 21.6%) for females.
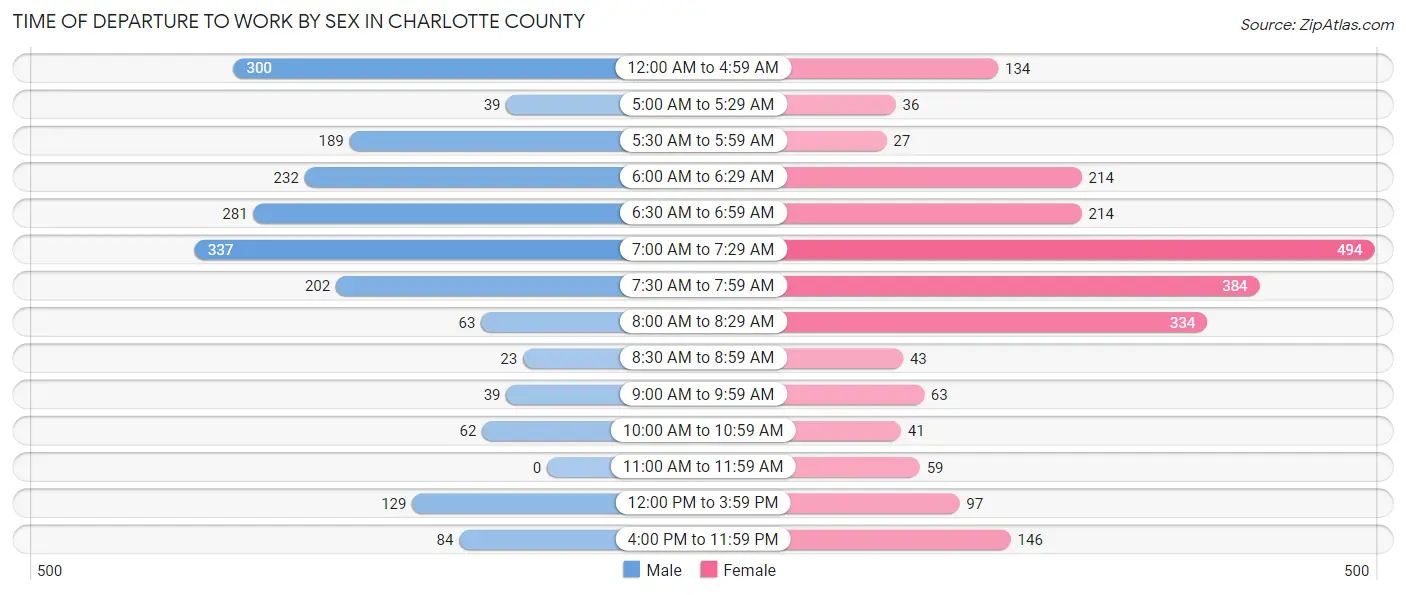
| Time of Departure | Male | Female |
| 12:00 AM to 4:59 AM | 300 (15.1%) | 134 (5.9%) |
| 5:00 AM to 5:29 AM | 39 (2.0%) | 36 (1.6%) |
| 5:30 AM to 5:59 AM | 189 (9.6%) | 27 (1.2%) |
| 6:00 AM to 6:29 AM | 232 (11.7%) | 214 (9.4%) |
| 6:30 AM to 6:59 AM | 281 (14.2%) | 214 (9.4%) |
| 7:00 AM to 7:29 AM | 337 (17.0%) | 494 (21.6%) |
| 7:30 AM to 7:59 AM | 202 (10.2%) | 384 (16.8%) |
| 8:00 AM to 8:29 AM | 63 (3.2%) | 334 (14.6%) |
| 8:30 AM to 8:59 AM | 23 (1.2%) | 43 (1.9%) |
| 9:00 AM to 9:59 AM | 39 (2.0%) | 63 (2.8%) |
| 10:00 AM to 10:59 AM | 62 (3.1%) | 41 (1.8%) |
| 11:00 AM to 11:59 AM | 0 (0.0%) | 59 (2.6%) |
| 12:00 PM to 3:59 PM | 129 (6.5%) | 97 (4.2%) |
| 4:00 PM to 11:59 PM | 84 (4.2%) | 146 (6.4%) |
| Total | 1,980 (100.0%) | 2,286 (100.0%) |
Housing Occupancy in Charlotte County
Occupancy by Ownership in Charlotte County
Of the total 4,540 dwellings in Charlotte County, owner-occupied units account for 3,137 (69.1%), while renter-occupied units make up 1,403 (30.9%).
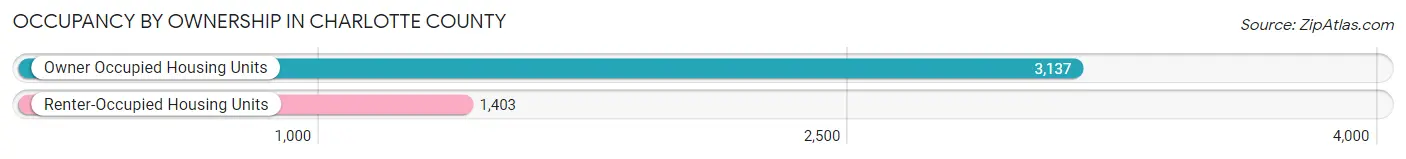
| Occupancy | # Housing Units | % Housing Units |
| Owner Occupied Housing Units | 3,137 | 69.1% |
| Renter-Occupied Housing Units | 1,403 | 30.9% |
| Total Occupied Housing Units | 4,540 | 100.0% |
Occupancy by Household Size in Charlotte County
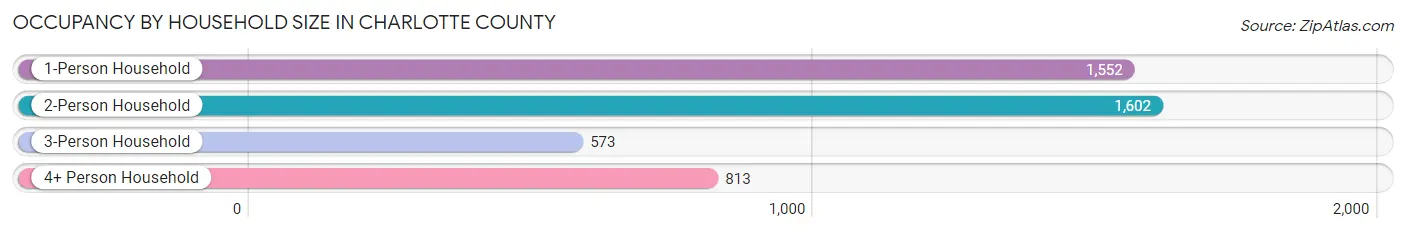
| Household Size | # Housing Units | % Housing Units |
| 1-Person Household | 1,552 | 34.2% |
| 2-Person Household | 1,602 | 35.3% |
| 3-Person Household | 573 | 12.6% |
| 4+ Person Household | 813 | 17.9% |
| Total Housing Units | 4,540 | 100.0% |
Occupancy by Ownership by Household Size in Charlotte County
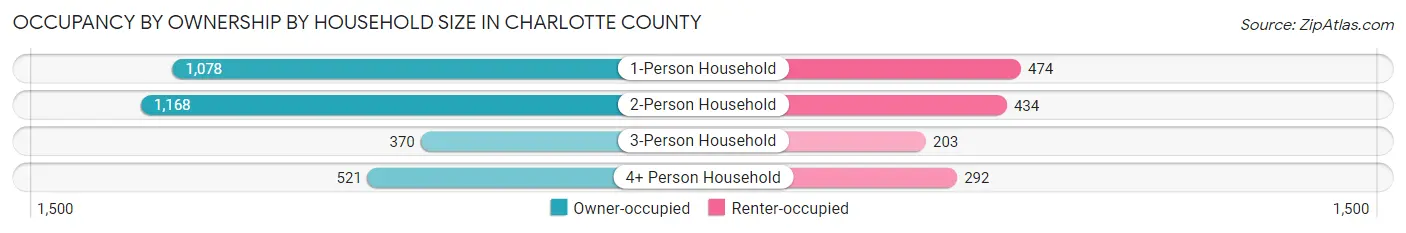
| Household Size | Owner-occupied | Renter-occupied |
| 1-Person Household | 1,078 (69.5%) | 474 (30.5%) |
| 2-Person Household | 1,168 (72.9%) | 434 (27.1%) |
| 3-Person Household | 370 (64.6%) | 203 (35.4%) |
| 4+ Person Household | 521 (64.1%) | 292 (35.9%) |
| Total Housing Units | 3,137 (69.1%) | 1,403 (30.9%) |
Occupancy by Educational Attainment in Charlotte County
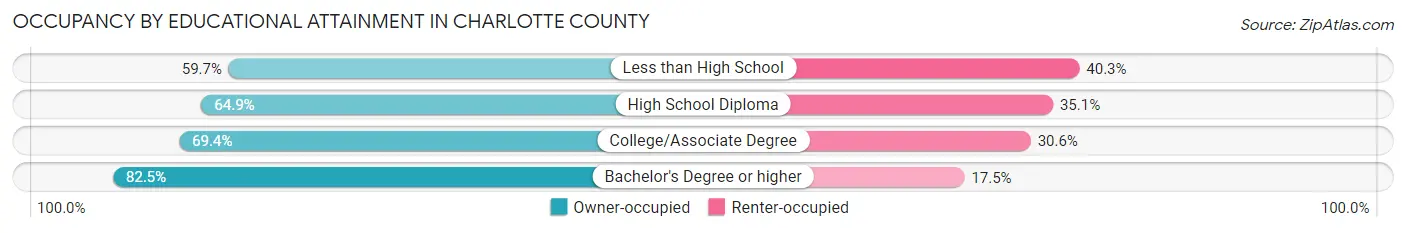
| Household Size | Owner-occupied | Renter-occupied |
| Less than High School | 375 (59.7%) | 253 (40.3%) |
| High School Diploma | 950 (64.9%) | 513 (35.1%) |
| College/Associate Degree | 1,100 (69.4%) | 486 (30.6%) |
| Bachelor's Degree or higher | 712 (82.5%) | 151 (17.5%) |
Occupancy by Age of Householder in Charlotte County
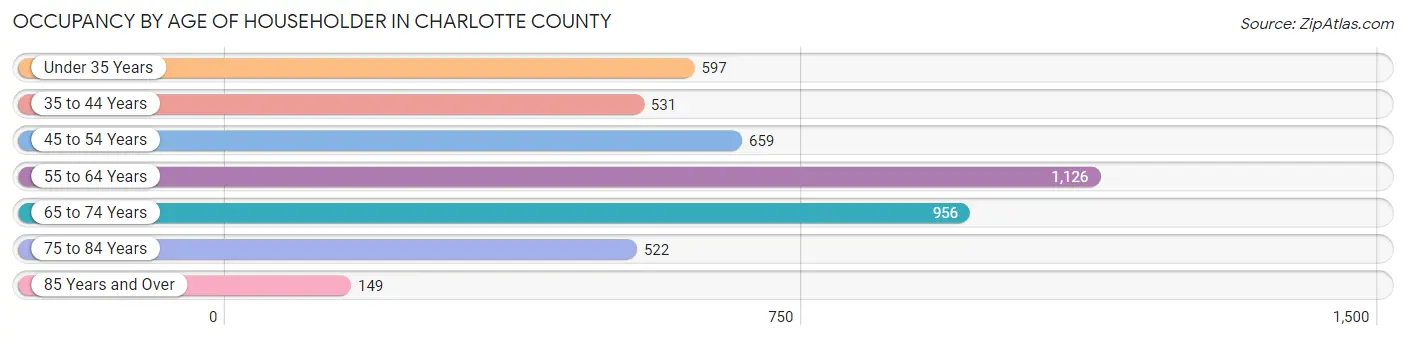
| Age Bracket | # Households | % Households |
| Under 35 Years | 597 | 13.2% |
| 35 to 44 Years | 531 | 11.7% |
| 45 to 54 Years | 659 | 14.5% |
| 55 to 64 Years | 1,126 | 24.8% |
| 65 to 74 Years | 956 | 21.1% |
| 75 to 84 Years | 522 | 11.5% |
| 85 Years and Over | 149 | 3.3% |
| Total | 4,540 | 100.0% |
Housing Finances in Charlotte County
Median Income by Occupancy in Charlotte County
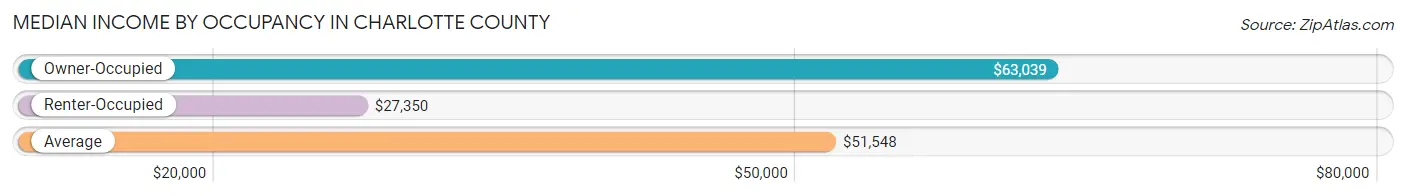
| Occupancy Type | # Households | Median Income |
| Owner-Occupied | 3,137 (69.1%) | $63,039 |
| Renter-Occupied | 1,403 (30.9%) | $27,350 |
| Average | 4,540 (100.0%) | $51,548 |
Occupancy by Householder Income Bracket in Charlotte County
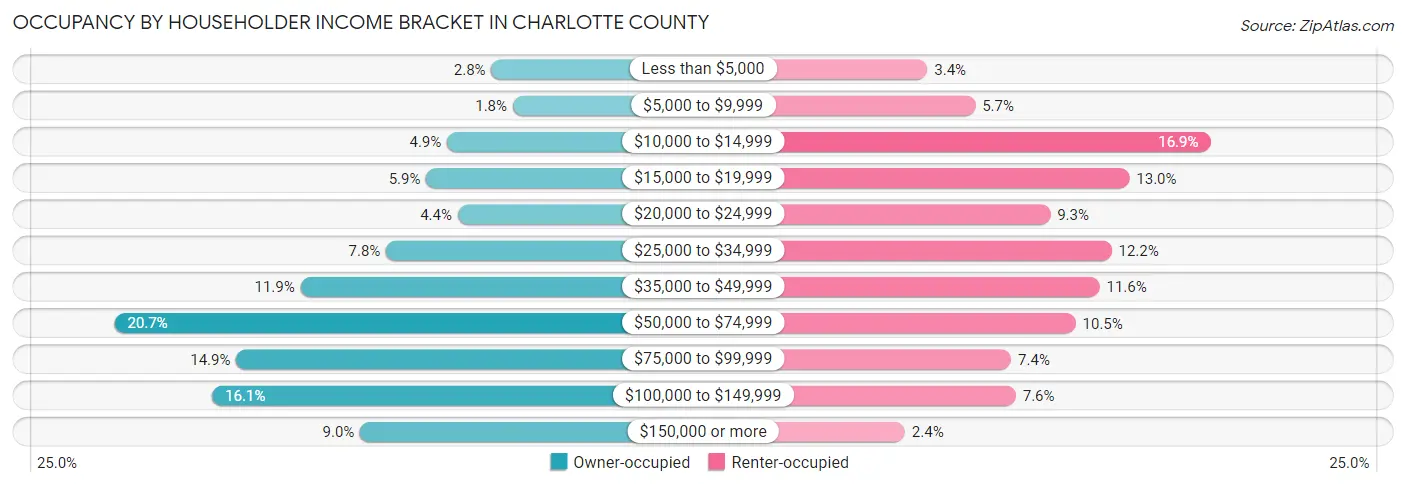
| Income Bracket | Owner-occupied | Renter-occupied |
| Less than $5,000 | 87 (2.8%) | 48 (3.4%) |
| $5,000 to $9,999 | 55 (1.8%) | 80 (5.7%) |
| $10,000 to $14,999 | 153 (4.9%) | 237 (16.9%) |
| $15,000 to $19,999 | 184 (5.9%) | 183 (13.0%) |
| $20,000 to $24,999 | 137 (4.4%) | 130 (9.3%) |
| $25,000 to $34,999 | 244 (7.8%) | 171 (12.2%) |
| $35,000 to $49,999 | 372 (11.9%) | 163 (11.6%) |
| $50,000 to $74,999 | 650 (20.7%) | 147 (10.5%) |
| $75,000 to $99,999 | 468 (14.9%) | 104 (7.4%) |
| $100,000 to $149,999 | 504 (16.1%) | 107 (7.6%) |
| $150,000 or more | 283 (9.0%) | 33 (2.4%) |
| Total | 3,137 (100.0%) | 1,403 (100.0%) |
Monthly Housing Cost Tiers in Charlotte County
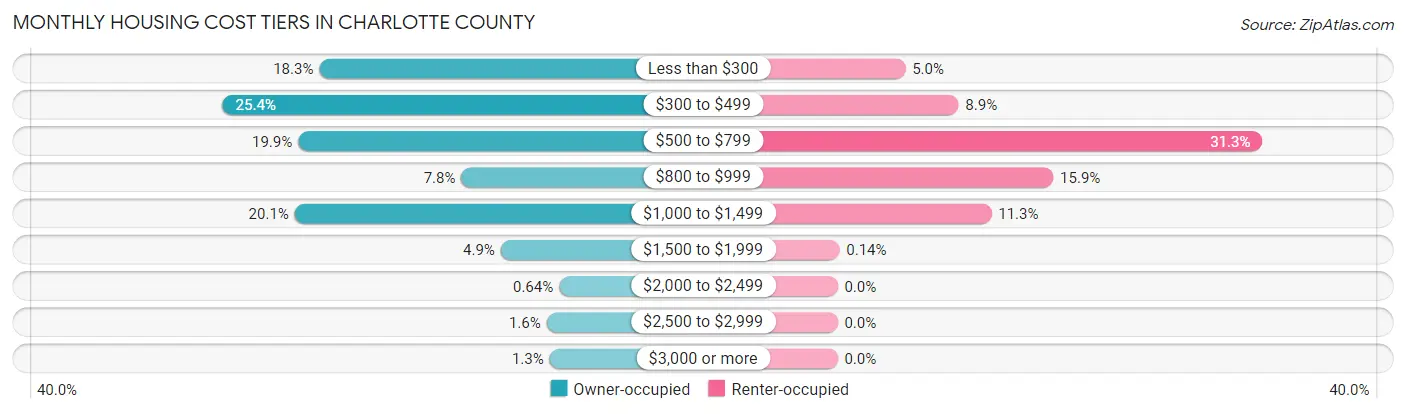
| Monthly Cost | Owner-occupied | Renter-occupied |
| Less than $300 | 574 (18.3%) | 70 (5.0%) |
| $300 to $499 | 797 (25.4%) | 125 (8.9%) |
| $500 to $799 | 623 (19.9%) | 439 (31.3%) |
| $800 to $999 | 246 (7.8%) | 223 (15.9%) |
| $1,000 to $1,499 | 631 (20.1%) | 159 (11.3%) |
| $1,500 to $1,999 | 155 (4.9%) | 2 (0.1%) |
| $2,000 to $2,499 | 20 (0.6%) | 0 (0.0%) |
| $2,500 to $2,999 | 49 (1.6%) | 0 (0.0%) |
| $3,000 or more | 42 (1.3%) | 0 (0.0%) |
| Total | 3,137 (100.0%) | 1,403 (100.0%) |
Physical Housing Characteristics in Charlotte County
Housing Structures in Charlotte County
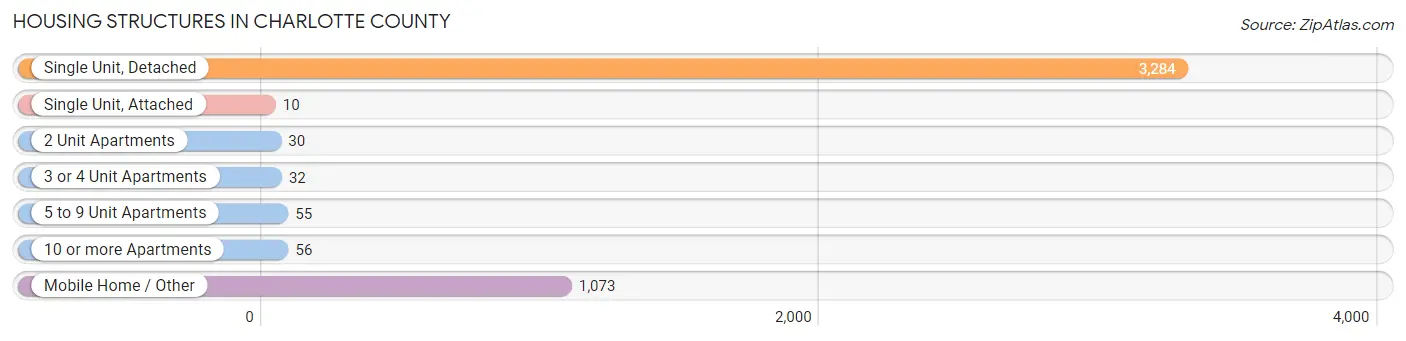
| Structure Type | # Housing Units | % Housing Units |
| Single Unit, Detached | 3,284 | 72.3% |
| Single Unit, Attached | 10 | 0.2% |
| 2 Unit Apartments | 30 | 0.7% |
| 3 or 4 Unit Apartments | 32 | 0.7% |
| 5 to 9 Unit Apartments | 55 | 1.2% |
| 10 or more Apartments | 56 | 1.2% |
| Mobile Home / Other | 1,073 | 23.6% |
| Total | 4,540 | 100.0% |
Housing Structures by Occupancy in Charlotte County
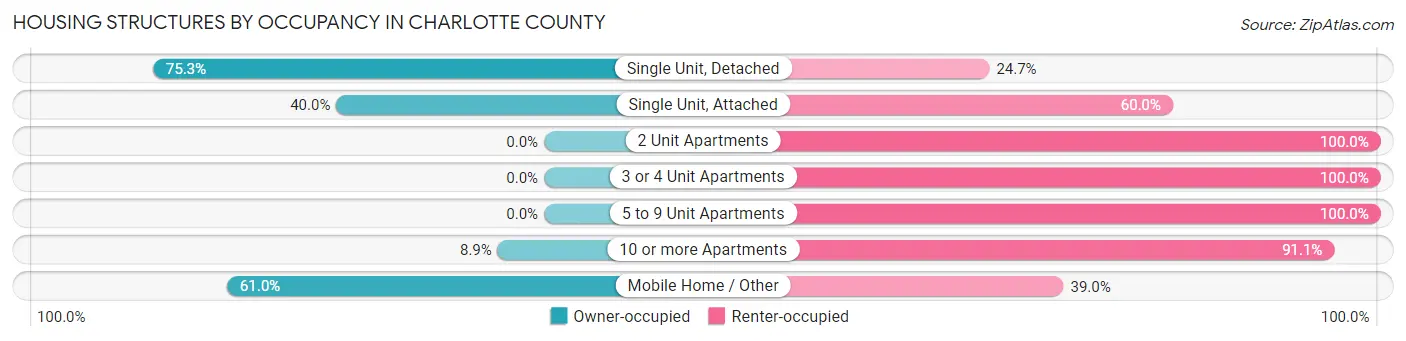
| Structure Type | Owner-occupied | Renter-occupied |
| Single Unit, Detached | 2,473 (75.3%) | 811 (24.7%) |
| Single Unit, Attached | 4 (40.0%) | 6 (60.0%) |
| 2 Unit Apartments | 0 (0.0%) | 30 (100.0%) |
| 3 or 4 Unit Apartments | 0 (0.0%) | 32 (100.0%) |
| 5 to 9 Unit Apartments | 0 (0.0%) | 55 (100.0%) |
| 10 or more Apartments | 5 (8.9%) | 51 (91.1%) |
| Mobile Home / Other | 655 (61.0%) | 418 (39.0%) |
| Total | 3,137 (69.1%) | 1,403 (30.9%) |
Housing Structures by Number of Rooms in Charlotte County
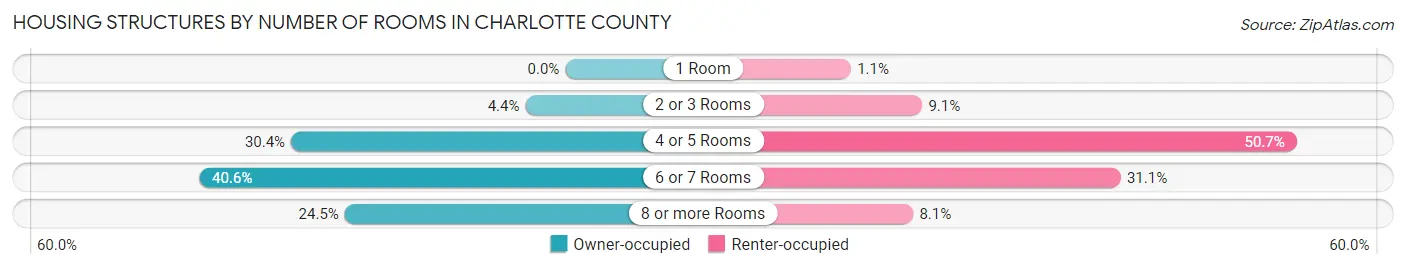
| Number of Rooms | Owner-occupied | Renter-occupied |
| 1 Room | 0 (0.0%) | 16 (1.1%) |
| 2 or 3 Rooms | 139 (4.4%) | 127 (9.0%) |
| 4 or 5 Rooms | 955 (30.4%) | 711 (50.7%) |
| 6 or 7 Rooms | 1,275 (40.6%) | 436 (31.1%) |
| 8 or more Rooms | 768 (24.5%) | 113 (8.1%) |
| Total | 3,137 (100.0%) | 1,403 (100.0%) |
Housing Structure by Heating Type in Charlotte County
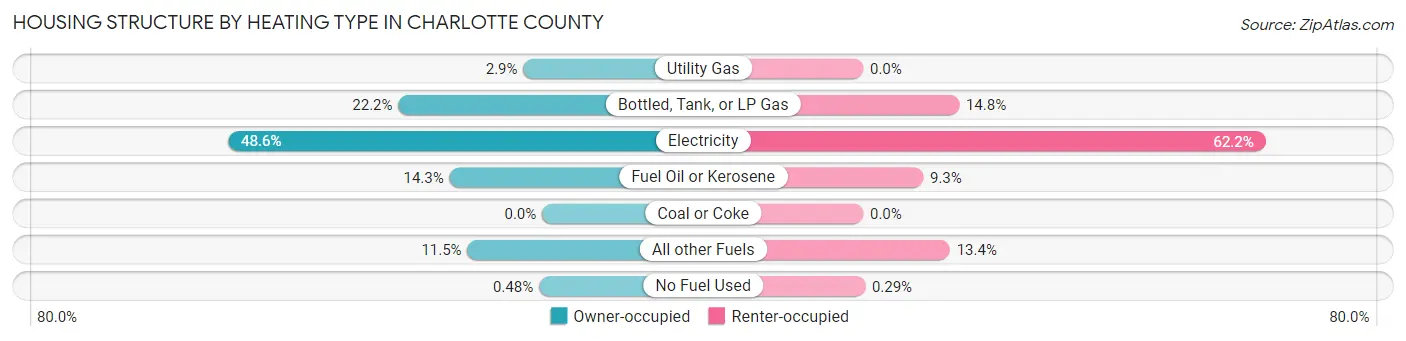
| Heating Type | Owner-occupied | Renter-occupied |
| Utility Gas | 91 (2.9%) | 0 (0.0%) |
| Bottled, Tank, or LP Gas | 697 (22.2%) | 208 (14.8%) |
| Electricity | 1,523 (48.5%) | 873 (62.2%) |
| Fuel Oil or Kerosene | 449 (14.3%) | 130 (9.3%) |
| Coal or Coke | 0 (0.0%) | 0 (0.0%) |
| All other Fuels | 362 (11.5%) | 188 (13.4%) |
| No Fuel Used | 15 (0.5%) | 4 (0.3%) |
| Total | 3,137 (100.0%) | 1,403 (100.0%) |
Household Vehicle Usage in Charlotte County
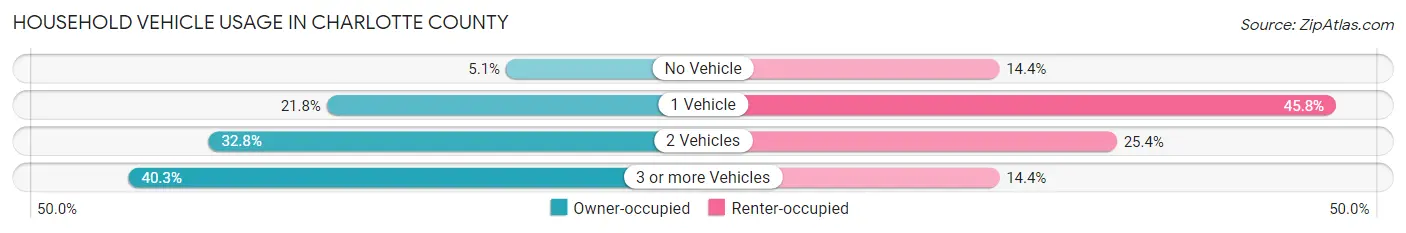
| Vehicles per Household | Owner-occupied | Renter-occupied |
| No Vehicle | 159 (5.1%) | 202 (14.4%) |
| 1 Vehicle | 684 (21.8%) | 643 (45.8%) |
| 2 Vehicles | 1,030 (32.8%) | 356 (25.4%) |
| 3 or more Vehicles | 1,264 (40.3%) | 202 (14.4%) |
| Total | 3,137 (100.0%) | 1,403 (100.0%) |
Real Estate & Mortgages in Charlotte County
Real Estate and Mortgage Overview in Charlotte County
| Characteristic | Without Mortgage | With Mortgage |
| Housing Units | 1,964 | 1,173 |
| Median Property Value | $136,600 | $137,900 |
| Median Household Income | $46,797 | $172 |
| Monthly Housing Costs | $375 | $42 |
| Real Estate Taxes | $711 | $45 |
Property Value by Mortgage Status in Charlotte County
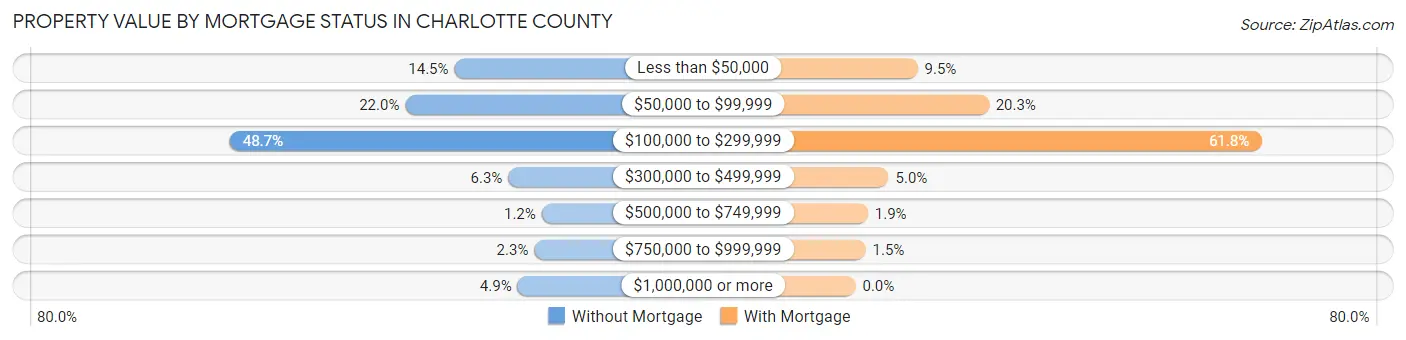
| Property Value | Without Mortgage | With Mortgage |
| Less than $50,000 | 285 (14.5%) | 111 (9.5%) |
| $50,000 to $99,999 | 432 (22.0%) | 238 (20.3%) |
| $100,000 to $299,999 | 957 (48.7%) | 725 (61.8%) |
| $300,000 to $499,999 | 124 (6.3%) | 59 (5.0%) |
| $500,000 to $749,999 | 24 (1.2%) | 22 (1.9%) |
| $750,000 to $999,999 | 46 (2.3%) | 18 (1.5%) |
| $1,000,000 or more | 96 (4.9%) | 0 (0.0%) |
| Total | 1,964 (100.0%) | 1,173 (100.0%) |
Household Income by Mortgage Status in Charlotte County
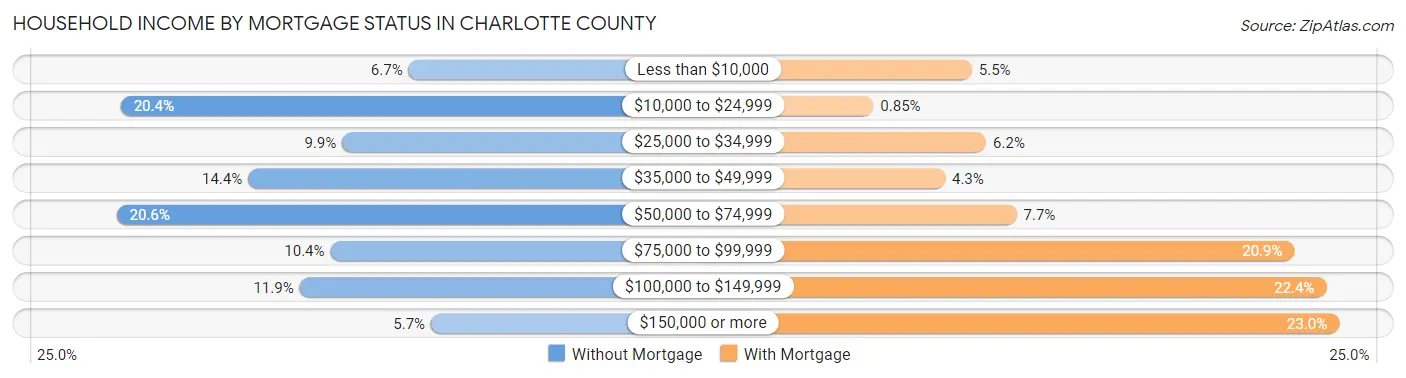
| Household Income | Without Mortgage | With Mortgage |
| Less than $10,000 | 132 (6.7%) | 65 (5.5%) |
| $10,000 to $24,999 | 401 (20.4%) | 10 (0.9%) |
| $25,000 to $34,999 | 194 (9.9%) | 73 (6.2%) |
| $35,000 to $49,999 | 282 (14.4%) | 50 (4.3%) |
| $50,000 to $74,999 | 405 (20.6%) | 90 (7.7%) |
| $75,000 to $99,999 | 205 (10.4%) | 245 (20.9%) |
| $100,000 to $149,999 | 234 (11.9%) | 263 (22.4%) |
| $150,000 or more | 111 (5.7%) | 270 (23.0%) |
| Total | 1,964 (100.0%) | 1,173 (100.0%) |
Property Value to Household Income Ratio in Charlotte County
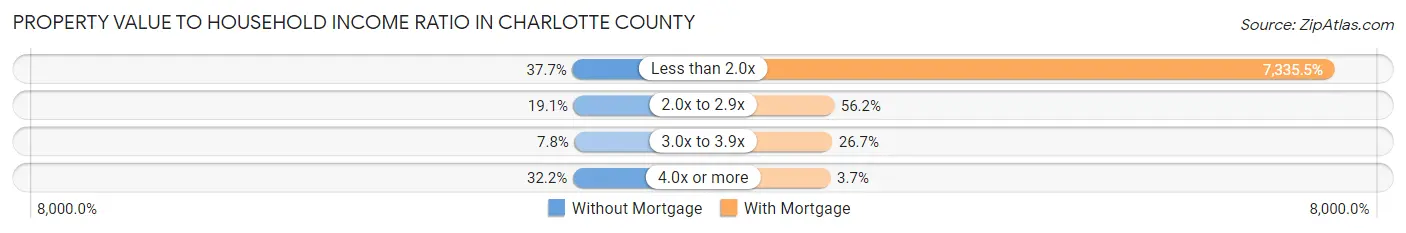
| Value-to-Income Ratio | Without Mortgage | With Mortgage |
| Less than 2.0x | 740 (37.7%) | 86,045 (7,335.5%) |
| 2.0x to 2.9x | 376 (19.1%) | 659 (56.2%) |
| 3.0x to 3.9x | 153 (7.8%) | 313 (26.7%) |
| 4.0x or more | 632 (32.2%) | 43 (3.7%) |
| Total | 1,964 (100.0%) | 1,173 (100.0%) |
Real Estate Taxes by Mortgage Status in Charlotte County
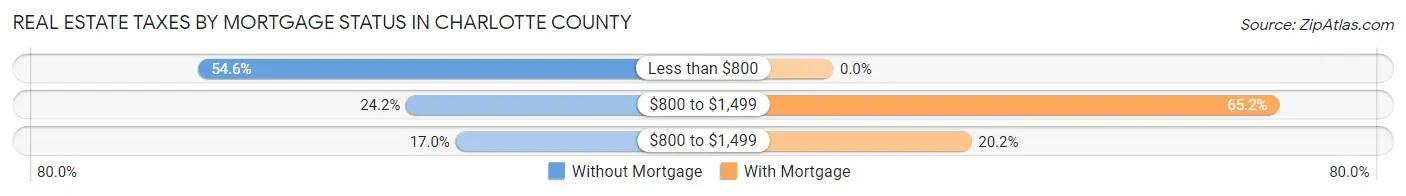
| Property Taxes | Without Mortgage | With Mortgage |
| Less than $800 | 1,073 (54.6%) | 0 (0.0%) |
| $800 to $1,499 | 476 (24.2%) | 765 (65.2%) |
| $800 to $1,499 | 334 (17.0%) | 237 (20.2%) |
| Total | 1,964 (100.0%) | 1,173 (100.0%) |
Health & Disability in Charlotte County
Health Insurance Coverage by Age in Charlotte County
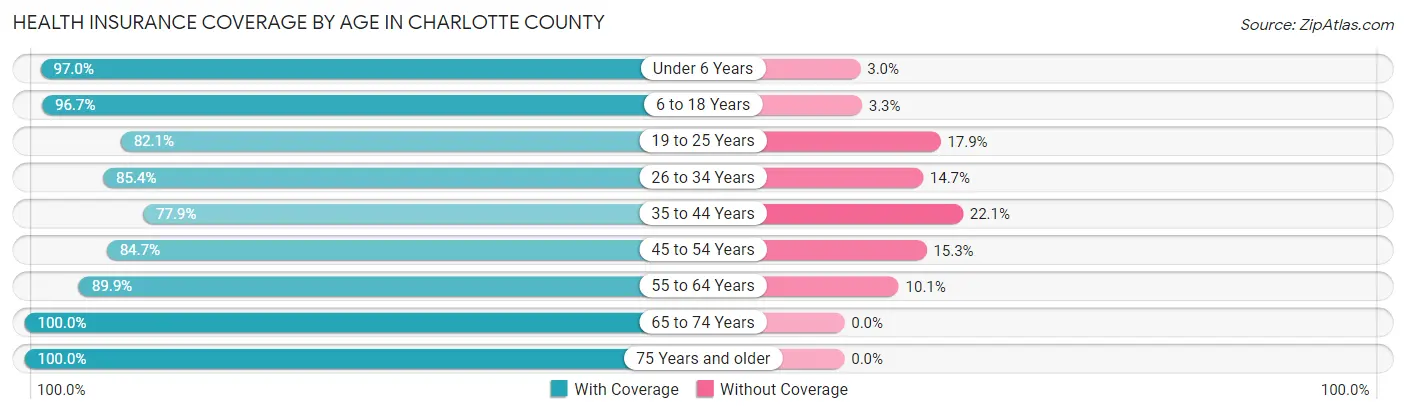
| Age Bracket | With Coverage | Without Coverage |
| Under 6 Years | 684 (97.0%) | 21 (3.0%) |
| 6 to 18 Years | 1,991 (96.7%) | 67 (3.3%) |
| 19 to 25 Years | 563 (82.1%) | 123 (17.9%) |
| 26 to 34 Years | 979 (85.4%) | 168 (14.6%) |
| 35 to 44 Years | 843 (77.9%) | 239 (22.1%) |
| 45 to 54 Years | 1,172 (84.7%) | 212 (15.3%) |
| 55 to 64 Years | 1,659 (89.9%) | 187 (10.1%) |
| 65 to 74 Years | 1,443 (100.0%) | 0 (0.0%) |
| 75 Years and older | 1,073 (100.0%) | 0 (0.0%) |
| Total | 10,407 (91.1%) | 1,017 (8.9%) |
Health Insurance Coverage by Citizenship Status in Charlotte County

| Citizenship Status | With Coverage | Without Coverage |
| Native Born | 684 (97.0%) | 21 (3.0%) |
| Foreign Born, Citizen | 1,991 (96.7%) | 67 (3.3%) |
| Foreign Born, not a Citizen | 563 (82.1%) | 123 (17.9%) |
Health Insurance Coverage by Household Income in Charlotte County
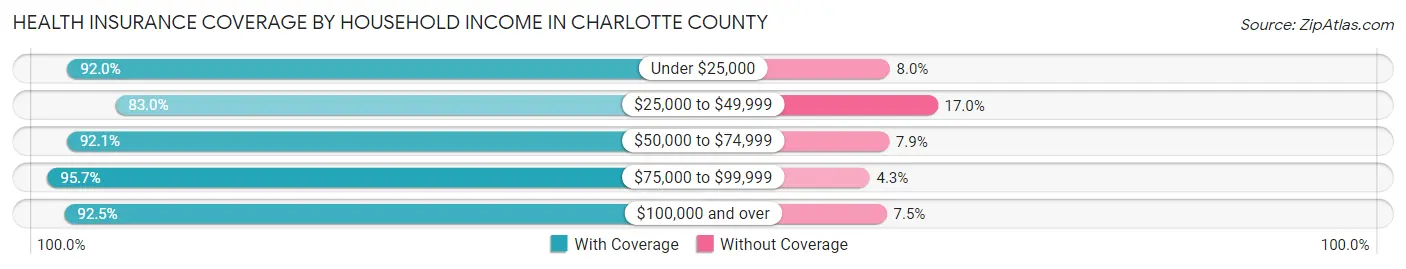
| Household Income | With Coverage | Without Coverage |
| Under $25,000 | 2,099 (92.0%) | 183 (8.0%) |
| $25,000 to $49,999 | 1,763 (83.0%) | 361 (17.0%) |
| $50,000 to $74,999 | 1,890 (92.1%) | 162 (7.9%) |
| $75,000 to $99,999 | 1,822 (95.7%) | 81 (4.3%) |
| $100,000 and over | 2,816 (92.5%) | 227 (7.5%) |
Public vs Private Health Insurance Coverage by Age in Charlotte County
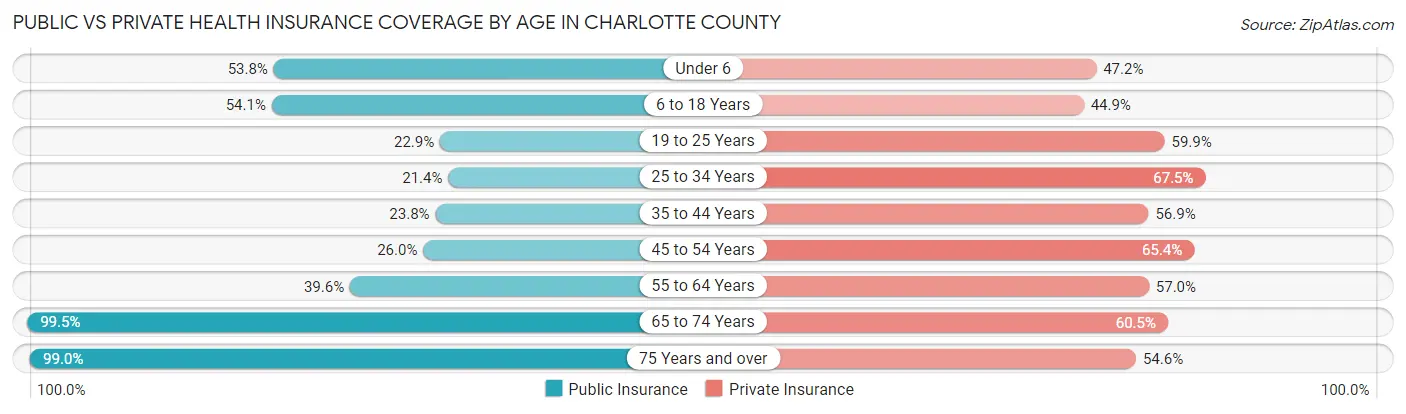
| Age Bracket | Public Insurance | Private Insurance |
| Under 6 | 379 (53.8%) | 333 (47.2%) |
| 6 to 18 Years | 1,114 (54.1%) | 924 (44.9%) |
| 19 to 25 Years | 157 (22.9%) | 411 (59.9%) |
| 25 to 34 Years | 245 (21.4%) | 774 (67.5%) |
| 35 to 44 Years | 257 (23.7%) | 616 (56.9%) |
| 45 to 54 Years | 360 (26.0%) | 905 (65.4%) |
| 55 to 64 Years | 731 (39.6%) | 1,052 (57.0%) |
| 65 to 74 Years | 1,436 (99.5%) | 873 (60.5%) |
| 75 Years and over | 1,062 (99.0%) | 586 (54.6%) |
| Total | 5,741 (50.2%) | 6,474 (56.7%) |
Disability Status by Sex by Age in Charlotte County
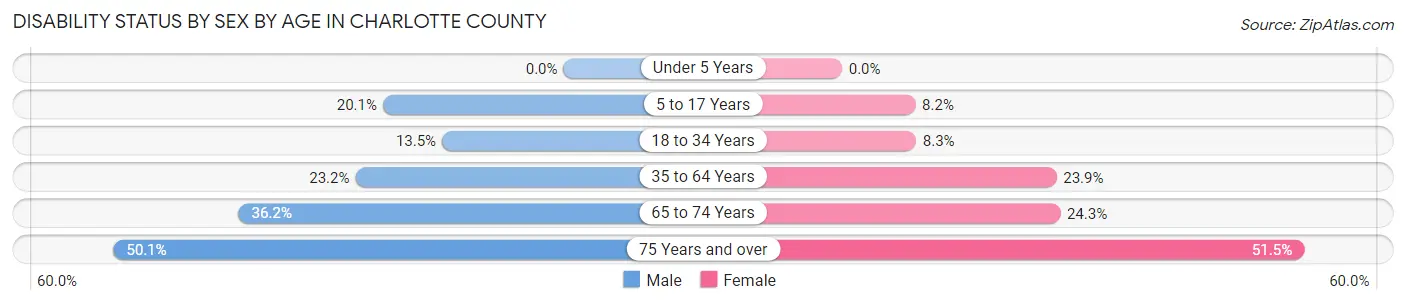
| Age Bracket | Male | Female |
| Under 5 Years | 0 (0.0%) | 0 (0.0%) |
| 5 to 17 Years | 229 (20.1%) | 67 (8.2%) |
| 18 to 34 Years | 141 (13.5%) | 81 (8.3%) |
| 35 to 64 Years | 491 (23.2%) | 524 (23.9%) |
| 65 to 74 Years | 251 (36.2%) | 182 (24.3%) |
| 75 Years and over | 231 (50.1%) | 315 (51.5%) |
Disability Class by Sex by Age in Charlotte County
Disability Class: Hearing Difficulty
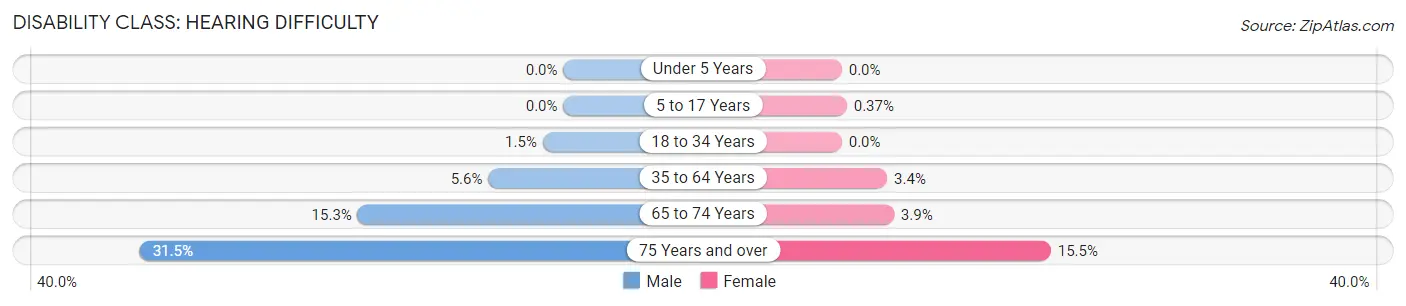
| Age Bracket | Male | Female |
| Under 5 Years | 0 (0.0%) | 0 (0.0%) |
| 5 to 17 Years | 0 (0.0%) | 3 (0.4%) |
| 18 to 34 Years | 16 (1.5%) | 0 (0.0%) |
| 35 to 64 Years | 118 (5.6%) | 74 (3.4%) |
| 65 to 74 Years | 106 (15.3%) | 29 (3.9%) |
| 75 Years and over | 145 (31.5%) | 95 (15.5%) |
Disability Class: Vision Difficulty
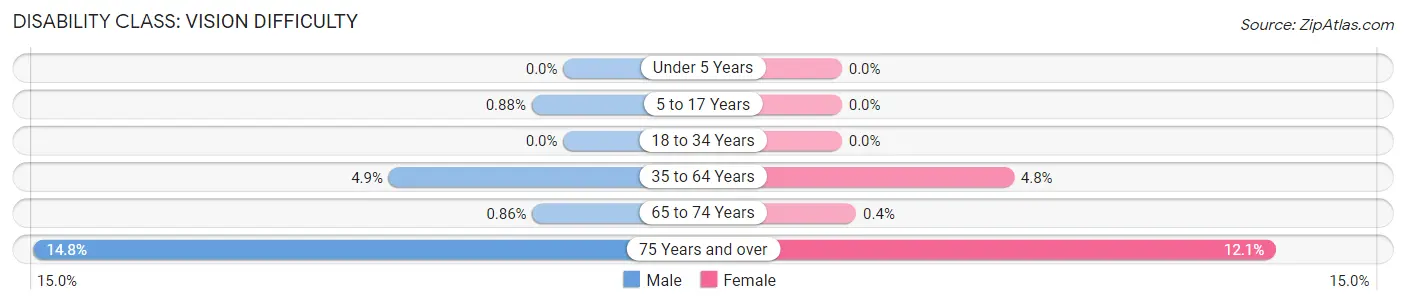
| Age Bracket | Male | Female |
| Under 5 Years | 0 (0.0%) | 0 (0.0%) |
| 5 to 17 Years | 10 (0.9%) | 0 (0.0%) |
| 18 to 34 Years | 0 (0.0%) | 0 (0.0%) |
| 35 to 64 Years | 103 (4.9%) | 105 (4.8%) |
| 65 to 74 Years | 6 (0.9%) | 3 (0.4%) |
| 75 Years and over | 68 (14.7%) | 74 (12.1%) |
Disability Class: Cognitive Difficulty
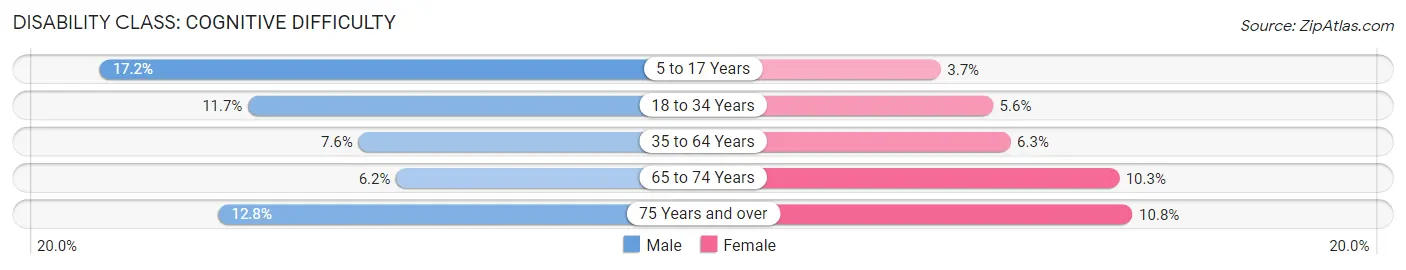
| Age Bracket | Male | Female |
| 5 to 17 Years | 196 (17.2%) | 30 (3.7%) |
| 18 to 34 Years | 122 (11.7%) | 55 (5.6%) |
| 35 to 64 Years | 161 (7.6%) | 137 (6.2%) |
| 65 to 74 Years | 43 (6.2%) | 77 (10.3%) |
| 75 Years and over | 59 (12.8%) | 66 (10.8%) |
Disability Class: Ambulatory Difficulty
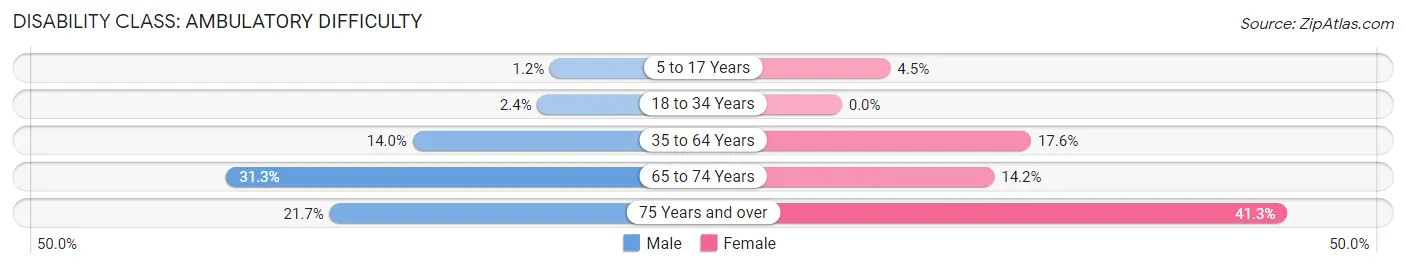
| Age Bracket | Male | Female |
| 5 to 17 Years | 14 (1.2%) | 37 (4.5%) |
| 18 to 34 Years | 25 (2.4%) | 0 (0.0%) |
| 35 to 64 Years | 296 (14.0%) | 385 (17.6%) |
| 65 to 74 Years | 217 (31.3%) | 106 (14.1%) |
| 75 Years and over | 100 (21.7%) | 253 (41.3%) |
Disability Class: Self-Care Difficulty
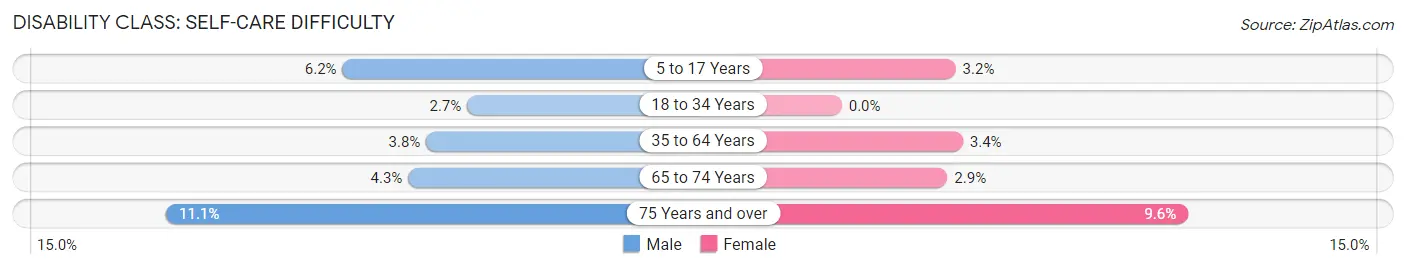
| Age Bracket | Male | Female |
| 5 to 17 Years | 70 (6.1%) | 26 (3.2%) |
| 18 to 34 Years | 28 (2.7%) | 0 (0.0%) |
| 35 to 64 Years | 81 (3.8%) | 74 (3.4%) |
| 65 to 74 Years | 30 (4.3%) | 22 (2.9%) |
| 75 Years and over | 51 (11.1%) | 59 (9.6%) |
Technology Access in Charlotte County
Computing Device Access in Charlotte County
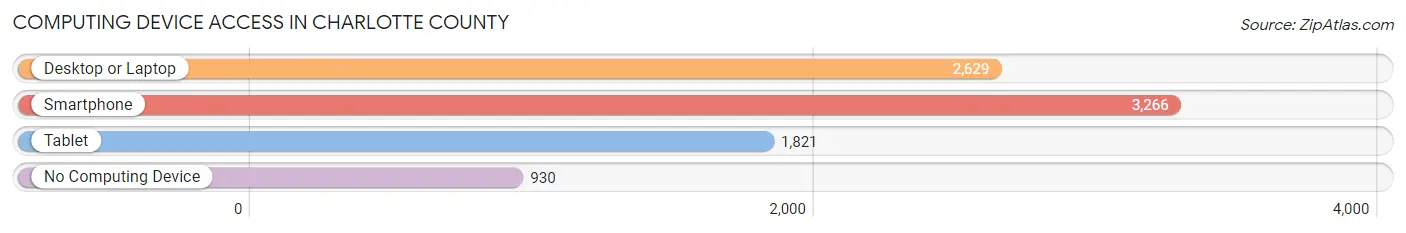
| Device Type | # Households | % Households |
| Desktop or Laptop | 2,629 | 57.9% |
| Smartphone | 3,266 | 71.9% |
| Tablet | 1,821 | 40.1% |
| No Computing Device | 930 | 20.5% |
| Total | 4,540 | 100.0% |
Internet Access in Charlotte County
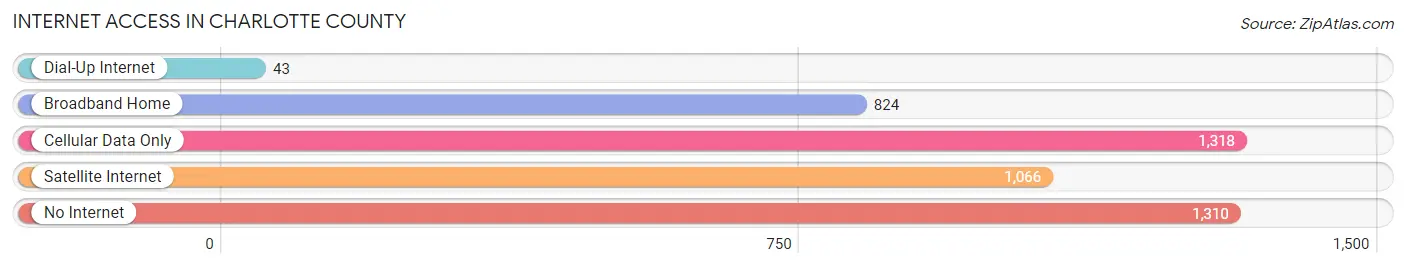
| Internet Type | # Households | % Households |
| Dial-Up Internet | 43 | 0.9% |
| Broadband Home | 824 | 18.1% |
| Cellular Data Only | 1,318 | 29.0% |
| Satellite Internet | 1,066 | 23.5% |
| No Internet | 1,310 | 28.8% |
| Total | 4,540 | 100.0% |
Charlotte County Summary
Charlotte County, Virginia is located in the south-central part of the state, and is bordered by Halifax County to the north, Prince Edward County to the east, Lunenburg County to the south, and Mecklenburg County to the west. The county seat is Charlotte Court House, and the county has a total area of 441 square miles, of which 439 square miles is land and 2 square miles is water.
History
Charlotte County was formed in 1764 from Lunenburg County. It was named for Queen Charlotte of Mecklenburg-Strelitz, the wife of King George III of England. The county was the site of several battles during the American Revolutionary War, including the Battle of Charlotte Court House in 1781.
In the 19th century, Charlotte County was a major producer of tobacco, and the county was home to several large plantations. The county was also the site of several Civil War battles, including the Battle of Staunton River Bridge in 1864.
Geography
Charlotte County is located in the Piedmont region of Virginia, and is characterized by rolling hills and valleys. The county is drained by the Staunton River, which flows through the county from north to south. The county is also home to several small lakes, including Lake Gaston and Lake Chesdin.
The county is mostly rural, with the majority of the population living in small towns and villages. The largest town in the county is Charlotte Court House, which is the county seat. Other towns in the county include Keysville, Phenix, and Red Oak.
Economy
The economy of Charlotte County is largely based on agriculture. The county is home to several large farms, and the main crops grown in the county are tobacco, corn, soybeans, and wheat. The county is also home to several large poultry farms, and the county is a major producer of eggs and poultry products.
Charlotte County is also home to several manufacturing companies, including a furniture factory, a paper mill, and a plastics plant. The county is also home to several retail stores, including a Walmart Supercenter.
Demographics
As of the 2010 census, Charlotte County had a population of 12,586. The racial makeup of the county was 79.2% White, 17.7% African American, 0.3% Native American, 0.4% Asian, 0.1% Pacific Islander, 0.7% from other races, and 1.6% from two or more races. Hispanic or Latino of any race were 2.2% of the population.
The median income for a household in the county was $37,945, and the median income for a family was $45,945. The per capita income for the county was $18,945. About 17.2% of families and 21.2% of the population were below the poverty line, including 28.2% of those under age 18 and 16.2% of those age 65 or over.
Common Questions
What is Per Capita Income in Charlotte County?
Per Capita income in Charlotte County is $27,159.
What is the Median Family Income in Charlotte County?
Median Family Income in Charlotte County is $70,183.
What is the Median Household income in Charlotte County?
Median Household Income in Charlotte County is $51,548.
What is Income or Wage Gap in Charlotte County?
Income or Wage Gap in Charlotte County is 28.3%.
Women in Charlotte County earn 71.7 cents for every dollar earned by a man.
What is Family Income Deficit in Charlotte County?
Family Income Deficit in Charlotte County is $9,585.
Families that are below poverty line in Charlotte County earn $9,585 less on average than the poverty threshold level.
What is Inequality or Gini Index in Charlotte County?
Inequality or Gini Index in Charlotte County is 0.46.
What is the Total Population of Charlotte County?
Total Population of Charlotte County is 11,563.
What is the Total Male Population of Charlotte County?
Total Male Population of Charlotte County is 5,865.
What is the Total Female Population of Charlotte County?
Total Female Population of Charlotte County is 5,698.
What is the Ratio of Males per 100 Females in Charlotte County?
There are 102.93 Males per 100 Females in Charlotte County.
What is the Ratio of Females per 100 Males in Charlotte County?
There are 97.15 Females per 100 Males in Charlotte County.
What is the Median Population Age in Charlotte County?
Median Population Age in Charlotte County is 45.4 Years.
What is the Average Family Size in Charlotte County
Average Family Size in Charlotte County is 3.2 People.
What is the Average Household Size in Charlotte County
Average Household Size in Charlotte County is 2.5 People.
How Large is the Labor Force in Charlotte County?
There are 4,867 People in the Labor Forcein in Charlotte County.
What is the Percentage of People in the Labor Force in Charlotte County?
52.7% of People are in the Labor Force in Charlotte County.
What is the Unemployment Rate in Charlotte County?
Unemployment Rate in Charlotte County is 3.6%.