Campbell County, VA Map & Demographics
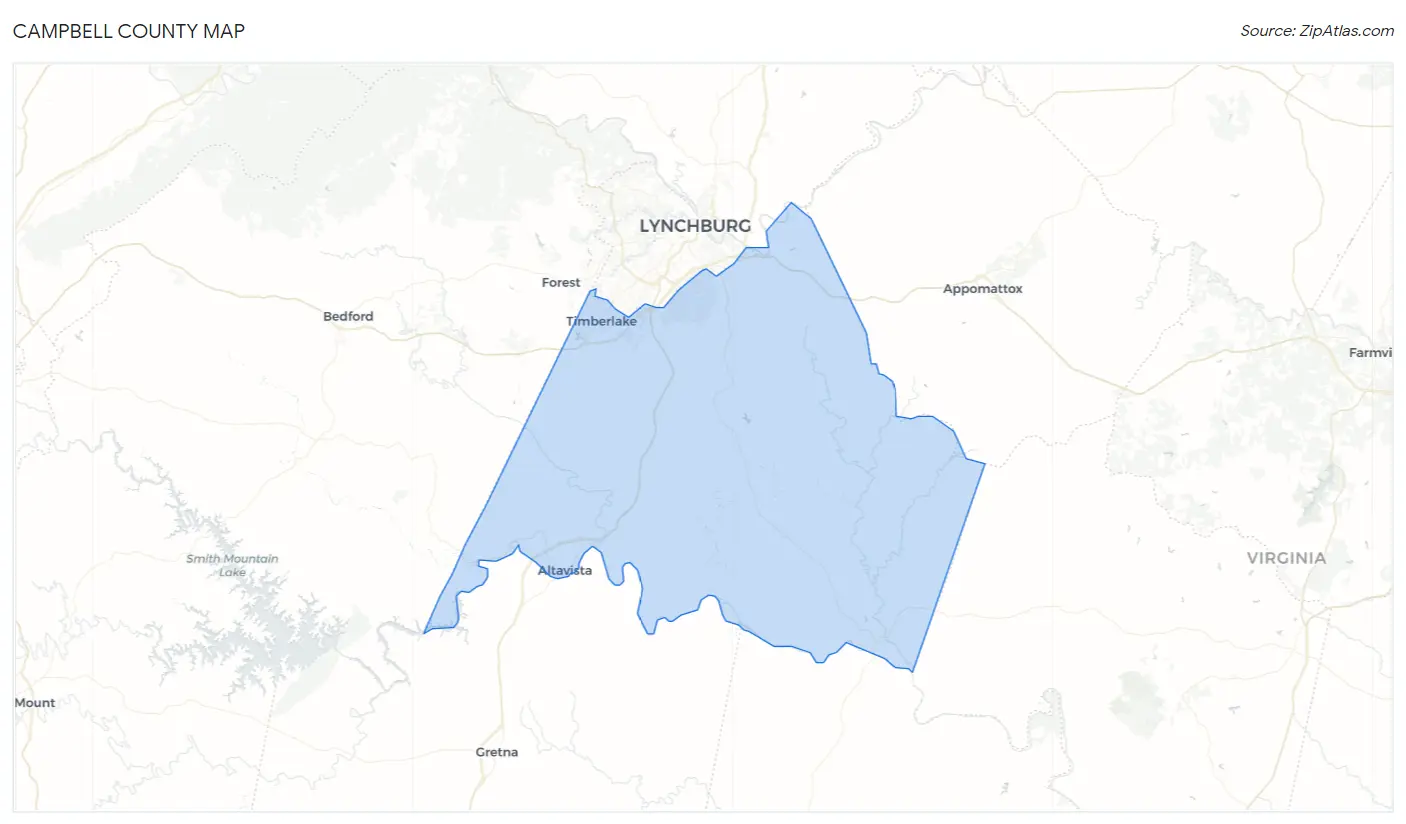
Campbell County Map
Campbell County Overview
$31,877
PER CAPITA INCOME
$74,391
AVG FAMILY INCOME
$59,022
AVG HOUSEHOLD INCOME
20.8%
WAGE / INCOME GAP [ % ]
79.2¢/ $1
WAGE / INCOME GAP [ $ ]
$10,927
FAMILY INCOME DEFICIT
0.42
INEQUALITY / GINI INDEX
55,518
TOTAL POPULATION
27,091
MALE POPULATION
28,427
FEMALE POPULATION
95.30
MALES / 100 FEMALES
104.93
FEMALES / 100 MALES
43.1
MEDIAN AGE
3.0
AVG FAMILY SIZE
2.5
AVG HOUSEHOLD SIZE
27,582
LABOR FORCE [ PEOPLE ]
60.0%
PERCENT IN LABOR FORCE
4.9%
UNEMPLOYMENT RATE
Campbell County Area Codes
Income in Campbell County
Income Overview in Campbell County
Per Capita Income in Campbell County is $31,877, while median incomes of families and households are $74,391 and $59,022 respectively.
| Characteristic | Number | Measure |
| Per Capita Income | 55,518 | $31,877 |
| Median Family Income | 14,710 | $74,391 |
| Mean Family Income | 14,710 | $90,840 |
| Median Household Income | 22,409 | $59,022 |
| Mean Household Income | 22,409 | $76,036 |
| Income Deficit | 14,710 | $10,927 |
| Wage / Income Gap (%) | 55,518 | 20.81% |
| Wage / Income Gap ($) | 55,518 | 79.19¢ per $1 |
| Gini / Inequality Index | 55,518 | 0.42 |
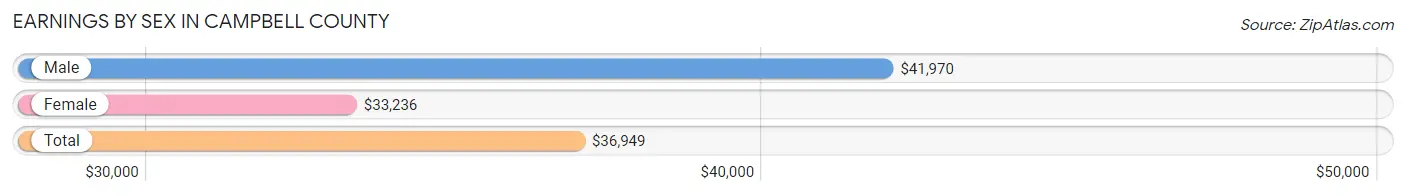
Earnings by Sex in Campbell County
Average Earnings in Campbell County are $36,949, $41,970 for men and $33,236 for women, a difference of 20.8%.
| Sex | Number | Average Earnings |
| Male | 14,661 (51.8%) | $41,970 |
| Female | 13,666 (48.2%) | $33,236 |
| Total | 28,327 (100.0%) | $36,949 |
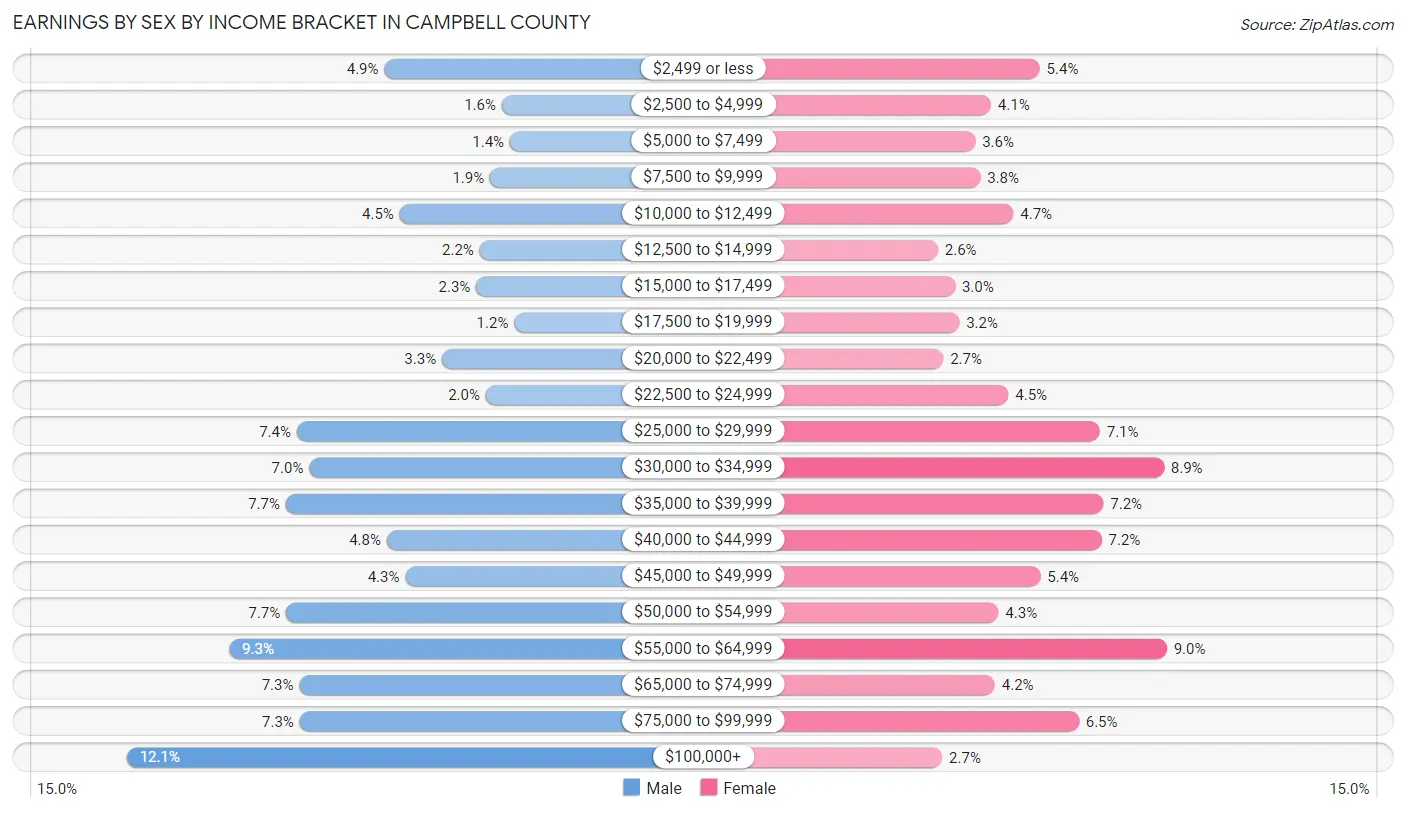
Earnings by Sex by Income Bracket in Campbell County
The most common earnings brackets in Campbell County are $100,000+ for men (1,778 | 12.1%) and $55,000 to $64,999 for women (1,229 | 9.0%).
| Income | Male | Female |
| $2,499 or less | 717 (4.9%) | 741 (5.4%) |
| $2,500 to $4,999 | 233 (1.6%) | 554 (4.1%) |
| $5,000 to $7,499 | 200 (1.4%) | 494 (3.6%) |
| $7,500 to $9,999 | 281 (1.9%) | 512 (3.7%) |
| $10,000 to $12,499 | 654 (4.5%) | 640 (4.7%) |
| $12,500 to $14,999 | 324 (2.2%) | 350 (2.6%) |
| $15,000 to $17,499 | 338 (2.3%) | 416 (3.0%) |
| $17,500 to $19,999 | 182 (1.2%) | 432 (3.2%) |
| $20,000 to $22,499 | 480 (3.3%) | 371 (2.7%) |
| $22,500 to $24,999 | 299 (2.0%) | 620 (4.5%) |
| $25,000 to $29,999 | 1,078 (7.3%) | 972 (7.1%) |
| $30,000 to $34,999 | 1,026 (7.0%) | 1,218 (8.9%) |
| $35,000 to $39,999 | 1,123 (7.7%) | 986 (7.2%) |
| $40,000 to $44,999 | 707 (4.8%) | 979 (7.2%) |
| $45,000 to $49,999 | 630 (4.3%) | 744 (5.4%) |
| $50,000 to $54,999 | 1,122 (7.6%) | 582 (4.3%) |
| $55,000 to $64,999 | 1,356 (9.2%) | 1,229 (9.0%) |
| $65,000 to $74,999 | 1,067 (7.3%) | 569 (4.2%) |
| $75,000 to $99,999 | 1,066 (7.3%) | 891 (6.5%) |
| $100,000+ | 1,778 (12.1%) | 366 (2.7%) |
| Total | 14,661 (100.0%) | 13,666 (100.0%) |
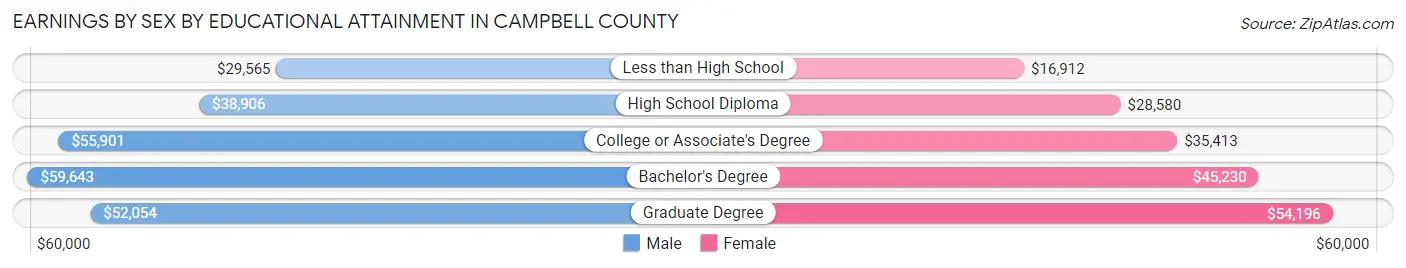
Earnings by Sex by Educational Attainment in Campbell County
Average earnings in Campbell County are $50,132 for men and $36,451 for women, a difference of 27.3%. Men with an educational attainment of bachelor's degree enjoy the highest average annual earnings of $59,643, while those with less than high school education earn the least with $29,565. Women with an educational attainment of graduate degree earn the most with the average annual earnings of $54,196, while those with less than high school education have the smallest earnings of $16,912.
| Educational Attainment | Male Income | Female Income |
| Less than High School | $29,565 | $16,912 |
| High School Diploma | $38,906 | $28,580 |
| College or Associate's Degree | $55,901 | $35,413 |
| Bachelor's Degree | $59,643 | $45,230 |
| Graduate Degree | $52,054 | $54,196 |
| Total | $50,132 | $36,451 |
Family Income in Campbell County
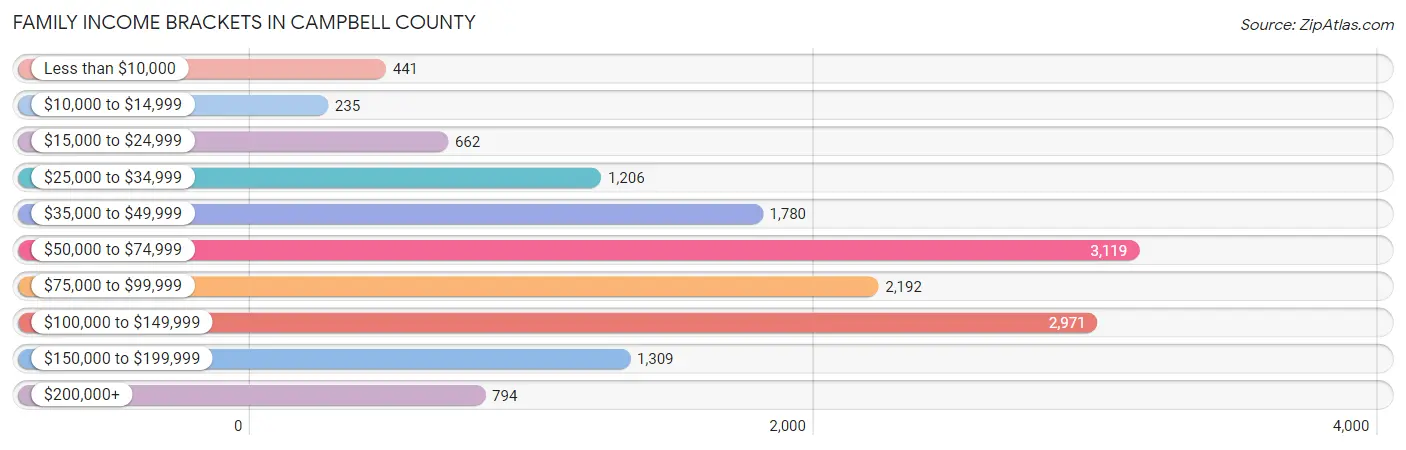
Family Income Brackets in Campbell County
According to the Campbell County family income data, there are 3,119 families falling into the $50,000 to $74,999 income range, which is the most common income bracket and makes up 21.2% of all families. Conversely, the $10,000 to $14,999 income bracket is the least frequent group with only 235 families (1.6%) belonging to this category.
| Income Bracket | # Families | % Families |
| Less than $10,000 | 441 | 3.0% |
| $10,000 to $14,999 | 235 | 1.6% |
| $15,000 to $24,999 | 662 | 4.5% |
| $25,000 to $34,999 | 1,206 | 8.2% |
| $35,000 to $49,999 | 1,780 | 12.1% |
| $50,000 to $74,999 | 3,119 | 21.2% |
| $75,000 to $99,999 | 2,192 | 14.9% |
| $100,000 to $149,999 | 2,971 | 20.2% |
| $150,000 to $199,999 | 1,309 | 8.9% |
| $200,000+ | 794 | 5.4% |
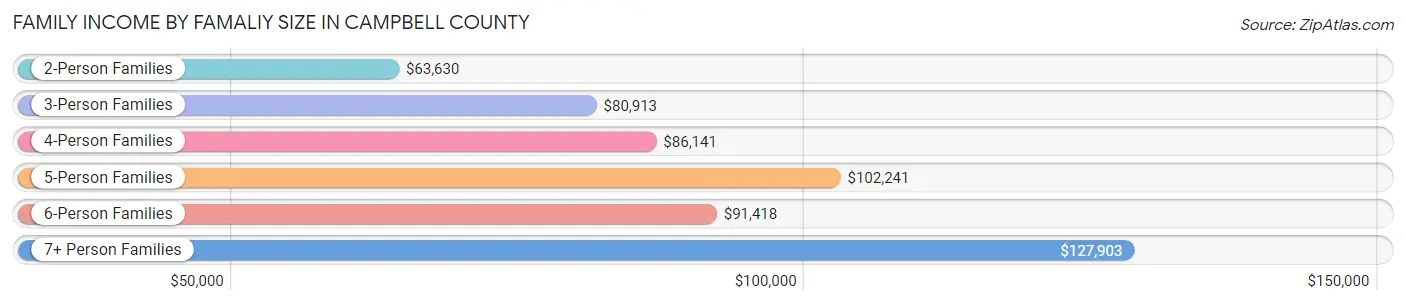
Family Income by Famaliy Size in Campbell County
7+ person families (212 | 1.4%) account for the highest median family income in Campbell County with $127,903 per family, while 2-person families (7,730 | 52.5%) have the highest median income of $31,815 per family member.
| Income Bracket | # Families | Median Income |
| 2-Person Families | 7,730 (52.5%) | $63,630 |
| 3-Person Families | 2,882 (19.6%) | $80,913 |
| 4-Person Families | 1,973 (13.4%) | $86,141 |
| 5-Person Families | 1,420 (9.7%) | $102,241 |
| 6-Person Families | 493 (3.4%) | $91,418 |
| 7+ Person Families | 212 (1.4%) | $127,903 |
| Total | 14,710 (100.0%) | $74,391 |
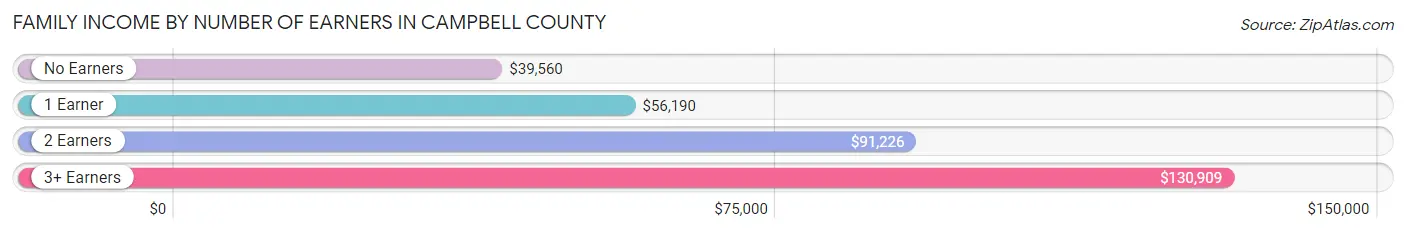
Family Income by Number of Earners in Campbell County
The median family income in Campbell County is $74,391, with families comprising 3+ earners (1,648) having the highest median family income of $130,909, while families with no earners (2,799) have the lowest median family income of $39,560, accounting for 11.2% and 19.0% of families, respectively.
| Number of Earners | # Families | Median Income |
| No Earners | 2,799 (19.0%) | $39,560 |
| 1 Earner | 4,337 (29.5%) | $56,190 |
| 2 Earners | 5,926 (40.3%) | $91,226 |
| 3+ Earners | 1,648 (11.2%) | $130,909 |
| Total | 14,710 (100.0%) | $74,391 |
Household Income in Campbell County
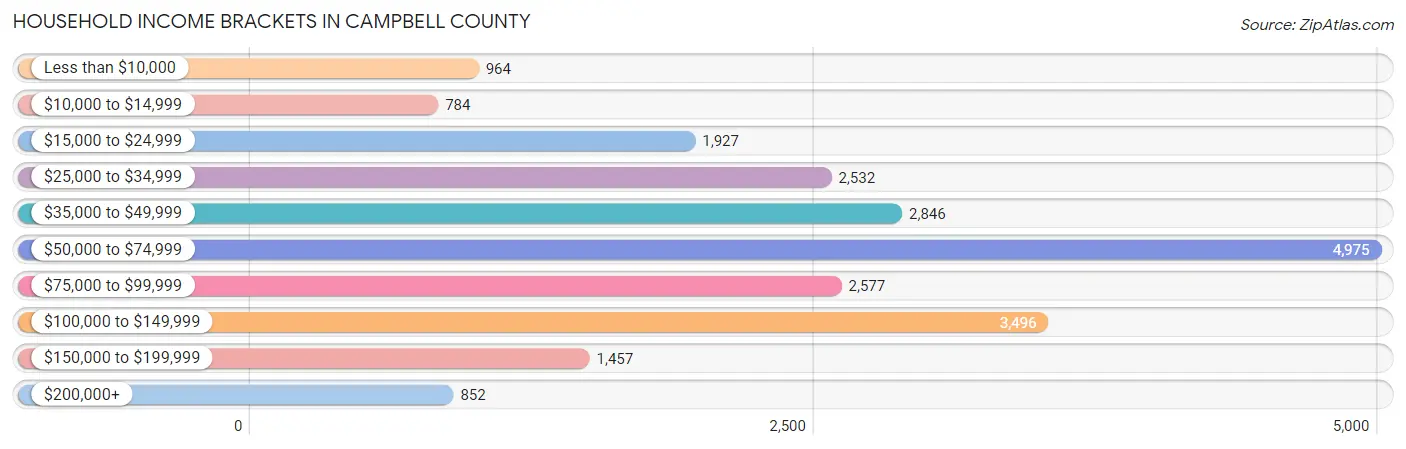
Household Income Brackets in Campbell County
With 4,975 households falling in the category, the $50,000 to $74,999 income range is the most frequent in Campbell County, accounting for 22.2% of all households. In contrast, only 784 households (3.5%) fall into the $10,000 to $14,999 income bracket, making it the least populous group.
| Income Bracket | # Households | % Households |
| Less than $10,000 | 964 | 4.3% |
| $10,000 to $14,999 | 784 | 3.5% |
| $15,000 to $24,999 | 1,927 | 8.6% |
| $25,000 to $34,999 | 2,532 | 11.3% |
| $35,000 to $49,999 | 2,846 | 12.7% |
| $50,000 to $74,999 | 4,975 | 22.2% |
| $75,000 to $99,999 | 2,577 | 11.5% |
| $100,000 to $149,999 | 3,496 | 15.6% |
| $150,000 to $199,999 | 1,457 | 6.5% |
| $200,000+ | 852 | 3.8% |
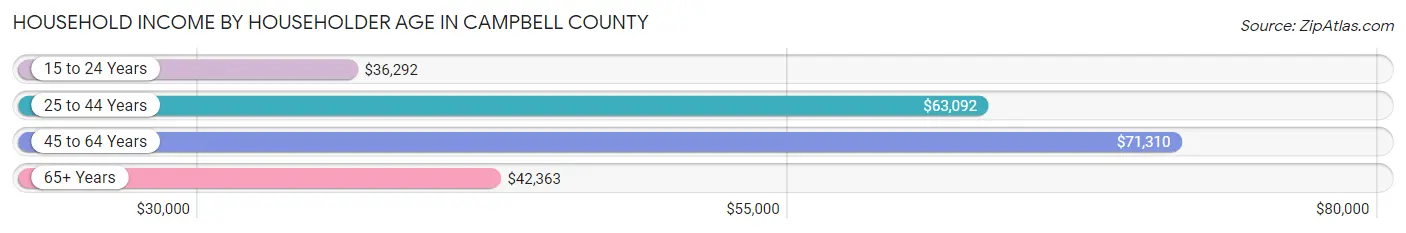
Household Income by Householder Age in Campbell County
The median household income in Campbell County is $59,022, with the highest median household income of $71,310 found in the 45 to 64 years age bracket for the primary householder. A total of 8,435 households (37.6%) fall into this category. Meanwhile, the 15 to 24 years age bracket for the primary householder has the lowest median household income of $36,292, with 646 households (2.9%) in this group.
| Income Bracket | # Households | Median Income |
| 15 to 24 Years | 646 (2.9%) | $36,292 |
| 25 to 44 Years | 6,445 (28.8%) | $63,092 |
| 45 to 64 Years | 8,435 (37.6%) | $71,310 |
| 65+ Years | 6,883 (30.7%) | $42,363 |
| Total | 22,409 (100.0%) | $59,022 |
Poverty in Campbell County
Income Below Poverty by Sex and Age in Campbell County
With 9.0% poverty level for males and 10.9% for females among the residents of Campbell County, 5 year old males and 18 to 24 year old females are the most vulnerable to poverty, with 40 males (14.9%) and 517 females (22.9%) in their respective age groups living below the poverty level.
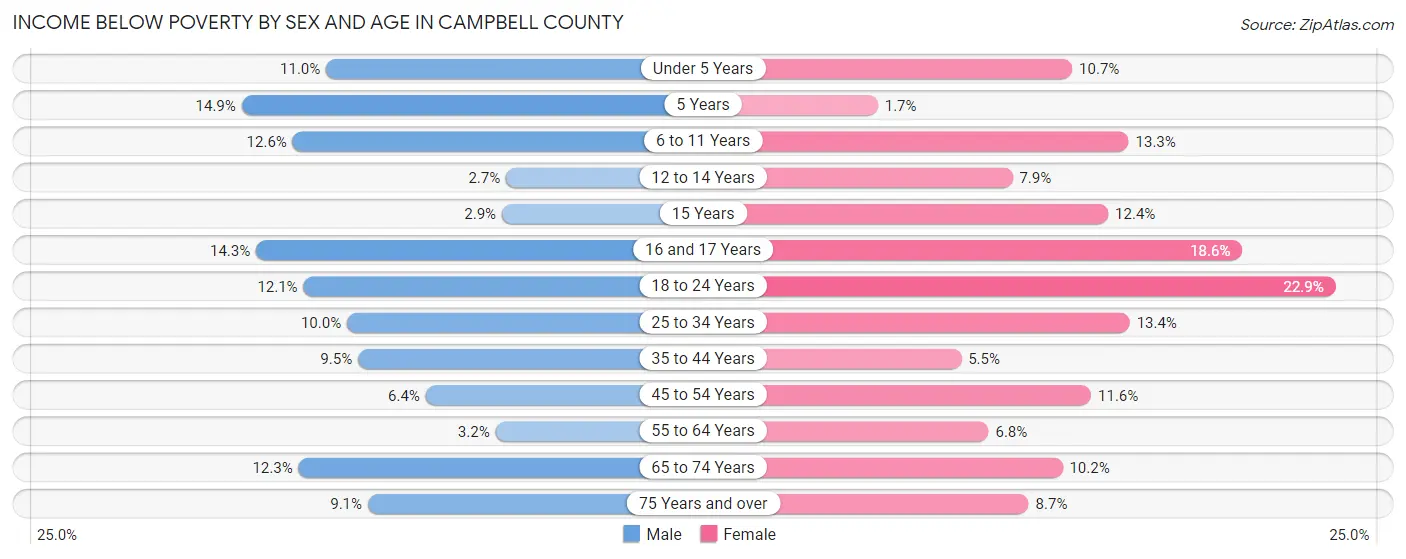
| Age Bracket | Male | Female |
| Under 5 Years | 130 (11.0%) | 165 (10.7%) |
| 5 Years | 40 (14.9%) | 5 (1.7%) |
| 6 to 11 Years | 270 (12.6%) | 220 (13.3%) |
| 12 to 14 Years | 19 (2.7%) | 76 (7.9%) |
| 15 Years | 9 (2.9%) | 34 (12.4%) |
| 16 and 17 Years | 97 (14.3%) | 128 (18.6%) |
| 18 to 24 Years | 270 (12.1%) | 517 (22.9%) |
| 25 to 34 Years | 358 (10.0%) | 481 (13.4%) |
| 35 to 44 Years | 301 (9.5%) | 170 (5.5%) |
| 45 to 54 Years | 222 (6.4%) | 404 (11.6%) |
| 55 to 64 Years | 120 (3.2%) | 283 (6.8%) |
| 65 to 74 Years | 373 (12.3%) | 349 (10.2%) |
| 75 Years and over | 180 (9.1%) | 239 (8.7%) |
| Total | 2,389 (9.0%) | 3,071 (10.9%) |
Income Above Poverty by Sex and Age in Campbell County
According to the poverty statistics in Campbell County, males aged 12 to 14 years and females aged 5 years are the age groups that are most secure financially, with 97.3% of males and 98.3% of females in these age groups living above the poverty line.
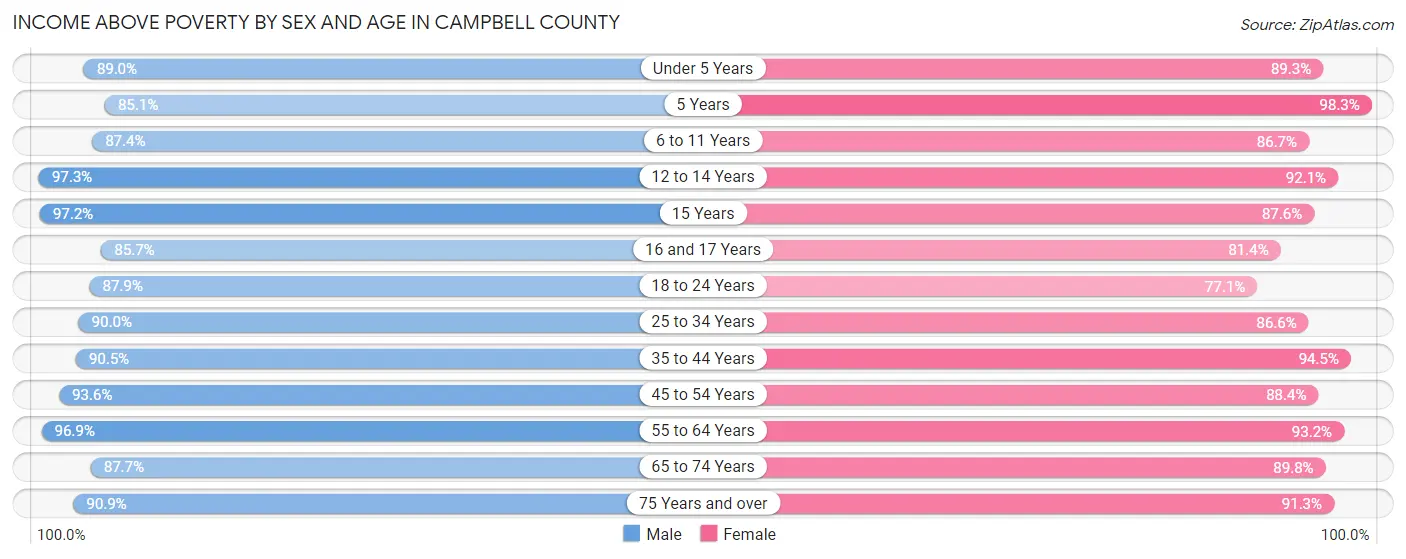
| Age Bracket | Male | Female |
| Under 5 Years | 1,051 (89.0%) | 1,379 (89.3%) |
| 5 Years | 228 (85.1%) | 294 (98.3%) |
| 6 to 11 Years | 1,880 (87.4%) | 1,433 (86.7%) |
| 12 to 14 Years | 695 (97.3%) | 883 (92.1%) |
| 15 Years | 307 (97.2%) | 241 (87.6%) |
| 16 and 17 Years | 583 (85.7%) | 561 (81.4%) |
| 18 to 24 Years | 1,969 (87.9%) | 1,740 (77.1%) |
| 25 to 34 Years | 3,209 (90.0%) | 3,120 (86.6%) |
| 35 to 44 Years | 2,856 (90.5%) | 2,897 (94.5%) |
| 45 to 54 Years | 3,251 (93.6%) | 3,087 (88.4%) |
| 55 to 64 Years | 3,686 (96.9%) | 3,871 (93.2%) |
| 65 to 74 Years | 2,661 (87.7%) | 3,058 (89.8%) |
| 75 Years and over | 1,804 (90.9%) | 2,518 (91.3%) |
| Total | 24,180 (91.0%) | 25,082 (89.1%) |
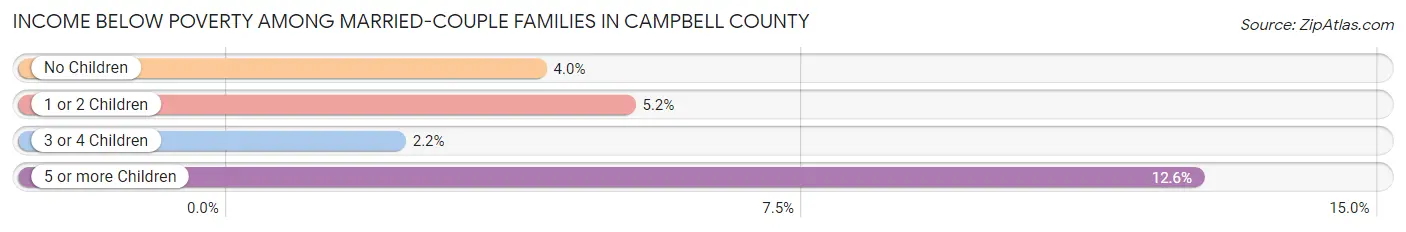
Income Below Poverty Among Married-Couple Families in Campbell County
The poverty statistics for married-couple families in Campbell County show that 4.2% or 474 of the total 11,288 families live below the poverty line. Families with 5 or more children have the highest poverty rate of 12.6%, comprising of 14 families. On the other hand, families with 3 or 4 children have the lowest poverty rate of 2.2%, which includes 28 families.
| Children | Above Poverty | Below Poverty |
| No Children | 6,782 (96.0%) | 285 (4.0%) |
| 1 or 2 Children | 2,686 (94.8%) | 147 (5.2%) |
| 3 or 4 Children | 1,249 (97.8%) | 28 (2.2%) |
| 5 or more Children | 97 (87.4%) | 14 (12.6%) |
| Total | 10,814 (95.8%) | 474 (4.2%) |
Income Below Poverty Among Single-Parent Households in Campbell County
According to the poverty data in Campbell County, 18.9% or 197 single-father households and 15.1% or 360 single-mother households are living below the poverty line. Among single-father households, those with 3 or 4 children have the highest poverty rate, with 7 households (31.8%) experiencing poverty. Likewise, among single-mother households, those with 3 or 4 children have the highest poverty rate, with 19 households (30.2%) falling below the poverty line.
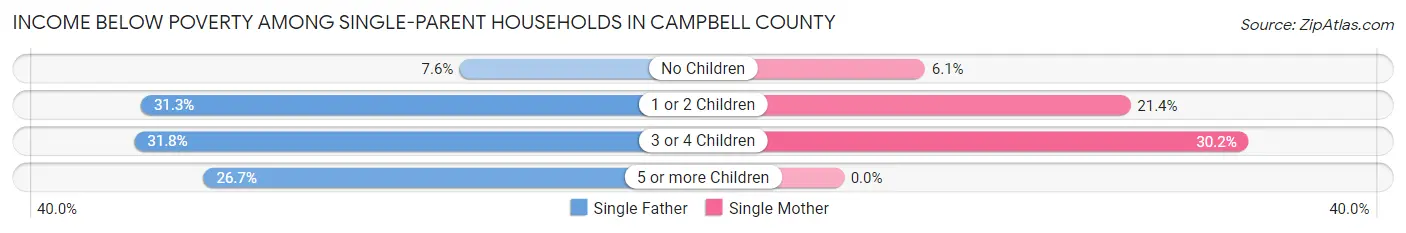
| Children | Single Father | Single Mother |
| No Children | 41 (7.6%) | 61 (6.0%) |
| 1 or 2 Children | 141 (31.3%) | 280 (21.4%) |
| 3 or 4 Children | 7 (31.8%) | 19 (30.2%) |
| 5 or more Children | 8 (26.7%) | 0 (0.0%) |
| Total | 197 (18.9%) | 360 (15.1%) |
Income Below Poverty Among Married-Couple vs Single-Parent Households in Campbell County
The poverty data for Campbell County shows that 474 of the married-couple family households (4.2%) and 557 of the single-parent households (16.3%) are living below the poverty level. Within the married-couple family households, those with 5 or more children have the highest poverty rate, with 14 households (12.6%) falling below the poverty line. Among the single-parent households, those with 3 or 4 children have the highest poverty rate, with 26 household (30.6%) living below poverty.
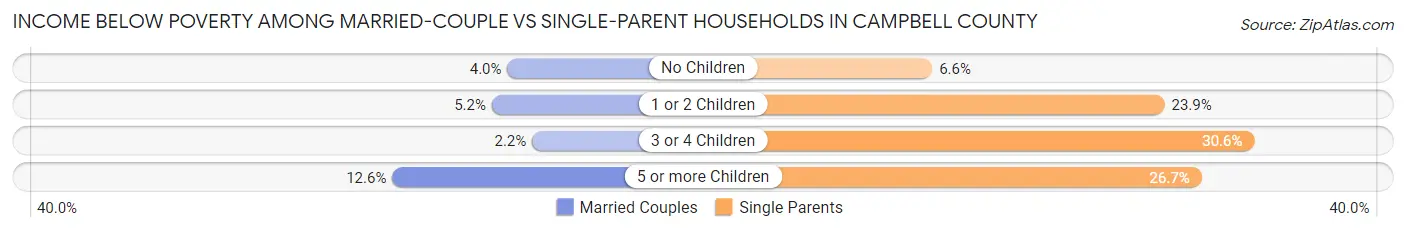
| Children | Married-Couple Families | Single-Parent Households |
| No Children | 285 (4.0%) | 102 (6.6%) |
| 1 or 2 Children | 147 (5.2%) | 421 (23.9%) |
| 3 or 4 Children | 28 (2.2%) | 26 (30.6%) |
| 5 or more Children | 14 (12.6%) | 8 (26.7%) |
| Total | 474 (4.2%) | 557 (16.3%) |
Race in Campbell County
The most populous races in Campbell County are White / Caucasian (43,776 | 78.8%), Black / African American (7,823 | 14.1%), and Two or more Races (2,854 | 5.1%).
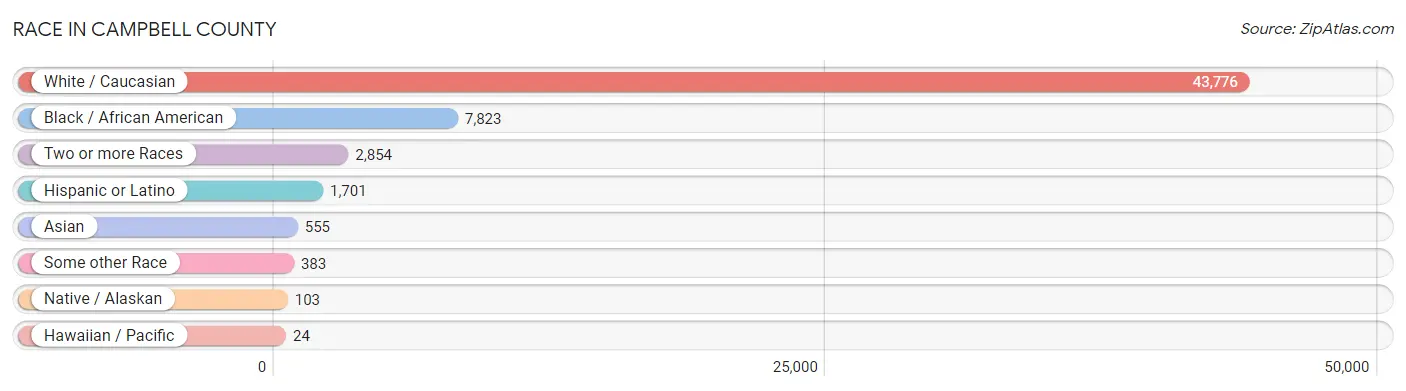
| Race | # Population | % Population |
| Asian | 555 | 1.0% |
| Black / African American | 7,823 | 14.1% |
| Hawaiian / Pacific | 24 | 0.0% |
| Hispanic or Latino | 1,701 | 3.1% |
| Native / Alaskan | 103 | 0.2% |
| White / Caucasian | 43,776 | 78.8% |
| Two or more Races | 2,854 | 5.1% |
| Some other Race | 383 | 0.7% |
| Total | 55,518 | 100.0% |
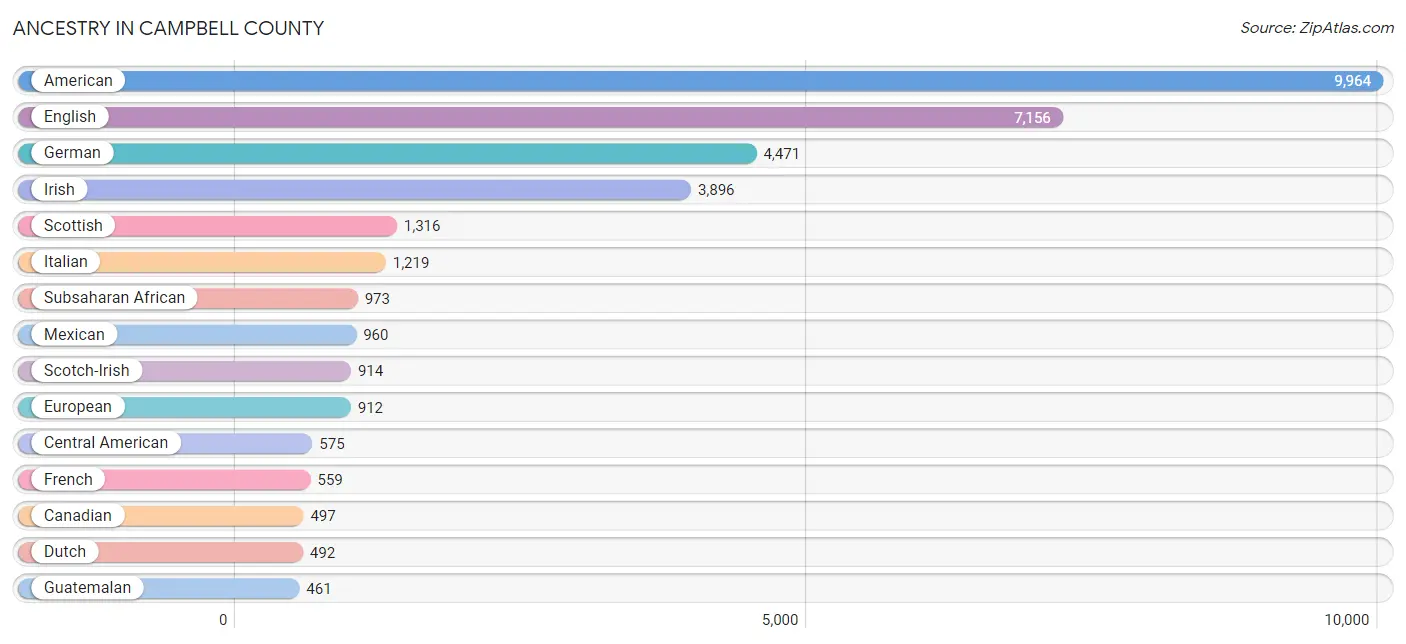
Ancestry in Campbell County
The most populous ancestries reported in Campbell County are American (9,964 | 17.9%), English (7,156 | 12.9%), German (4,471 | 8.1%), Irish (3,896 | 7.0%), and Scottish (1,316 | 2.4%), together accounting for 48.3% of all Campbell County residents.
| Ancestry | # Population | % Population |
| African | 448 | 0.8% |
| American | 9,964 | 17.9% |
| Arab | 185 | 0.3% |
| Argentinean | 13 | 0.0% |
| Armenian | 4 | 0.0% |
| Austrian | 3 | 0.0% |
| Bahamian | 13 | 0.0% |
| Belgian | 10 | 0.0% |
| Bhutanese | 32 | 0.1% |
| Blackfeet | 23 | 0.0% |
| British | 213 | 0.4% |
| Burmese | 102 | 0.2% |
| Canadian | 497 | 0.9% |
| Central American | 575 | 1.0% |
| Central American Indian | 260 | 0.5% |
| Cherokee | 256 | 0.5% |
| Cheyenne | 5 | 0.0% |
| Costa Rican | 61 | 0.1% |
| Croatian | 14 | 0.0% |
| Czech | 189 | 0.3% |
| Czechoslovakian | 31 | 0.1% |
| Danish | 81 | 0.2% |
| Delaware | 4 | 0.0% |
| Dominican | 4 | 0.0% |
| Dutch | 492 | 0.9% |
| Eastern European | 27 | 0.1% |
| Egyptian | 177 | 0.3% |
| English | 7,156 | 12.9% |
| Ethiopian | 327 | 0.6% |
| European | 912 | 1.6% |
| Finnish | 17 | 0.0% |
| French | 559 | 1.0% |
| French Canadian | 265 | 0.5% |
| German | 4,471 | 8.1% |
| Greek | 102 | 0.2% |
| Guatemalan | 461 | 0.8% |
| Haitian | 20 | 0.0% |
| Honduran | 32 | 0.1% |
| Hungarian | 109 | 0.2% |
| Indian (Asian) | 60 | 0.1% |
| Iranian | 28 | 0.1% |
| Irish | 3,896 | 7.0% |
| Iroquois | 5 | 0.0% |
| Italian | 1,219 | 2.2% |
| Jamaican | 13 | 0.0% |
| Korean | 168 | 0.3% |
| Lithuanian | 38 | 0.1% |
| Mexican | 960 | 1.7% |
| Mexican American Indian | 260 | 0.5% |
| Nicaraguan | 7 | 0.0% |
| Nigerian | 93 | 0.2% |
| Northern European | 9 | 0.0% |
| Norwegian | 199 | 0.4% |
| Pakistani | 39 | 0.1% |
| Palestinian | 8 | 0.0% |
| Polish | 446 | 0.8% |
| Puerto Rican | 62 | 0.1% |
| Romanian | 7 | 0.0% |
| Russian | 129 | 0.2% |
| Salvadoran | 14 | 0.0% |
| Samoan | 50 | 0.1% |
| Scandinavian | 114 | 0.2% |
| Scotch-Irish | 914 | 1.7% |
| Scottish | 1,316 | 2.4% |
| Sioux | 3 | 0.0% |
| Slovak | 7 | 0.0% |
| South American | 36 | 0.1% |
| Spaniard | 39 | 0.1% |
| Spanish | 10 | 0.0% |
| Sri Lankan | 306 | 0.5% |
| Subsaharan African | 973 | 1.8% |
| Swedish | 251 | 0.4% |
| Swiss | 99 | 0.2% |
| Thai | 78 | 0.1% |
| Ukrainian | 43 | 0.1% |
| Venezuelan | 23 | 0.0% |
| Welsh | 209 | 0.4% | View All 77 Rows |
Immigrants in Campbell County
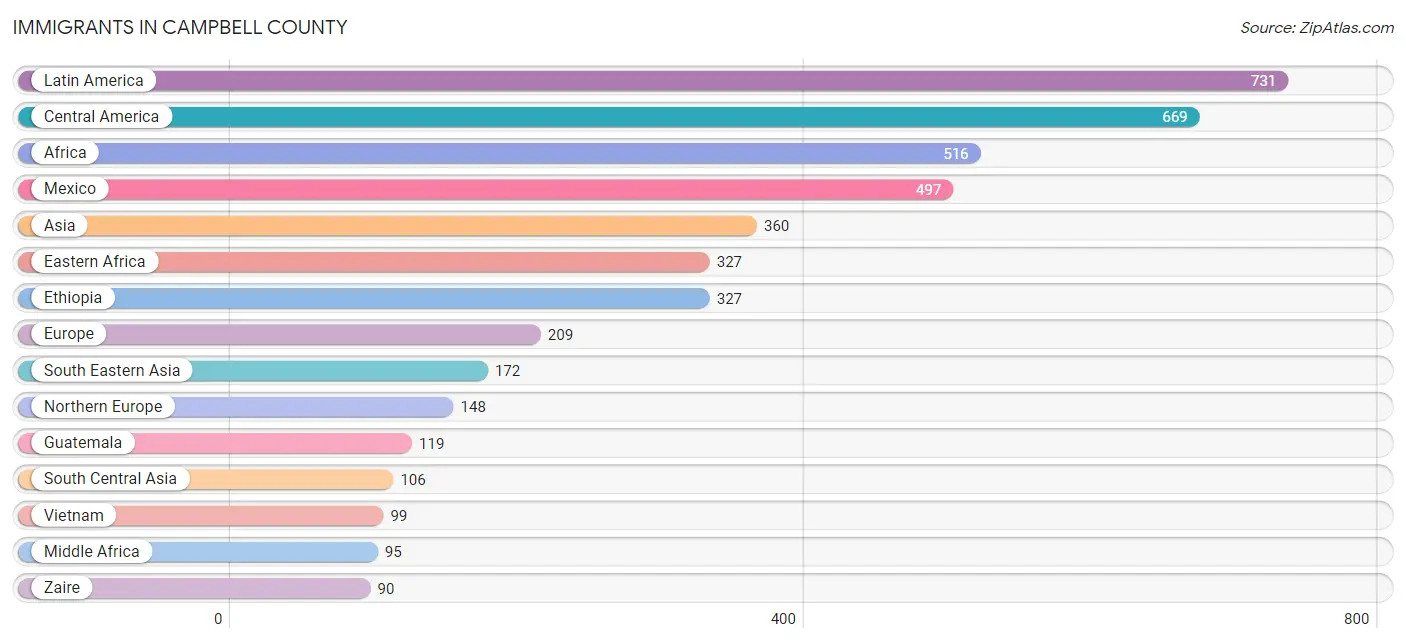
The most numerous immigrant groups reported in Campbell County came from Latin America (731 | 1.3%), Central America (669 | 1.2%), Africa (516 | 0.9%), Mexico (497 | 0.9%), and Asia (360 | 0.6%), together accounting for 5.0% of all Campbell County residents.
| Immigration Origin | # Population | % Population |
| Africa | 516 | 0.9% |
| Argentina | 13 | 0.0% |
| Asia | 360 | 0.6% |
| Bahamas | 13 | 0.0% |
| Belgium | 10 | 0.0% |
| Brazil | 13 | 0.0% |
| Canada | 41 | 0.1% |
| Caribbean | 13 | 0.0% |
| Central America | 669 | 1.2% |
| China | 39 | 0.1% |
| Congo | 5 | 0.0% |
| Denmark | 27 | 0.1% |
| Eastern Africa | 327 | 0.6% |
| Eastern Asia | 74 | 0.1% |
| Eastern Europe | 14 | 0.0% |
| Egypt | 66 | 0.1% |
| El Salvador | 14 | 0.0% |
| England | 65 | 0.1% |
| Ethiopia | 327 | 0.6% |
| Europe | 209 | 0.4% |
| Germany | 37 | 0.1% |
| Guatemala | 119 | 0.2% |
| Honduras | 32 | 0.1% |
| India | 85 | 0.2% |
| Iran | 9 | 0.0% |
| Japan | 10 | 0.0% |
| Korea | 25 | 0.1% |
| Latin America | 731 | 1.3% |
| Mexico | 497 | 0.9% |
| Middle Africa | 95 | 0.2% |
| Nicaragua | 7 | 0.0% |
| Nigeria | 28 | 0.1% |
| Northern Africa | 66 | 0.1% |
| Northern Europe | 148 | 0.3% |
| Pakistan | 12 | 0.0% |
| Philippines | 58 | 0.1% |
| Russia | 14 | 0.0% |
| Scotland | 26 | 0.1% |
| South America | 49 | 0.1% |
| South Central Asia | 106 | 0.2% |
| South Eastern Asia | 172 | 0.3% |
| Sweden | 22 | 0.0% |
| Taiwan | 16 | 0.0% |
| Thailand | 15 | 0.0% |
| Venezuela | 23 | 0.0% |
| Vietnam | 99 | 0.2% |
| Western Africa | 28 | 0.1% |
| Western Europe | 47 | 0.1% |
| Zaire | 90 | 0.2% | View All 49 Rows |
Sex and Age in Campbell County
Sex and Age in Campbell County
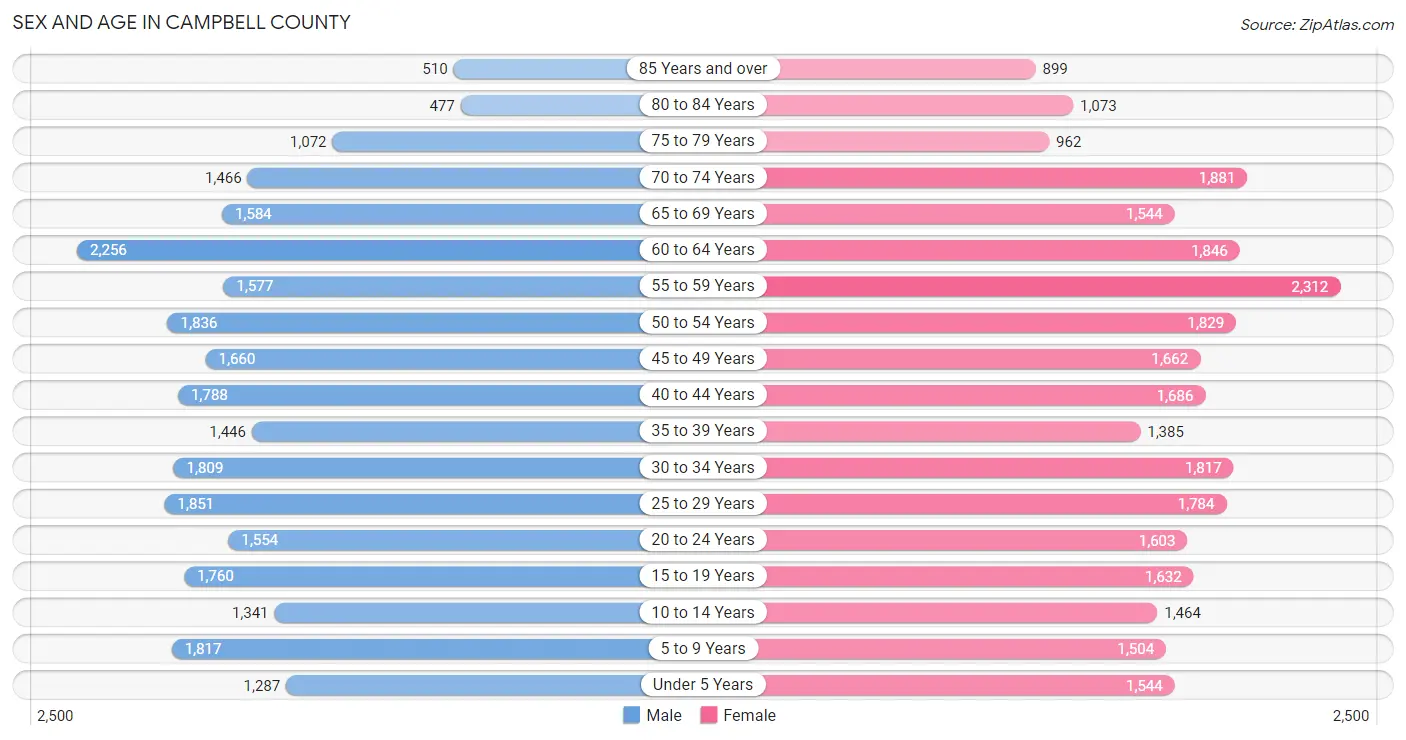
The most populous age groups in Campbell County are 60 to 64 Years (2,256 | 8.3%) for men and 55 to 59 Years (2,312 | 8.1%) for women.
| Age Bracket | Male | Female |
| Under 5 Years | 1,287 (4.8%) | 1,544 (5.4%) |
| 5 to 9 Years | 1,817 (6.7%) | 1,504 (5.3%) |
| 10 to 14 Years | 1,341 (5.0%) | 1,464 (5.1%) |
| 15 to 19 Years | 1,760 (6.5%) | 1,632 (5.7%) |
| 20 to 24 Years | 1,554 (5.7%) | 1,603 (5.6%) |
| 25 to 29 Years | 1,851 (6.8%) | 1,784 (6.3%) |
| 30 to 34 Years | 1,809 (6.7%) | 1,817 (6.4%) |
| 35 to 39 Years | 1,446 (5.3%) | 1,385 (4.9%) |
| 40 to 44 Years | 1,788 (6.6%) | 1,686 (5.9%) |
| 45 to 49 Years | 1,660 (6.1%) | 1,662 (5.9%) |
| 50 to 54 Years | 1,836 (6.8%) | 1,829 (6.4%) |
| 55 to 59 Years | 1,577 (5.8%) | 2,312 (8.1%) |
| 60 to 64 Years | 2,256 (8.3%) | 1,846 (6.5%) |
| 65 to 69 Years | 1,584 (5.9%) | 1,544 (5.4%) |
| 70 to 74 Years | 1,466 (5.4%) | 1,881 (6.6%) |
| 75 to 79 Years | 1,072 (4.0%) | 962 (3.4%) |
| 80 to 84 Years | 477 (1.8%) | 1,073 (3.8%) |
| 85 Years and over | 510 (1.9%) | 899 (3.2%) |
| Total | 27,091 (100.0%) | 28,427 (100.0%) |
Families and Households in Campbell County
Median Family Size in Campbell County
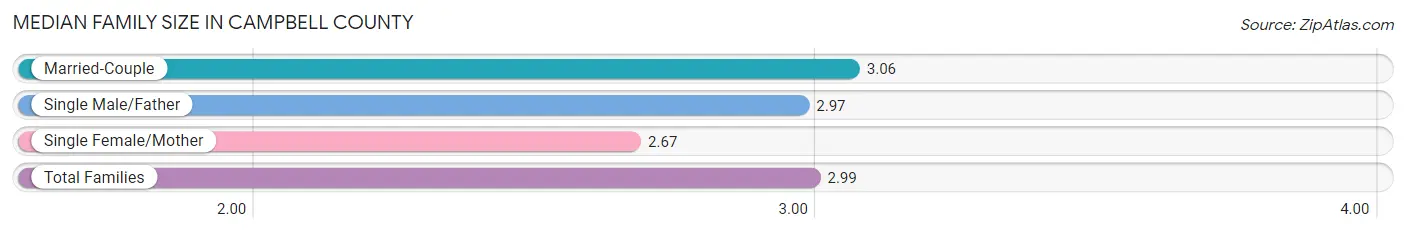
The median family size in Campbell County is 2.99 persons per family, with married-couple families (11,288 | 76.7%) accounting for the largest median family size of 3.06 persons per family. On the other hand, single female/mother families (2,382 | 16.2%) represent the smallest median family size with 2.67 persons per family.
| Family Type | # Families | Family Size |
| Married-Couple | 11,288 (76.7%) | 3.06 |
| Single Male/Father | 1,040 (7.1%) | 2.97 |
| Single Female/Mother | 2,382 (16.2%) | 2.67 |
| Total Families | 14,710 (100.0%) | 2.99 |
Median Household Size in Campbell County
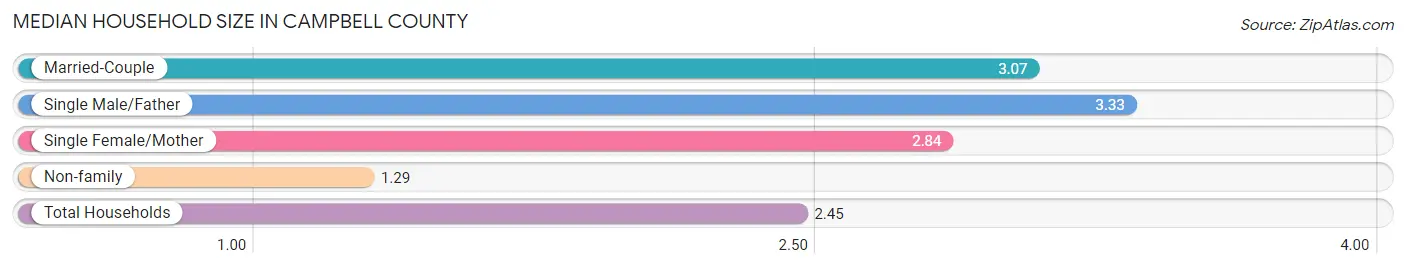
The median household size in Campbell County is 2.45 persons per household, with single male/father households (1,040 | 4.6%) accounting for the largest median household size of 3.33 persons per household. non-family households (7,699 | 34.4%) represent the smallest median household size with 1.29 persons per household.
| Household Type | # Households | Household Size |
| Married-Couple | 11,288 (50.4%) | 3.07 |
| Single Male/Father | 1,040 (4.6%) | 3.33 |
| Single Female/Mother | 2,382 (10.6%) | 2.84 |
| Non-family | 7,699 (34.4%) | 1.29 |
| Total Households | 22,409 (100.0%) | 2.45 |
Household Size by Marriage Status in Campbell County
Out of a total of 22,409 households in Campbell County, 14,710 (65.6%) are family households, while 7,699 (34.4%) are nonfamily households. The most numerous type of family households are 2-person households, comprising 7,203, and the most common type of nonfamily households are 1-person households, comprising 6,549.
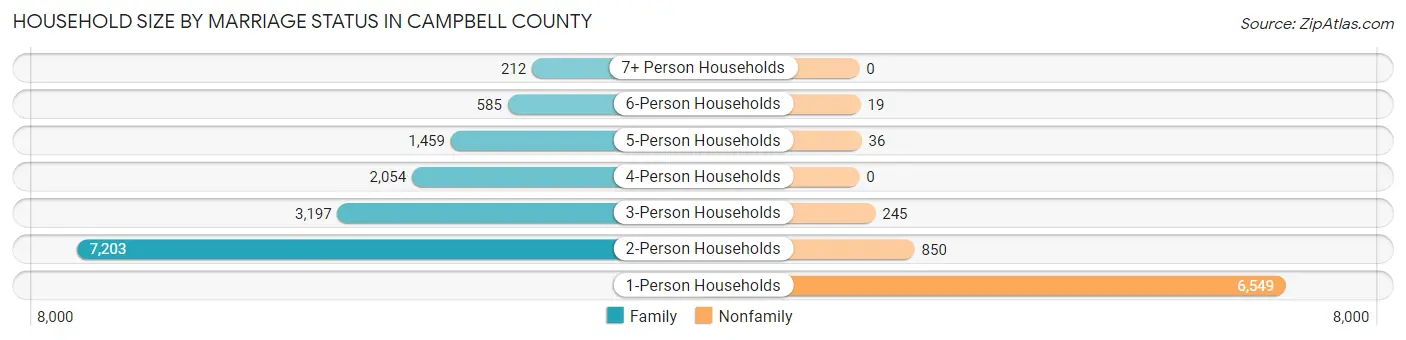
| Household Size | Family Households | Nonfamily Households |
| 1-Person Households | - | 6,549 (29.2%) |
| 2-Person Households | 7,203 (32.1%) | 850 (3.8%) |
| 3-Person Households | 3,197 (14.3%) | 245 (1.1%) |
| 4-Person Households | 2,054 (9.2%) | 0 (0.0%) |
| 5-Person Households | 1,459 (6.5%) | 36 (0.2%) |
| 6-Person Households | 585 (2.6%) | 19 (0.1%) |
| 7+ Person Households | 212 (0.9%) | 0 (0.0%) |
| Total | 14,710 (65.6%) | 7,699 (34.4%) |
Female Fertility in Campbell County
Fertility by Age in Campbell County
Average fertility rate in Campbell County is 81.0 births per 1,000 women. Women in the age bracket of 20 to 34 years have the highest fertility rate with 156.0 births per 1,000 women. Women in the age bracket of 20 to 34 years acount for 83.8% of all women with births.
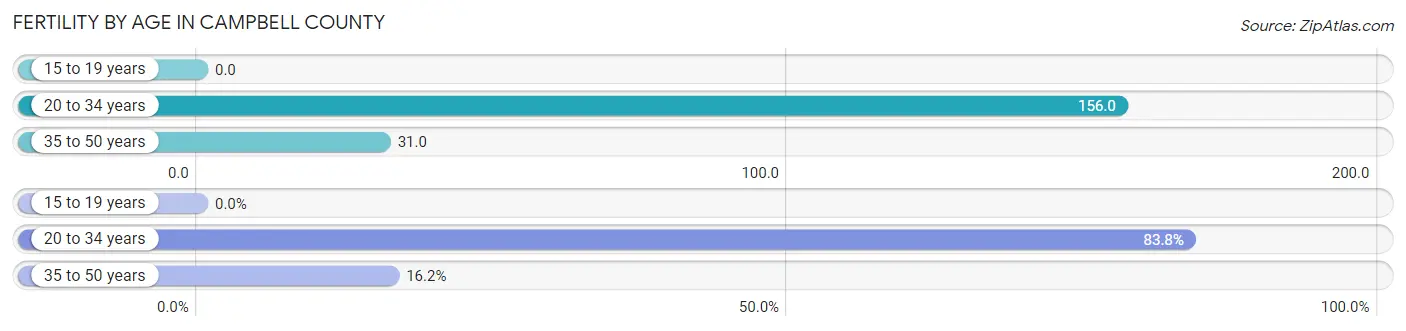
| Age Bracket | Women with Births | Births / 1,000 Women |
| 15 to 19 years | 0 (0.0%) | 0.0 |
| 20 to 34 years | 811 (83.8%) | 156.0 |
| 35 to 50 years | 157 (16.2%) | 31.0 |
| Total | 968 (100.0%) | 81.0 |
Fertility by Age by Marriage Status in Campbell County
69.9% of women with births (968) in Campbell County are married. The highest percentage of unmarried women with births falls into 20 to 34 years age bracket with 31.9% of them unmarried at the time of birth, while the lowest percentage of unmarried women with births belong to 35 to 50 years age bracket with 20.4% of them unmarried.
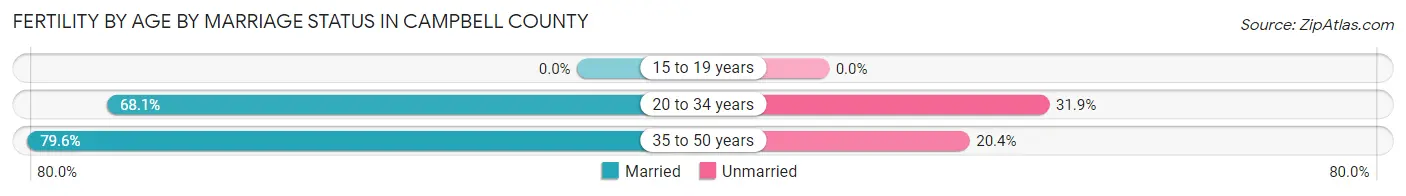
| Age Bracket | Married | Unmarried |
| 15 to 19 years | 0 (0.0%) | 0 (0.0%) |
| 20 to 34 years | 552 (68.1%) | 259 (31.9%) |
| 35 to 50 years | 125 (79.6%) | 32 (20.4%) |
| Total | 677 (69.9%) | 291 (30.1%) |
Fertility by Education in Campbell County
Average fertility rate in Campbell County is 81.0 births per 1,000 women. Women with the education attainment of graduate degree have the highest fertility rate of 133.0 births per 1,000 women, while women with the education attainment of less than high school have the lowest fertility at 25.0 births per 1,000 women. Women with the education attainment of high school diploma represent 31.4% of all women with births.
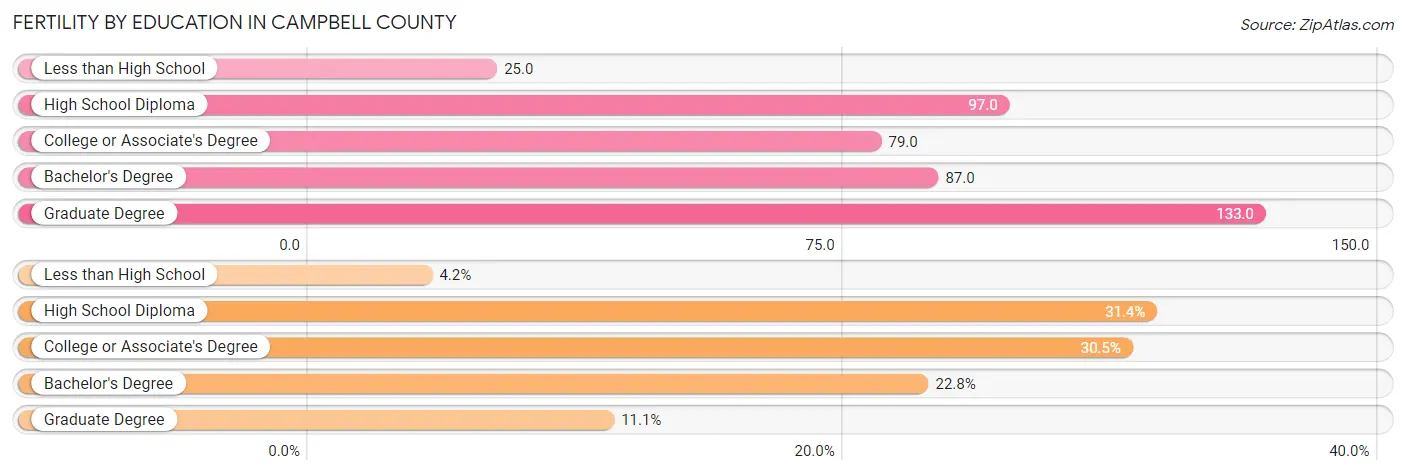
| Educational Attainment | Women with Births | Births / 1,000 Women |
| Less than High School | 41 (4.2%) | 25.0 |
| High School Diploma | 304 (31.4%) | 97.0 |
| College or Associate's Degree | 295 (30.5%) | 79.0 |
| Bachelor's Degree | 221 (22.8%) | 87.0 |
| Graduate Degree | 107 (11.1%) | 133.0 |
| Total | 968 (100.0%) | 81.0 |
Fertility by Education by Marriage Status in Campbell County
30.1% of women with births in Campbell County are unmarried. Women with the educational attainment of less than high school are most likely to be married with 100.0% of them married at childbirth, while women with the educational attainment of high school diploma are least likely to be married with 50.7% of them unmarried at childbirth.
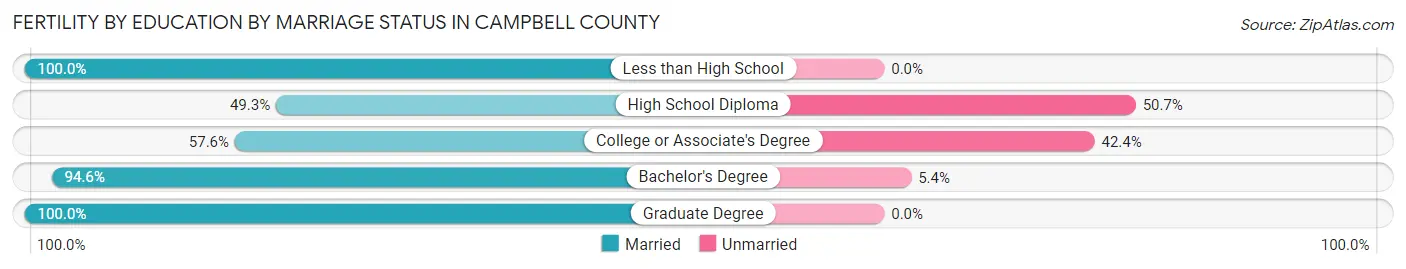
| Educational Attainment | Married | Unmarried |
| Less than High School | 41 (100.0%) | 0 (0.0%) |
| High School Diploma | 150 (49.3%) | 154 (50.7%) |
| College or Associate's Degree | 170 (57.6%) | 125 (42.4%) |
| Bachelor's Degree | 209 (94.6%) | 12 (5.4%) |
| Graduate Degree | 107 (100.0%) | 0 (0.0%) |
| Total | 677 (69.9%) | 291 (30.1%) |
Employment Characteristics in Campbell County
Employment by Class of Employer in Campbell County
Among the 25,668 employed individuals in Campbell County, private company employees (18,233 | 71.0%), not-for-profit organizations (2,766 | 10.8%), and local government employees (1,765 | 6.9%) make up the most common classes of employment.
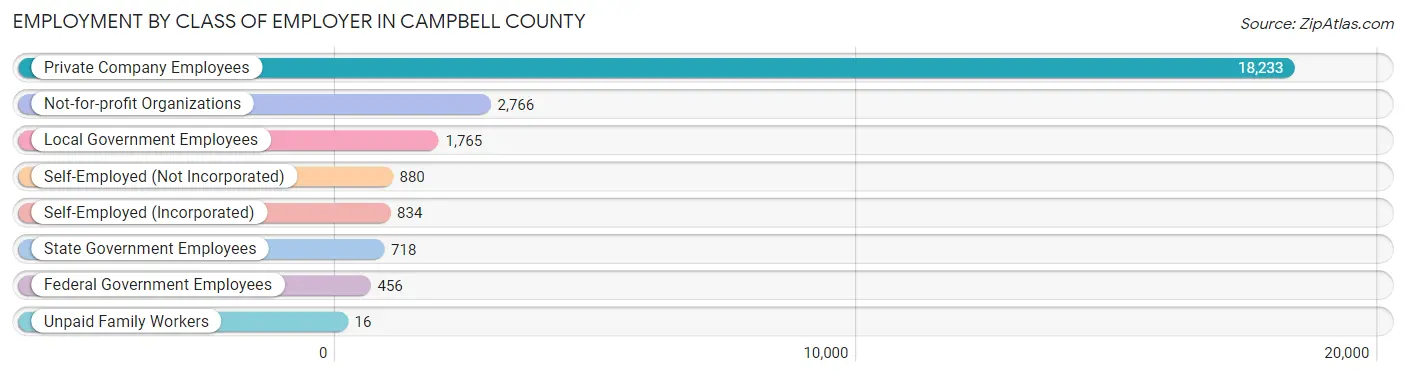
| Employer Class | # Employees | % Employees |
| Private Company Employees | 18,233 | 71.0% |
| Self-Employed (Incorporated) | 834 | 3.3% |
| Self-Employed (Not Incorporated) | 880 | 3.4% |
| Not-for-profit Organizations | 2,766 | 10.8% |
| Local Government Employees | 1,765 | 6.9% |
| State Government Employees | 718 | 2.8% |
| Federal Government Employees | 456 | 1.8% |
| Unpaid Family Workers | 16 | 0.1% |
| Total | 25,668 | 100.0% |
Employment Status by Age in Campbell County
According to the labor force statistics for Campbell County, out of the total population over 16 years of age (45,970), 60.0% or 27,582 individuals are in the labor force, with 4.9% or 1,352 of them unemployed. The age group with the highest labor force participation rate is 25 to 29 years, with 85.4% or 3,104 individuals in the labor force. Within the labor force, the 16 to 19 years age range has the highest percentage of unemployed individuals, with 20.3% or 334 of them being unemployed.
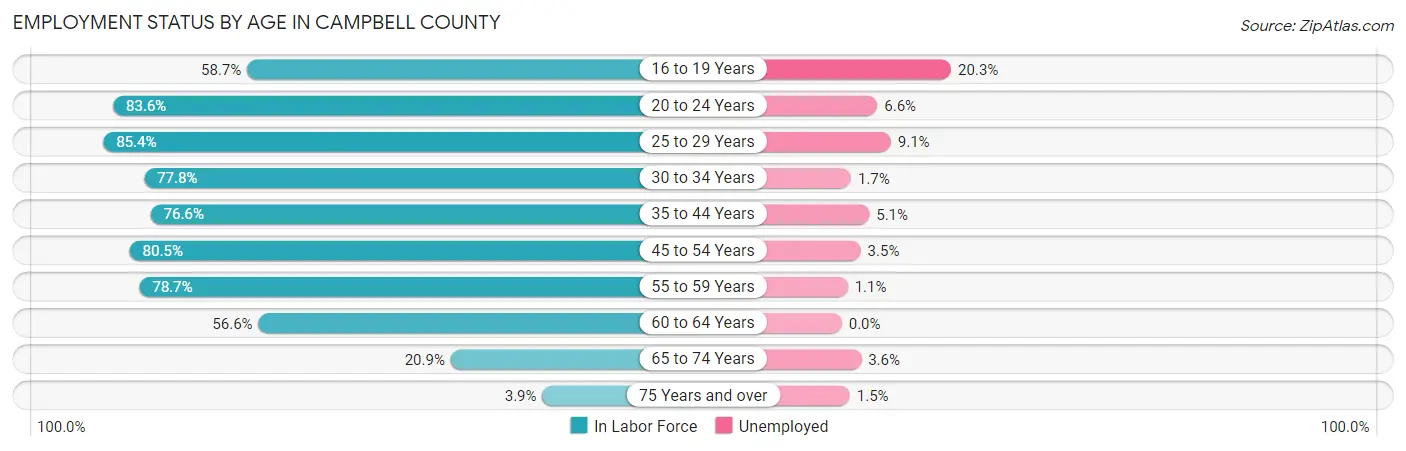
| Age Bracket | In Labor Force | Unemployed |
| 16 to 19 Years | 1,644 (58.7%) | 334 (20.3%) |
| 20 to 24 Years | 2,639 (83.6%) | 174 (6.6%) |
| 25 to 29 Years | 3,104 (85.4%) | 282 (9.1%) |
| 30 to 34 Years | 2,821 (77.8%) | 48 (1.7%) |
| 35 to 44 Years | 4,830 (76.6%) | 246 (5.1%) |
| 45 to 54 Years | 5,625 (80.5%) | 197 (3.5%) |
| 55 to 59 Years | 3,061 (78.7%) | 34 (1.1%) |
| 60 to 64 Years | 2,322 (56.6%) | 0 (0.0%) |
| 65 to 74 Years | 1,353 (20.9%) | 49 (3.6%) |
| 75 Years and over | 195 (3.9%) | 3 (1.5%) |
| Total | 27,582 (60.0%) | 1,352 (4.9%) |
Employment Status by Educational Attainment in Campbell County
According to labor force statistics for Campbell County, 76.2% of individuals (21,751) out of the total population between 25 and 64 years of age (28,544) are in the labor force, with 3.7% or 805 of them being unemployed. The group with the highest labor force participation rate are those with the educational attainment of bachelor's degree or higher, with 87.0% or 6,304 individuals in the labor force. Within the labor force, individuals with high school diploma education have the highest percentage of unemployment, with 5.2% or 373 of them being unemployed.
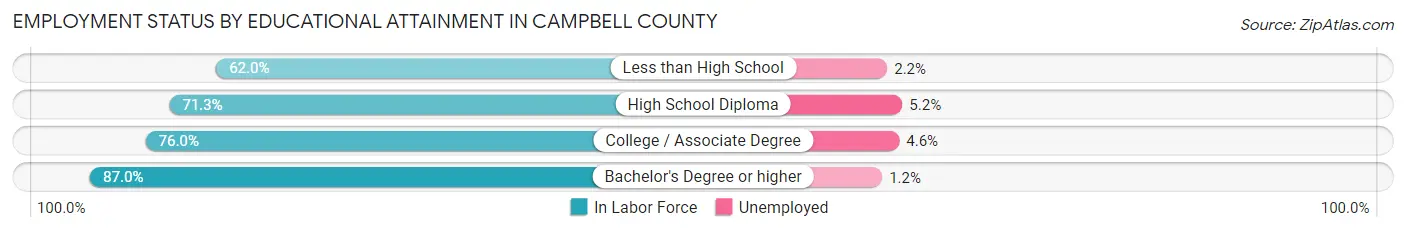
| Educational Attainment | In Labor Force | Unemployed |
| Less than High School | 1,156 (62.0%) | 41 (2.2%) |
| High School Diploma | 7,176 (71.3%) | 523 (5.2%) |
| College / Associate Degree | 7,120 (76.0%) | 431 (4.6%) |
| Bachelor's Degree or higher | 6,304 (87.0%) | 87 (1.2%) |
| Total | 21,751 (76.2%) | 1,056 (3.7%) |
Employment Occupations by Sex in Campbell County
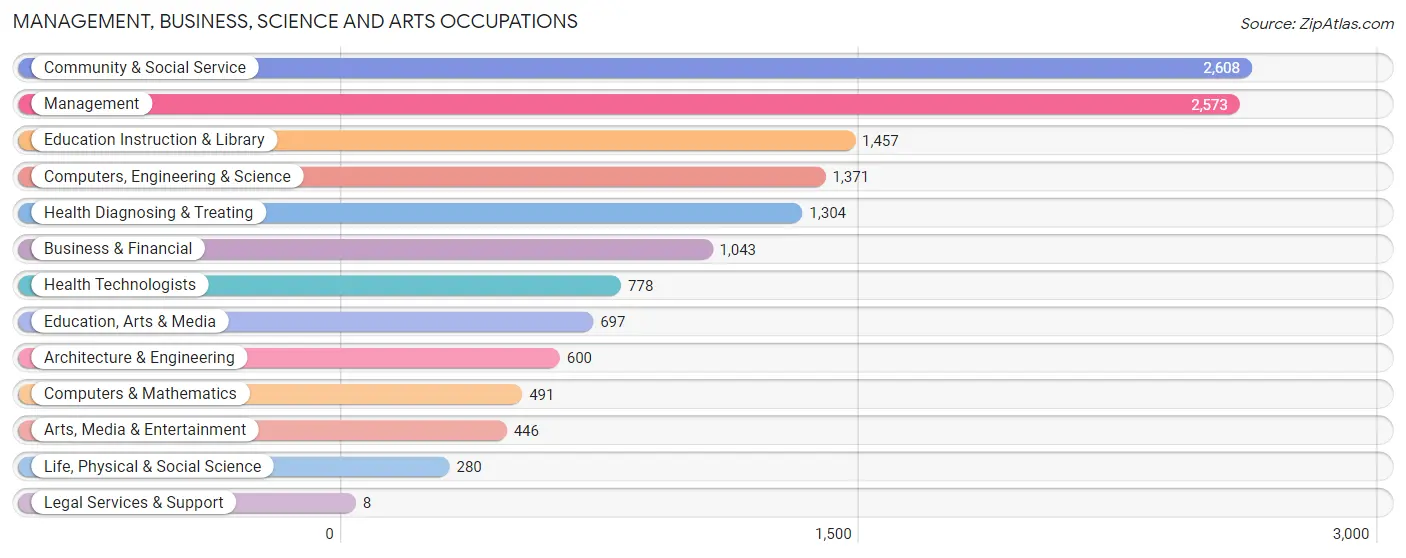
Management, Business, Science and Arts Occupations
The most common Management, Business, Science and Arts occupations in Campbell County are Community & Social Service (2,608 | 10.0%), Management (2,573 | 9.8%), Education Instruction & Library (1,457 | 5.6%), Computers, Engineering & Science (1,371 | 5.2%), and Health Diagnosing & Treating (1,304 | 5.0%).
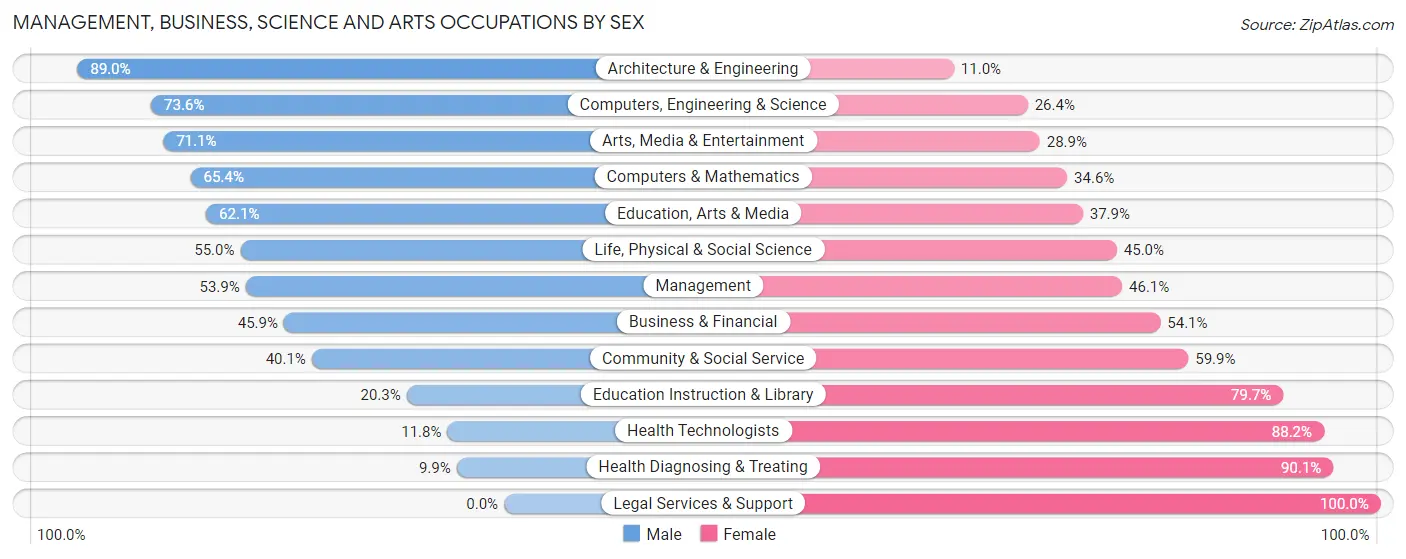
Management, Business, Science and Arts Occupations by Sex
Within the Management, Business, Science and Arts occupations in Campbell County, the most male-oriented occupations are Architecture & Engineering (89.0%), Computers, Engineering & Science (73.6%), and Arts, Media & Entertainment (71.1%), while the most female-oriented occupations are Legal Services & Support (100.0%), Health Diagnosing & Treating (90.1%), and Health Technologists (88.2%).
| Occupation | Male | Female |
| Management | 1,387 (53.9%) | 1,186 (46.1%) |
| Business & Financial | 479 (45.9%) | 564 (54.1%) |
| Computers, Engineering & Science | 1,009 (73.6%) | 362 (26.4%) |
| Computers & Mathematics | 321 (65.4%) | 170 (34.6%) |
| Architecture & Engineering | 534 (89.0%) | 66 (11.0%) |
| Life, Physical & Social Science | 154 (55.0%) | 126 (45.0%) |
| Community & Social Service | 1,046 (40.1%) | 1,562 (59.9%) |
| Education, Arts & Media | 433 (62.1%) | 264 (37.9%) |
| Legal Services & Support | 0 (0.0%) | 8 (100.0%) |
| Education Instruction & Library | 296 (20.3%) | 1,161 (79.7%) |
| Arts, Media & Entertainment | 317 (71.1%) | 129 (28.9%) |
| Health Diagnosing & Treating | 129 (9.9%) | 1,175 (90.1%) |
| Health Technologists | 92 (11.8%) | 686 (88.2%) |
| Total (Category) | 4,050 (45.5%) | 4,849 (54.5%) |
| Total (Overall) | 13,601 (51.9%) | 12,621 (48.1%) |
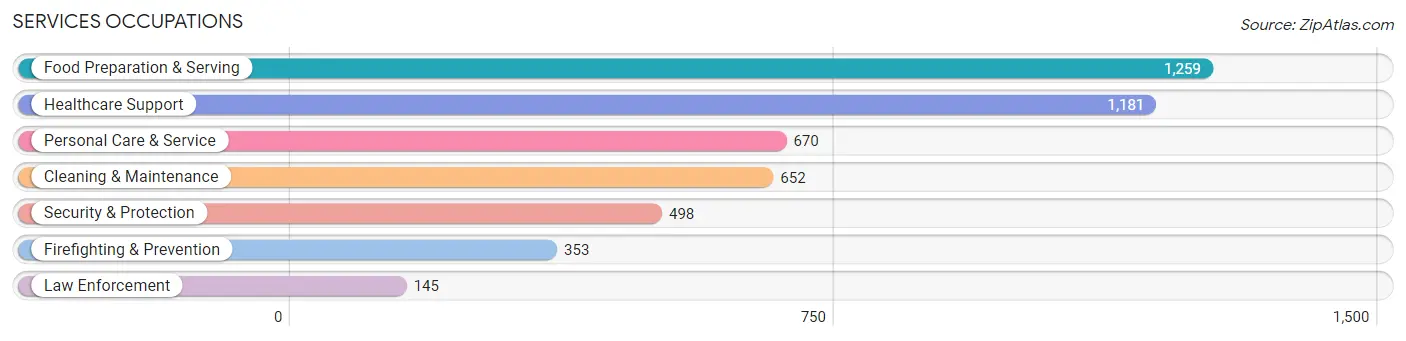
Services Occupations
The most common Services occupations in Campbell County are Food Preparation & Serving (1,259 | 4.8%), Healthcare Support (1,181 | 4.5%), Personal Care & Service (670 | 2.6%), Cleaning & Maintenance (652 | 2.5%), and Security & Protection (498 | 1.9%).
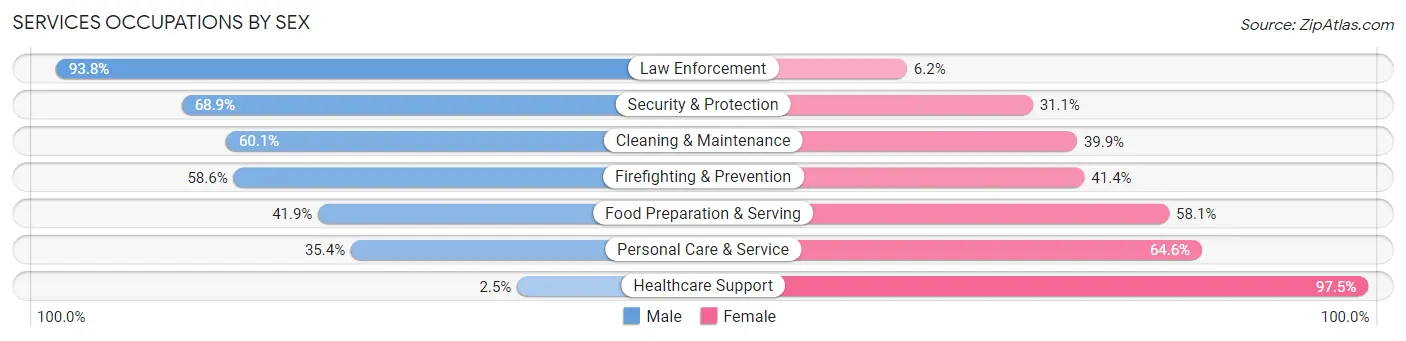
Services Occupations by Sex
Within the Services occupations in Campbell County, the most male-oriented occupations are Law Enforcement (93.8%), Security & Protection (68.9%), and Cleaning & Maintenance (60.1%), while the most female-oriented occupations are Healthcare Support (97.5%), Personal Care & Service (64.6%), and Food Preparation & Serving (58.1%).
| Occupation | Male | Female |
| Healthcare Support | 29 (2.5%) | 1,152 (97.5%) |
| Security & Protection | 343 (68.9%) | 155 (31.1%) |
| Firefighting & Prevention | 207 (58.6%) | 146 (41.4%) |
| Law Enforcement | 136 (93.8%) | 9 (6.2%) |
| Food Preparation & Serving | 527 (41.9%) | 732 (58.1%) |
| Cleaning & Maintenance | 392 (60.1%) | 260 (39.9%) |
| Personal Care & Service | 237 (35.4%) | 433 (64.6%) |
| Total (Category) | 1,528 (35.9%) | 2,732 (64.1%) |
| Total (Overall) | 13,601 (51.9%) | 12,621 (48.1%) |
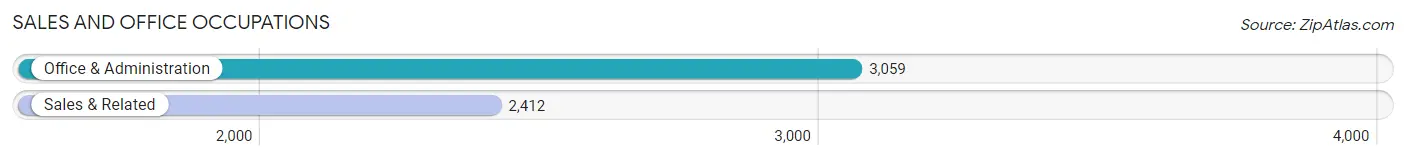
Sales and Office Occupations
The most common Sales and Office occupations in Campbell County are Office & Administration (3,059 | 11.7%), and Sales & Related (2,412 | 9.2%).
Sales and Office Occupations by Sex
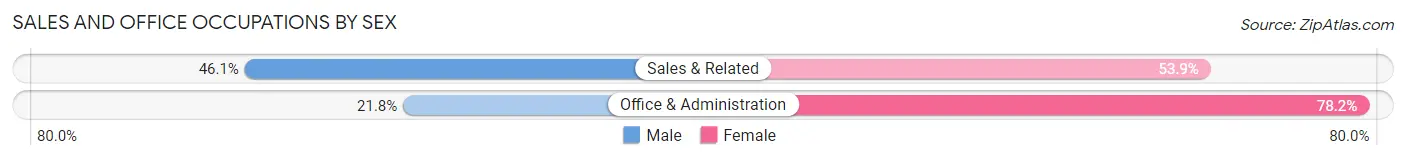
| Occupation | Male | Female |
| Sales & Related | 1,113 (46.1%) | 1,299 (53.9%) |
| Office & Administration | 666 (21.8%) | 2,393 (78.2%) |
| Total (Category) | 1,779 (32.5%) | 3,692 (67.5%) |
| Total (Overall) | 13,601 (51.9%) | 12,621 (48.1%) |
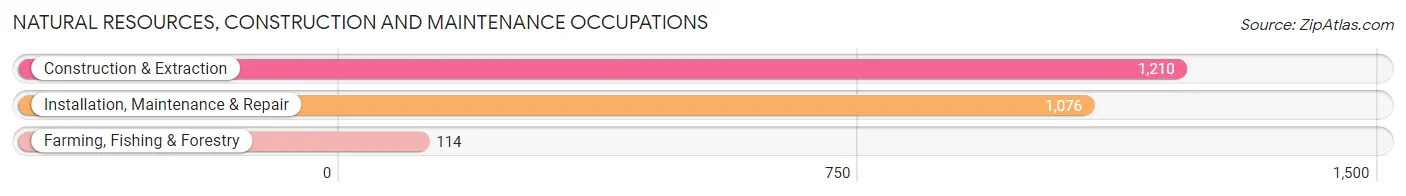
Natural Resources, Construction and Maintenance Occupations
The most common Natural Resources, Construction and Maintenance occupations in Campbell County are Construction & Extraction (1,210 | 4.6%), Installation, Maintenance & Repair (1,076 | 4.1%), and Farming, Fishing & Forestry (114 | 0.4%).
Natural Resources, Construction and Maintenance Occupations by Sex
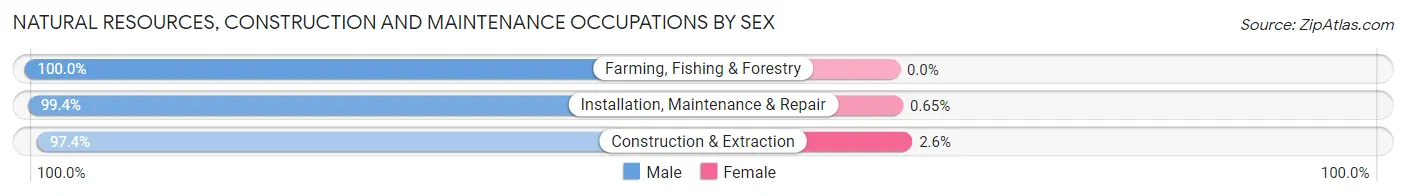
| Occupation | Male | Female |
| Farming, Fishing & Forestry | 114 (100.0%) | 0 (0.0%) |
| Construction & Extraction | 1,179 (97.4%) | 31 (2.6%) |
| Installation, Maintenance & Repair | 1,069 (99.4%) | 7 (0.6%) |
| Total (Category) | 2,362 (98.4%) | 38 (1.6%) |
| Total (Overall) | 13,601 (51.9%) | 12,621 (48.1%) |
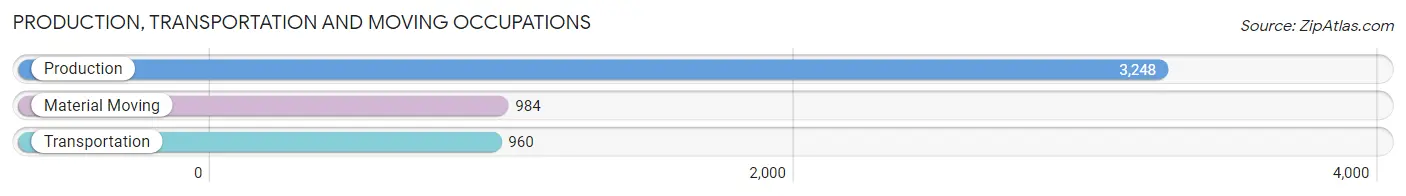
Production, Transportation and Moving Occupations
The most common Production, Transportation and Moving occupations in Campbell County are Production (3,248 | 12.4%), Material Moving (984 | 3.7%), and Transportation (960 | 3.7%).
Production, Transportation and Moving Occupations by Sex
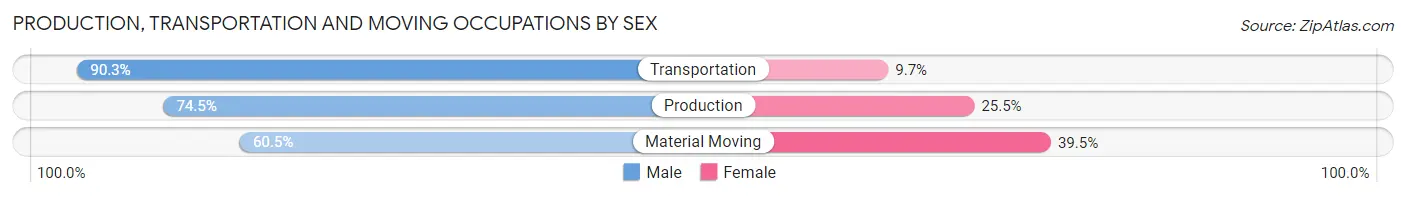
| Occupation | Male | Female |
| Production | 2,420 (74.5%) | 828 (25.5%) |
| Transportation | 867 (90.3%) | 93 (9.7%) |
| Material Moving | 595 (60.5%) | 389 (39.5%) |
| Total (Category) | 3,882 (74.8%) | 1,310 (25.2%) |
| Total (Overall) | 13,601 (51.9%) | 12,621 (48.1%) |
Employment Industries by Sex in Campbell County
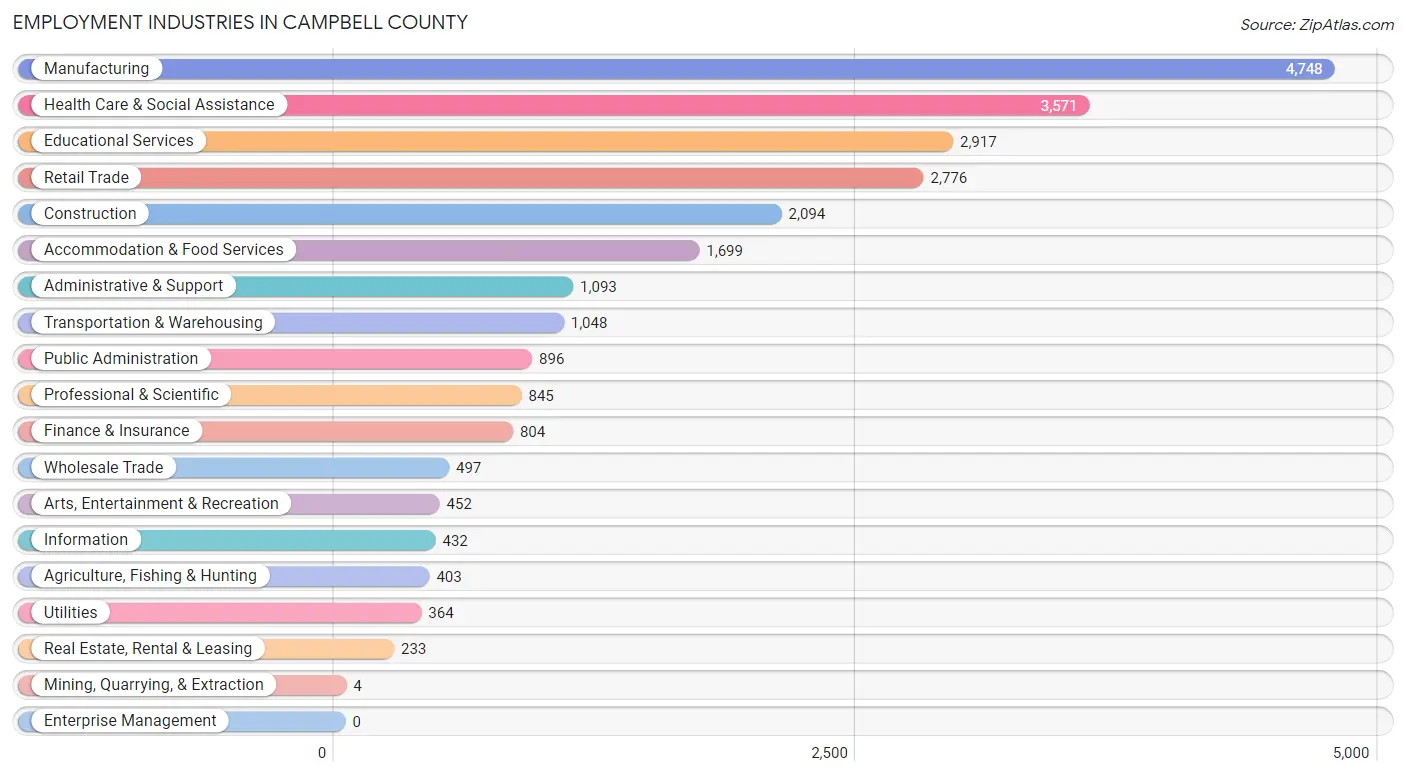
Employment Industries in Campbell County
The major employment industries in Campbell County include Manufacturing (4,748 | 18.1%), Health Care & Social Assistance (3,571 | 13.6%), Educational Services (2,917 | 11.1%), Retail Trade (2,776 | 10.6%), and Construction (2,094 | 8.0%).
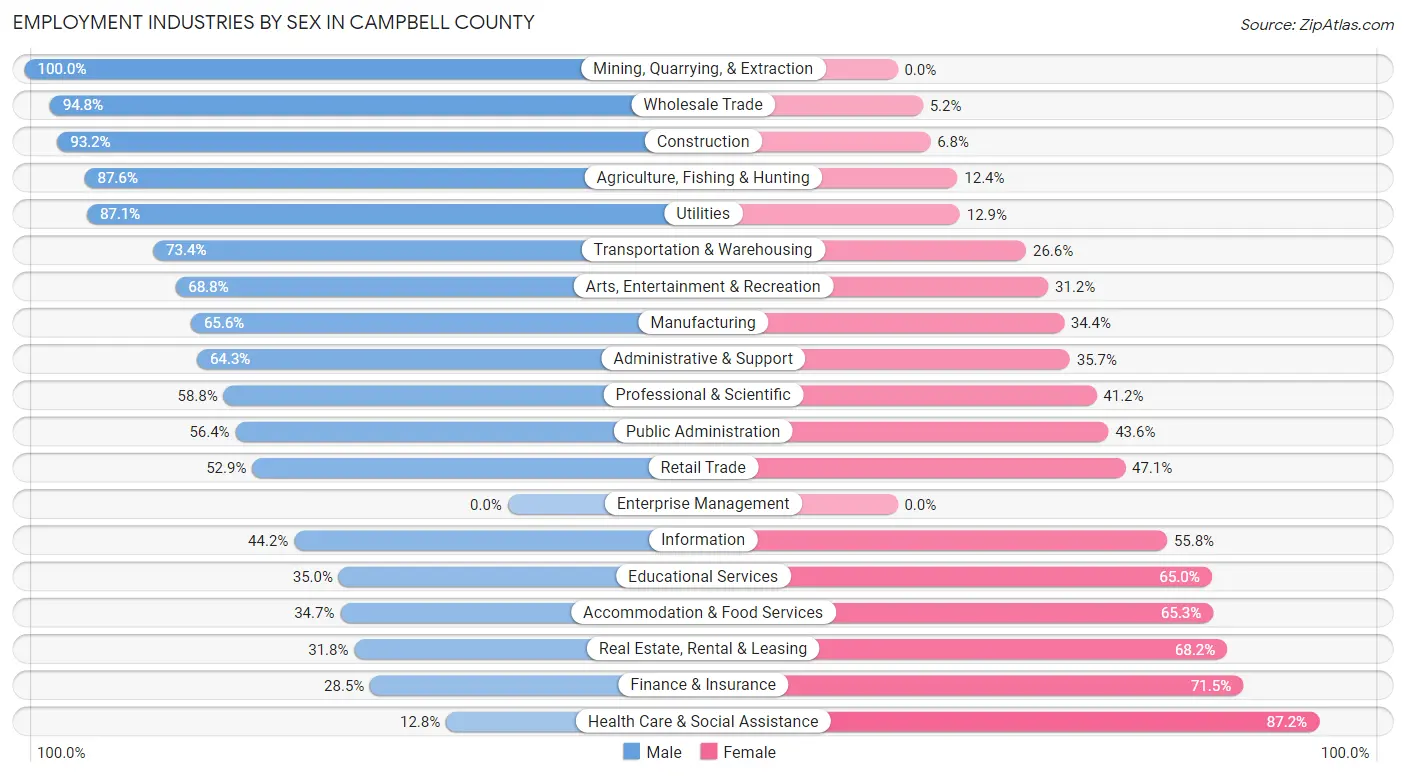
Employment Industries by Sex in Campbell County
The Campbell County industries that see more men than women are Mining, Quarrying, & Extraction (100.0%), Wholesale Trade (94.8%), and Construction (93.2%), whereas the industries that tend to have a higher number of women are Health Care & Social Assistance (87.2%), Finance & Insurance (71.5%), and Real Estate, Rental & Leasing (68.2%).
| Industry | Male | Female |
| Agriculture, Fishing & Hunting | 353 (87.6%) | 50 (12.4%) |
| Mining, Quarrying, & Extraction | 4 (100.0%) | 0 (0.0%) |
| Construction | 1,952 (93.2%) | 142 (6.8%) |
| Manufacturing | 3,113 (65.6%) | 1,635 (34.4%) |
| Wholesale Trade | 471 (94.8%) | 26 (5.2%) |
| Retail Trade | 1,468 (52.9%) | 1,308 (47.1%) |
| Transportation & Warehousing | 769 (73.4%) | 279 (26.6%) |
| Utilities | 317 (87.1%) | 47 (12.9%) |
| Information | 191 (44.2%) | 241 (55.8%) |
| Finance & Insurance | 229 (28.5%) | 575 (71.5%) |
| Real Estate, Rental & Leasing | 74 (31.8%) | 159 (68.2%) |
| Professional & Scientific | 497 (58.8%) | 348 (41.2%) |
| Enterprise Management | 0 (0.0%) | 0 (0.0%) |
| Administrative & Support | 703 (64.3%) | 390 (35.7%) |
| Educational Services | 1,020 (35.0%) | 1,897 (65.0%) |
| Health Care & Social Assistance | 456 (12.8%) | 3,115 (87.2%) |
| Arts, Entertainment & Recreation | 311 (68.8%) | 141 (31.2%) |
| Accommodation & Food Services | 589 (34.7%) | 1,110 (65.3%) |
| Public Administration | 505 (56.4%) | 391 (43.6%) |
| Total | 13,601 (51.9%) | 12,621 (48.1%) |
Education in Campbell County
School Enrollment in Campbell County
The most common levels of schooling among the 11,632 students in Campbell County are high school (2,496 | 21.5%), elementary school (2,466 | 21.2%), and middle school (2,163 | 18.6%).
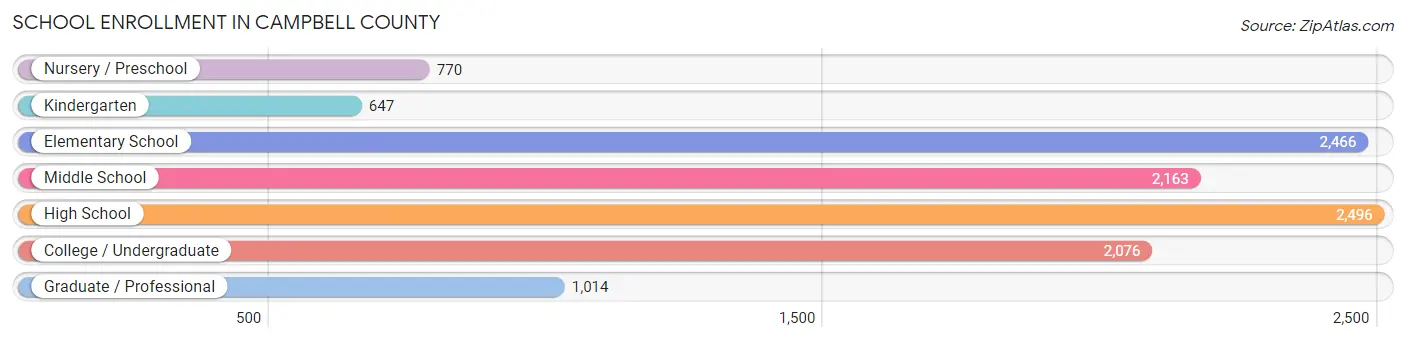
| School Level | # Students | % Students |
| Nursery / Preschool | 770 | 6.6% |
| Kindergarten | 647 | 5.6% |
| Elementary School | 2,466 | 21.2% |
| Middle School | 2,163 | 18.6% |
| High School | 2,496 | 21.5% |
| College / Undergraduate | 2,076 | 17.8% |
| Graduate / Professional | 1,014 | 8.7% |
| Total | 11,632 | 100.0% |
School Enrollment by Age by Funding Source in Campbell County
Out of a total of 11,632 students who are enrolled in schools in Campbell County, 3,664 (31.5%) attend a private institution, while the remaining 7,968 (68.5%) are enrolled in public schools. The age group of 20 to 24 year olds has the highest likelihood of being enrolled in private schools, with 773 (74.5% in the age bracket) enrolled. Conversely, the age group of 15 to 17 year olds has the lowest likelihood of being enrolled in a private school, with 1,595 (85.7% in the age bracket) attending a public institution.
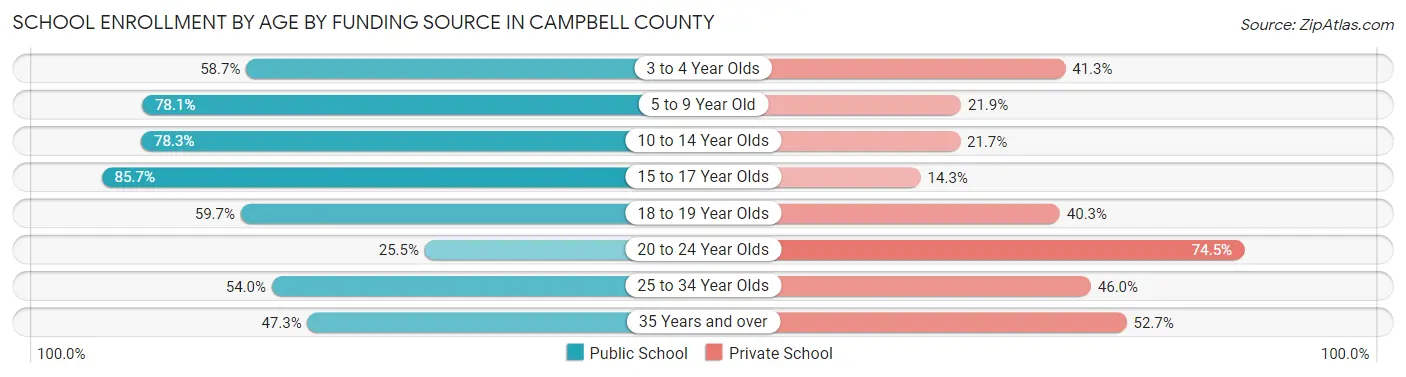
| Age Bracket | Public School | Private School |
| 3 to 4 Year Olds | 367 (58.7%) | 258 (41.3%) |
| 5 to 9 Year Old | 2,386 (78.1%) | 668 (21.9%) |
| 10 to 14 Year Olds | 1,997 (78.3%) | 553 (21.7%) |
| 15 to 17 Year Olds | 1,595 (85.7%) | 267 (14.3%) |
| 18 to 19 Year Olds | 574 (59.7%) | 387 (40.3%) |
| 20 to 24 Year Olds | 264 (25.5%) | 773 (74.5%) |
| 25 to 34 Year Olds | 422 (54.0%) | 360 (46.0%) |
| 35 Years and over | 360 (47.3%) | 401 (52.7%) |
| Total | 7,968 (68.5%) | 3,664 (31.5%) |
Educational Attainment by Field of Study in Campbell County
Education (1,721 | 16.4%), business (1,661 | 15.8%), arts & humanities (1,257 | 11.9%), science & technology (1,153 | 11.0%), and liberal arts & history (893 | 8.5%) are the most common fields of study among 10,528 individuals in Campbell County who have obtained a bachelor's degree or higher.
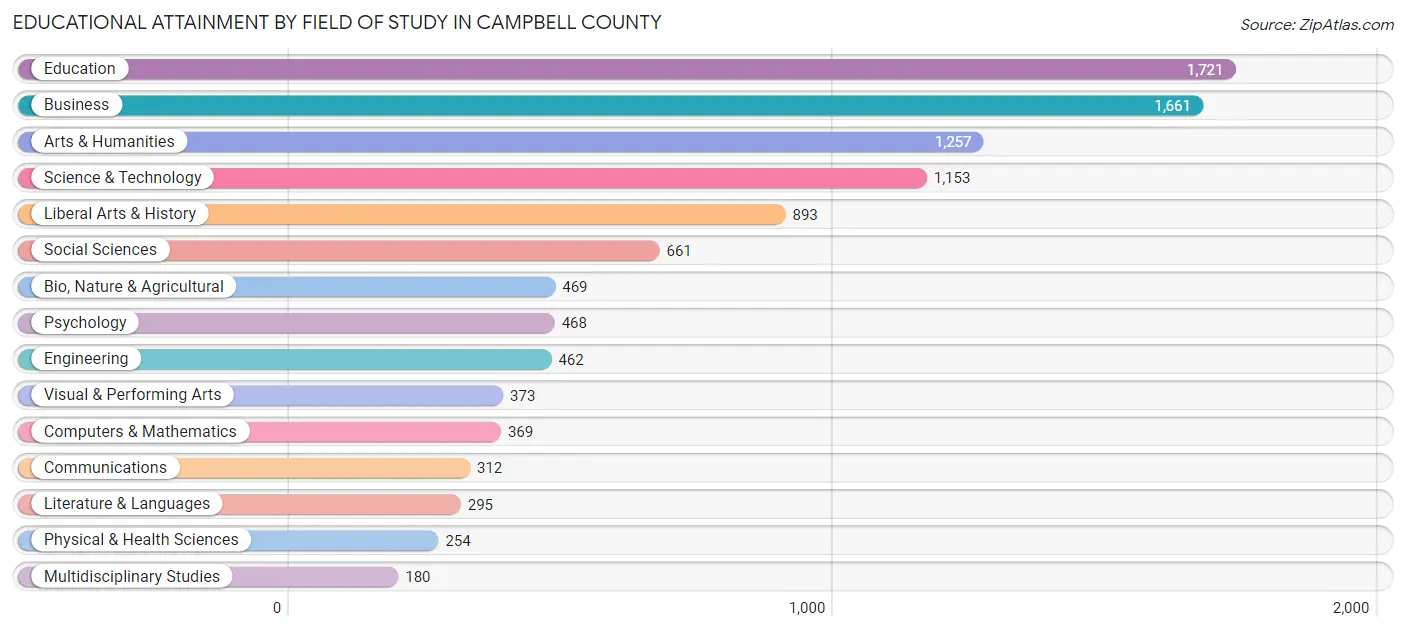
| Field of Study | # Graduates | % Graduates |
| Computers & Mathematics | 369 | 3.5% |
| Bio, Nature & Agricultural | 469 | 4.4% |
| Physical & Health Sciences | 254 | 2.4% |
| Psychology | 468 | 4.4% |
| Social Sciences | 661 | 6.3% |
| Engineering | 462 | 4.4% |
| Multidisciplinary Studies | 180 | 1.7% |
| Science & Technology | 1,153 | 11.0% |
| Business | 1,661 | 15.8% |
| Education | 1,721 | 16.4% |
| Literature & Languages | 295 | 2.8% |
| Liberal Arts & History | 893 | 8.5% |
| Visual & Performing Arts | 373 | 3.5% |
| Communications | 312 | 3.0% |
| Arts & Humanities | 1,257 | 11.9% |
| Total | 10,528 | 100.0% |
Transportation & Commute in Campbell County
Vehicle Availability by Sex in Campbell County
The most prevalent vehicle ownership categories in Campbell County are males with 2 vehicles (4,626, accounting for 34.7%) and females with 2 vehicles (4,333, making up 37.6%).
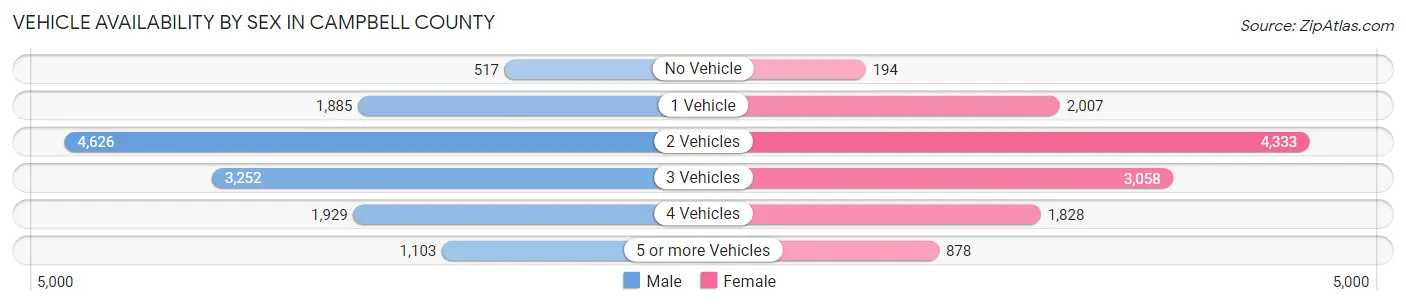
| Vehicles Available | Male | Female |
| No Vehicle | 517 (3.9%) | 194 (1.6%) |
| 1 Vehicle | 1,885 (14.2%) | 2,007 (16.3%) |
| 2 Vehicles | 4,626 (34.7%) | 4,333 (35.2%) |
| 3 Vehicles | 3,252 (24.4%) | 3,058 (24.9%) |
| 4 Vehicles | 1,929 (14.5%) | 1,828 (14.9%) |
| 5 or more Vehicles | 1,103 (8.3%) | 878 (7.1%) |
| Total | 13,312 (100.0%) | 12,298 (100.0%) |
Commute Time in Campbell County
The most frequently occuring commute durations in Campbell County are 20 to 24 minutes (4,317 commuters, 18.1%), 15 to 19 minutes (4,210 commuters, 17.6%), and 10 to 14 minutes (3,804 commuters, 15.9%).
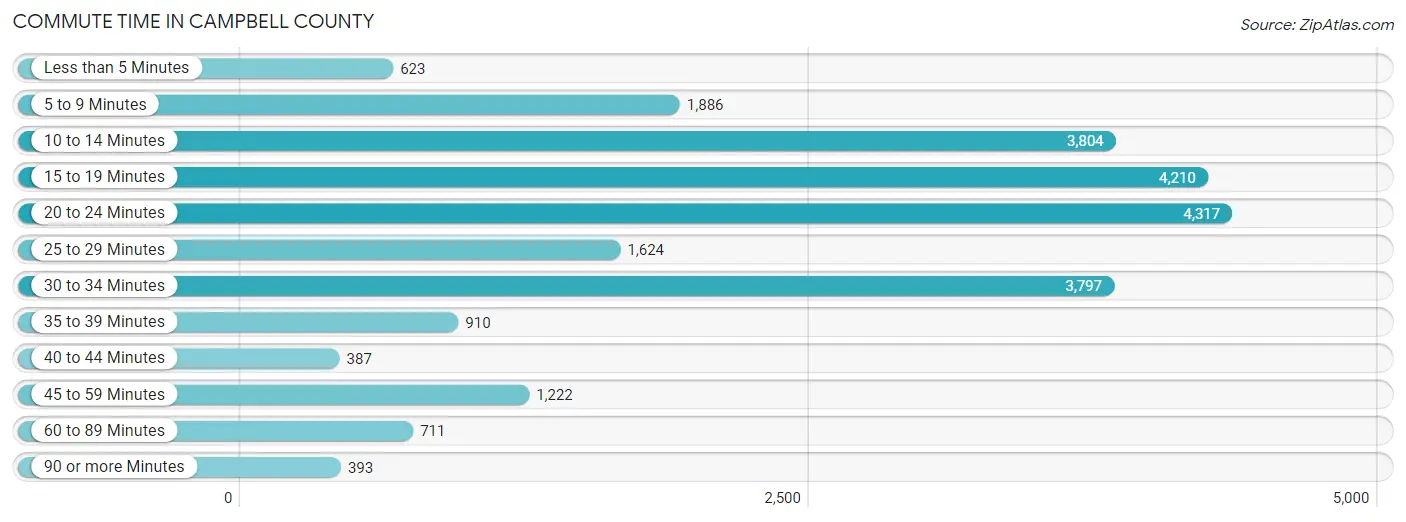
| Commute Time | # Commuters | % Commuters |
| Less than 5 Minutes | 623 | 2.6% |
| 5 to 9 Minutes | 1,886 | 7.9% |
| 10 to 14 Minutes | 3,804 | 15.9% |
| 15 to 19 Minutes | 4,210 | 17.6% |
| 20 to 24 Minutes | 4,317 | 18.1% |
| 25 to 29 Minutes | 1,624 | 6.8% |
| 30 to 34 Minutes | 3,797 | 15.9% |
| 35 to 39 Minutes | 910 | 3.8% |
| 40 to 44 Minutes | 387 | 1.6% |
| 45 to 59 Minutes | 1,222 | 5.1% |
| 60 to 89 Minutes | 711 | 3.0% |
| 90 or more Minutes | 393 | 1.7% |
Commute Time by Sex in Campbell County
The most common commute times in Campbell County are 15 to 19 minutes (2,531 commuters, 20.2%) for males and 20 to 24 minutes (2,353 commuters, 20.7%) for females.
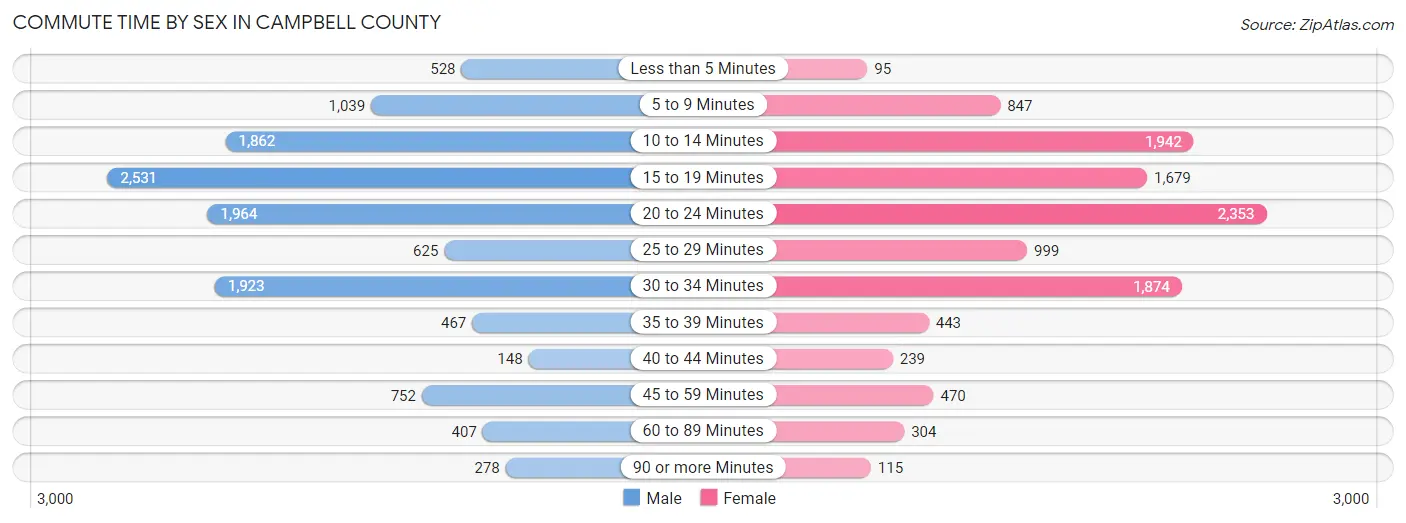
| Commute Time | Male | Female |
| Less than 5 Minutes | 528 (4.2%) | 95 (0.8%) |
| 5 to 9 Minutes | 1,039 (8.3%) | 847 (7.5%) |
| 10 to 14 Minutes | 1,862 (14.9%) | 1,942 (17.1%) |
| 15 to 19 Minutes | 2,531 (20.2%) | 1,679 (14.8%) |
| 20 to 24 Minutes | 1,964 (15.7%) | 2,353 (20.7%) |
| 25 to 29 Minutes | 625 (5.0%) | 999 (8.8%) |
| 30 to 34 Minutes | 1,923 (15.3%) | 1,874 (16.5%) |
| 35 to 39 Minutes | 467 (3.7%) | 443 (3.9%) |
| 40 to 44 Minutes | 148 (1.2%) | 239 (2.1%) |
| 45 to 59 Minutes | 752 (6.0%) | 470 (4.1%) |
| 60 to 89 Minutes | 407 (3.3%) | 304 (2.7%) |
| 90 or more Minutes | 278 (2.2%) | 115 (1.0%) |
Time of Departure to Work by Sex in Campbell County
The most frequent times of departure to work in Campbell County are 6:00 AM to 6:29 AM (1,803, 14.4%) for males and 7:00 AM to 7:29 AM (2,199, 19.4%) for females.
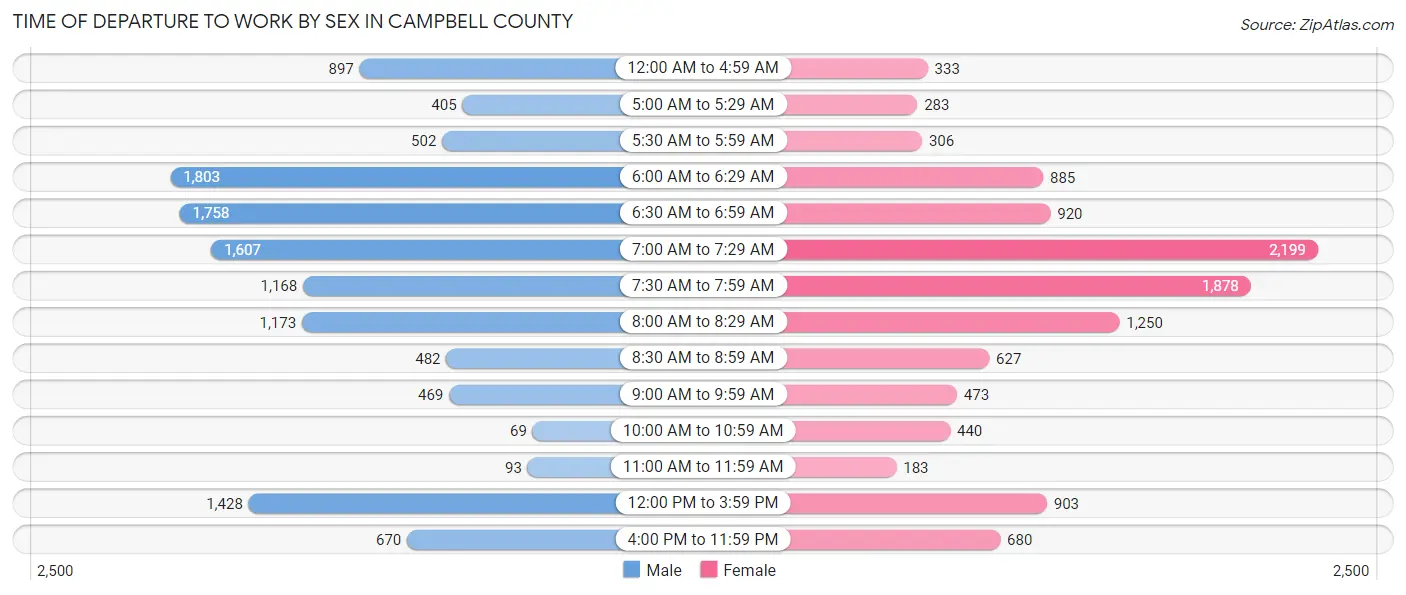
| Time of Departure | Male | Female |
| 12:00 AM to 4:59 AM | 897 (7.2%) | 333 (2.9%) |
| 5:00 AM to 5:29 AM | 405 (3.2%) | 283 (2.5%) |
| 5:30 AM to 5:59 AM | 502 (4.0%) | 306 (2.7%) |
| 6:00 AM to 6:29 AM | 1,803 (14.4%) | 885 (7.8%) |
| 6:30 AM to 6:59 AM | 1,758 (14.0%) | 920 (8.1%) |
| 7:00 AM to 7:29 AM | 1,607 (12.8%) | 2,199 (19.4%) |
| 7:30 AM to 7:59 AM | 1,168 (9.3%) | 1,878 (16.5%) |
| 8:00 AM to 8:29 AM | 1,173 (9.4%) | 1,250 (11.0%) |
| 8:30 AM to 8:59 AM | 482 (3.8%) | 627 (5.5%) |
| 9:00 AM to 9:59 AM | 469 (3.7%) | 473 (4.2%) |
| 10:00 AM to 10:59 AM | 69 (0.5%) | 440 (3.9%) |
| 11:00 AM to 11:59 AM | 93 (0.7%) | 183 (1.6%) |
| 12:00 PM to 3:59 PM | 1,428 (11.4%) | 903 (8.0%) |
| 4:00 PM to 11:59 PM | 670 (5.3%) | 680 (6.0%) |
| Total | 12,524 (100.0%) | 11,360 (100.0%) |
Housing Occupancy in Campbell County
Occupancy by Ownership in Campbell County
Of the total 22,409 dwellings in Campbell County, owner-occupied units account for 16,607 (74.1%), while renter-occupied units make up 5,802 (25.9%).
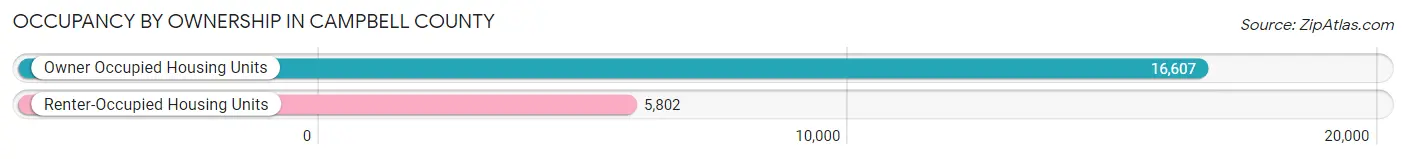
| Occupancy | # Housing Units | % Housing Units |
| Owner Occupied Housing Units | 16,607 | 74.1% |
| Renter-Occupied Housing Units | 5,802 | 25.9% |
| Total Occupied Housing Units | 22,409 | 100.0% |
Occupancy by Household Size in Campbell County
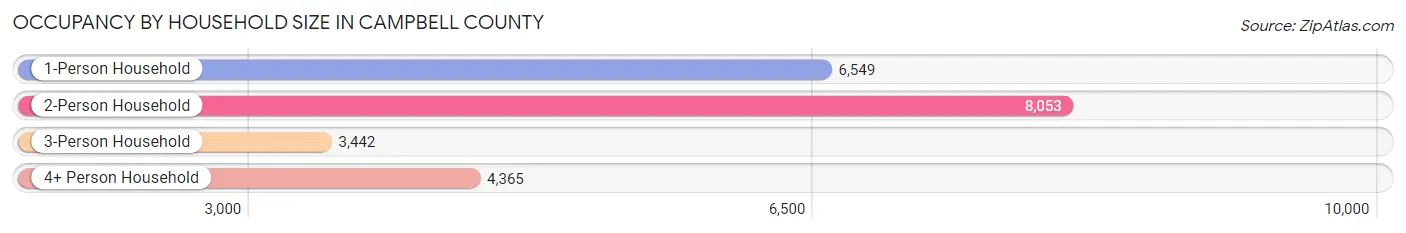
| Household Size | # Housing Units | % Housing Units |
| 1-Person Household | 6,549 | 29.2% |
| 2-Person Household | 8,053 | 35.9% |
| 3-Person Household | 3,442 | 15.4% |
| 4+ Person Household | 4,365 | 19.5% |
| Total Housing Units | 22,409 | 100.0% |
Occupancy by Ownership by Household Size in Campbell County
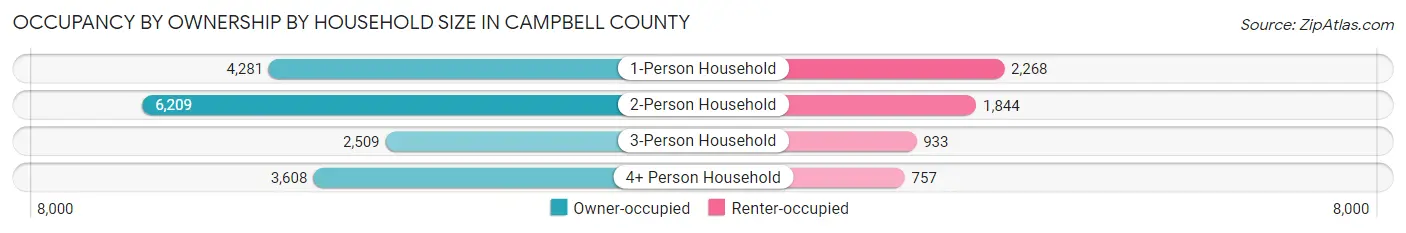
| Household Size | Owner-occupied | Renter-occupied |
| 1-Person Household | 4,281 (65.4%) | 2,268 (34.6%) |
| 2-Person Household | 6,209 (77.1%) | 1,844 (22.9%) |
| 3-Person Household | 2,509 (72.9%) | 933 (27.1%) |
| 4+ Person Household | 3,608 (82.7%) | 757 (17.3%) |
| Total Housing Units | 16,607 (74.1%) | 5,802 (25.9%) |
Occupancy by Educational Attainment in Campbell County
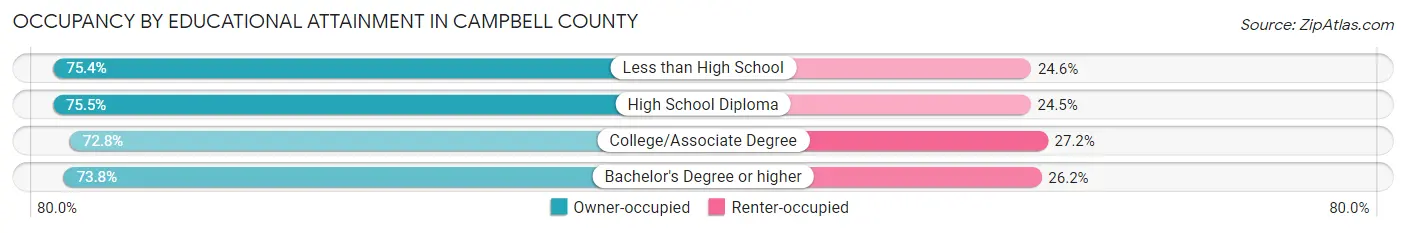
| Household Size | Owner-occupied | Renter-occupied |
| Less than High School | 1,487 (75.4%) | 484 (24.6%) |
| High School Diploma | 5,032 (75.5%) | 1,633 (24.5%) |
| College/Associate Degree | 5,572 (72.8%) | 2,081 (27.2%) |
| Bachelor's Degree or higher | 4,516 (73.8%) | 1,604 (26.2%) |
Occupancy by Age of Householder in Campbell County
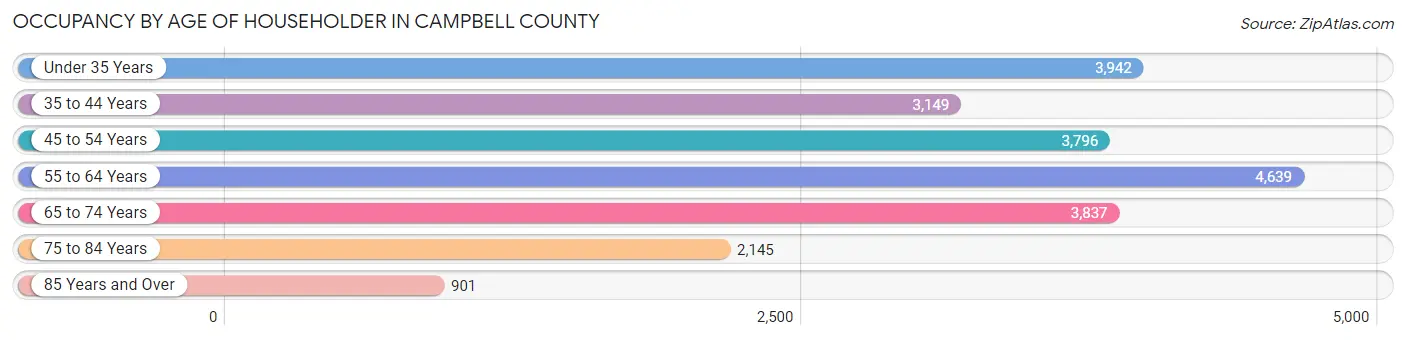
| Age Bracket | # Households | % Households |
| Under 35 Years | 3,942 | 17.6% |
| 35 to 44 Years | 3,149 | 14.1% |
| 45 to 54 Years | 3,796 | 16.9% |
| 55 to 64 Years | 4,639 | 20.7% |
| 65 to 74 Years | 3,837 | 17.1% |
| 75 to 84 Years | 2,145 | 9.6% |
| 85 Years and Over | 901 | 4.0% |
| Total | 22,409 | 100.0% |
Housing Finances in Campbell County
Median Income by Occupancy in Campbell County
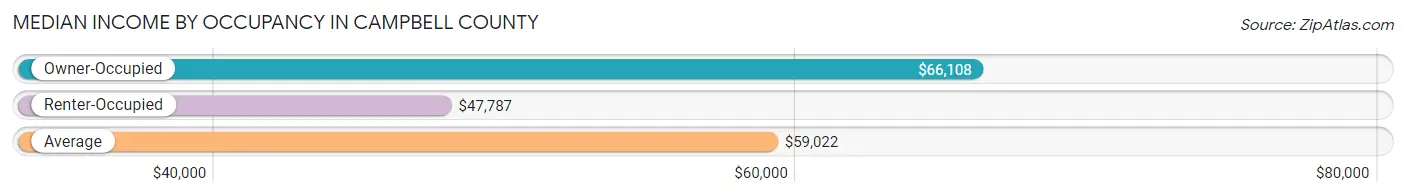
| Occupancy Type | # Households | Median Income |
| Owner-Occupied | 16,607 (74.1%) | $66,108 |
| Renter-Occupied | 5,802 (25.9%) | $47,787 |
| Average | 22,409 (100.0%) | $59,022 |
Occupancy by Householder Income Bracket in Campbell County
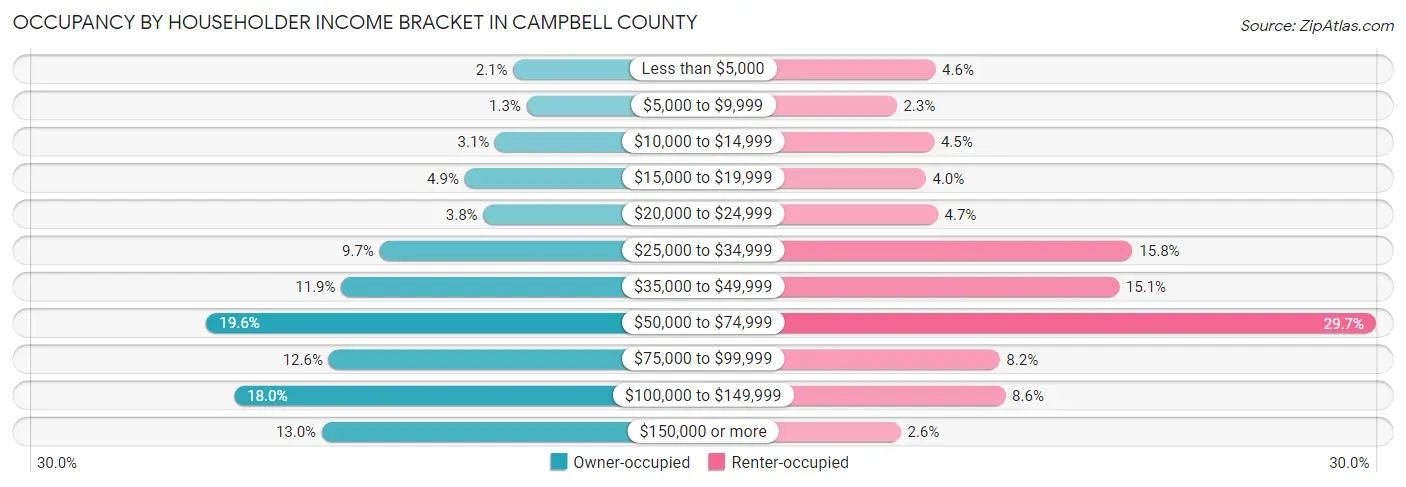
| Income Bracket | Owner-occupied | Renter-occupied |
| Less than $5,000 | 344 (2.1%) | 264 (4.5%) |
| $5,000 to $9,999 | 218 (1.3%) | 136 (2.3%) |
| $10,000 to $14,999 | 516 (3.1%) | 260 (4.5%) |
| $15,000 to $19,999 | 806 (4.9%) | 232 (4.0%) |
| $20,000 to $24,999 | 627 (3.8%) | 272 (4.7%) |
| $25,000 to $34,999 | 1,613 (9.7%) | 918 (15.8%) |
| $35,000 to $49,999 | 1,977 (11.9%) | 873 (15.0%) |
| $50,000 to $74,999 | 3,257 (19.6%) | 1,725 (29.7%) |
| $75,000 to $99,999 | 2,095 (12.6%) | 477 (8.2%) |
| $100,000 to $149,999 | 2,993 (18.0%) | 496 (8.6%) |
| $150,000 or more | 2,161 (13.0%) | 149 (2.6%) |
| Total | 16,607 (100.0%) | 5,802 (100.0%) |
Monthly Housing Cost Tiers in Campbell County
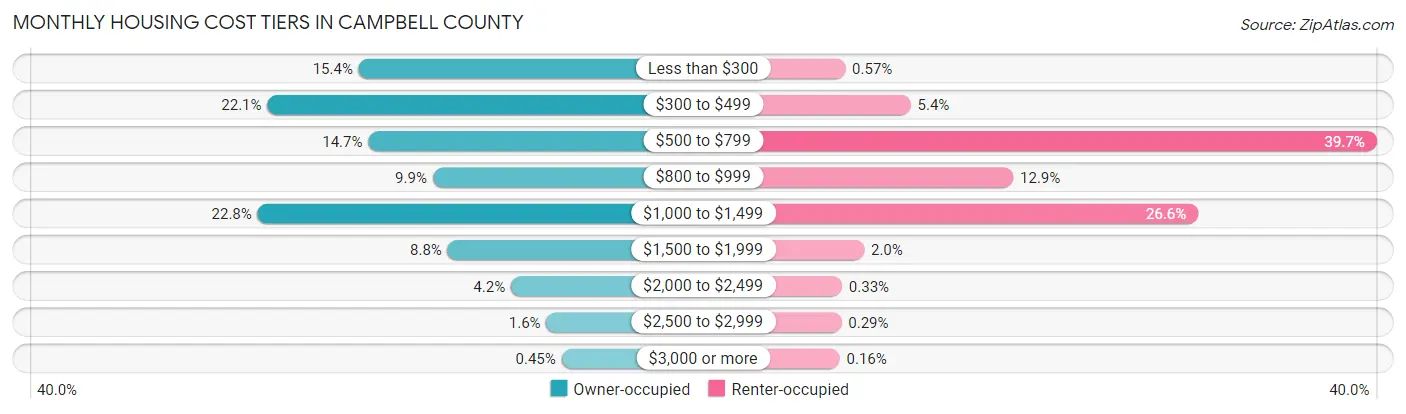
| Monthly Cost | Owner-occupied | Renter-occupied |
| Less than $300 | 2,555 (15.4%) | 33 (0.6%) |
| $300 to $499 | 3,673 (22.1%) | 313 (5.4%) |
| $500 to $799 | 2,439 (14.7%) | 2,304 (39.7%) |
| $800 to $999 | 1,650 (9.9%) | 751 (12.9%) |
| $1,000 to $1,499 | 3,793 (22.8%) | 1,541 (26.6%) |
| $1,500 to $1,999 | 1,468 (8.8%) | 114 (2.0%) |
| $2,000 to $2,499 | 695 (4.2%) | 19 (0.3%) |
| $2,500 to $2,999 | 260 (1.6%) | 17 (0.3%) |
| $3,000 or more | 74 (0.4%) | 9 (0.2%) |
| Total | 16,607 (100.0%) | 5,802 (100.0%) |
Physical Housing Characteristics in Campbell County
Housing Structures in Campbell County
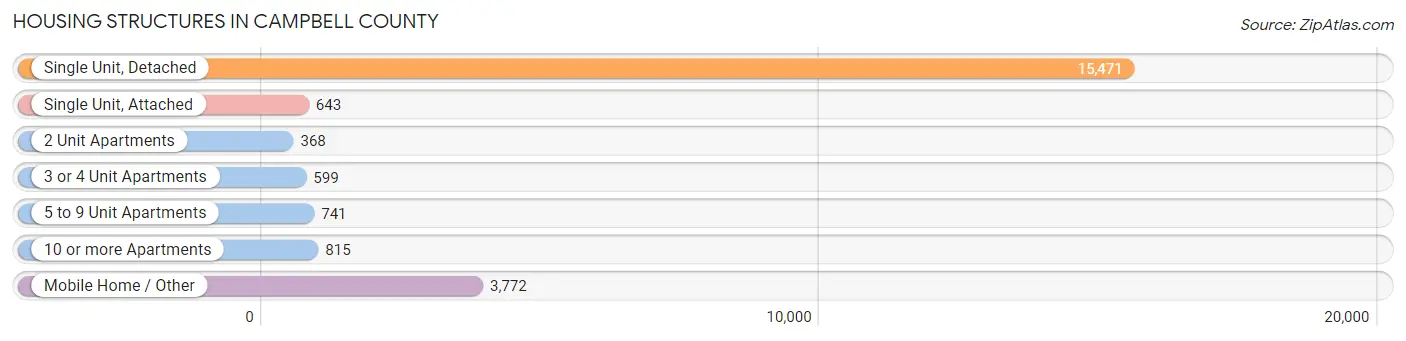
| Structure Type | # Housing Units | % Housing Units |
| Single Unit, Detached | 15,471 | 69.0% |
| Single Unit, Attached | 643 | 2.9% |
| 2 Unit Apartments | 368 | 1.6% |
| 3 or 4 Unit Apartments | 599 | 2.7% |
| 5 to 9 Unit Apartments | 741 | 3.3% |
| 10 or more Apartments | 815 | 3.6% |
| Mobile Home / Other | 3,772 | 16.8% |
| Total | 22,409 | 100.0% |
Housing Structures by Occupancy in Campbell County
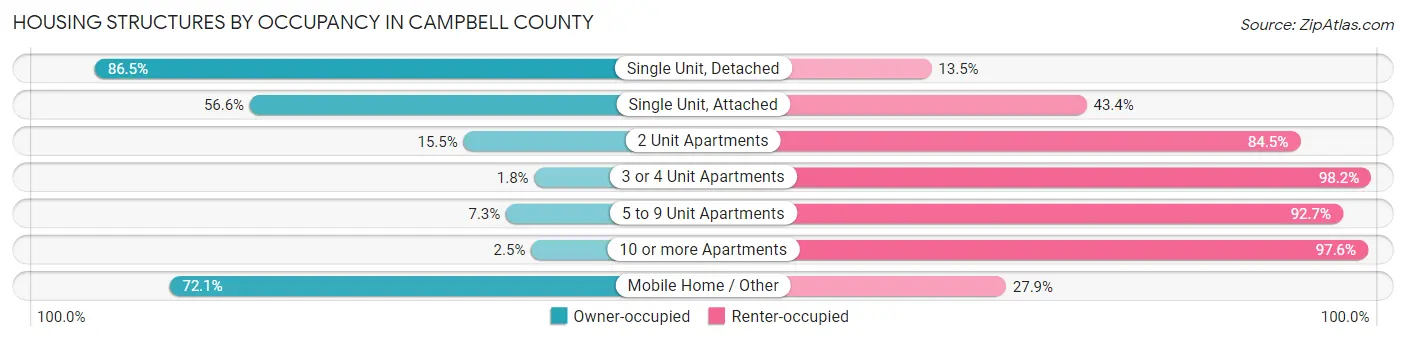
| Structure Type | Owner-occupied | Renter-occupied |
| Single Unit, Detached | 13,380 (86.5%) | 2,091 (13.5%) |
| Single Unit, Attached | 364 (56.6%) | 279 (43.4%) |
| 2 Unit Apartments | 57 (15.5%) | 311 (84.5%) |
| 3 or 4 Unit Apartments | 11 (1.8%) | 588 (98.2%) |
| 5 to 9 Unit Apartments | 54 (7.3%) | 687 (92.7%) |
| 10 or more Apartments | 20 (2.5%) | 795 (97.6%) |
| Mobile Home / Other | 2,721 (72.1%) | 1,051 (27.9%) |
| Total | 16,607 (74.1%) | 5,802 (25.9%) |
Housing Structures by Number of Rooms in Campbell County
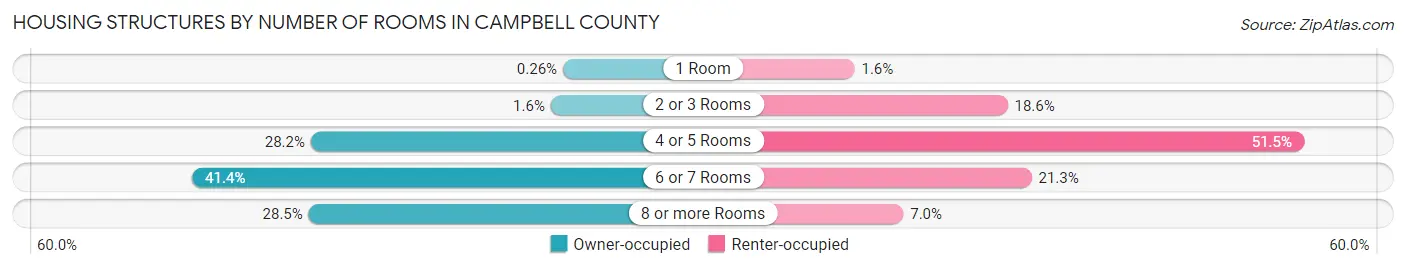
| Number of Rooms | Owner-occupied | Renter-occupied |
| 1 Room | 44 (0.3%) | 94 (1.6%) |
| 2 or 3 Rooms | 267 (1.6%) | 1,079 (18.6%) |
| 4 or 5 Rooms | 4,690 (28.2%) | 2,987 (51.5%) |
| 6 or 7 Rooms | 6,877 (41.4%) | 1,234 (21.3%) |
| 8 or more Rooms | 4,729 (28.5%) | 408 (7.0%) |
| Total | 16,607 (100.0%) | 5,802 (100.0%) |
Housing Structure by Heating Type in Campbell County
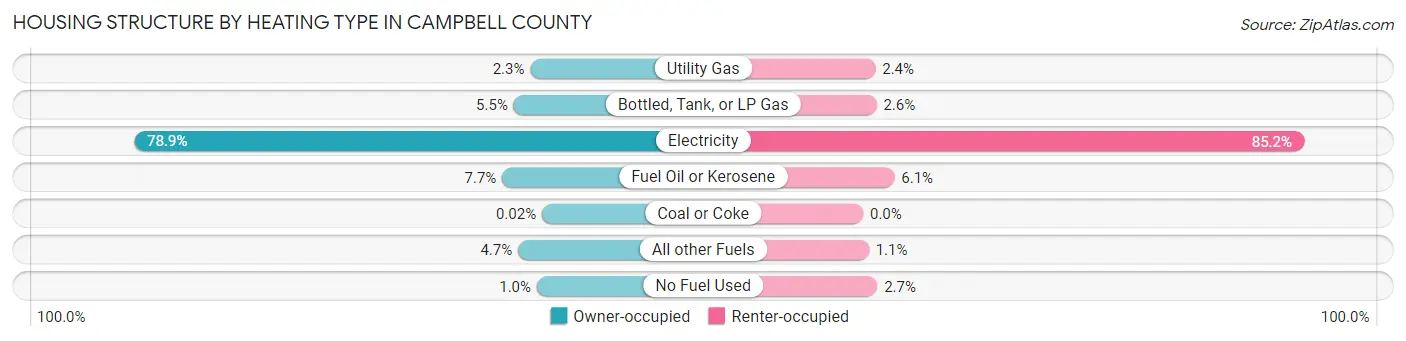
| Heating Type | Owner-occupied | Renter-occupied |
| Utility Gas | 378 (2.3%) | 137 (2.4%) |
| Bottled, Tank, or LP Gas | 910 (5.5%) | 151 (2.6%) |
| Electricity | 13,095 (78.8%) | 4,941 (85.2%) |
| Fuel Oil or Kerosene | 1,280 (7.7%) | 351 (6.0%) |
| Coal or Coke | 4 (0.0%) | 0 (0.0%) |
| All other Fuels | 773 (4.6%) | 63 (1.1%) |
| No Fuel Used | 167 (1.0%) | 159 (2.7%) |
| Total | 16,607 (100.0%) | 5,802 (100.0%) |
Household Vehicle Usage in Campbell County
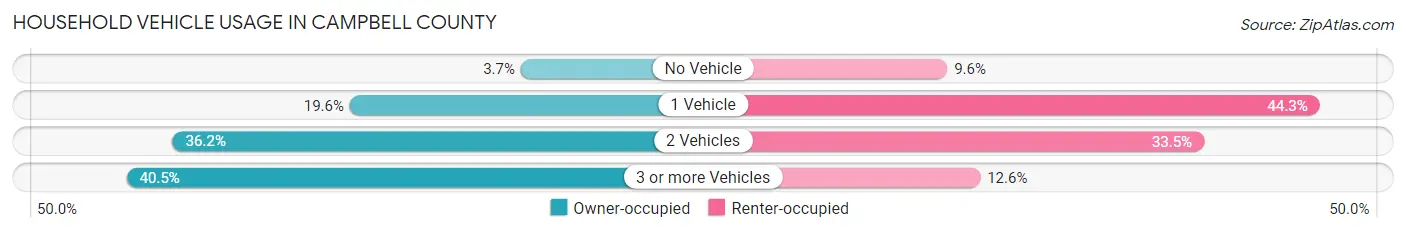
| Vehicles per Household | Owner-occupied | Renter-occupied |
| No Vehicle | 611 (3.7%) | 554 (9.6%) |
| 1 Vehicle | 3,261 (19.6%) | 2,571 (44.3%) |
| 2 Vehicles | 6,010 (36.2%) | 1,944 (33.5%) |
| 3 or more Vehicles | 6,725 (40.5%) | 733 (12.6%) |
| Total | 16,607 (100.0%) | 5,802 (100.0%) |
Real Estate & Mortgages in Campbell County
Real Estate and Mortgage Overview in Campbell County
| Characteristic | Without Mortgage | With Mortgage |
| Housing Units | 7,637 | 8,970 |
| Median Property Value | $148,900 | $205,800 |
| Median Household Income | $47,170 | $1,616 |
| Monthly Housing Costs | $351 | $74 |
| Real Estate Taxes | $812 | $346 |
Property Value by Mortgage Status in Campbell County
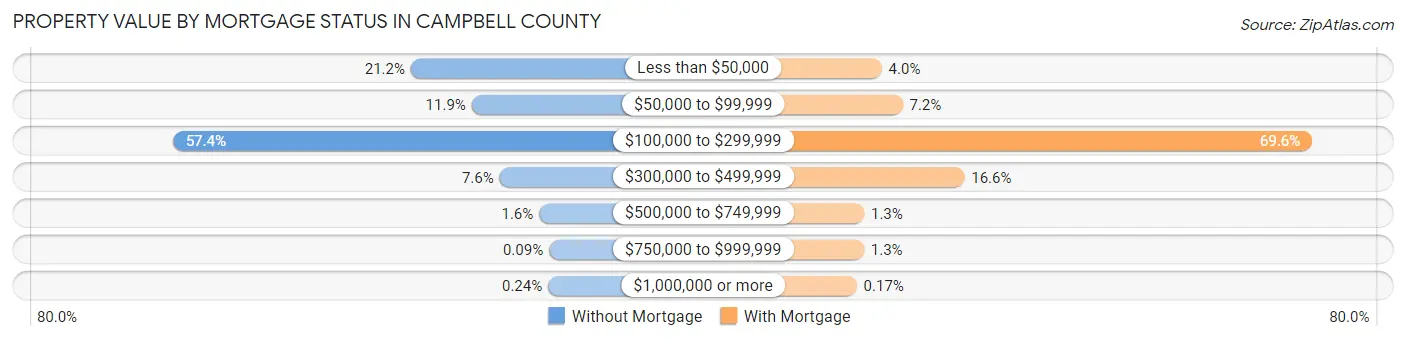
| Property Value | Without Mortgage | With Mortgage |
| Less than $50,000 | 1,615 (21.1%) | 357 (4.0%) |
| $50,000 to $99,999 | 907 (11.9%) | 642 (7.2%) |
| $100,000 to $299,999 | 4,385 (57.4%) | 6,240 (69.6%) |
| $300,000 to $499,999 | 583 (7.6%) | 1,486 (16.6%) |
| $500,000 to $749,999 | 122 (1.6%) | 116 (1.3%) |
| $750,000 to $999,999 | 7 (0.1%) | 114 (1.3%) |
| $1,000,000 or more | 18 (0.2%) | 15 (0.2%) |
| Total | 7,637 (100.0%) | 8,970 (100.0%) |
Household Income by Mortgage Status in Campbell County
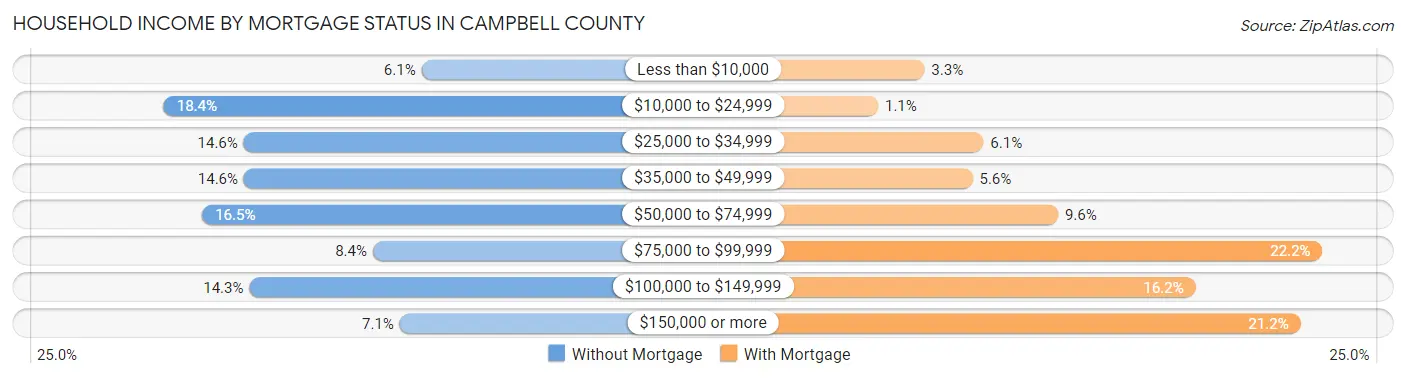
| Household Income | Without Mortgage | With Mortgage |
| Less than $10,000 | 466 (6.1%) | 294 (3.3%) |
| $10,000 to $24,999 | 1,403 (18.4%) | 96 (1.1%) |
| $25,000 to $34,999 | 1,113 (14.6%) | 546 (6.1%) |
| $35,000 to $49,999 | 1,112 (14.6%) | 500 (5.6%) |
| $50,000 to $74,999 | 1,263 (16.5%) | 865 (9.6%) |
| $75,000 to $99,999 | 643 (8.4%) | 1,994 (22.2%) |
| $100,000 to $149,999 | 1,092 (14.3%) | 1,452 (16.2%) |
| $150,000 or more | 545 (7.1%) | 1,901 (21.2%) |
| Total | 7,637 (100.0%) | 8,970 (100.0%) |
Property Value to Household Income Ratio in Campbell County
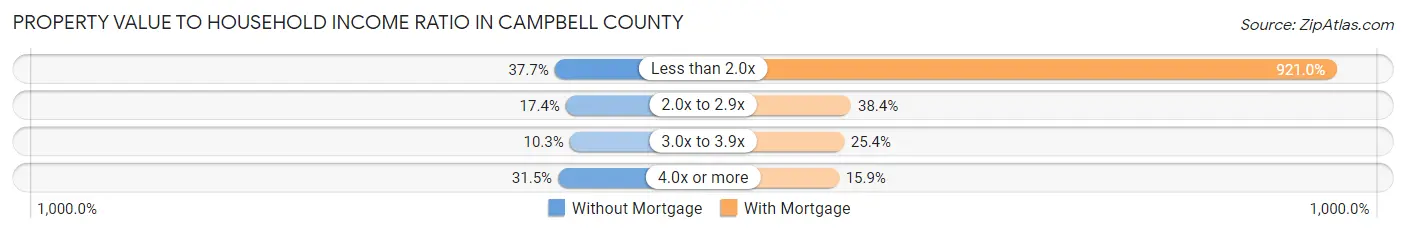
| Value-to-Income Ratio | Without Mortgage | With Mortgage |
| Less than 2.0x | 2,876 (37.7%) | 82,614 (921.0%) |
| 2.0x to 2.9x | 1,326 (17.4%) | 3,441 (38.4%) |
| 3.0x to 3.9x | 788 (10.3%) | 2,274 (25.4%) |
| 4.0x or more | 2,405 (31.5%) | 1,426 (15.9%) |
| Total | 7,637 (100.0%) | 8,970 (100.0%) |
Real Estate Taxes by Mortgage Status in Campbell County
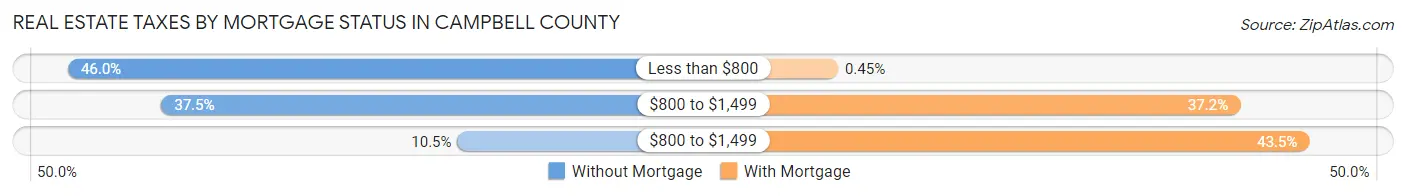
| Property Taxes | Without Mortgage | With Mortgage |
| Less than $800 | 3,516 (46.0%) | 40 (0.4%) |
| $800 to $1,499 | 2,865 (37.5%) | 3,334 (37.2%) |
| $800 to $1,499 | 800 (10.5%) | 3,901 (43.5%) |
| Total | 7,637 (100.0%) | 8,970 (100.0%) |
Health & Disability in Campbell County
Health Insurance Coverage by Age in Campbell County
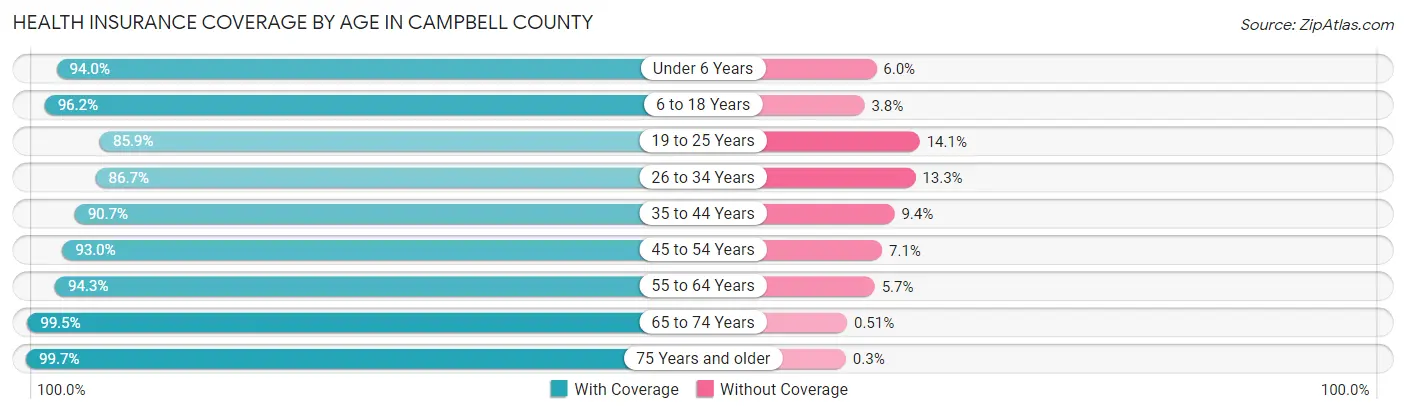
| Age Bracket | With Coverage | Without Coverage |
| Under 6 Years | 3,192 (94.0%) | 203 (6.0%) |
| 6 to 18 Years | 7,837 (96.2%) | 306 (3.8%) |
| 19 to 25 Years | 3,940 (85.9%) | 645 (14.1%) |
| 26 to 34 Years | 5,605 (86.7%) | 857 (13.3%) |
| 35 to 44 Years | 5,642 (90.6%) | 582 (9.3%) |
| 45 to 54 Years | 6,473 (92.9%) | 491 (7.0%) |
| 55 to 64 Years | 7,508 (94.3%) | 452 (5.7%) |
| 65 to 74 Years | 6,408 (99.5%) | 33 (0.5%) |
| 75 Years and older | 4,727 (99.7%) | 14 (0.3%) |
| Total | 51,332 (93.5%) | 3,583 (6.5%) |
Health Insurance Coverage by Citizenship Status in Campbell County
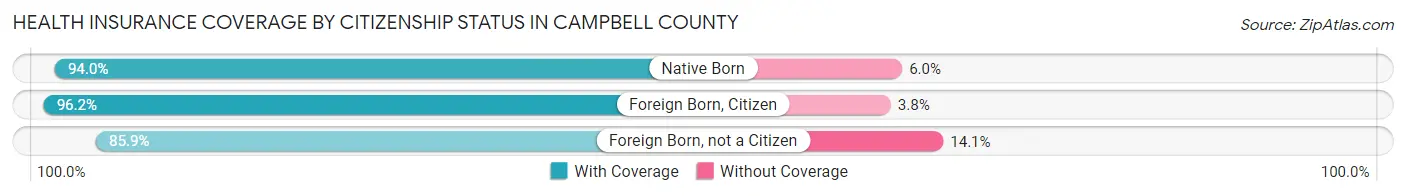
| Citizenship Status | With Coverage | Without Coverage |
| Native Born | 3,192 (94.0%) | 203 (6.0%) |
| Foreign Born, Citizen | 7,837 (96.2%) | 306 (3.8%) |
| Foreign Born, not a Citizen | 3,940 (85.9%) | 645 (14.1%) |
Health Insurance Coverage by Household Income in Campbell County
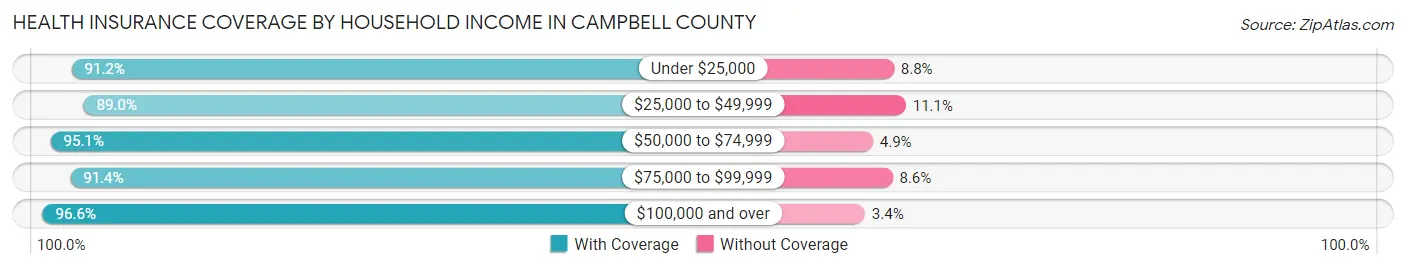
| Household Income | With Coverage | Without Coverage |
| Under $25,000 | 5,298 (91.2%) | 512 (8.8%) |
| $25,000 to $49,999 | 9,264 (88.9%) | 1,151 (11.1%) |
| $50,000 to $74,999 | 11,513 (95.1%) | 591 (4.9%) |
| $75,000 to $99,999 | 7,073 (91.4%) | 663 (8.6%) |
| $100,000 and over | 18,132 (96.6%) | 636 (3.4%) |
Public vs Private Health Insurance Coverage by Age in Campbell County
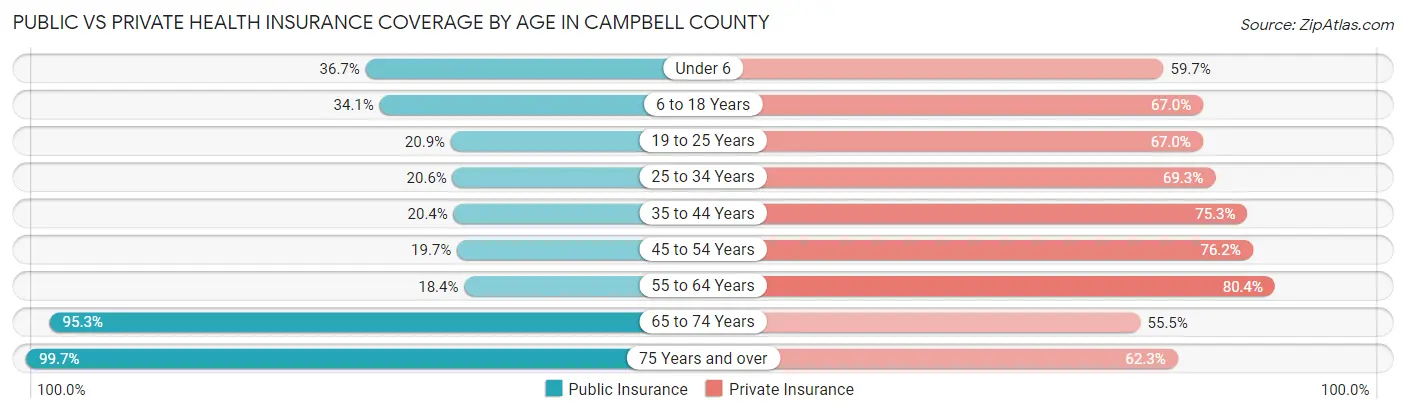
| Age Bracket | Public Insurance | Private Insurance |
| Under 6 | 1,246 (36.7%) | 2,028 (59.7%) |
| 6 to 18 Years | 2,777 (34.1%) | 5,459 (67.0%) |
| 19 to 25 Years | 957 (20.9%) | 3,071 (67.0%) |
| 25 to 34 Years | 1,328 (20.5%) | 4,476 (69.3%) |
| 35 to 44 Years | 1,268 (20.4%) | 4,685 (75.3%) |
| 45 to 54 Years | 1,373 (19.7%) | 5,309 (76.2%) |
| 55 to 64 Years | 1,464 (18.4%) | 6,397 (80.4%) |
| 65 to 74 Years | 6,141 (95.3%) | 3,572 (55.5%) |
| 75 Years and over | 4,727 (99.7%) | 2,954 (62.3%) |
| Total | 21,281 (38.8%) | 37,951 (69.1%) |
Disability Status by Sex by Age in Campbell County
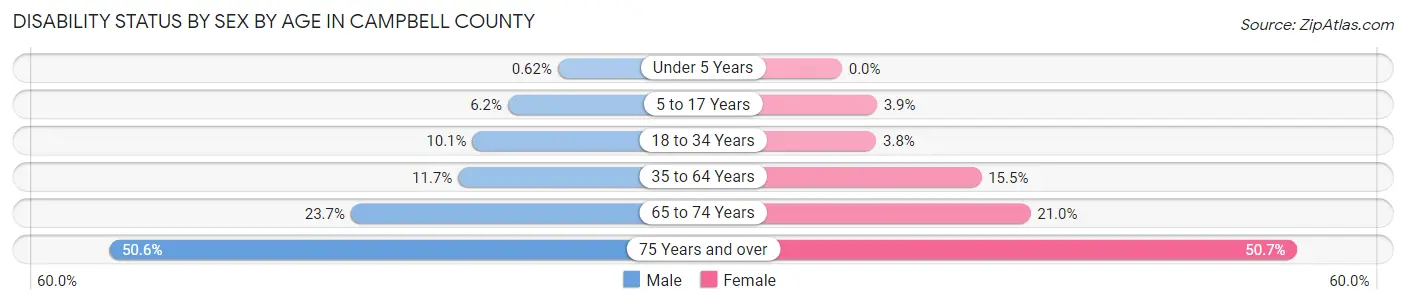
| Age Bracket | Male | Female |
| Under 5 Years | 8 (0.6%) | 0 (0.0%) |
| 5 to 17 Years | 257 (6.2%) | 153 (3.9%) |
| 18 to 34 Years | 588 (10.1%) | 224 (3.8%) |
| 35 to 64 Years | 1,223 (11.7%) | 1,664 (15.5%) |
| 65 to 74 Years | 718 (23.7%) | 715 (21.0%) |
| 75 Years and over | 1,004 (50.6%) | 1,399 (50.7%) |
Disability Class by Sex by Age in Campbell County
Disability Class: Hearing Difficulty
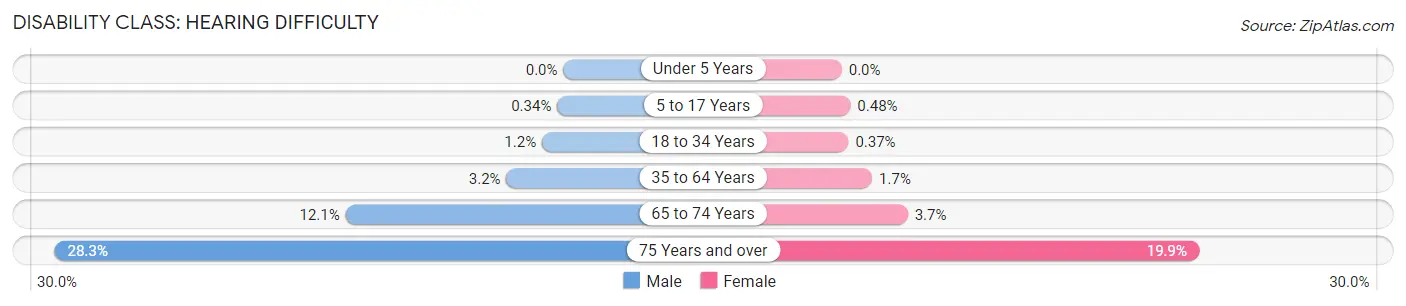
| Age Bracket | Male | Female |
| Under 5 Years | 0 (0.0%) | 0 (0.0%) |
| 5 to 17 Years | 14 (0.3%) | 19 (0.5%) |
| 18 to 34 Years | 69 (1.2%) | 22 (0.4%) |
| 35 to 64 Years | 331 (3.2%) | 181 (1.7%) |
| 65 to 74 Years | 368 (12.1%) | 125 (3.7%) |
| 75 Years and over | 562 (28.3%) | 548 (19.9%) |
Disability Class: Vision Difficulty
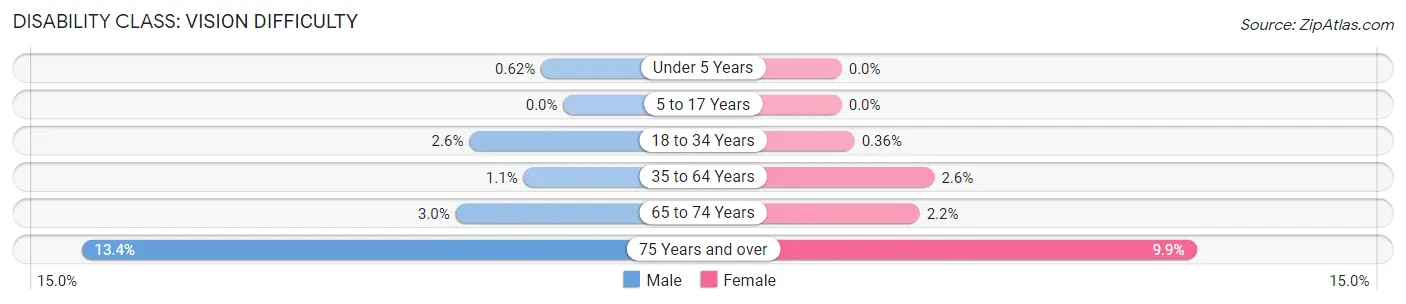
| Age Bracket | Male | Female |
| Under 5 Years | 8 (0.6%) | 0 (0.0%) |
| 5 to 17 Years | 0 (0.0%) | 0 (0.0%) |
| 18 to 34 Years | 152 (2.6%) | 21 (0.4%) |
| 35 to 64 Years | 116 (1.1%) | 276 (2.6%) |
| 65 to 74 Years | 91 (3.0%) | 74 (2.2%) |
| 75 Years and over | 266 (13.4%) | 272 (9.9%) |
Disability Class: Cognitive Difficulty
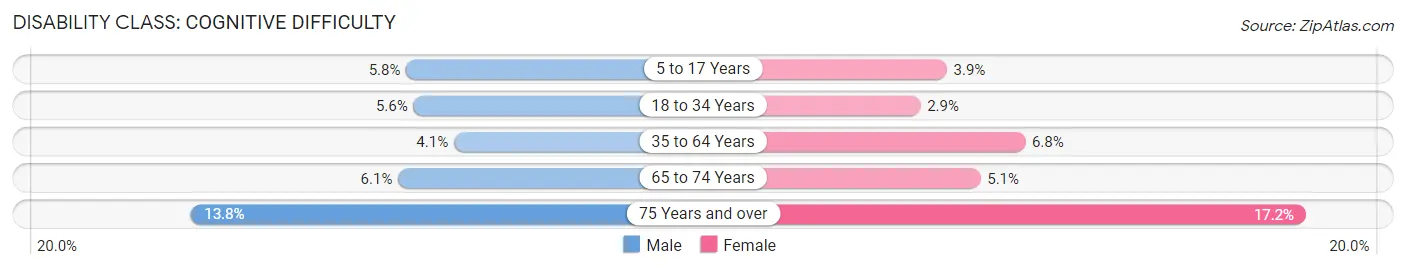
| Age Bracket | Male | Female |
| 5 to 17 Years | 242 (5.8%) | 153 (3.9%) |
| 18 to 34 Years | 323 (5.6%) | 171 (2.9%) |
| 35 to 64 Years | 424 (4.1%) | 728 (6.8%) |
| 65 to 74 Years | 186 (6.1%) | 175 (5.1%) |
| 75 Years and over | 274 (13.8%) | 475 (17.2%) |
Disability Class: Ambulatory Difficulty
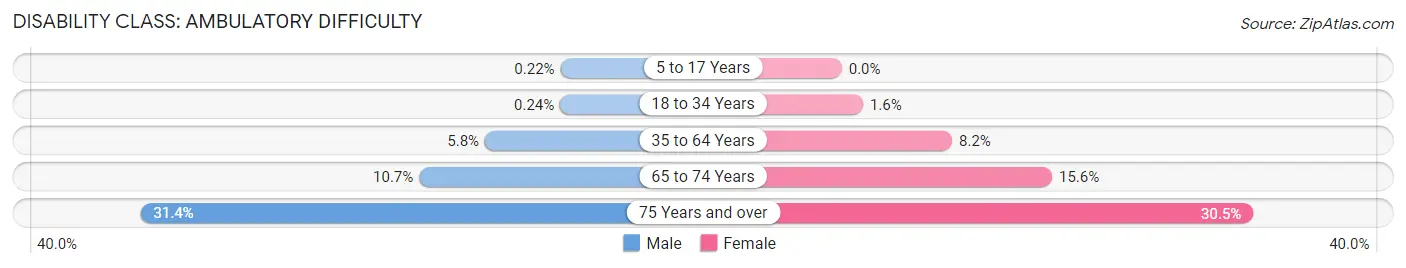
| Age Bracket | Male | Female |
| 5 to 17 Years | 9 (0.2%) | 0 (0.0%) |
| 18 to 34 Years | 14 (0.2%) | 92 (1.6%) |
| 35 to 64 Years | 607 (5.8%) | 877 (8.2%) |
| 65 to 74 Years | 325 (10.7%) | 532 (15.6%) |
| 75 Years and over | 623 (31.4%) | 842 (30.5%) |
Disability Class: Self-Care Difficulty
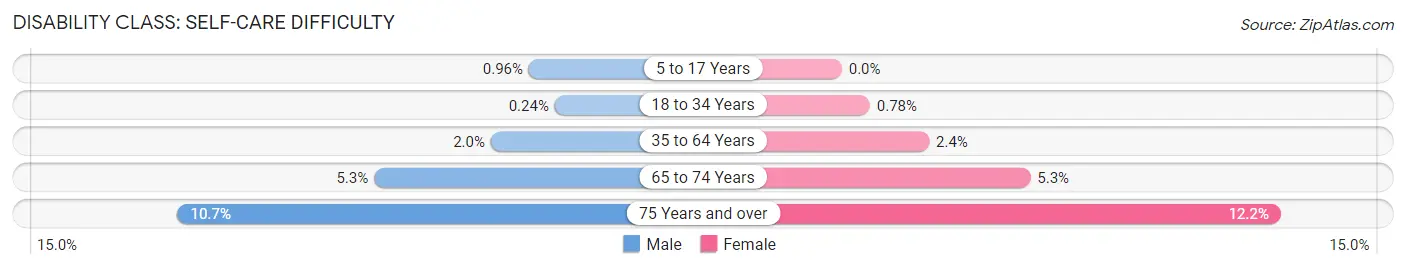
| Age Bracket | Male | Female |
| 5 to 17 Years | 40 (1.0%) | 0 (0.0%) |
| 18 to 34 Years | 14 (0.2%) | 46 (0.8%) |
| 35 to 64 Years | 211 (2.0%) | 260 (2.4%) |
| 65 to 74 Years | 160 (5.3%) | 179 (5.2%) |
| 75 Years and over | 213 (10.7%) | 337 (12.2%) |
Technology Access in Campbell County
Computing Device Access in Campbell County
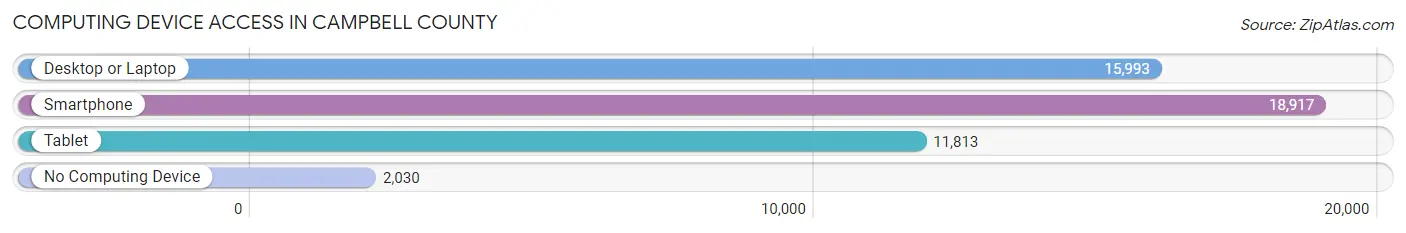
| Device Type | # Households | % Households |
| Desktop or Laptop | 15,993 | 71.4% |
| Smartphone | 18,917 | 84.4% |
| Tablet | 11,813 | 52.7% |
| No Computing Device | 2,030 | 9.1% |
| Total | 22,409 | 100.0% |
Internet Access in Campbell County
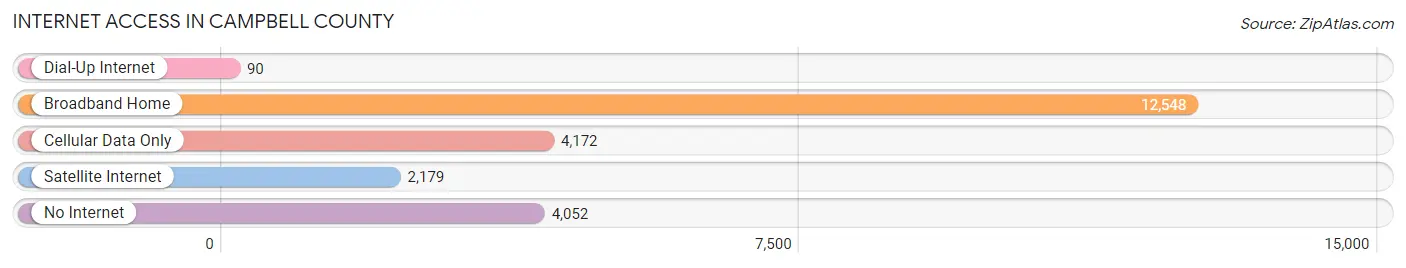
| Internet Type | # Households | % Households |
| Dial-Up Internet | 90 | 0.4% |
| Broadband Home | 12,548 | 56.0% |
| Cellular Data Only | 4,172 | 18.6% |
| Satellite Internet | 2,179 | 9.7% |
| No Internet | 4,052 | 18.1% |
| Total | 22,409 | 100.0% |
Campbell County Summary
Campbell County, Virginia is located in the south-central part of the state, and is part of the Lynchburg Metropolitan Statistical Area. The county was established in 1782 and is named after General William Campbell, who was a hero of the Revolutionary War. The county seat is Rustburg, and the county has a population of 54,842 as of the 2010 census.
Geography
Campbell County is located in the foothills of the Blue Ridge Mountains, and is bordered by Bedford County to the north, Amherst County to the east, Appomattox County to the south, and Lynchburg to the west. The county covers an area of 437 square miles, and is home to several rivers, including the James, Appomattox, and Staunton. The county is also home to several state parks, including Natural Tunnel State Park, which is home to a natural tunnel that is over 800 feet long.
Economy
The economy of Campbell County is largely based on agriculture, with the county being home to several large farms. The county is also home to several manufacturing companies, including the Lynchburg Foundry, which produces cast iron products. The county is also home to several retail stores, including Walmart, Target, and Lowe's.
Demographics
As of the 2010 census, the population of Campbell County was 54,842, with a population density of 124 people per square mile. The racial makeup of the county was 87.3% White, 8.7% African American, 0.4% Native American, 0.7% Asian, 0.1% Pacific Islander, 1.2% from other races, and 1.6% from two or more races. The median household income was $45,837, and the median family income was $54,845.
Conclusion
Campbell County, Virginia is a rural county located in the foothills of the Blue Ridge Mountains. The county is home to several rivers, state parks, and manufacturing companies, and has a population of 54,842 as of the 2010 census. The economy of the county is largely based on agriculture, with the county being home to several large farms. The median household income is $45,837, and the median family income is $54,845.
Common Questions
What is Per Capita Income in Campbell County?
Per Capita income in Campbell County is $31,877.
What is the Median Family Income in Campbell County?
Median Family Income in Campbell County is $74,391.
What is the Median Household income in Campbell County?
Median Household Income in Campbell County is $59,022.
What is Income or Wage Gap in Campbell County?
Income or Wage Gap in Campbell County is 20.8%.
Women in Campbell County earn 79.2 cents for every dollar earned by a man.
What is Family Income Deficit in Campbell County?
Family Income Deficit in Campbell County is $10,927.
Families that are below poverty line in Campbell County earn $10,927 less on average than the poverty threshold level.
What is Inequality or Gini Index in Campbell County?
Inequality or Gini Index in Campbell County is 0.42.
What is the Total Population of Campbell County?
Total Population of Campbell County is 55,518.
What is the Total Male Population of Campbell County?
Total Male Population of Campbell County is 27,091.
What is the Total Female Population of Campbell County?
Total Female Population of Campbell County is 28,427.
What is the Ratio of Males per 100 Females in Campbell County?
There are 95.30 Males per 100 Females in Campbell County.
What is the Ratio of Females per 100 Males in Campbell County?
There are 104.93 Females per 100 Males in Campbell County.
What is the Median Population Age in Campbell County?
Median Population Age in Campbell County is 43.1 Years.
What is the Average Family Size in Campbell County
Average Family Size in Campbell County is 3.0 People.
What is the Average Household Size in Campbell County
Average Household Size in Campbell County is 2.5 People.
How Large is the Labor Force in Campbell County?
There are 27,582 People in the Labor Forcein in Campbell County.
What is the Percentage of People in the Labor Force in Campbell County?
60.0% of People are in the Labor Force in Campbell County.
What is the Unemployment Rate in Campbell County?
Unemployment Rate in Campbell County is 4.9%.