Buchanan County, VA Map & Demographics
Buchanan County Map
Buchanan County Overview
$24,126
PER CAPITA INCOME
$46,783
AVG FAMILY INCOME
$39,591
AVG HOUSEHOLD INCOME
28.4%
WAGE / INCOME GAP [ % ]
71.6¢/ $1
WAGE / INCOME GAP [ $ ]
$11,656
FAMILY INCOME DEFICIT
0.47
INEQUALITY / GINI INDEX
20,246
TOTAL POPULATION
10,504
MALE POPULATION
9,742
FEMALE POPULATION
107.82
MALES / 100 FEMALES
92.75
FEMALES / 100 MALES
47.6
MEDIAN AGE
3.1
AVG FAMILY SIZE
2.6
AVG HOUSEHOLD SIZE
6,376
LABOR FORCE [ PEOPLE ]
36.7%
PERCENT IN LABOR FORCE
6.0%
UNEMPLOYMENT RATE
Buchanan County Area Codes
Income in Buchanan County
Income Overview in Buchanan County
Per Capita Income in Buchanan County is $24,126, while median incomes of families and households are $46,783 and $39,591 respectively.
| Characteristic | Number | Measure |
| Per Capita Income | 20,246 | $24,126 |
| Median Family Income | 5,189 | $46,783 |
| Mean Family Income | 5,189 | $66,158 |
| Median Household Income | 7,494 | $39,591 |
| Mean Household Income | 7,494 | $55,860 |
| Income Deficit | 5,189 | $11,656 |
| Wage / Income Gap (%) | 20,246 | 28.42% |
| Wage / Income Gap ($) | 20,246 | 71.58¢ per $1 |
| Gini / Inequality Index | 20,246 | 0.47 |
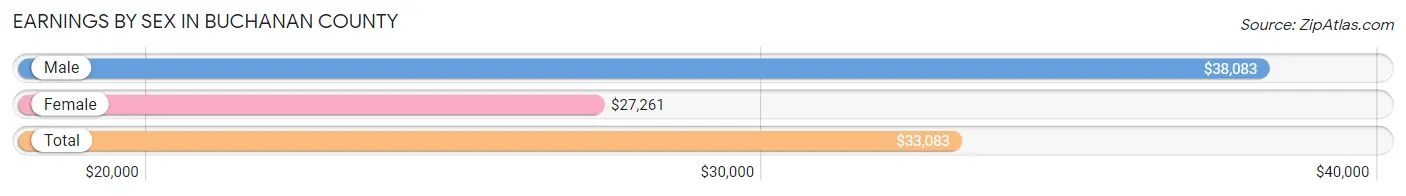
Earnings by Sex in Buchanan County
Average Earnings in Buchanan County are $33,083, $38,083 for men and $27,261 for women, a difference of 28.4%.
| Sex | Number | Average Earnings |
| Male | 3,635 (54.7%) | $38,083 |
| Female | 3,011 (45.3%) | $27,261 |
| Total | 6,646 (100.0%) | $33,083 |
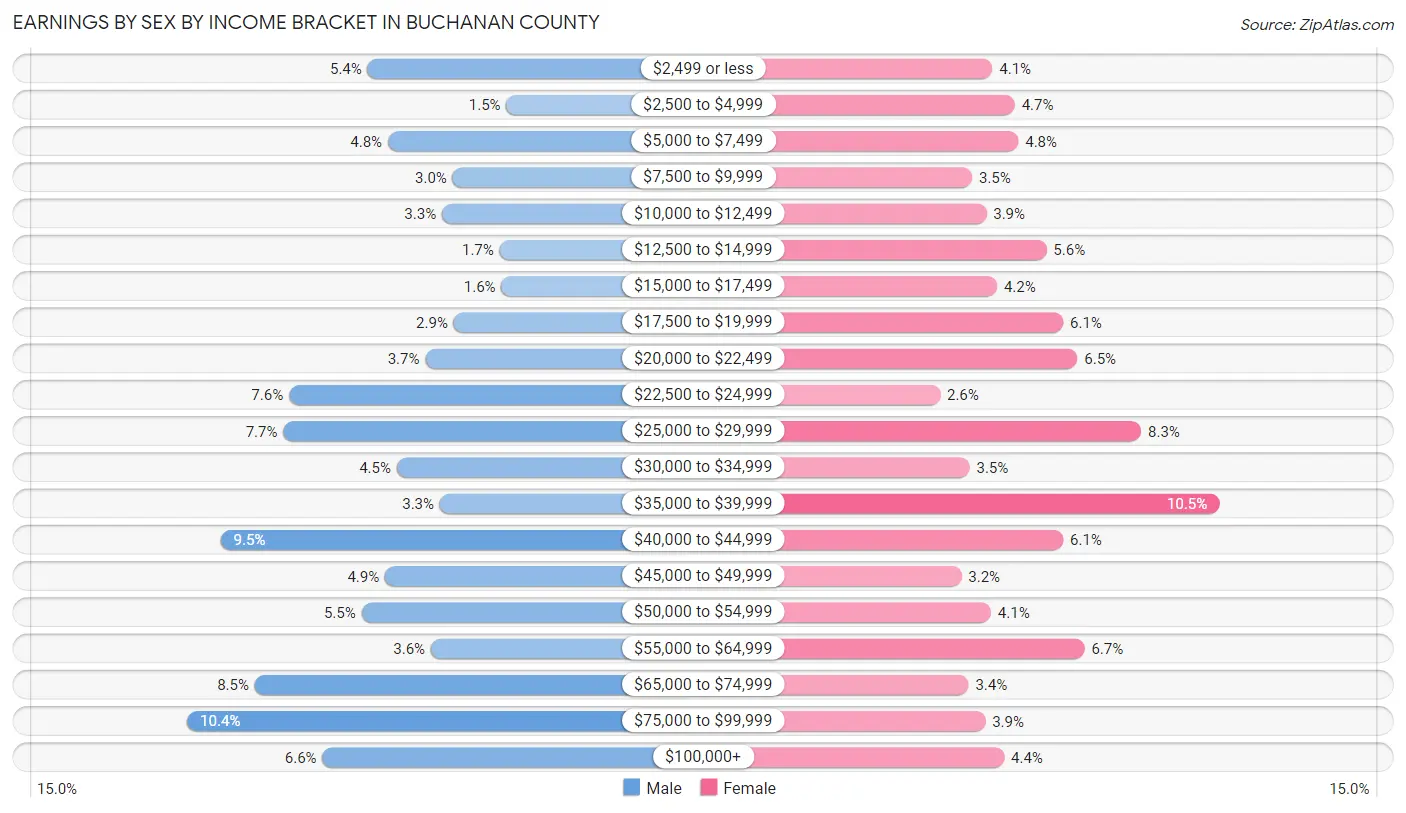
Earnings by Sex by Income Bracket in Buchanan County
The most common earnings brackets in Buchanan County are $75,000 to $99,999 for men (379 | 10.4%) and $35,000 to $39,999 for women (315 | 10.5%).
| Income | Male | Female |
| $2,499 or less | 195 (5.4%) | 123 (4.1%) |
| $2,500 to $4,999 | 53 (1.5%) | 142 (4.7%) |
| $5,000 to $7,499 | 174 (4.8%) | 145 (4.8%) |
| $7,500 to $9,999 | 108 (3.0%) | 106 (3.5%) |
| $10,000 to $12,499 | 119 (3.3%) | 118 (3.9%) |
| $12,500 to $14,999 | 60 (1.7%) | 169 (5.6%) |
| $15,000 to $17,499 | 58 (1.6%) | 127 (4.2%) |
| $17,500 to $19,999 | 107 (2.9%) | 183 (6.1%) |
| $20,000 to $22,499 | 136 (3.7%) | 195 (6.5%) |
| $22,500 to $24,999 | 275 (7.6%) | 79 (2.6%) |
| $25,000 to $29,999 | 281 (7.7%) | 249 (8.3%) |
| $30,000 to $34,999 | 165 (4.5%) | 104 (3.5%) |
| $35,000 to $39,999 | 121 (3.3%) | 315 (10.5%) |
| $40,000 to $44,999 | 345 (9.5%) | 183 (6.1%) |
| $45,000 to $49,999 | 177 (4.9%) | 97 (3.2%) |
| $50,000 to $54,999 | 201 (5.5%) | 122 (4.1%) |
| $55,000 to $64,999 | 130 (3.6%) | 201 (6.7%) |
| $65,000 to $74,999 | 310 (8.5%) | 103 (3.4%) |
| $75,000 to $99,999 | 379 (10.4%) | 117 (3.9%) |
| $100,000+ | 241 (6.6%) | 133 (4.4%) |
| Total | 3,635 (100.0%) | 3,011 (100.0%) |
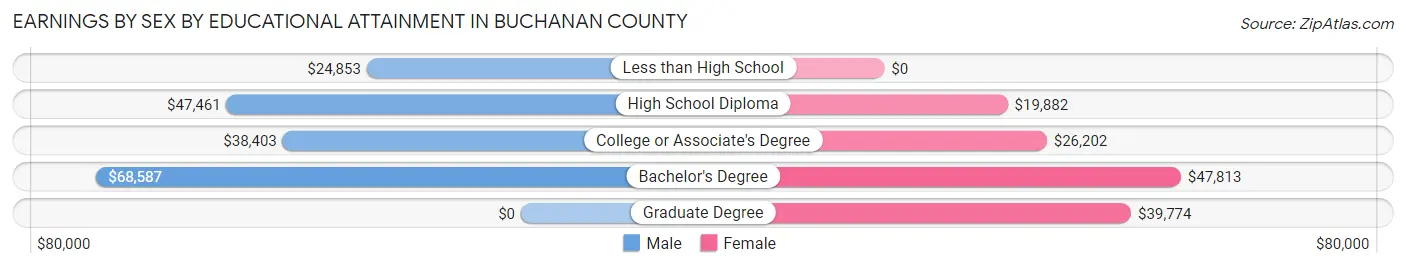
Earnings by Sex by Educational Attainment in Buchanan County
Average earnings in Buchanan County are $42,871 for men and $32,698 for women, a difference of 23.7%. Men with an educational attainment of bachelor's degree enjoy the highest average annual earnings of $68,587, while those with less than high school education earn the least with $24,853. Women with an educational attainment of bachelor's degree earn the most with the average annual earnings of $47,813, while those with high school diploma education have the smallest earnings of $19,882.
| Educational Attainment | Male Income | Female Income |
| Less than High School | $24,853 | $0 |
| High School Diploma | $47,461 | $19,882 |
| College or Associate's Degree | $38,403 | $26,202 |
| Bachelor's Degree | $68,587 | $47,813 |
| Graduate Degree | - | - |
| Total | $42,871 | $32,698 |
Family Income in Buchanan County
Family Income Brackets in Buchanan County
According to the Buchanan County family income data, there are 965 families falling into the $35,000 to $49,999 income range, which is the most common income bracket and makes up 18.6% of all families. Conversely, the $150,000 to $199,999 income bracket is the least frequent group with only 83 families (1.6%) belonging to this category.
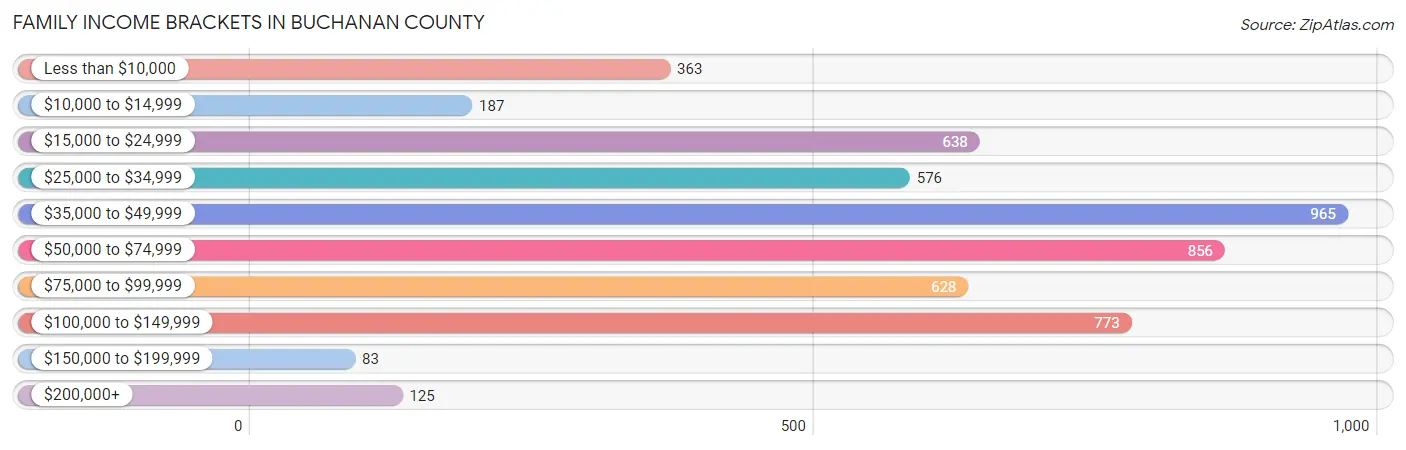
| Income Bracket | # Families | % Families |
| Less than $10,000 | 363 | 7.0% |
| $10,000 to $14,999 | 187 | 3.6% |
| $15,000 to $24,999 | 638 | 12.3% |
| $25,000 to $34,999 | 576 | 11.1% |
| $35,000 to $49,999 | 965 | 18.6% |
| $50,000 to $74,999 | 856 | 16.5% |
| $75,000 to $99,999 | 628 | 12.1% |
| $100,000 to $149,999 | 773 | 14.9% |
| $150,000 to $199,999 | 83 | 1.6% |
| $200,000+ | 125 | 2.4% |
Family Income by Famaliy Size in Buchanan County
4-person families (745 | 14.4%) account for the highest median family income in Buchanan County with $72,669 per family, while 2-person families (2,866 | 55.2%) have the highest median income of $22,430 per family member.
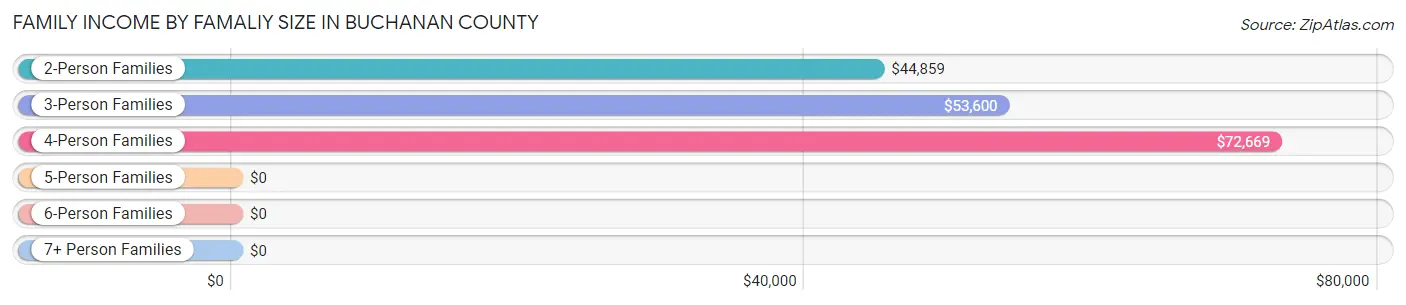
| Income Bracket | # Families | Median Income |
| 2-Person Families | 2,866 (55.2%) | $44,859 |
| 3-Person Families | 1,214 (23.4%) | $53,600 |
| 4-Person Families | 745 (14.4%) | $72,669 |
| 5-Person Families | 266 (5.1%) | $0 |
| 6-Person Families | 85 (1.6%) | $0 |
| 7+ Person Families | 13 (0.3%) | $0 |
| Total | 5,189 (100.0%) | $46,783 |
Family Income by Number of Earners in Buchanan County
The median family income in Buchanan County is $46,783, with families comprising 3+ earners (299) having the highest median family income of $121,344, while families with no earners (2,100) have the lowest median family income of $31,228, accounting for 5.8% and 40.5% of families, respectively.
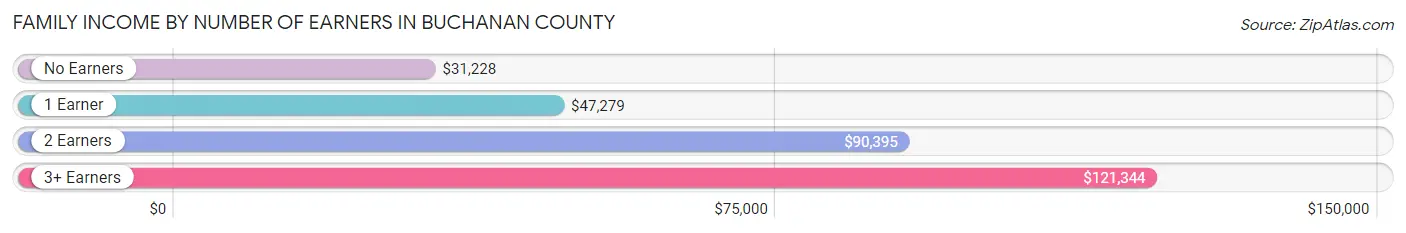
| Number of Earners | # Families | Median Income |
| No Earners | 2,100 (40.5%) | $31,228 |
| 1 Earner | 1,774 (34.2%) | $47,279 |
| 2 Earners | 1,016 (19.6%) | $90,395 |
| 3+ Earners | 299 (5.8%) | $121,344 |
| Total | 5,189 (100.0%) | $46,783 |
Household Income in Buchanan County
Household Income Brackets in Buchanan County
With 1,326 households falling in the category, the $35,000 to $49,999 income range is the most frequent in Buchanan County, accounting for 17.7% of all households. In contrast, only 82 households (1.1%) fall into the $150,000 to $199,999 income bracket, making it the least populous group.
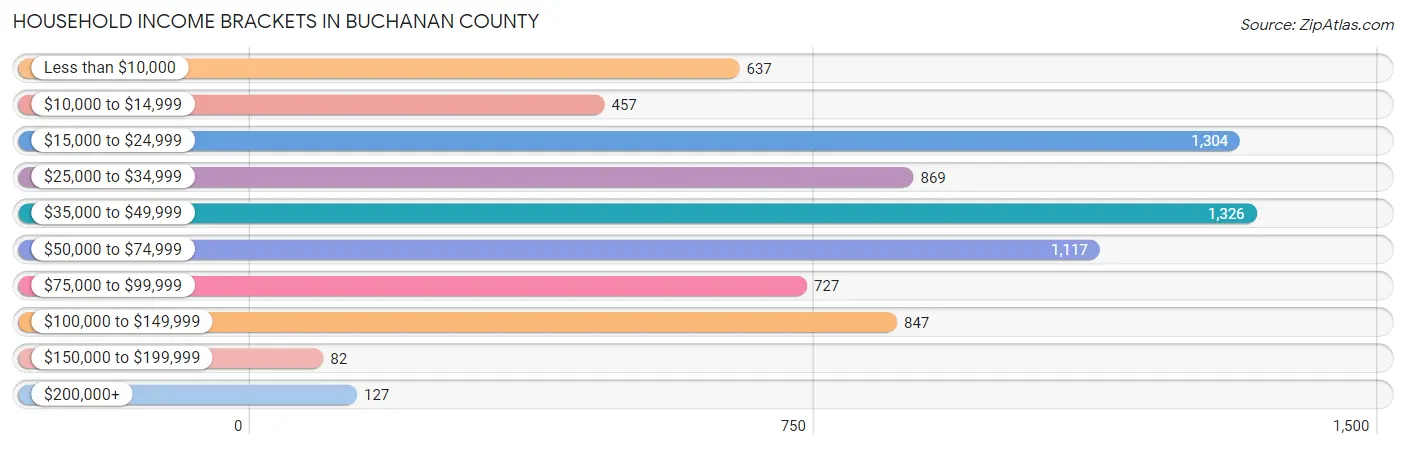
| Income Bracket | # Households | % Households |
| Less than $10,000 | 637 | 8.5% |
| $10,000 to $14,999 | 457 | 6.1% |
| $15,000 to $24,999 | 1,304 | 17.4% |
| $25,000 to $34,999 | 869 | 11.6% |
| $35,000 to $49,999 | 1,326 | 17.7% |
| $50,000 to $74,999 | 1,117 | 14.9% |
| $75,000 to $99,999 | 727 | 9.7% |
| $100,000 to $149,999 | 847 | 11.3% |
| $150,000 to $199,999 | 82 | 1.1% |
| $200,000+ | 127 | 1.7% |
Household Income by Householder Age in Buchanan County
The median household income in Buchanan County is $39,591, with the highest median household income of $44,317 found in the 45 to 64 years age bracket for the primary householder. A total of 2,911 households (38.8%) fall into this category. Meanwhile, the 15 to 24 years age bracket for the primary householder has the lowest median household income of $0, with 143 households (1.9%) in this group.
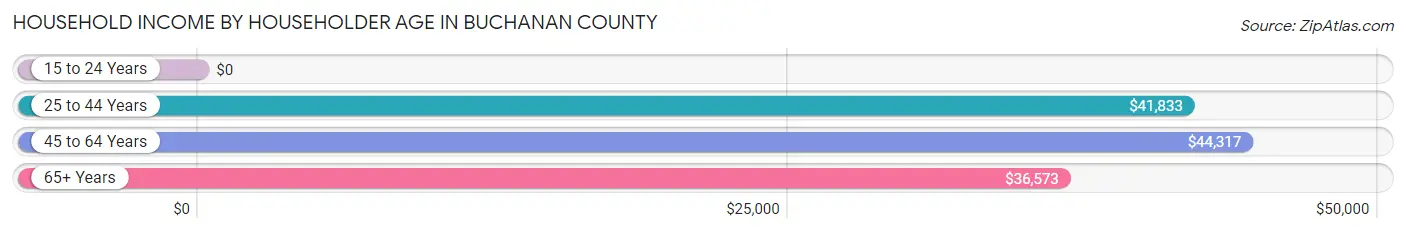
| Income Bracket | # Households | Median Income |
| 15 to 24 Years | 143 (1.9%) | $0 |
| 25 to 44 Years | 1,532 (20.4%) | $41,833 |
| 45 to 64 Years | 2,911 (38.8%) | $44,317 |
| 65+ Years | 2,908 (38.8%) | $36,573 |
| Total | 7,494 (100.0%) | $39,591 |
Poverty in Buchanan County
Income Below Poverty by Sex and Age in Buchanan County
With 26.2% poverty level for males and 24.3% for females among the residents of Buchanan County, 5 year old males and 6 to 11 year old females are the most vulnerable to poverty, with 54 males (90.0%) and 278 females (56.0%) in their respective age groups living below the poverty level.
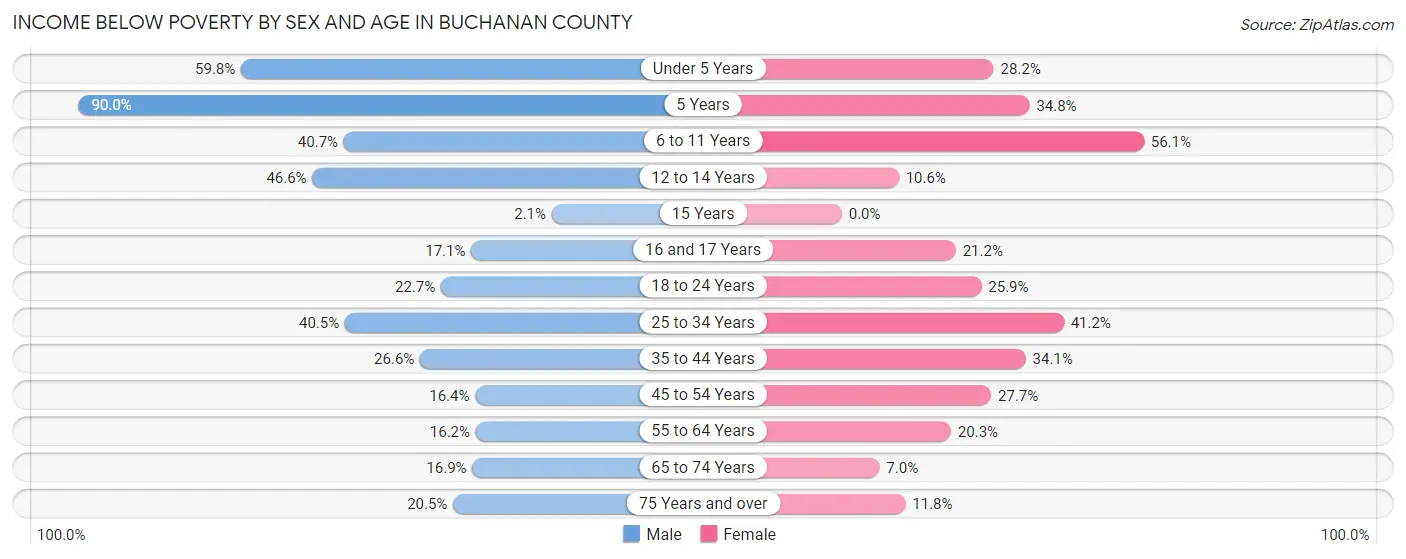
| Age Bracket | Male | Female |
| Under 5 Years | 256 (59.8%) | 115 (28.2%) |
| 5 Years | 54 (90.0%) | 31 (34.8%) |
| 6 to 11 Years | 233 (40.7%) | 278 (56.0%) |
| 12 to 14 Years | 163 (46.6%) | 34 (10.6%) |
| 15 Years | 1 (2.1%) | 0 (0.0%) |
| 16 and 17 Years | 40 (17.1%) | 55 (21.1%) |
| 18 to 24 Years | 158 (22.7%) | 159 (25.9%) |
| 25 to 34 Years | 502 (40.5%) | 388 (41.2%) |
| 35 to 44 Years | 290 (26.6%) | 355 (34.1%) |
| 45 to 54 Years | 235 (16.4%) | 369 (27.7%) |
| 55 to 64 Years | 258 (16.2%) | 309 (20.3%) |
| 65 to 74 Years | 211 (16.9%) | 97 (7.0%) |
| 75 Years and over | 164 (20.4%) | 123 (11.8%) |
| Total | 2,565 (26.2%) | 2,313 (24.3%) |
Income Above Poverty by Sex and Age in Buchanan County
According to the poverty statistics in Buchanan County, males aged 15 years and females aged 15 years are the age groups that are most secure financially, with 97.9% of males and 100.0% of females in these age groups living above the poverty line.
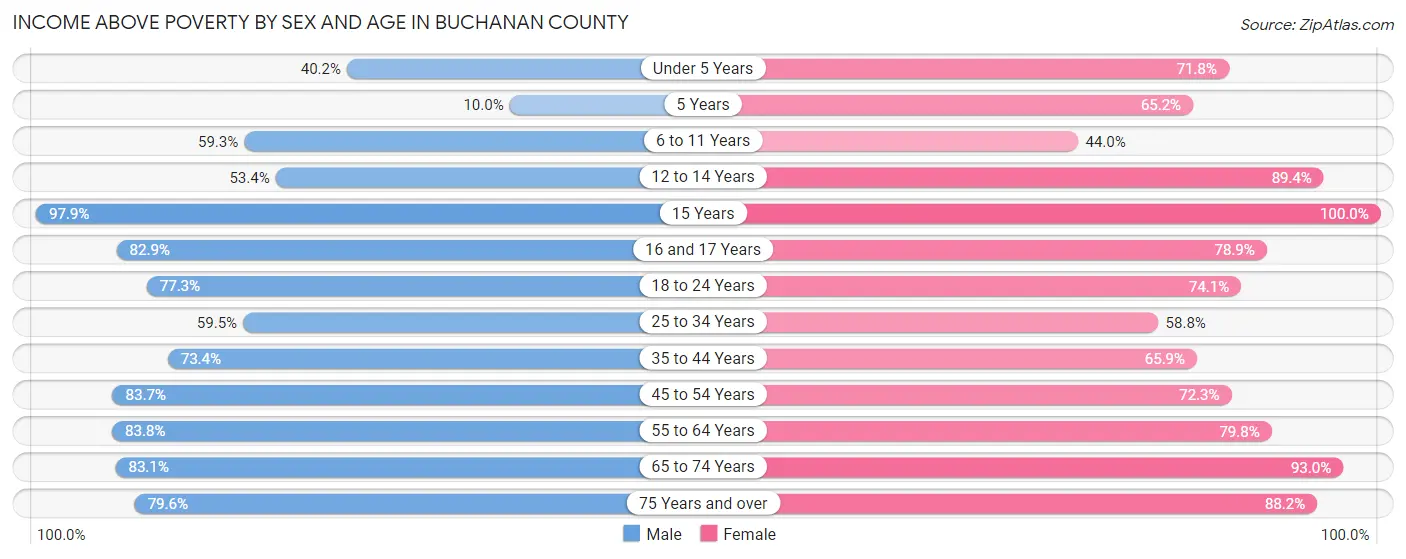
| Age Bracket | Male | Female |
| Under 5 Years | 172 (40.2%) | 293 (71.8%) |
| 5 Years | 6 (10.0%) | 58 (65.2%) |
| 6 to 11 Years | 339 (59.3%) | 218 (44.0%) |
| 12 to 14 Years | 187 (53.4%) | 288 (89.4%) |
| 15 Years | 46 (97.9%) | 41 (100.0%) |
| 16 and 17 Years | 194 (82.9%) | 205 (78.8%) |
| 18 to 24 Years | 538 (77.3%) | 455 (74.1%) |
| 25 to 34 Years | 737 (59.5%) | 554 (58.8%) |
| 35 to 44 Years | 801 (73.4%) | 686 (65.9%) |
| 45 to 54 Years | 1,202 (83.7%) | 963 (72.3%) |
| 55 to 64 Years | 1,331 (83.8%) | 1,217 (79.7%) |
| 65 to 74 Years | 1,039 (83.1%) | 1,293 (93.0%) |
| 75 Years and over | 638 (79.5%) | 919 (88.2%) |
| Total | 7,230 (73.8%) | 7,190 (75.7%) |
Income Below Poverty Among Married-Couple Families in Buchanan County
The poverty statistics for married-couple families in Buchanan County show that 14.1% or 546 of the total 3,865 families live below the poverty line. Families with 3 or 4 children have the highest poverty rate of 49.4%, comprising of 82 families. On the other hand, families with no children have the lowest poverty rate of 8.4%, which includes 219 families.
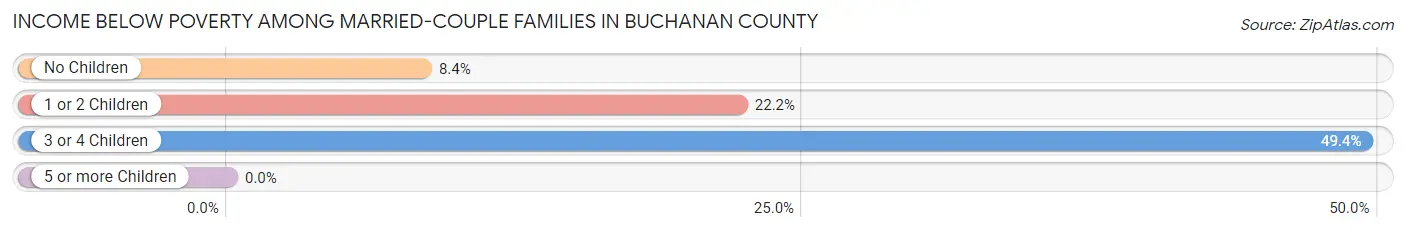
| Children | Above Poverty | Below Poverty |
| No Children | 2,376 (91.6%) | 219 (8.4%) |
| 1 or 2 Children | 859 (77.8%) | 245 (22.2%) |
| 3 or 4 Children | 84 (50.6%) | 82 (49.4%) |
| 5 or more Children | 0 (0.0%) | 0 (0.0%) |
| Total | 3,319 (85.9%) | 546 (14.1%) |
Income Below Poverty Among Single-Parent Households in Buchanan County
According to the poverty data in Buchanan County, 39.9% or 93 single-father households and 32.1% or 350 single-mother households are living below the poverty line. Among single-father households, those with 1 or 2 children have the highest poverty rate, with 44 households (48.3%) experiencing poverty. Likewise, among single-mother households, those with 3 or 4 children have the highest poverty rate, with 25 households (100.0%) falling below the poverty line.
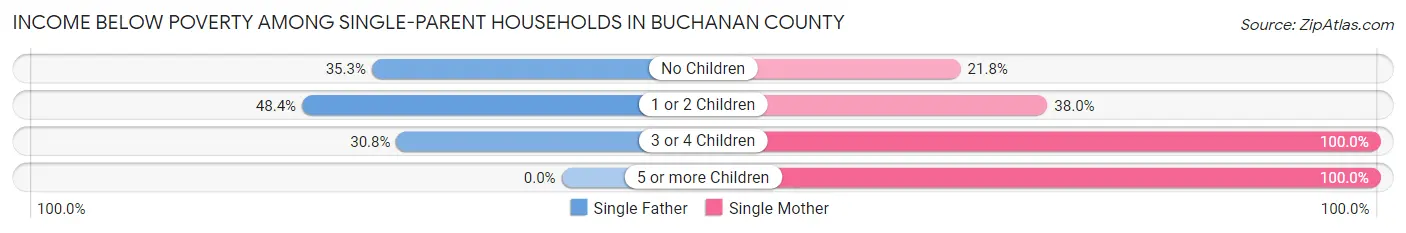
| Children | Single Father | Single Mother |
| No Children | 41 (35.3%) | 124 (21.8%) |
| 1 or 2 Children | 44 (48.3%) | 181 (38.0%) |
| 3 or 4 Children | 8 (30.8%) | 25 (100.0%) |
| 5 or more Children | 0 (0.0%) | 20 (100.0%) |
| Total | 93 (39.9%) | 350 (32.1%) |
Income Below Poverty Among Married-Couple vs Single-Parent Households in Buchanan County
The poverty data for Buchanan County shows that 546 of the married-couple family households (14.1%) and 443 of the single-parent households (33.5%) are living below the poverty level. Within the married-couple family households, those with 3 or 4 children have the highest poverty rate, with 82 households (49.4%) falling below the poverty line. Among the single-parent households, those with 5 or more children have the highest poverty rate, with 20 household (100.0%) living below poverty.
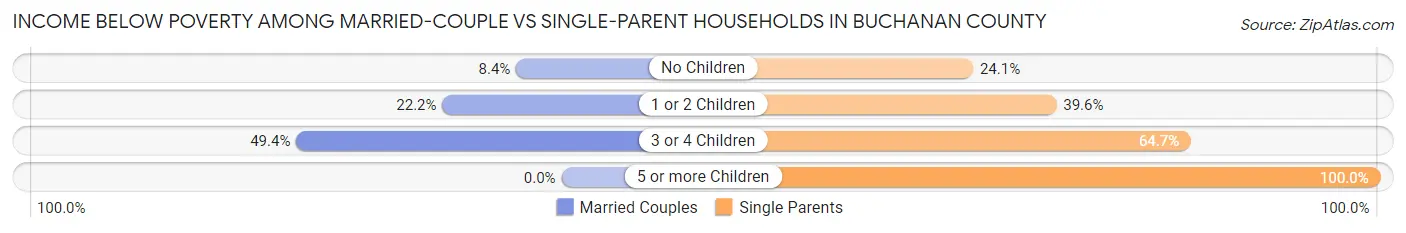
| Children | Married-Couple Families | Single-Parent Households |
| No Children | 219 (8.4%) | 165 (24.1%) |
| 1 or 2 Children | 245 (22.2%) | 225 (39.6%) |
| 3 or 4 Children | 82 (49.4%) | 33 (64.7%) |
| 5 or more Children | 0 (0.0%) | 20 (100.0%) |
| Total | 546 (14.1%) | 443 (33.5%) |
Race in Buchanan County
The most populous races in Buchanan County are White / Caucasian (19,571 | 96.7%), Black / African American (373 | 1.8%), and Two or more Races (238 | 1.2%).
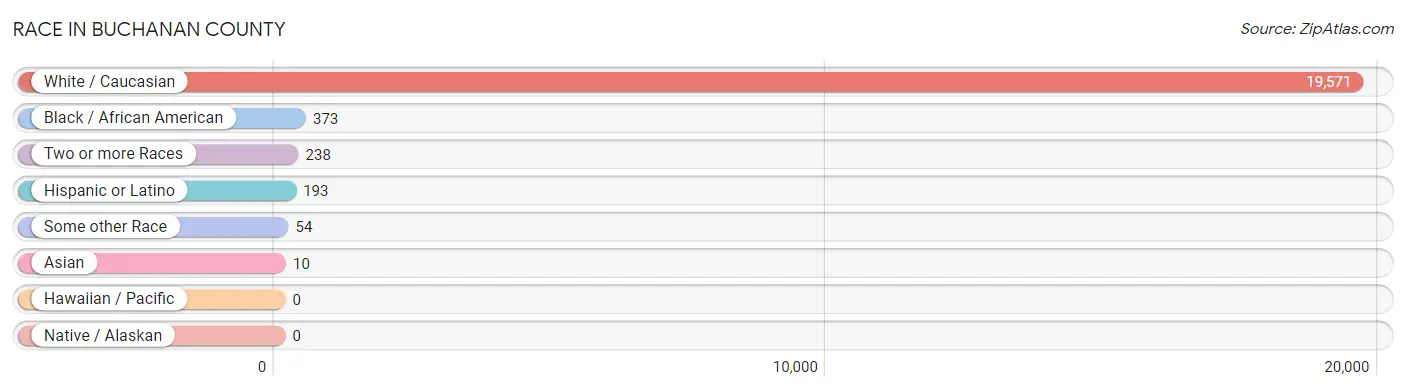
| Race | # Population | % Population |
| Asian | 10 | 0.1% |
| Black / African American | 373 | 1.8% |
| Hawaiian / Pacific | 0 | 0.0% |
| Hispanic or Latino | 193 | 0.9% |
| Native / Alaskan | 0 | 0.0% |
| White / Caucasian | 19,571 | 96.7% |
| Two or more Races | 238 | 1.2% |
| Some other Race | 54 | 0.3% |
| Total | 20,246 | 100.0% |
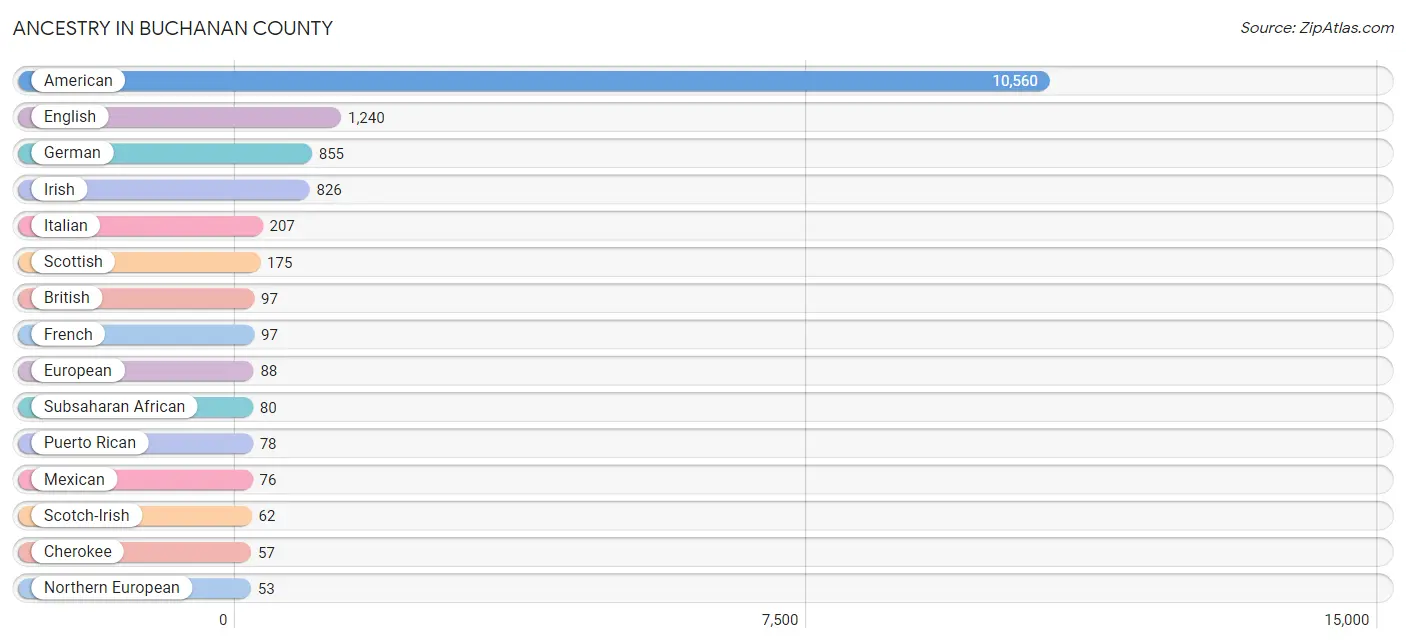
Ancestry in Buchanan County
The most populous ancestries reported in Buchanan County are American (10,560 | 52.2%), English (1,240 | 6.1%), German (855 | 4.2%), Irish (826 | 4.1%), and Italian (207 | 1.0%), together accounting for 67.6% of all Buchanan County residents.
| Ancestry | # Population | % Population |
| African | 17 | 0.1% |
| American | 10,560 | 52.2% |
| Arab | 32 | 0.2% |
| Bhutanese | 18 | 0.1% |
| Blackfeet | 3 | 0.0% |
| British | 97 | 0.5% |
| Burmese | 6 | 0.0% |
| Central American | 10 | 0.1% |
| Cherokee | 57 | 0.3% |
| Cuban | 7 | 0.0% |
| Czech | 4 | 0.0% |
| Dominican | 16 | 0.1% |
| Dutch | 49 | 0.2% |
| English | 1,240 | 6.1% |
| Ethiopian | 23 | 0.1% |
| European | 88 | 0.4% |
| French | 97 | 0.5% |
| French Canadian | 25 | 0.1% |
| German | 855 | 4.2% |
| Ghanaian | 10 | 0.1% |
| Haitian | 1 | 0.0% |
| Hungarian | 6 | 0.0% |
| Iranian | 1 | 0.0% |
| Irish | 826 | 4.1% |
| Italian | 207 | 1.0% |
| Korean | 40 | 0.2% |
| Lebanese | 32 | 0.2% |
| Mexican | 76 | 0.4% |
| Nigerian | 13 | 0.1% |
| Northern European | 53 | 0.3% |
| Norwegian | 35 | 0.2% |
| Portuguese | 3 | 0.0% |
| Puerto Rican | 78 | 0.4% |
| Salvadoran | 10 | 0.1% |
| Scotch-Irish | 62 | 0.3% |
| Scottish | 175 | 0.9% |
| South American | 3 | 0.0% |
| Subsaharan African | 80 | 0.4% |
| Ugandan | 4 | 0.0% |
| Venezuelan | 3 | 0.0% |
| Welsh | 24 | 0.1% | View All 41 Rows |
Immigrants in Buchanan County
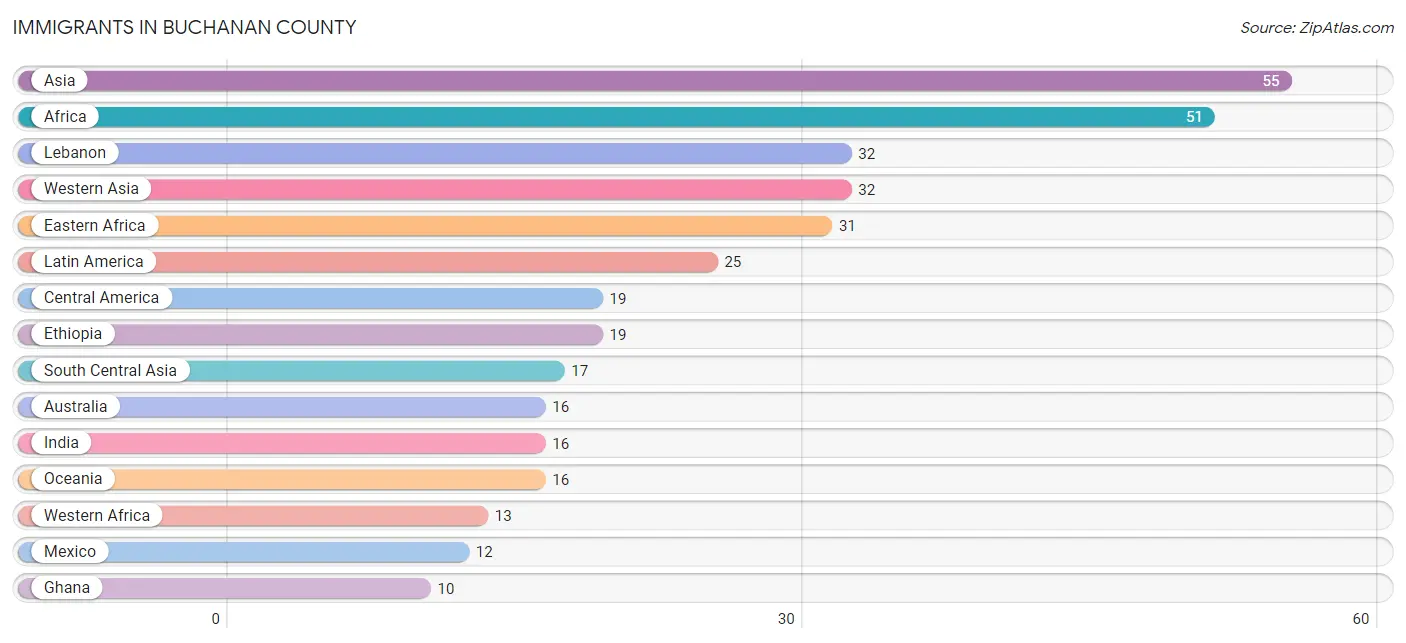
The most numerous immigrant groups reported in Buchanan County came from Asia (55 | 0.3%), Africa (51 | 0.3%), Lebanon (32 | 0.2%), Western Asia (32 | 0.2%), and Eastern Africa (31 | 0.2%), together accounting for 1.0% of all Buchanan County residents.
| Immigration Origin | # Population | % Population |
| Afghanistan | 1 | 0.0% |
| Africa | 51 | 0.3% |
| Asia | 55 | 0.3% |
| Australia | 16 | 0.1% |
| Caribbean | 3 | 0.0% |
| Central America | 19 | 0.1% |
| Congo | 5 | 0.0% |
| Cuba | 3 | 0.0% |
| Eastern Africa | 31 | 0.2% |
| Eastern Asia | 6 | 0.0% |
| Egypt | 2 | 0.0% |
| El Salvador | 7 | 0.0% |
| Ethiopia | 19 | 0.1% |
| Europe | 7 | 0.0% |
| France | 7 | 0.0% |
| Ghana | 10 | 0.1% |
| India | 16 | 0.1% |
| Korea | 6 | 0.0% |
| Latin America | 25 | 0.1% |
| Lebanon | 32 | 0.2% |
| Mexico | 12 | 0.1% |
| Middle Africa | 5 | 0.0% |
| Northern Africa | 2 | 0.0% |
| Oceania | 16 | 0.1% |
| South America | 3 | 0.0% |
| South Central Asia | 17 | 0.1% |
| Venezuela | 3 | 0.0% |
| Western Africa | 13 | 0.1% |
| Western Asia | 32 | 0.2% |
| Western Europe | 7 | 0.0% | View All 30 Rows |
Sex and Age in Buchanan County
Sex and Age in Buchanan County
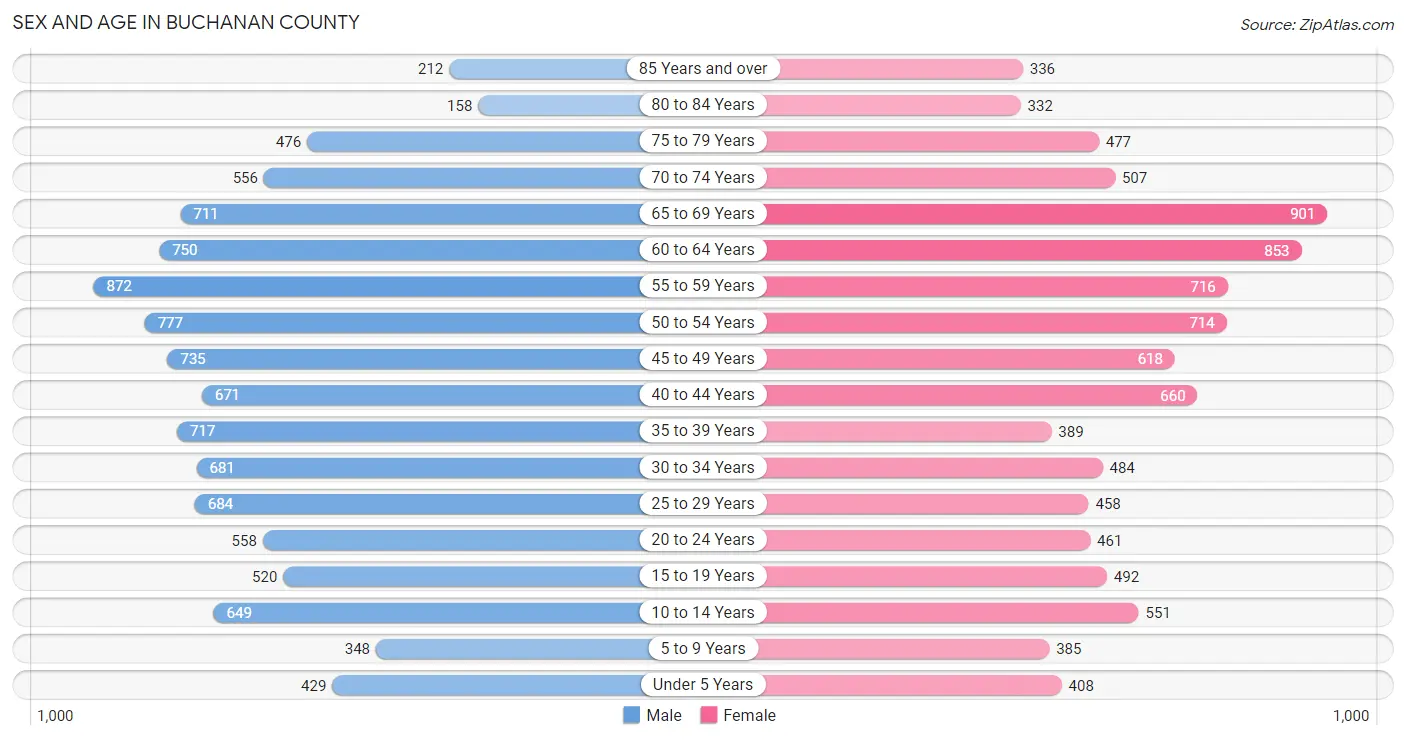
The most populous age groups in Buchanan County are 55 to 59 Years (872 | 8.3%) for men and 65 to 69 Years (901 | 9.2%) for women.
| Age Bracket | Male | Female |
| Under 5 Years | 429 (4.1%) | 408 (4.2%) |
| 5 to 9 Years | 348 (3.3%) | 385 (4.0%) |
| 10 to 14 Years | 649 (6.2%) | 551 (5.7%) |
| 15 to 19 Years | 520 (5.0%) | 492 (5.1%) |
| 20 to 24 Years | 558 (5.3%) | 461 (4.7%) |
| 25 to 29 Years | 684 (6.5%) | 458 (4.7%) |
| 30 to 34 Years | 681 (6.5%) | 484 (5.0%) |
| 35 to 39 Years | 717 (6.8%) | 389 (4.0%) |
| 40 to 44 Years | 671 (6.4%) | 660 (6.8%) |
| 45 to 49 Years | 735 (7.0%) | 618 (6.3%) |
| 50 to 54 Years | 777 (7.4%) | 714 (7.3%) |
| 55 to 59 Years | 872 (8.3%) | 716 (7.3%) |
| 60 to 64 Years | 750 (7.1%) | 853 (8.8%) |
| 65 to 69 Years | 711 (6.8%) | 901 (9.2%) |
| 70 to 74 Years | 556 (5.3%) | 507 (5.2%) |
| 75 to 79 Years | 476 (4.5%) | 477 (4.9%) |
| 80 to 84 Years | 158 (1.5%) | 332 (3.4%) |
| 85 Years and over | 212 (2.0%) | 336 (3.5%) |
| Total | 10,504 (100.0%) | 9,742 (100.0%) |
Families and Households in Buchanan County
Median Family Size in Buchanan County
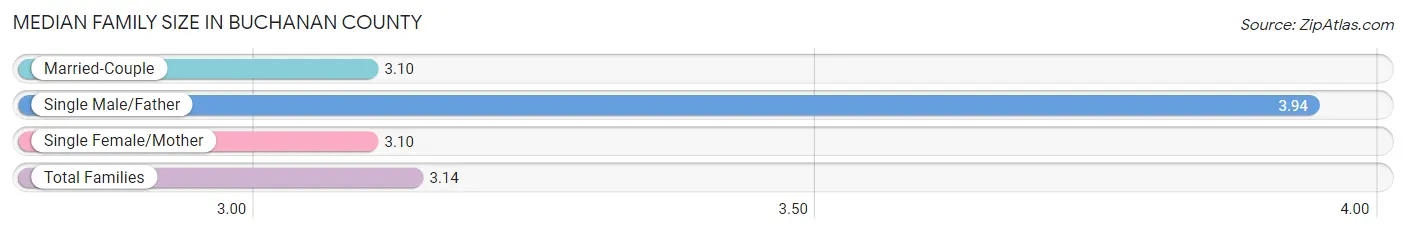
The median family size in Buchanan County is 3.14 persons per family, with single male/father families (233 | 4.5%) accounting for the largest median family size of 3.94 persons per family. On the other hand, married-couple families (3,865 | 74.5%) represent the smallest median family size with 3.10 persons per family.
| Family Type | # Families | Family Size |
| Married-Couple | 3,865 (74.5%) | 3.10 |
| Single Male/Father | 233 (4.5%) | 3.94 |
| Single Female/Mother | 1,091 (21.0%) | 3.10 |
| Total Families | 5,189 (100.0%) | 3.14 |
Median Household Size in Buchanan County
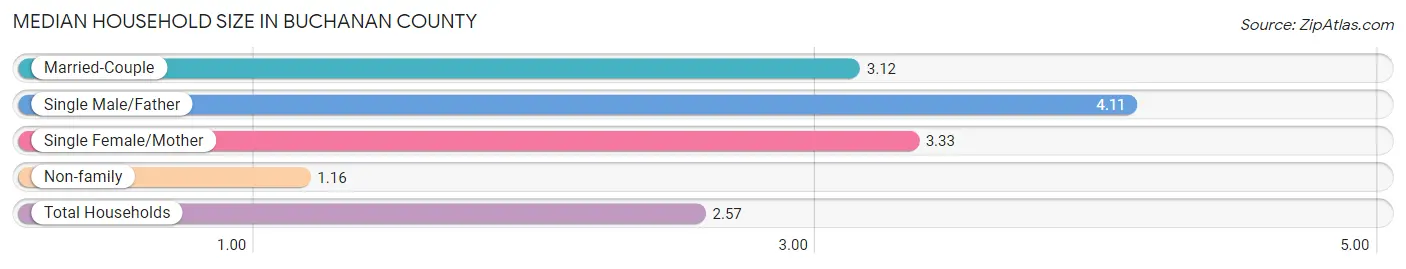
The median household size in Buchanan County is 2.57 persons per household, with single male/father households (233 | 3.1%) accounting for the largest median household size of 4.11 persons per household. non-family households (2,305 | 30.8%) represent the smallest median household size with 1.16 persons per household.
| Household Type | # Households | Household Size |
| Married-Couple | 3,865 (51.6%) | 3.12 |
| Single Male/Father | 233 (3.1%) | 4.11 |
| Single Female/Mother | 1,091 (14.6%) | 3.33 |
| Non-family | 2,305 (30.8%) | 1.16 |
| Total Households | 7,494 (100.0%) | 2.57 |
Household Size by Marriage Status in Buchanan County
Out of a total of 7,494 households in Buchanan County, 5,189 (69.2%) are family households, while 2,305 (30.8%) are nonfamily households. The most numerous type of family households are 2-person households, comprising 2,747, and the most common type of nonfamily households are 1-person households, comprising 1,963.
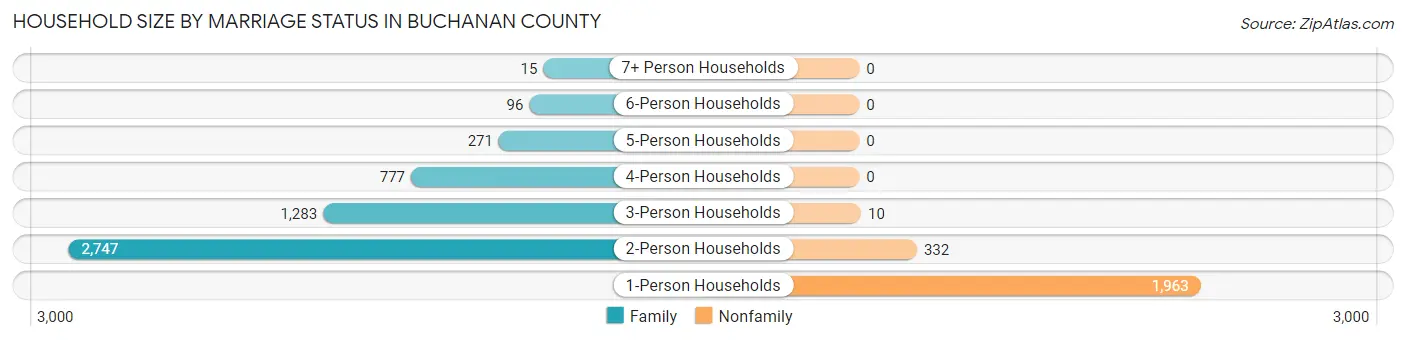
| Household Size | Family Households | Nonfamily Households |
| 1-Person Households | - | 1,963 (26.2%) |
| 2-Person Households | 2,747 (36.7%) | 332 (4.4%) |
| 3-Person Households | 1,283 (17.1%) | 10 (0.1%) |
| 4-Person Households | 777 (10.4%) | 0 (0.0%) |
| 5-Person Households | 271 (3.6%) | 0 (0.0%) |
| 6-Person Households | 96 (1.3%) | 0 (0.0%) |
| 7+ Person Households | 15 (0.2%) | 0 (0.0%) |
| Total | 5,189 (69.2%) | 2,305 (30.8%) |
Female Fertility in Buchanan County
Fertility by Age in Buchanan County
Average fertility rate in Buchanan County is 68.0 births per 1,000 women. Women in the age bracket of 20 to 34 years have the highest fertility rate with 119.0 births per 1,000 women. Women in the age bracket of 20 to 34 years acount for 67.3% of all women with births.
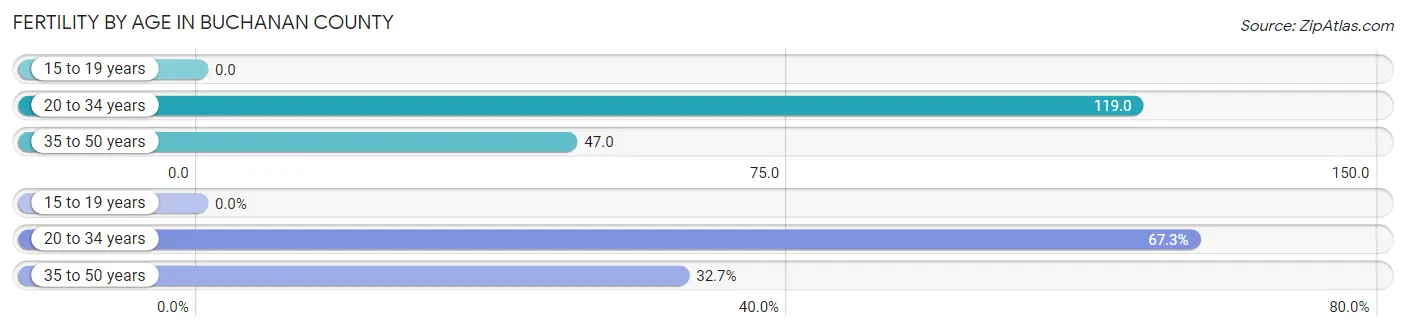
| Age Bracket | Women with Births | Births / 1,000 Women |
| 15 to 19 years | 0 (0.0%) | 0.0 |
| 20 to 34 years | 167 (67.3%) | 119.0 |
| 35 to 50 years | 81 (32.7%) | 47.0 |
| Total | 248 (100.0%) | 68.0 |
Fertility by Age by Marriage Status in Buchanan County
87.1% of women with births (248) in Buchanan County are married. The highest percentage of unmarried women with births falls into 20 to 34 years age bracket with 13.2% of them unmarried at the time of birth, while the lowest percentage of unmarried women with births belong to 35 to 50 years age bracket with 12.4% of them unmarried.
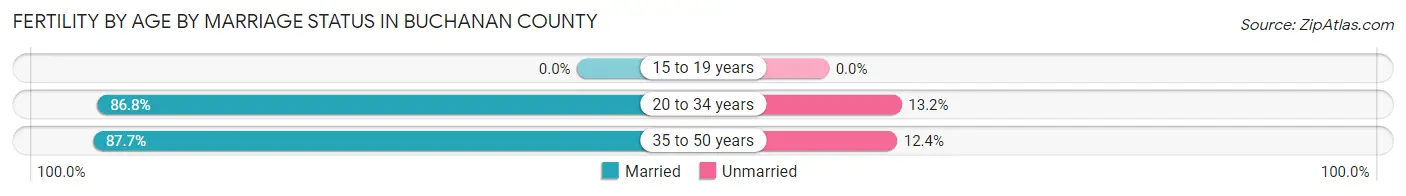
| Age Bracket | Married | Unmarried |
| 15 to 19 years | 0 (0.0%) | 0 (0.0%) |
| 20 to 34 years | 145 (86.8%) | 22 (13.2%) |
| 35 to 50 years | 71 (87.6%) | 10 (12.3%) |
| Total | 216 (87.1%) | 32 (12.9%) |
Fertility by Education in Buchanan County
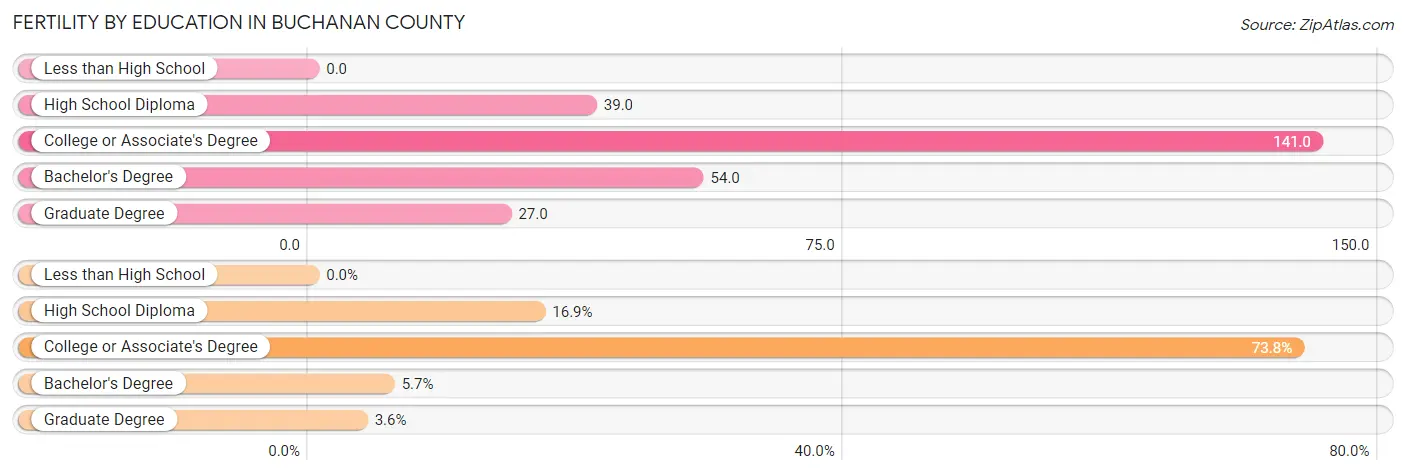
| Educational Attainment | Women with Births | Births / 1,000 Women |
| Less than High School | 0 (0.0%) | 0.0 |
| High School Diploma | 42 (16.9%) | 39.0 |
| College or Associate's Degree | 183 (73.8%) | 141.0 |
| Bachelor's Degree | 14 (5.7%) | 54.0 |
| Graduate Degree | 9 (3.6%) | 27.0 |
| Total | 248 (100.0%) | 68.0 |
Fertility by Education by Marriage Status in Buchanan County
12.9% of women with births in Buchanan County are unmarried. Women with the educational attainment of bachelor's degree are most likely to be married with 100.0% of them married at childbirth, while women with the educational attainment of college or associate's degree are least likely to be married with 15.9% of them unmarried at childbirth.
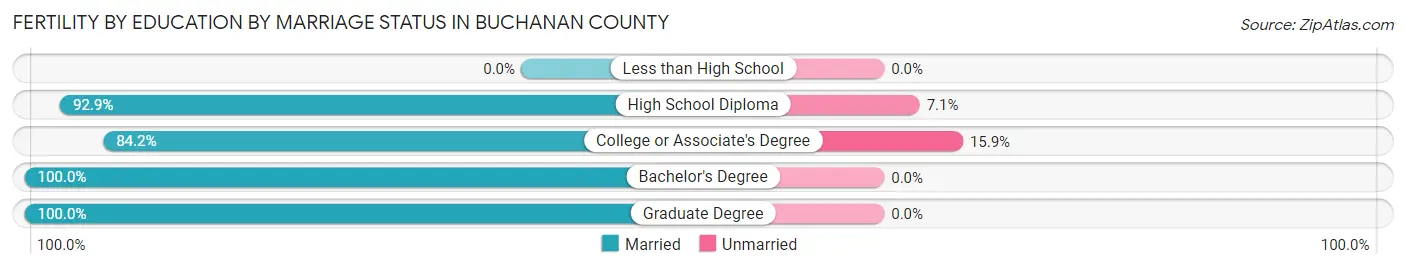
| Educational Attainment | Married | Unmarried |
| Less than High School | 0 (0.0%) | 0 (0.0%) |
| High School Diploma | 39 (92.9%) | 3 (7.1%) |
| College or Associate's Degree | 154 (84.2%) | 29 (15.9%) |
| Bachelor's Degree | 14 (100.0%) | 0 (0.0%) |
| Graduate Degree | 9 (100.0%) | 0 (0.0%) |
| Total | 216 (87.1%) | 32 (12.9%) |
Employment Characteristics in Buchanan County
Employment by Class of Employer in Buchanan County
Among the 5,805 employed individuals in Buchanan County, private company employees (3,759 | 64.7%), state government employees (812 | 14.0%), and local government employees (662 | 11.4%) make up the most common classes of employment.
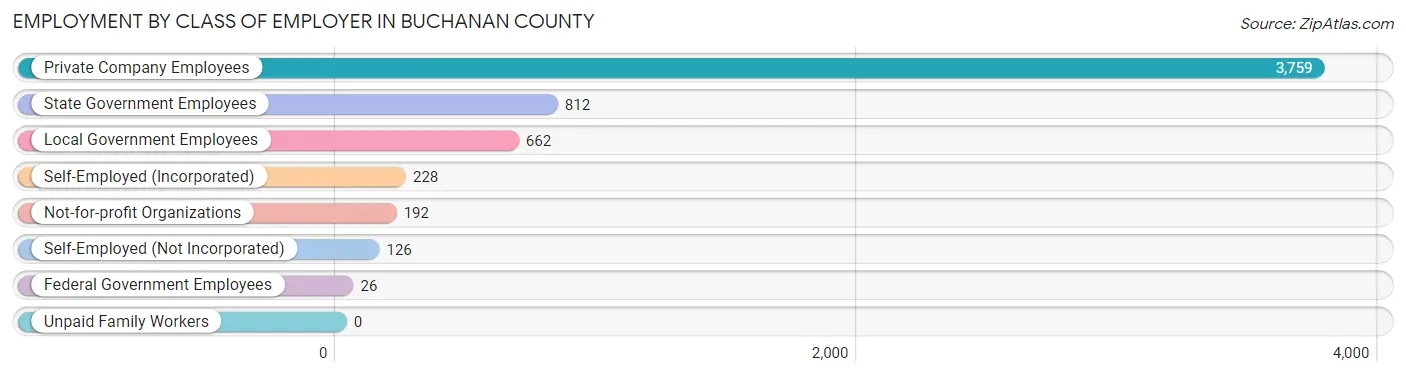
| Employer Class | # Employees | % Employees |
| Private Company Employees | 3,759 | 64.7% |
| Self-Employed (Incorporated) | 228 | 3.9% |
| Self-Employed (Not Incorporated) | 126 | 2.2% |
| Not-for-profit Organizations | 192 | 3.3% |
| Local Government Employees | 662 | 11.4% |
| State Government Employees | 812 | 14.0% |
| Federal Government Employees | 26 | 0.4% |
| Unpaid Family Workers | 0 | 0.0% |
| Total | 5,805 | 100.0% |
Employment Status by Age in Buchanan County
According to the labor force statistics for Buchanan County, out of the total population over 16 years of age (17,373), 36.7% or 6,376 individuals are in the labor force, with 6.0% or 383 of them unemployed. The age group with the highest labor force participation rate is 30 to 34 years, with 58.6% or 683 individuals in the labor force. Within the labor force, the 25 to 29 years age range has the highest percentage of unemployed individuals, with 23.2% or 148 of them being unemployed.
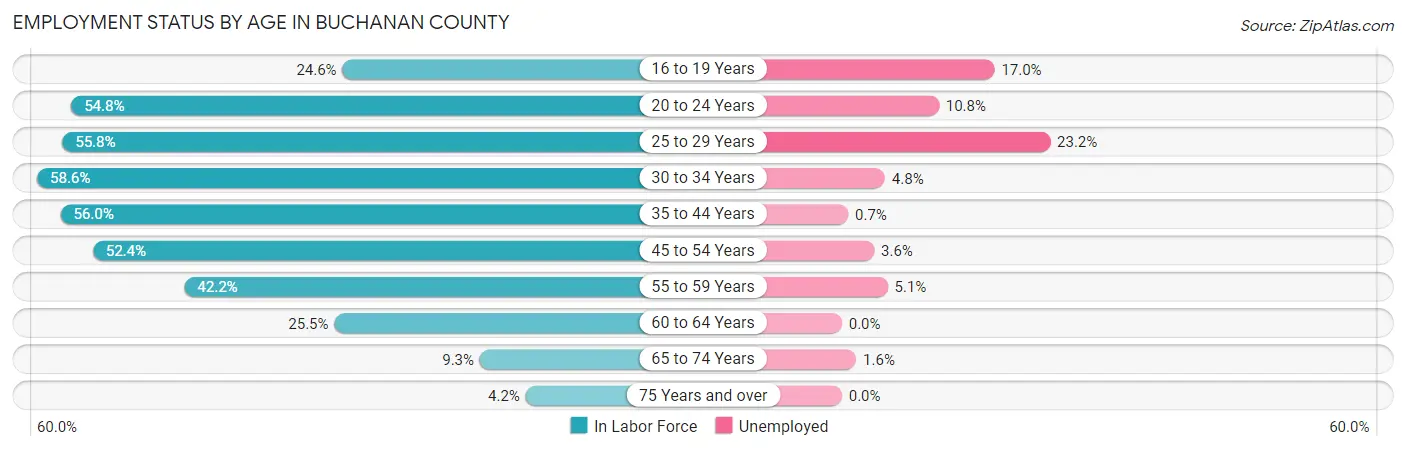
| Age Bracket | In Labor Force | Unemployed |
| 16 to 19 Years | 224 (24.6%) | 38 (17.0%) |
| 20 to 24 Years | 558 (54.8%) | 60 (10.8%) |
| 25 to 29 Years | 637 (55.8%) | 148 (23.2%) |
| 30 to 34 Years | 683 (58.6%) | 33 (4.8%) |
| 35 to 44 Years | 1,365 (56.0%) | 10 (0.7%) |
| 45 to 54 Years | 1,490 (52.4%) | 54 (3.6%) |
| 55 to 59 Years | 670 (42.2%) | 34 (5.1%) |
| 60 to 64 Years | 409 (25.5%) | 0 (0.0%) |
| 65 to 74 Years | 249 (9.3%) | 4 (1.6%) |
| 75 Years and over | 84 (4.2%) | 0 (0.0%) |
| Total | 6,376 (36.7%) | 383 (6.0%) |
Employment Status by Educational Attainment in Buchanan County
According to labor force statistics for Buchanan County, 48.8% of individuals (5,260) out of the total population between 25 and 64 years of age (10,779) are in the labor force, with 5.3% or 279 of them being unemployed. The group with the highest labor force participation rate are those with the educational attainment of bachelor's degree or higher, with 71.6% or 904 individuals in the labor force. Within the labor force, individuals with high school diploma education have the highest percentage of unemployment, with 9.6% or 178 of them being unemployed.
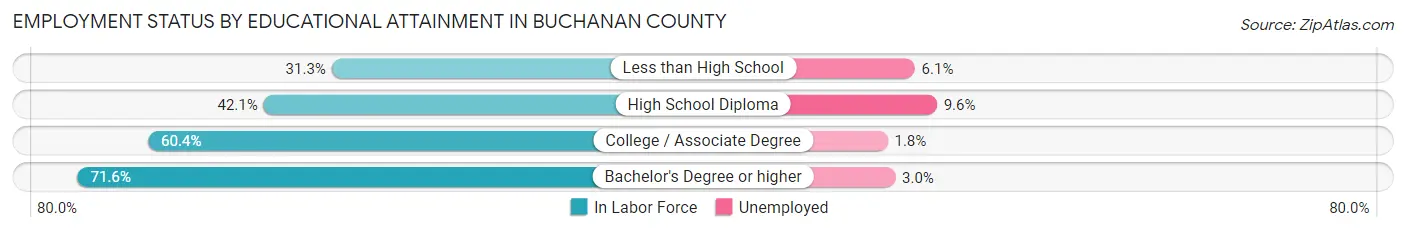
| Educational Attainment | In Labor Force | Unemployed |
| Less than High School | 636 (31.3%) | 124 (6.1%) |
| High School Diploma | 1,856 (42.1%) | 423 (9.6%) |
| College / Associate Degree | 1,859 (60.4%) | 55 (1.8%) |
| Bachelor's Degree or higher | 904 (71.6%) | 38 (3.0%) |
| Total | 5,260 (48.8%) | 571 (5.3%) |
Employment Occupations by Sex in Buchanan County
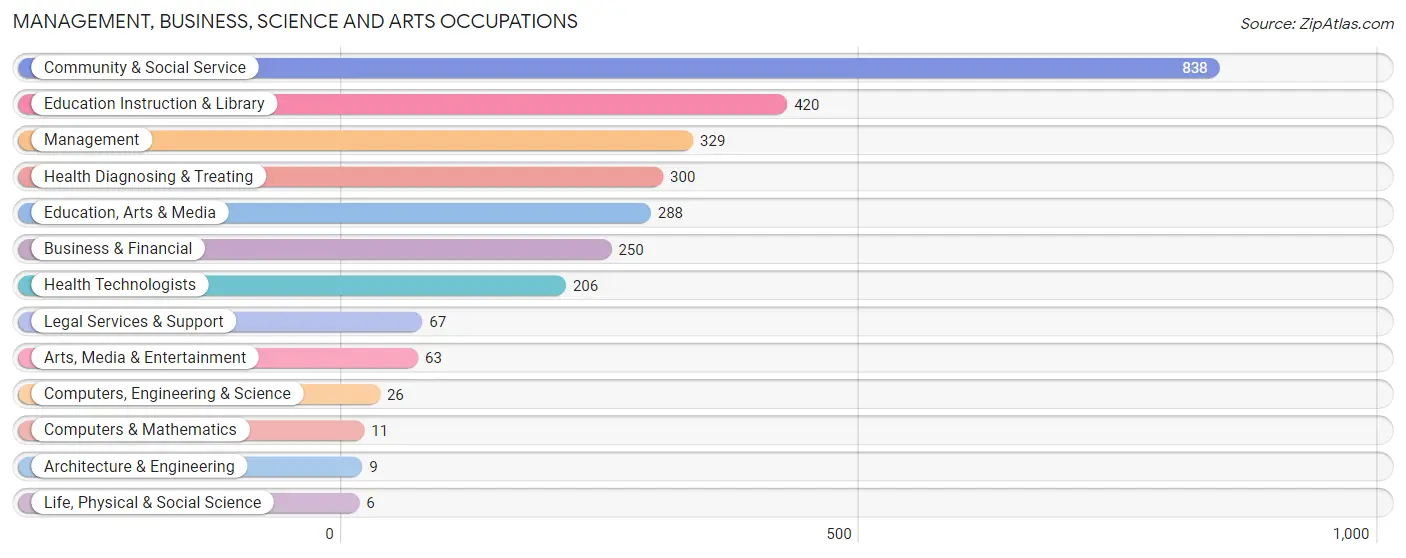
Management, Business, Science and Arts Occupations
The most common Management, Business, Science and Arts occupations in Buchanan County are Community & Social Service (838 | 14.0%), Education Instruction & Library (420 | 7.0%), Management (329 | 5.5%), Health Diagnosing & Treating (300 | 5.0%), and Education, Arts & Media (288 | 4.8%).
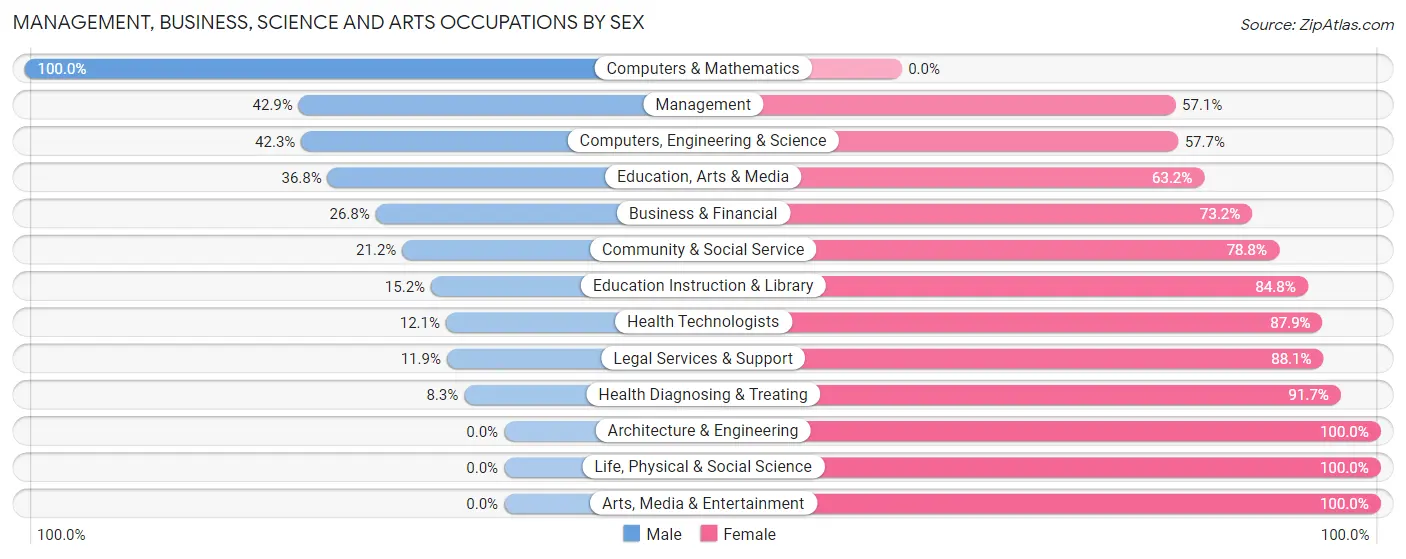
Management, Business, Science and Arts Occupations by Sex
Within the Management, Business, Science and Arts occupations in Buchanan County, the most male-oriented occupations are Computers & Mathematics (100.0%), Management (42.9%), and Computers, Engineering & Science (42.3%), while the most female-oriented occupations are Architecture & Engineering (100.0%), Life, Physical & Social Science (100.0%), and Arts, Media & Entertainment (100.0%).
| Occupation | Male | Female |
| Management | 141 (42.9%) | 188 (57.1%) |
| Business & Financial | 67 (26.8%) | 183 (73.2%) |
| Computers, Engineering & Science | 11 (42.3%) | 15 (57.7%) |
| Computers & Mathematics | 11 (100.0%) | 0 (0.0%) |
| Architecture & Engineering | 0 (0.0%) | 9 (100.0%) |
| Life, Physical & Social Science | 0 (0.0%) | 6 (100.0%) |
| Community & Social Service | 178 (21.2%) | 660 (78.8%) |
| Education, Arts & Media | 106 (36.8%) | 182 (63.2%) |
| Legal Services & Support | 8 (11.9%) | 59 (88.1%) |
| Education Instruction & Library | 64 (15.2%) | 356 (84.8%) |
| Arts, Media & Entertainment | 0 (0.0%) | 63 (100.0%) |
| Health Diagnosing & Treating | 25 (8.3%) | 275 (91.7%) |
| Health Technologists | 25 (12.1%) | 181 (87.9%) |
| Total (Category) | 422 (24.2%) | 1,321 (75.8%) |
| Total (Overall) | 3,304 (55.2%) | 2,686 (44.8%) |
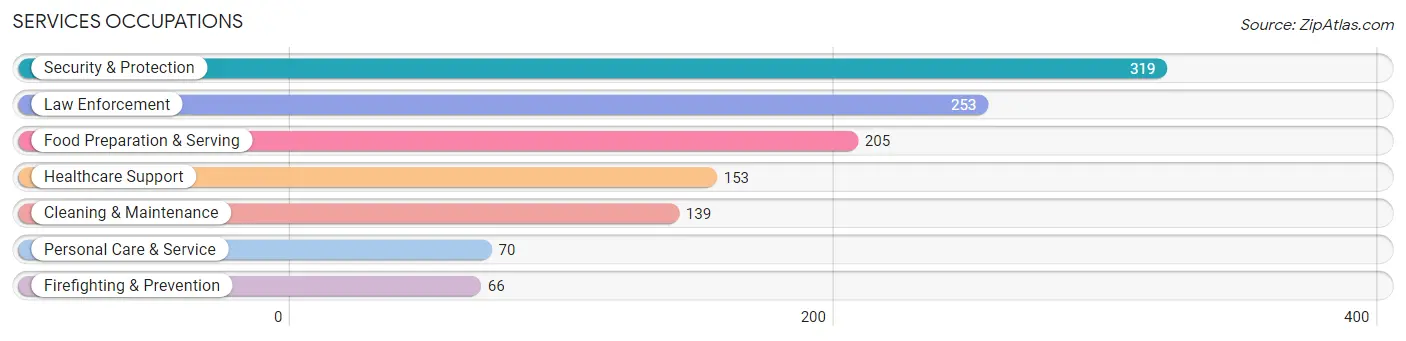
Services Occupations
The most common Services occupations in Buchanan County are Security & Protection (319 | 5.3%), Law Enforcement (253 | 4.2%), Food Preparation & Serving (205 | 3.4%), Healthcare Support (153 | 2.5%), and Cleaning & Maintenance (139 | 2.3%).
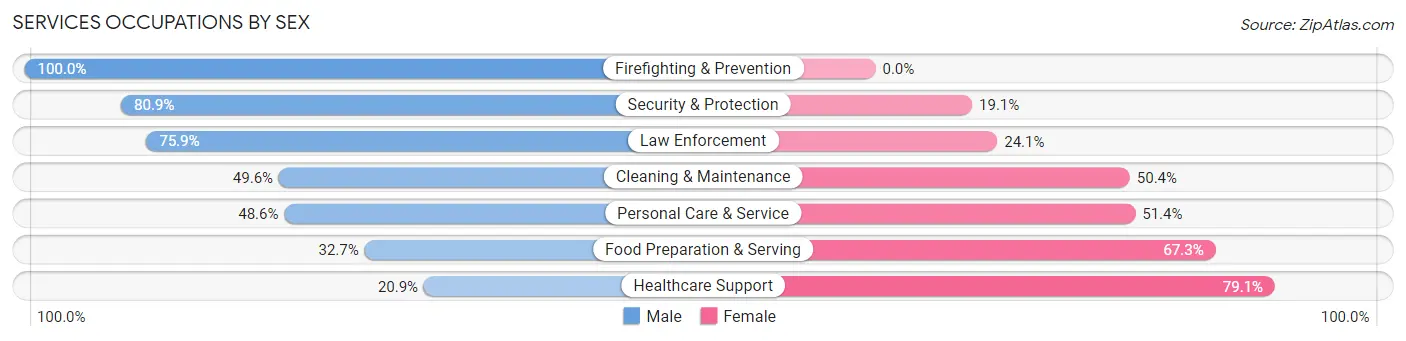
Services Occupations by Sex
Within the Services occupations in Buchanan County, the most male-oriented occupations are Firefighting & Prevention (100.0%), Security & Protection (80.9%), and Law Enforcement (75.9%), while the most female-oriented occupations are Healthcare Support (79.1%), Food Preparation & Serving (67.3%), and Personal Care & Service (51.4%).
| Occupation | Male | Female |
| Healthcare Support | 32 (20.9%) | 121 (79.1%) |
| Security & Protection | 258 (80.9%) | 61 (19.1%) |
| Firefighting & Prevention | 66 (100.0%) | 0 (0.0%) |
| Law Enforcement | 192 (75.9%) | 61 (24.1%) |
| Food Preparation & Serving | 67 (32.7%) | 138 (67.3%) |
| Cleaning & Maintenance | 69 (49.6%) | 70 (50.4%) |
| Personal Care & Service | 34 (48.6%) | 36 (51.4%) |
| Total (Category) | 460 (51.9%) | 426 (48.1%) |
| Total (Overall) | 3,304 (55.2%) | 2,686 (44.8%) |
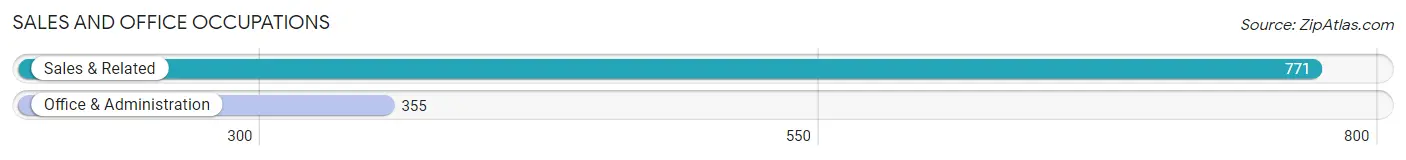
Sales and Office Occupations
The most common Sales and Office occupations in Buchanan County are Sales & Related (771 | 12.9%), and Office & Administration (355 | 5.9%).
Sales and Office Occupations by Sex
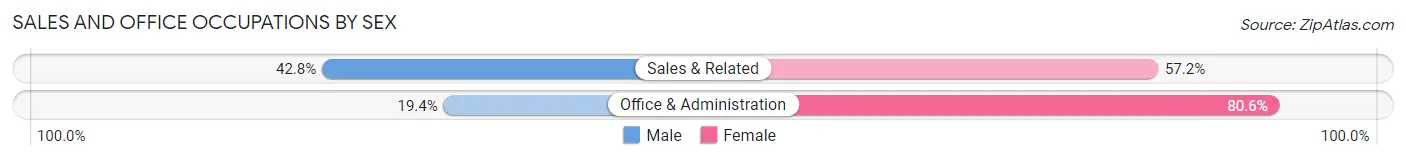
| Occupation | Male | Female |
| Sales & Related | 330 (42.8%) | 441 (57.2%) |
| Office & Administration | 69 (19.4%) | 286 (80.6%) |
| Total (Category) | 399 (35.4%) | 727 (64.6%) |
| Total (Overall) | 3,304 (55.2%) | 2,686 (44.8%) |
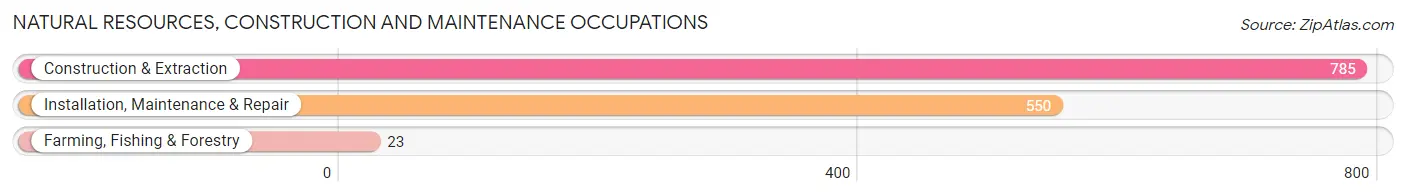
Natural Resources, Construction and Maintenance Occupations
The most common Natural Resources, Construction and Maintenance occupations in Buchanan County are Construction & Extraction (785 | 13.1%), Installation, Maintenance & Repair (550 | 9.2%), and Farming, Fishing & Forestry (23 | 0.4%).
Natural Resources, Construction and Maintenance Occupations by Sex
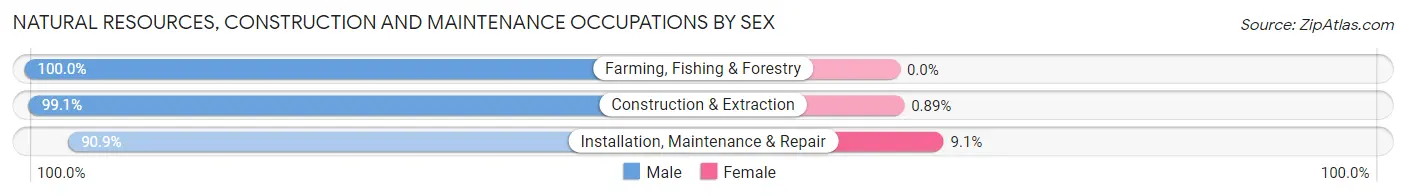
| Occupation | Male | Female |
| Farming, Fishing & Forestry | 23 (100.0%) | 0 (0.0%) |
| Construction & Extraction | 778 (99.1%) | 7 (0.9%) |
| Installation, Maintenance & Repair | 500 (90.9%) | 50 (9.1%) |
| Total (Category) | 1,301 (95.8%) | 57 (4.2%) |
| Total (Overall) | 3,304 (55.2%) | 2,686 (44.8%) |
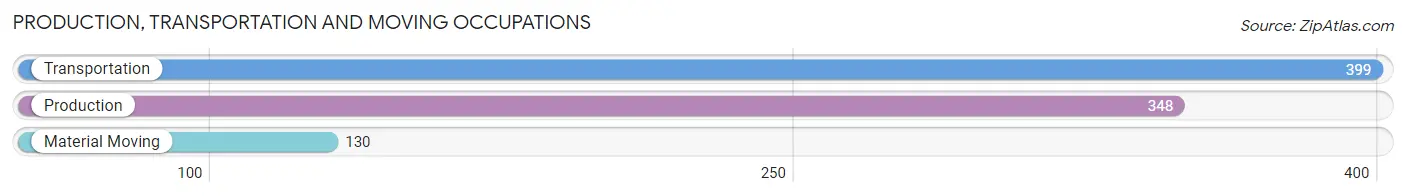
Production, Transportation and Moving Occupations
The most common Production, Transportation and Moving occupations in Buchanan County are Transportation (399 | 6.7%), Production (348 | 5.8%), and Material Moving (130 | 2.2%).
Production, Transportation and Moving Occupations by Sex
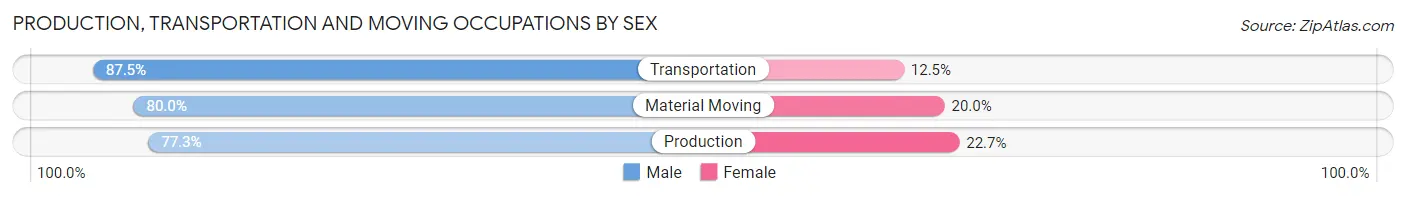
| Occupation | Male | Female |
| Production | 269 (77.3%) | 79 (22.7%) |
| Transportation | 349 (87.5%) | 50 (12.5%) |
| Material Moving | 104 (80.0%) | 26 (20.0%) |
| Total (Category) | 722 (82.3%) | 155 (17.7%) |
| Total (Overall) | 3,304 (55.2%) | 2,686 (44.8%) |
Employment Industries by Sex in Buchanan County
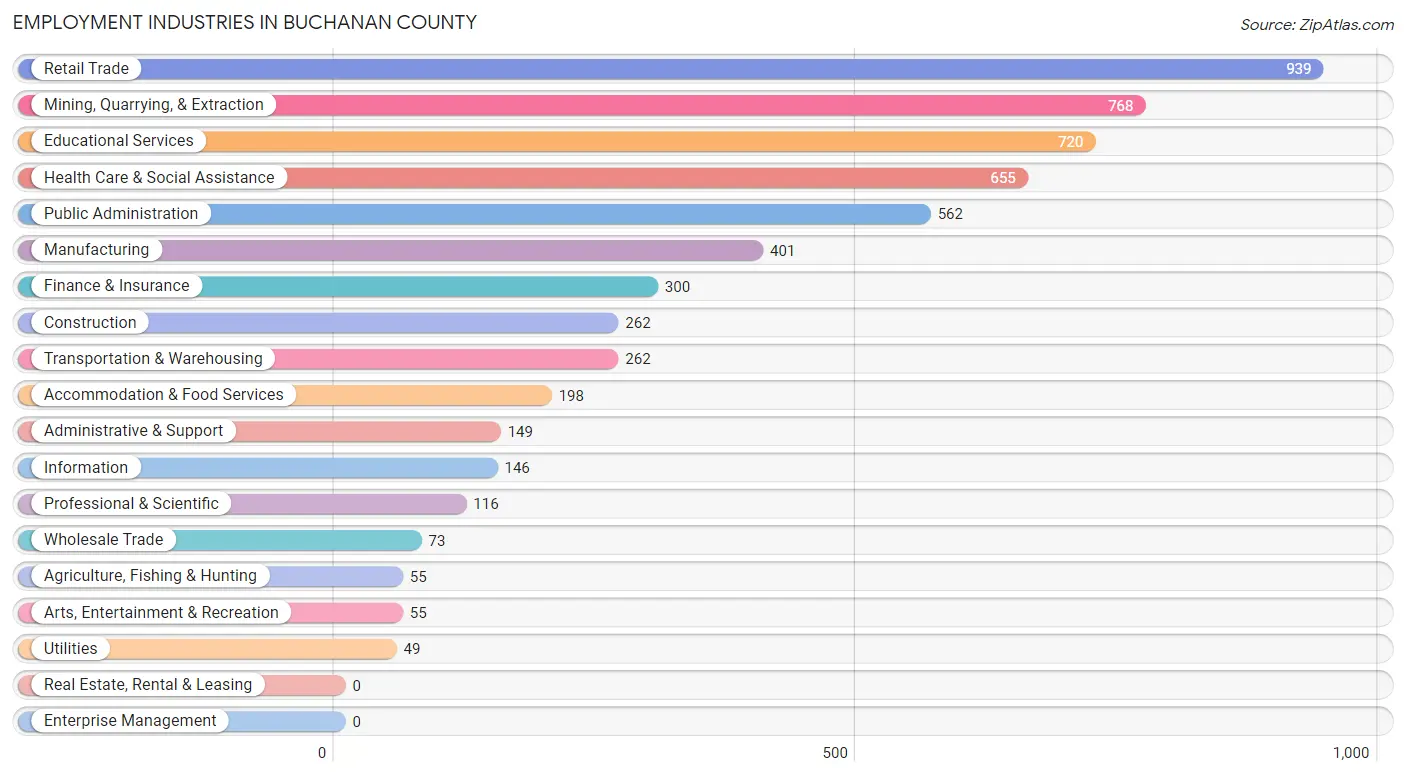
Employment Industries in Buchanan County
The major employment industries in Buchanan County include Retail Trade (939 | 15.7%), Mining, Quarrying, & Extraction (768 | 12.8%), Educational Services (720 | 12.0%), Health Care & Social Assistance (655 | 10.9%), and Public Administration (562 | 9.4%).
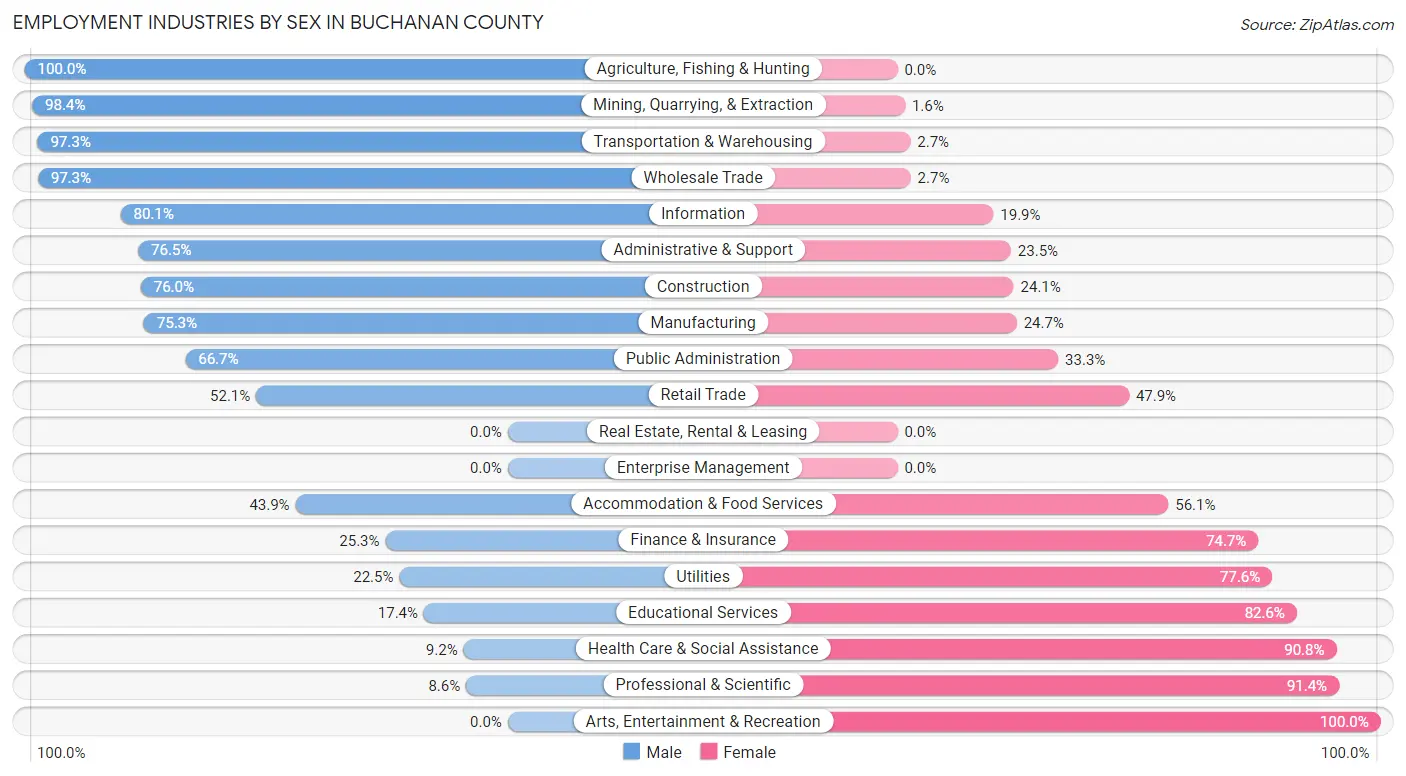
Employment Industries by Sex in Buchanan County
The Buchanan County industries that see more men than women are Agriculture, Fishing & Hunting (100.0%), Mining, Quarrying, & Extraction (98.4%), and Transportation & Warehousing (97.3%), whereas the industries that tend to have a higher number of women are Arts, Entertainment & Recreation (100.0%), Professional & Scientific (91.4%), and Health Care & Social Assistance (90.8%).
| Industry | Male | Female |
| Agriculture, Fishing & Hunting | 55 (100.0%) | 0 (0.0%) |
| Mining, Quarrying, & Extraction | 756 (98.4%) | 12 (1.6%) |
| Construction | 199 (75.9%) | 63 (24.0%) |
| Manufacturing | 302 (75.3%) | 99 (24.7%) |
| Wholesale Trade | 71 (97.3%) | 2 (2.7%) |
| Retail Trade | 489 (52.1%) | 450 (47.9%) |
| Transportation & Warehousing | 255 (97.3%) | 7 (2.7%) |
| Utilities | 11 (22.5%) | 38 (77.5%) |
| Information | 117 (80.1%) | 29 (19.9%) |
| Finance & Insurance | 76 (25.3%) | 224 (74.7%) |
| Real Estate, Rental & Leasing | 0 (0.0%) | 0 (0.0%) |
| Professional & Scientific | 10 (8.6%) | 106 (91.4%) |
| Enterprise Management | 0 (0.0%) | 0 (0.0%) |
| Administrative & Support | 114 (76.5%) | 35 (23.5%) |
| Educational Services | 125 (17.4%) | 595 (82.6%) |
| Health Care & Social Assistance | 60 (9.2%) | 595 (90.8%) |
| Arts, Entertainment & Recreation | 0 (0.0%) | 55 (100.0%) |
| Accommodation & Food Services | 87 (43.9%) | 111 (56.1%) |
| Public Administration | 375 (66.7%) | 187 (33.3%) |
| Total | 3,304 (55.2%) | 2,686 (44.8%) |
Education in Buchanan County
School Enrollment in Buchanan County
The most common levels of schooling among the 2,815 students in Buchanan County are high school (790 | 28.1%), middle school (589 | 20.9%), and college / undergraduate (502 | 17.8%).
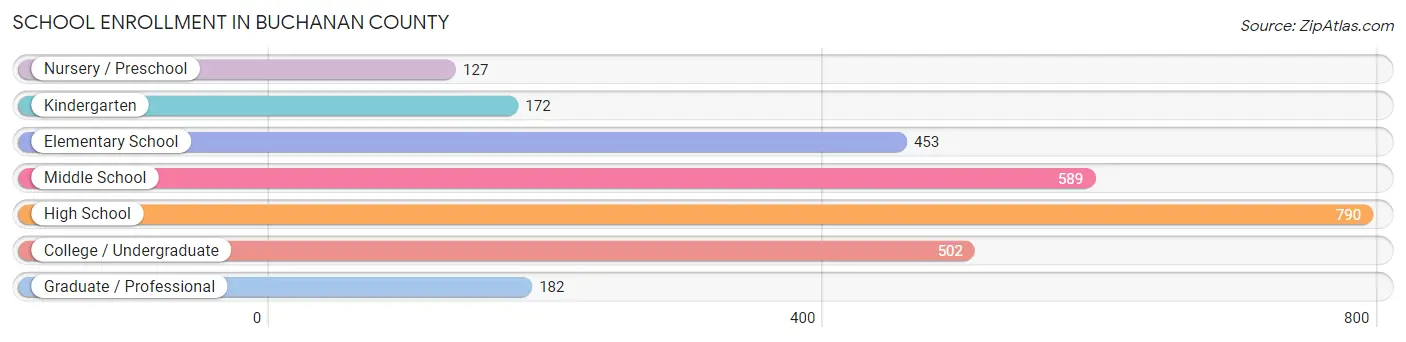
| School Level | # Students | % Students |
| Nursery / Preschool | 127 | 4.5% |
| Kindergarten | 172 | 6.1% |
| Elementary School | 453 | 16.1% |
| Middle School | 589 | 20.9% |
| High School | 790 | 28.1% |
| College / Undergraduate | 502 | 17.8% |
| Graduate / Professional | 182 | 6.5% |
| Total | 2,815 | 100.0% |
School Enrollment by Age by Funding Source in Buchanan County
Out of a total of 2,815 students who are enrolled in schools in Buchanan County, 400 (14.2%) attend a private institution, while the remaining 2,415 (85.8%) are enrolled in public schools. The age group of 25 to 34 year olds has the highest likelihood of being enrolled in private schools, with 73 (42.9% in the age bracket) enrolled. Conversely, the age group of 18 to 19 year olds has the lowest likelihood of being enrolled in a private school, with 215 (99.5% in the age bracket) attending a public institution.
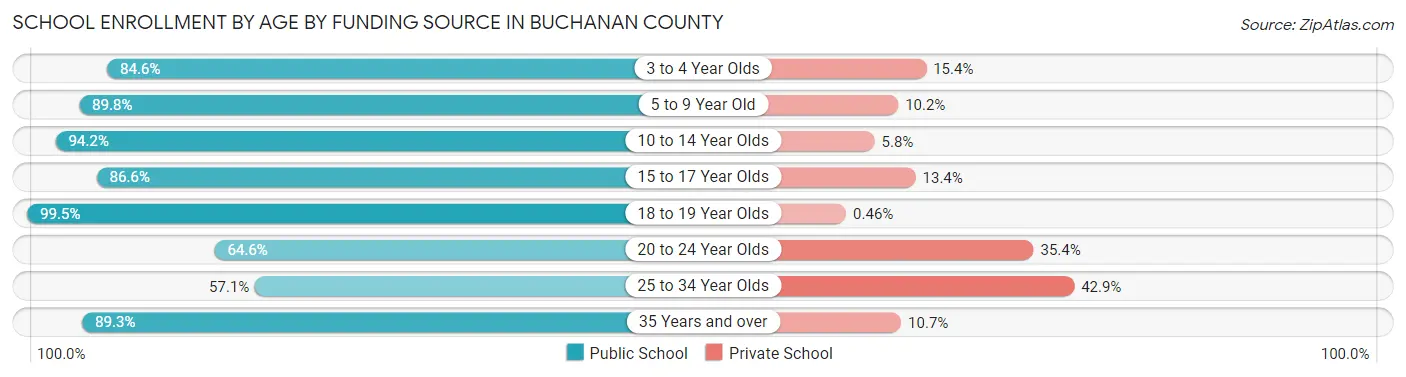
| Age Bracket | Public School | Private School |
| 3 to 4 Year Olds | 77 (84.6%) | 14 (15.4%) |
| 5 to 9 Year Old | 513 (89.8%) | 58 (10.2%) |
| 10 to 14 Year Olds | 801 (94.2%) | 49 (5.8%) |
| 15 to 17 Year Olds | 420 (86.6%) | 65 (13.4%) |
| 18 to 19 Year Olds | 215 (99.5%) | 1 (0.5%) |
| 20 to 24 Year Olds | 243 (64.6%) | 133 (35.4%) |
| 25 to 34 Year Olds | 97 (57.1%) | 73 (42.9%) |
| 35 Years and over | 50 (89.3%) | 6 (10.7%) |
| Total | 2,415 (85.8%) | 400 (14.2%) |
Educational Attainment by Field of Study in Buchanan County
Education (412 | 23.1%), business (326 | 18.2%), arts & humanities (228 | 12.8%), psychology (208 | 11.6%), and engineering (152 | 8.5%) are the most common fields of study among 1,787 individuals in Buchanan County who have obtained a bachelor's degree or higher.
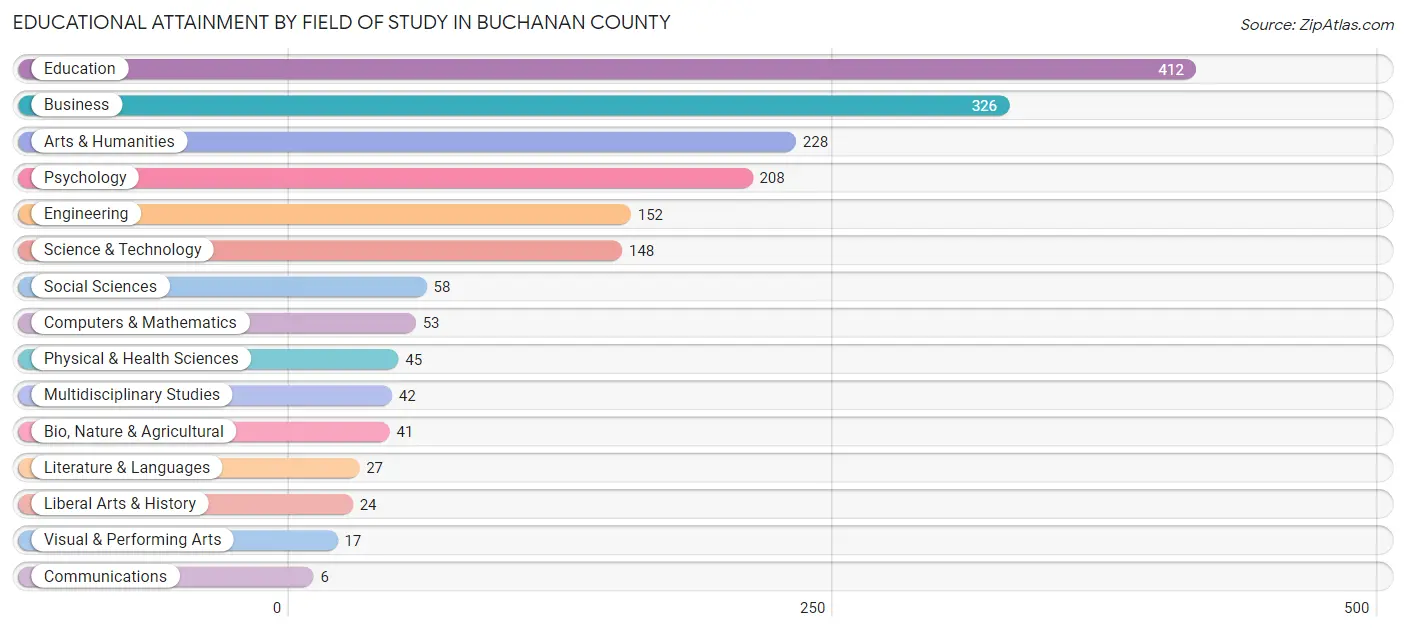
| Field of Study | # Graduates | % Graduates |
| Computers & Mathematics | 53 | 3.0% |
| Bio, Nature & Agricultural | 41 | 2.3% |
| Physical & Health Sciences | 45 | 2.5% |
| Psychology | 208 | 11.6% |
| Social Sciences | 58 | 3.3% |
| Engineering | 152 | 8.5% |
| Multidisciplinary Studies | 42 | 2.4% |
| Science & Technology | 148 | 8.3% |
| Business | 326 | 18.2% |
| Education | 412 | 23.1% |
| Literature & Languages | 27 | 1.5% |
| Liberal Arts & History | 24 | 1.3% |
| Visual & Performing Arts | 17 | 0.9% |
| Communications | 6 | 0.3% |
| Arts & Humanities | 228 | 12.8% |
| Total | 1,787 | 100.0% |
Transportation & Commute in Buchanan County
Vehicle Availability by Sex in Buchanan County
The most prevalent vehicle ownership categories in Buchanan County are males with 2 vehicles (1,287, accounting for 40.2%) and females with 2 vehicles (1,020, making up 49.4%).
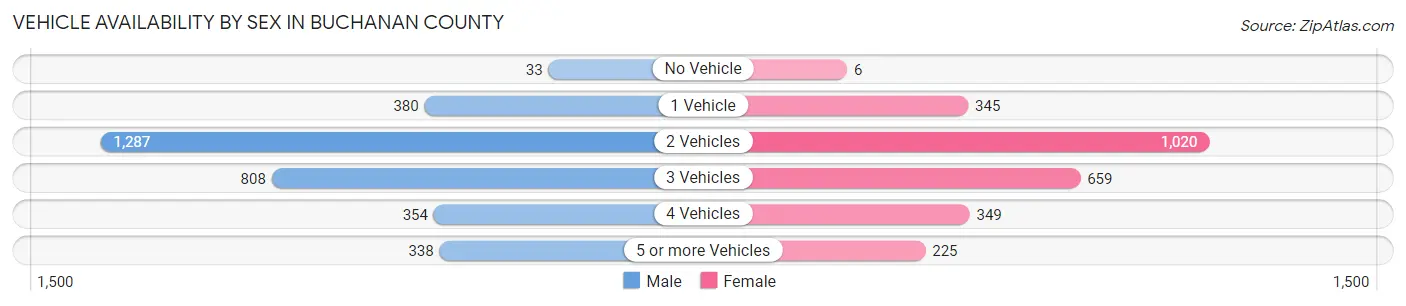
| Vehicles Available | Male | Female |
| No Vehicle | 33 (1.0%) | 6 (0.2%) |
| 1 Vehicle | 380 (11.9%) | 345 (13.3%) |
| 2 Vehicles | 1,287 (40.2%) | 1,020 (39.2%) |
| 3 Vehicles | 808 (25.3%) | 659 (25.3%) |
| 4 Vehicles | 354 (11.1%) | 349 (13.4%) |
| 5 or more Vehicles | 338 (10.6%) | 225 (8.6%) |
| Total | 3,200 (100.0%) | 2,604 (100.0%) |
Commute Time in Buchanan County
The most frequently occuring commute durations in Buchanan County are 45 to 59 minutes (867 commuters, 15.3%), 15 to 19 minutes (765 commuters, 13.5%), and 30 to 34 minutes (757 commuters, 13.4%).
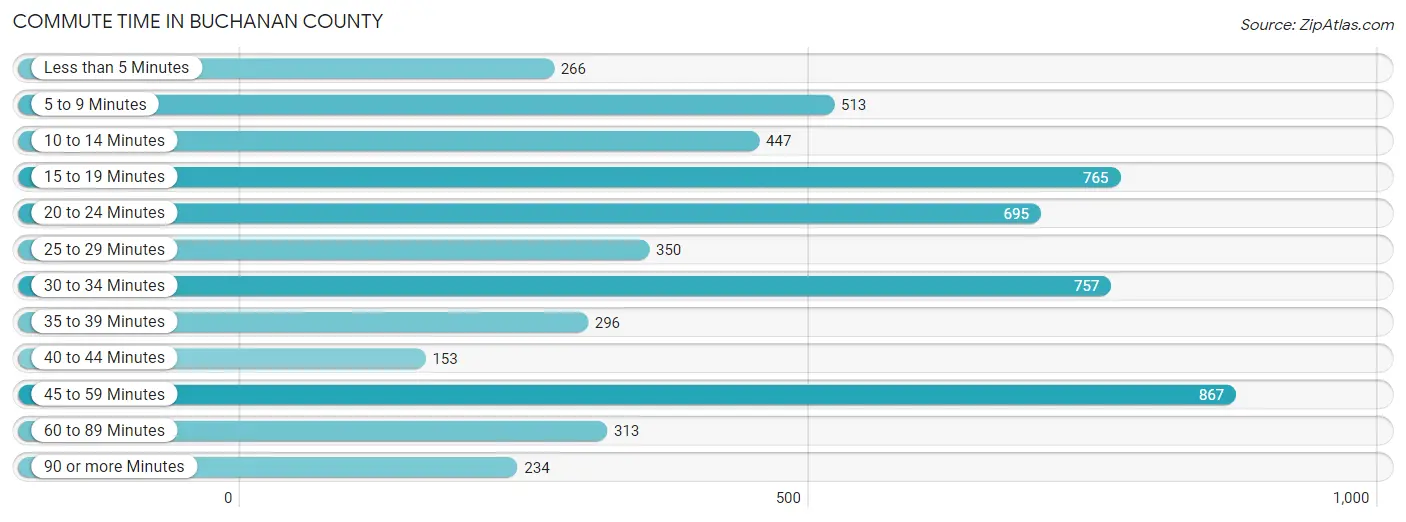
| Commute Time | # Commuters | % Commuters |
| Less than 5 Minutes | 266 | 4.7% |
| 5 to 9 Minutes | 513 | 9.1% |
| 10 to 14 Minutes | 447 | 7.9% |
| 15 to 19 Minutes | 765 | 13.5% |
| 20 to 24 Minutes | 695 | 12.3% |
| 25 to 29 Minutes | 350 | 6.2% |
| 30 to 34 Minutes | 757 | 13.4% |
| 35 to 39 Minutes | 296 | 5.2% |
| 40 to 44 Minutes | 153 | 2.7% |
| 45 to 59 Minutes | 867 | 15.3% |
| 60 to 89 Minutes | 313 | 5.5% |
| 90 or more Minutes | 234 | 4.1% |
Commute Time by Sex in Buchanan County
The most common commute times in Buchanan County are 45 to 59 minutes (587 commuters, 19.0%) for males and 20 to 24 minutes (392 commuters, 15.3%) for females.
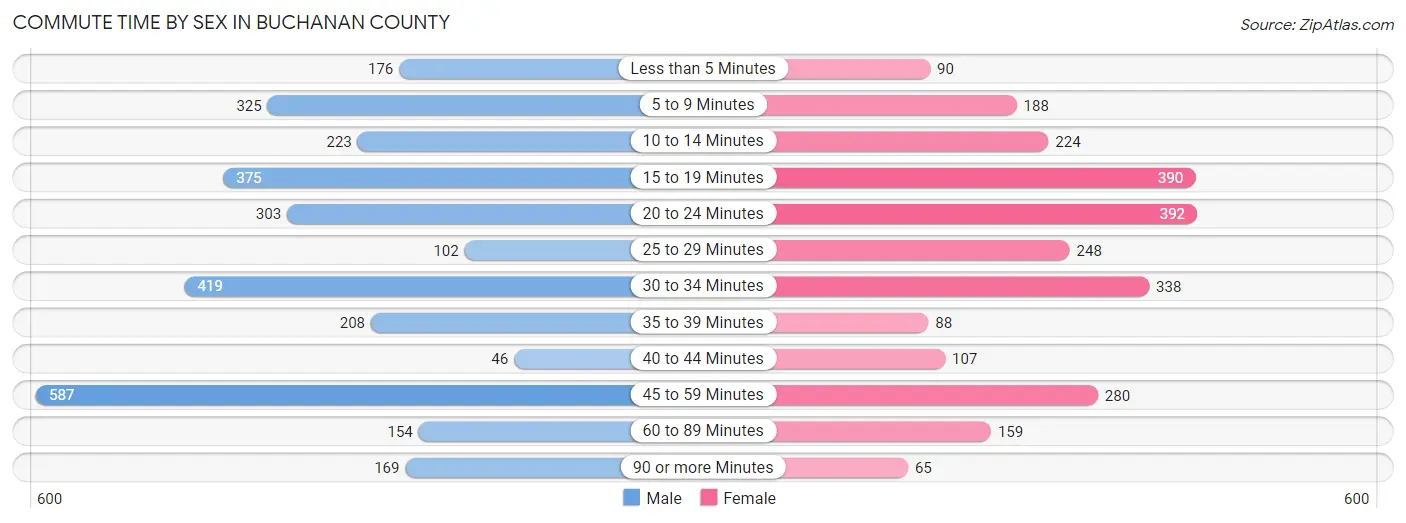
| Commute Time | Male | Female |
| Less than 5 Minutes | 176 (5.7%) | 90 (3.5%) |
| 5 to 9 Minutes | 325 (10.5%) | 188 (7.3%) |
| 10 to 14 Minutes | 223 (7.2%) | 224 (8.7%) |
| 15 to 19 Minutes | 375 (12.1%) | 390 (15.2%) |
| 20 to 24 Minutes | 303 (9.8%) | 392 (15.3%) |
| 25 to 29 Minutes | 102 (3.3%) | 248 (9.7%) |
| 30 to 34 Minutes | 419 (13.6%) | 338 (13.2%) |
| 35 to 39 Minutes | 208 (6.7%) | 88 (3.4%) |
| 40 to 44 Minutes | 46 (1.5%) | 107 (4.2%) |
| 45 to 59 Minutes | 587 (19.0%) | 280 (10.9%) |
| 60 to 89 Minutes | 154 (5.0%) | 159 (6.2%) |
| 90 or more Minutes | 169 (5.5%) | 65 (2.5%) |
Time of Departure to Work by Sex in Buchanan County
The most frequent times of departure to work in Buchanan County are 7:00 AM to 7:29 AM (514, 16.7%) for males and 7:30 AM to 7:59 AM (531, 20.7%) for females.
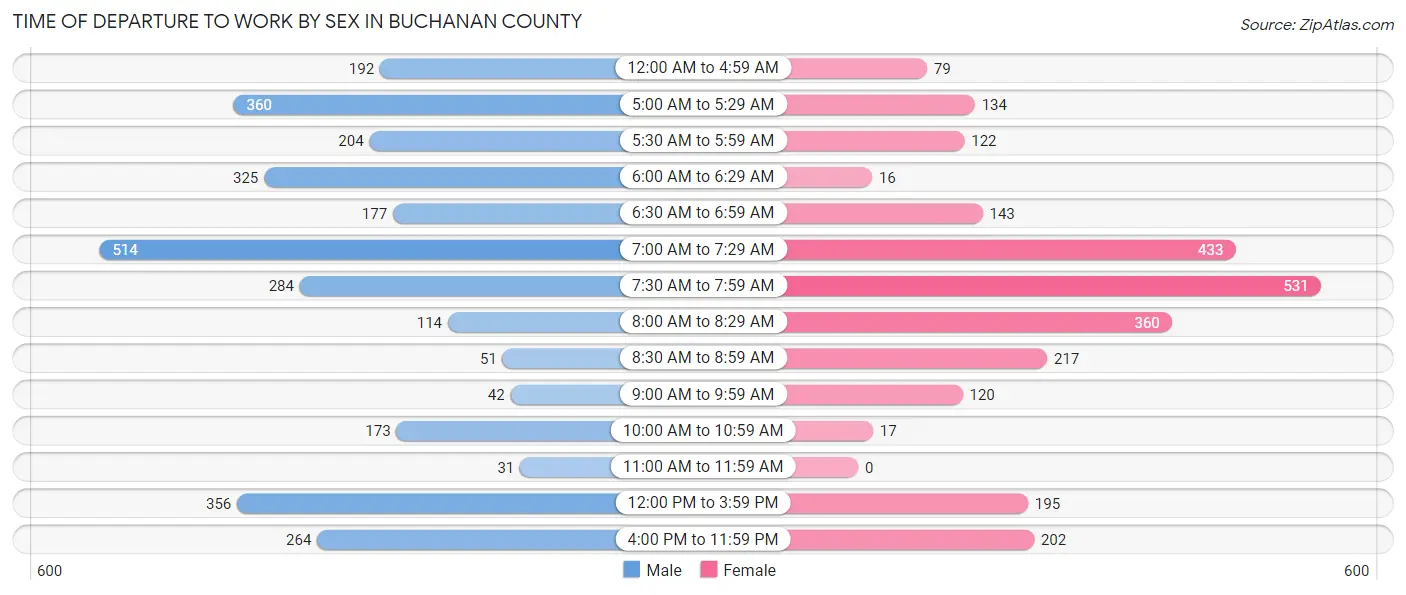
| Time of Departure | Male | Female |
| 12:00 AM to 4:59 AM | 192 (6.2%) | 79 (3.1%) |
| 5:00 AM to 5:29 AM | 360 (11.7%) | 134 (5.2%) |
| 5:30 AM to 5:59 AM | 204 (6.6%) | 122 (4.8%) |
| 6:00 AM to 6:29 AM | 325 (10.5%) | 16 (0.6%) |
| 6:30 AM to 6:59 AM | 177 (5.7%) | 143 (5.6%) |
| 7:00 AM to 7:29 AM | 514 (16.7%) | 433 (16.9%) |
| 7:30 AM to 7:59 AM | 284 (9.2%) | 531 (20.7%) |
| 8:00 AM to 8:29 AM | 114 (3.7%) | 360 (14.0%) |
| 8:30 AM to 8:59 AM | 51 (1.7%) | 217 (8.5%) |
| 9:00 AM to 9:59 AM | 42 (1.4%) | 120 (4.7%) |
| 10:00 AM to 10:59 AM | 173 (5.6%) | 17 (0.7%) |
| 11:00 AM to 11:59 AM | 31 (1.0%) | 0 (0.0%) |
| 12:00 PM to 3:59 PM | 356 (11.5%) | 195 (7.6%) |
| 4:00 PM to 11:59 PM | 264 (8.6%) | 202 (7.9%) |
| Total | 3,087 (100.0%) | 2,569 (100.0%) |
Housing Occupancy in Buchanan County
Occupancy by Ownership in Buchanan County
Of the total 7,494 dwellings in Buchanan County, owner-occupied units account for 6,117 (81.6%), while renter-occupied units make up 1,377 (18.4%).
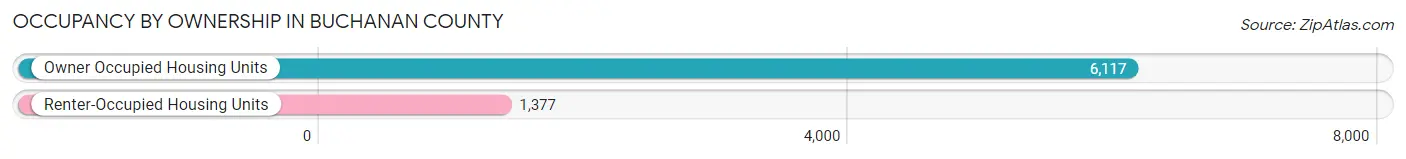
| Occupancy | # Housing Units | % Housing Units |
| Owner Occupied Housing Units | 6,117 | 81.6% |
| Renter-Occupied Housing Units | 1,377 | 18.4% |
| Total Occupied Housing Units | 7,494 | 100.0% |
Occupancy by Household Size in Buchanan County
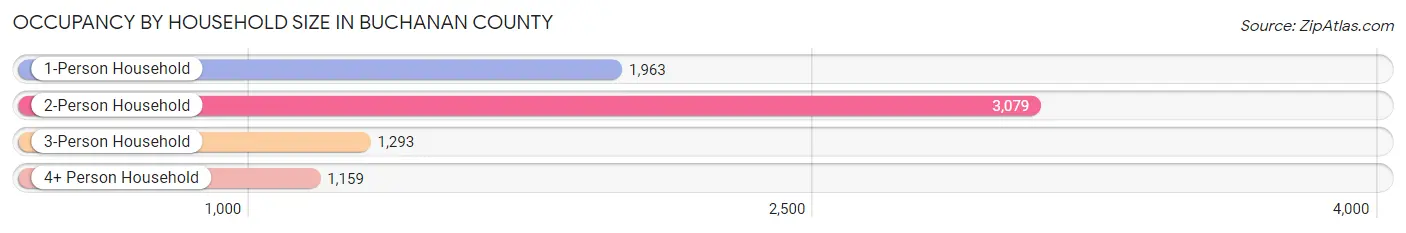
| Household Size | # Housing Units | % Housing Units |
| 1-Person Household | 1,963 | 26.2% |
| 2-Person Household | 3,079 | 41.1% |
| 3-Person Household | 1,293 | 17.2% |
| 4+ Person Household | 1,159 | 15.5% |
| Total Housing Units | 7,494 | 100.0% |
Occupancy by Ownership by Household Size in Buchanan County
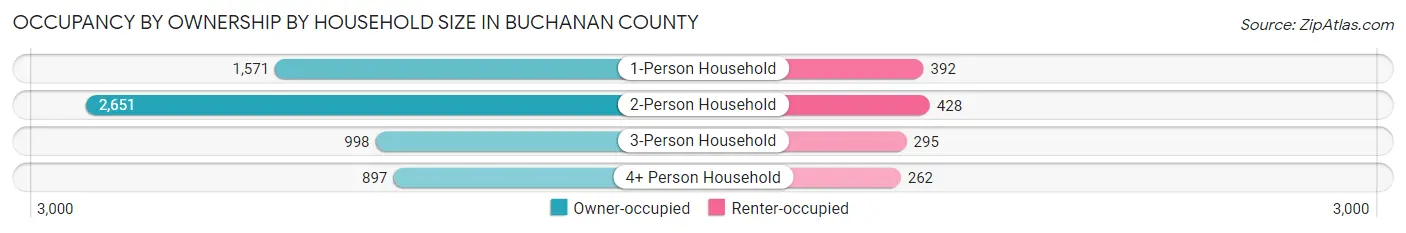
| Household Size | Owner-occupied | Renter-occupied |
| 1-Person Household | 1,571 (80.0%) | 392 (20.0%) |
| 2-Person Household | 2,651 (86.1%) | 428 (13.9%) |
| 3-Person Household | 998 (77.2%) | 295 (22.8%) |
| 4+ Person Household | 897 (77.4%) | 262 (22.6%) |
| Total Housing Units | 6,117 (81.6%) | 1,377 (18.4%) |
Occupancy by Educational Attainment in Buchanan County
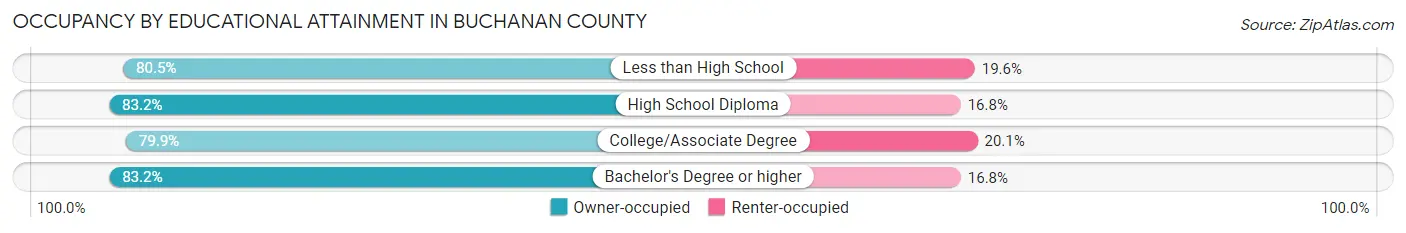
| Household Size | Owner-occupied | Renter-occupied |
| Less than High School | 1,625 (80.4%) | 395 (19.6%) |
| High School Diploma | 2,059 (83.2%) | 415 (16.8%) |
| College/Associate Degree | 1,531 (79.9%) | 385 (20.1%) |
| Bachelor's Degree or higher | 902 (83.2%) | 182 (16.8%) |
Occupancy by Age of Householder in Buchanan County
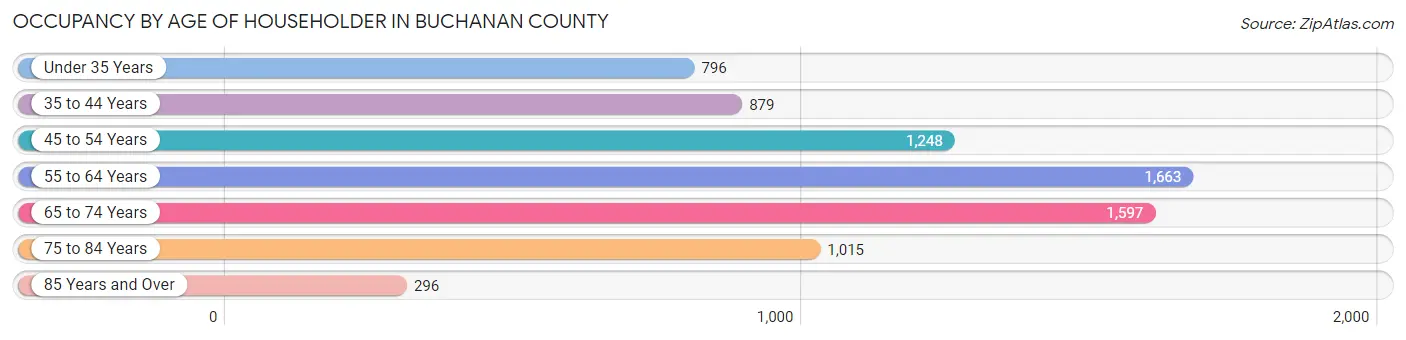
| Age Bracket | # Households | % Households |
| Under 35 Years | 796 | 10.6% |
| 35 to 44 Years | 879 | 11.7% |
| 45 to 54 Years | 1,248 | 16.7% |
| 55 to 64 Years | 1,663 | 22.2% |
| 65 to 74 Years | 1,597 | 21.3% |
| 75 to 84 Years | 1,015 | 13.5% |
| 85 Years and Over | 296 | 4.0% |
| Total | 7,494 | 100.0% |
Housing Finances in Buchanan County
Median Income by Occupancy in Buchanan County
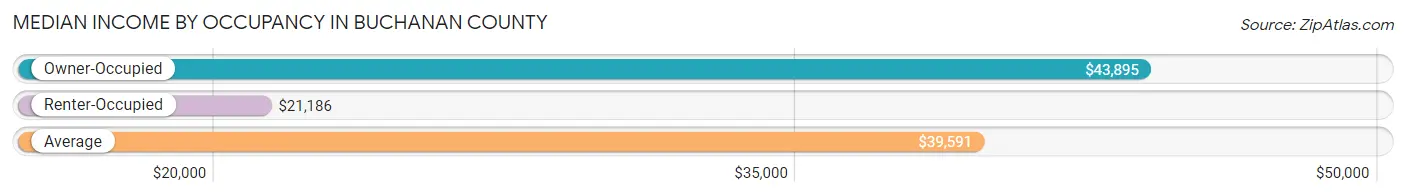
| Occupancy Type | # Households | Median Income |
| Owner-Occupied | 6,117 (81.6%) | $43,895 |
| Renter-Occupied | 1,377 (18.4%) | $21,186 |
| Average | 7,494 (100.0%) | $39,591 |
Occupancy by Householder Income Bracket in Buchanan County
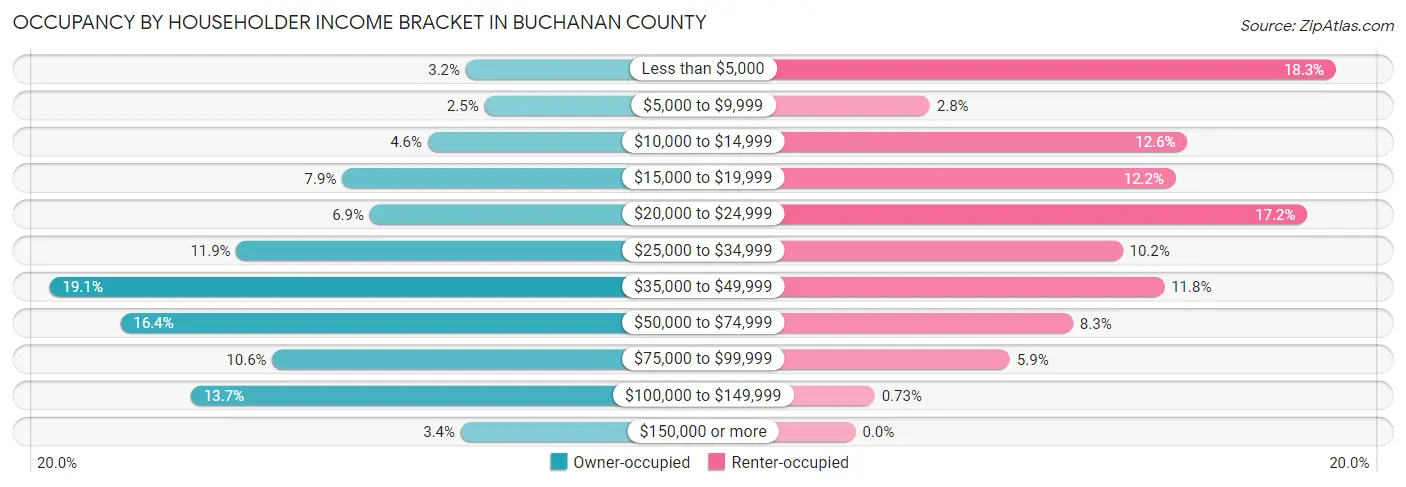
| Income Bracket | Owner-occupied | Renter-occupied |
| Less than $5,000 | 195 (3.2%) | 252 (18.3%) |
| $5,000 to $9,999 | 152 (2.5%) | 39 (2.8%) |
| $10,000 to $14,999 | 284 (4.6%) | 174 (12.6%) |
| $15,000 to $19,999 | 483 (7.9%) | 168 (12.2%) |
| $20,000 to $24,999 | 419 (6.9%) | 237 (17.2%) |
| $25,000 to $34,999 | 730 (11.9%) | 140 (10.2%) |
| $35,000 to $49,999 | 1,165 (19.1%) | 162 (11.8%) |
| $50,000 to $74,999 | 1,000 (16.4%) | 114 (8.3%) |
| $75,000 to $99,999 | 646 (10.6%) | 81 (5.9%) |
| $100,000 to $149,999 | 836 (13.7%) | 10 (0.7%) |
| $150,000 or more | 207 (3.4%) | 0 (0.0%) |
| Total | 6,117 (100.0%) | 1,377 (100.0%) |
Monthly Housing Cost Tiers in Buchanan County
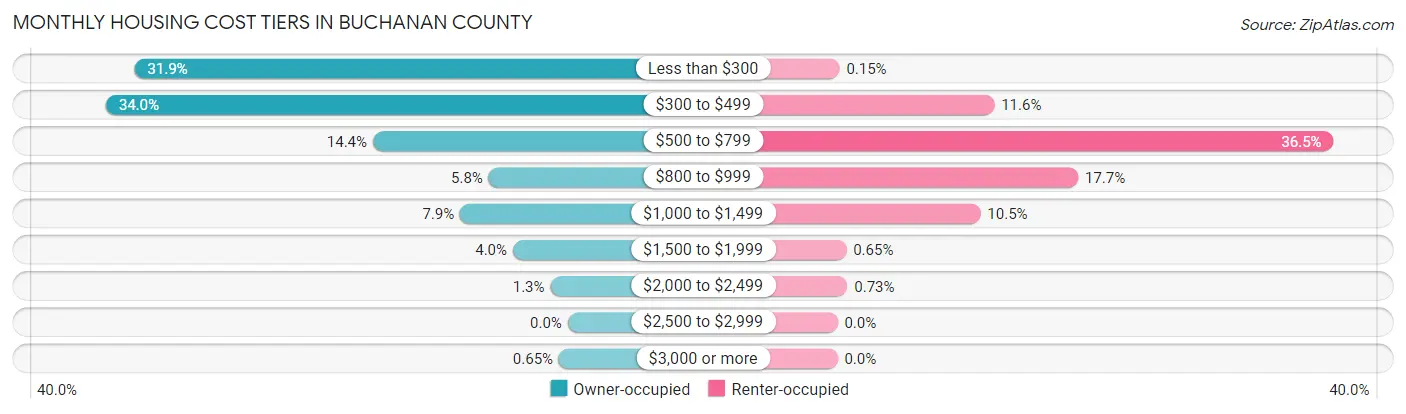
| Monthly Cost | Owner-occupied | Renter-occupied |
| Less than $300 | 1,952 (31.9%) | 2 (0.2%) |
| $300 to $499 | 2,081 (34.0%) | 159 (11.6%) |
| $500 to $799 | 878 (14.3%) | 503 (36.5%) |
| $800 to $999 | 356 (5.8%) | 244 (17.7%) |
| $1,000 to $1,499 | 485 (7.9%) | 145 (10.5%) |
| $1,500 to $1,999 | 247 (4.0%) | 9 (0.6%) |
| $2,000 to $2,499 | 78 (1.3%) | 10 (0.7%) |
| $2,500 to $2,999 | 0 (0.0%) | 0 (0.0%) |
| $3,000 or more | 40 (0.6%) | 0 (0.0%) |
| Total | 6,117 (100.0%) | 1,377 (100.0%) |
Physical Housing Characteristics in Buchanan County
Housing Structures in Buchanan County
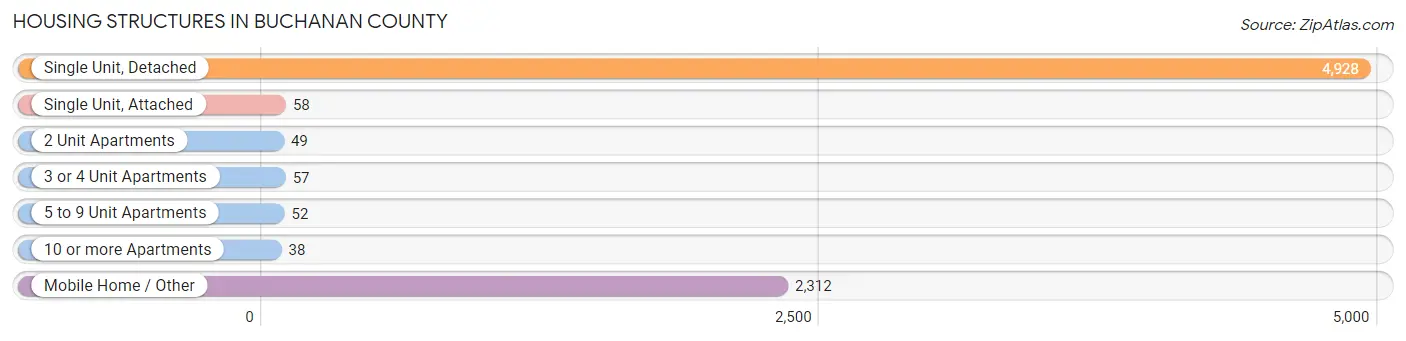
| Structure Type | # Housing Units | % Housing Units |
| Single Unit, Detached | 4,928 | 65.8% |
| Single Unit, Attached | 58 | 0.8% |
| 2 Unit Apartments | 49 | 0.6% |
| 3 or 4 Unit Apartments | 57 | 0.8% |
| 5 to 9 Unit Apartments | 52 | 0.7% |
| 10 or more Apartments | 38 | 0.5% |
| Mobile Home / Other | 2,312 | 30.8% |
| Total | 7,494 | 100.0% |
Housing Structures by Occupancy in Buchanan County
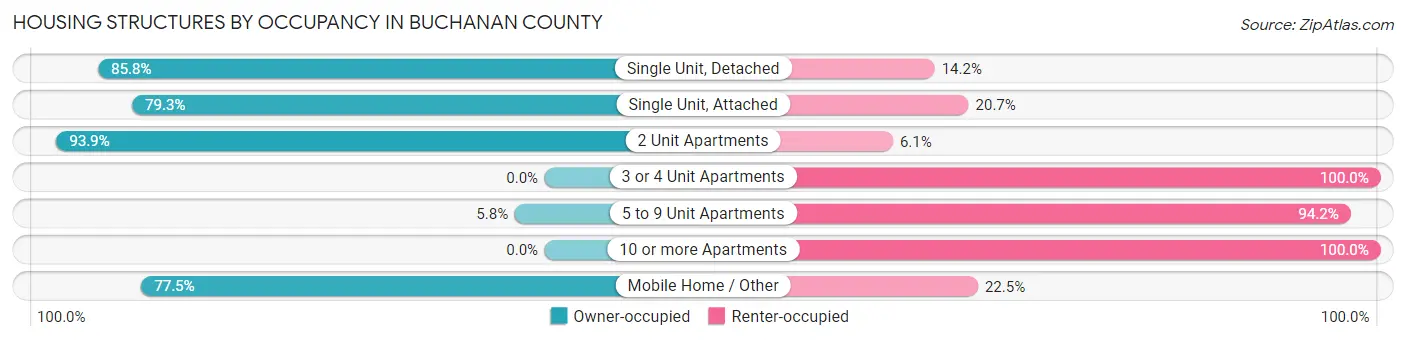
| Structure Type | Owner-occupied | Renter-occupied |
| Single Unit, Detached | 4,230 (85.8%) | 698 (14.2%) |
| Single Unit, Attached | 46 (79.3%) | 12 (20.7%) |
| 2 Unit Apartments | 46 (93.9%) | 3 (6.1%) |
| 3 or 4 Unit Apartments | 0 (0.0%) | 57 (100.0%) |
| 5 to 9 Unit Apartments | 3 (5.8%) | 49 (94.2%) |
| 10 or more Apartments | 0 (0.0%) | 38 (100.0%) |
| Mobile Home / Other | 1,792 (77.5%) | 520 (22.5%) |
| Total | 6,117 (81.6%) | 1,377 (18.4%) |
Housing Structures by Number of Rooms in Buchanan County
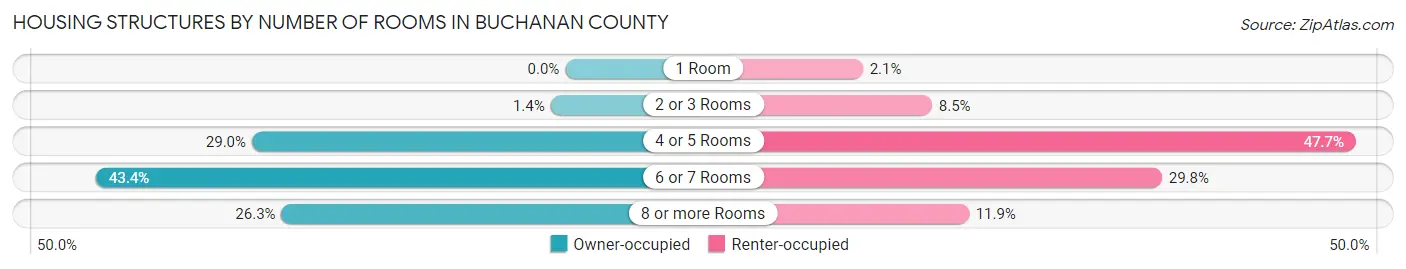
| Number of Rooms | Owner-occupied | Renter-occupied |
| 1 Room | 0 (0.0%) | 29 (2.1%) |
| 2 or 3 Rooms | 83 (1.4%) | 117 (8.5%) |
| 4 or 5 Rooms | 1,773 (29.0%) | 657 (47.7%) |
| 6 or 7 Rooms | 2,655 (43.4%) | 410 (29.8%) |
| 8 or more Rooms | 1,606 (26.3%) | 164 (11.9%) |
| Total | 6,117 (100.0%) | 1,377 (100.0%) |
Housing Structure by Heating Type in Buchanan County
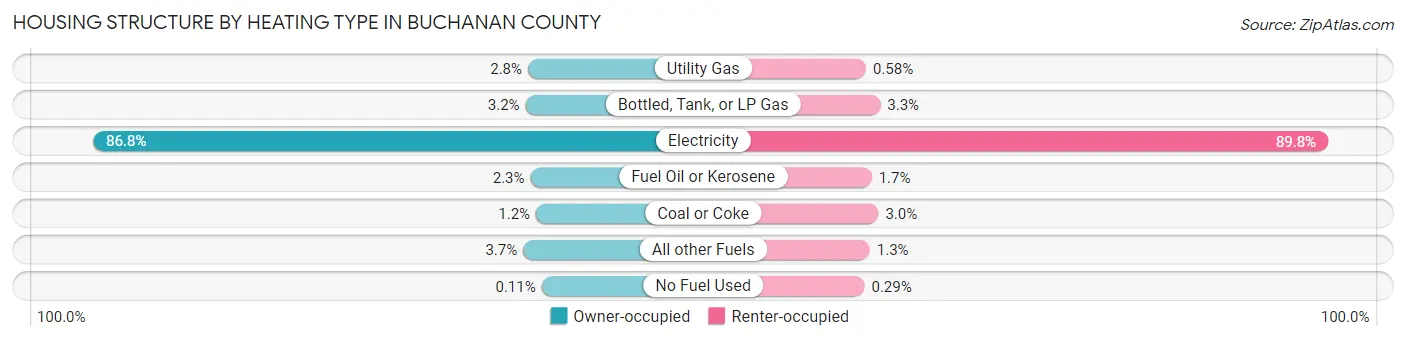
| Heating Type | Owner-occupied | Renter-occupied |
| Utility Gas | 168 (2.8%) | 8 (0.6%) |
| Bottled, Tank, or LP Gas | 197 (3.2%) | 46 (3.3%) |
| Electricity | 5,308 (86.8%) | 1,237 (89.8%) |
| Fuel Oil or Kerosene | 139 (2.3%) | 23 (1.7%) |
| Coal or Coke | 73 (1.2%) | 41 (3.0%) |
| All other Fuels | 225 (3.7%) | 18 (1.3%) |
| No Fuel Used | 7 (0.1%) | 4 (0.3%) |
| Total | 6,117 (100.0%) | 1,377 (100.0%) |
Household Vehicle Usage in Buchanan County
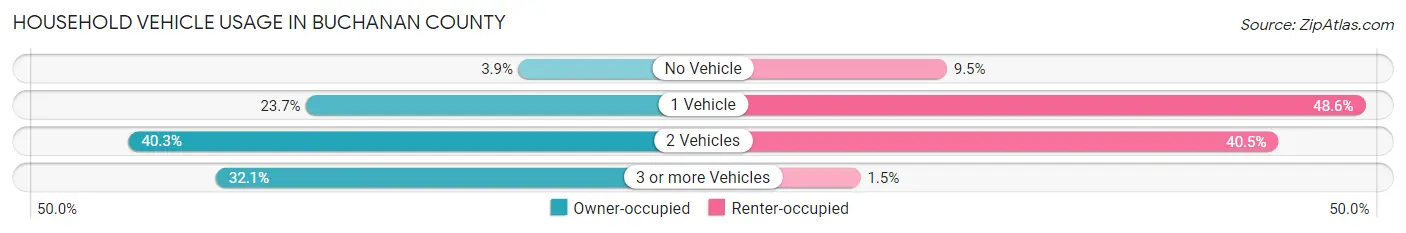
| Vehicles per Household | Owner-occupied | Renter-occupied |
| No Vehicle | 237 (3.9%) | 131 (9.5%) |
| 1 Vehicle | 1,449 (23.7%) | 669 (48.6%) |
| 2 Vehicles | 2,465 (40.3%) | 557 (40.5%) |
| 3 or more Vehicles | 1,966 (32.1%) | 20 (1.5%) |
| Total | 6,117 (100.0%) | 1,377 (100.0%) |
Real Estate & Mortgages in Buchanan County
Real Estate and Mortgage Overview in Buchanan County
| Characteristic | Without Mortgage | With Mortgage |
| Housing Units | 4,722 | 1,395 |
| Median Property Value | $69,700 | $125,600 |
| Median Household Income | $41,614 | $25 |
| Monthly Housing Costs | $325 | $40 |
| Real Estate Taxes | $402 | $81 |
Property Value by Mortgage Status in Buchanan County
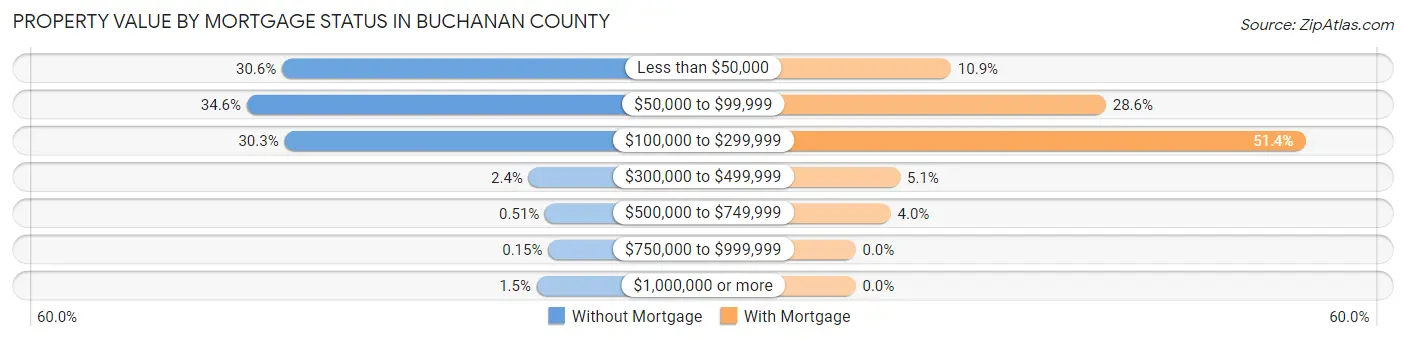
| Property Value | Without Mortgage | With Mortgage |
| Less than $50,000 | 1,444 (30.6%) | 152 (10.9%) |
| $50,000 to $99,999 | 1,634 (34.6%) | 399 (28.6%) |
| $100,000 to $299,999 | 1,431 (30.3%) | 717 (51.4%) |
| $300,000 to $499,999 | 113 (2.4%) | 71 (5.1%) |
| $500,000 to $749,999 | 24 (0.5%) | 56 (4.0%) |
| $750,000 to $999,999 | 7 (0.2%) | 0 (0.0%) |
| $1,000,000 or more | 69 (1.5%) | 0 (0.0%) |
| Total | 4,722 (100.0%) | 1,395 (100.0%) |
Household Income by Mortgage Status in Buchanan County
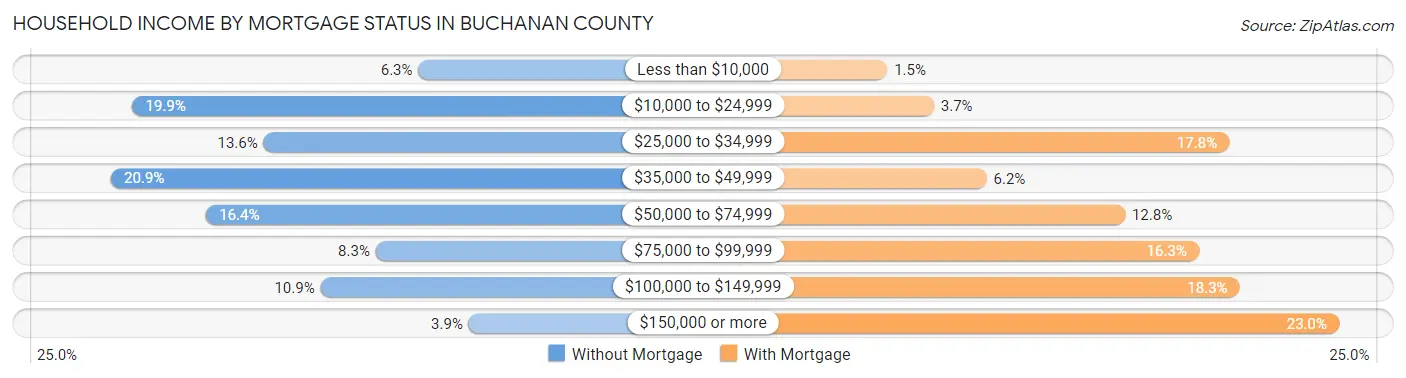
| Household Income | Without Mortgage | With Mortgage |
| Less than $10,000 | 295 (6.2%) | 21 (1.5%) |
| $10,000 to $24,999 | 938 (19.9%) | 52 (3.7%) |
| $25,000 to $34,999 | 643 (13.6%) | 248 (17.8%) |
| $35,000 to $49,999 | 986 (20.9%) | 87 (6.2%) |
| $50,000 to $74,999 | 772 (16.4%) | 179 (12.8%) |
| $75,000 to $99,999 | 391 (8.3%) | 228 (16.3%) |
| $100,000 to $149,999 | 515 (10.9%) | 255 (18.3%) |
| $150,000 or more | 182 (3.8%) | 321 (23.0%) |
| Total | 4,722 (100.0%) | 1,395 (100.0%) |
Property Value to Household Income Ratio in Buchanan County
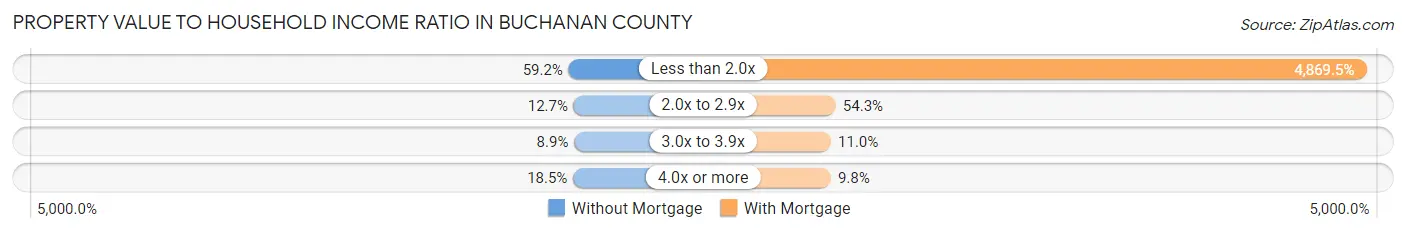
| Value-to-Income Ratio | Without Mortgage | With Mortgage |
| Less than 2.0x | 2,794 (59.2%) | 67,930 (4,869.5%) |
| 2.0x to 2.9x | 599 (12.7%) | 757 (54.3%) |
| 3.0x to 3.9x | 421 (8.9%) | 153 (11.0%) |
| 4.0x or more | 872 (18.5%) | 137 (9.8%) |
| Total | 4,722 (100.0%) | 1,395 (100.0%) |
Real Estate Taxes by Mortgage Status in Buchanan County
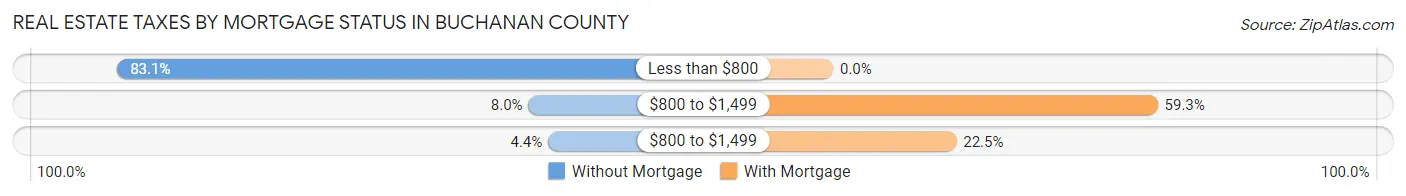
| Property Taxes | Without Mortgage | With Mortgage |
| Less than $800 | 3,923 (83.1%) | 0 (0.0%) |
| $800 to $1,499 | 377 (8.0%) | 827 (59.3%) |
| $800 to $1,499 | 207 (4.4%) | 314 (22.5%) |
| Total | 4,722 (100.0%) | 1,395 (100.0%) |
Health & Disability in Buchanan County
Health Insurance Coverage by Age in Buchanan County
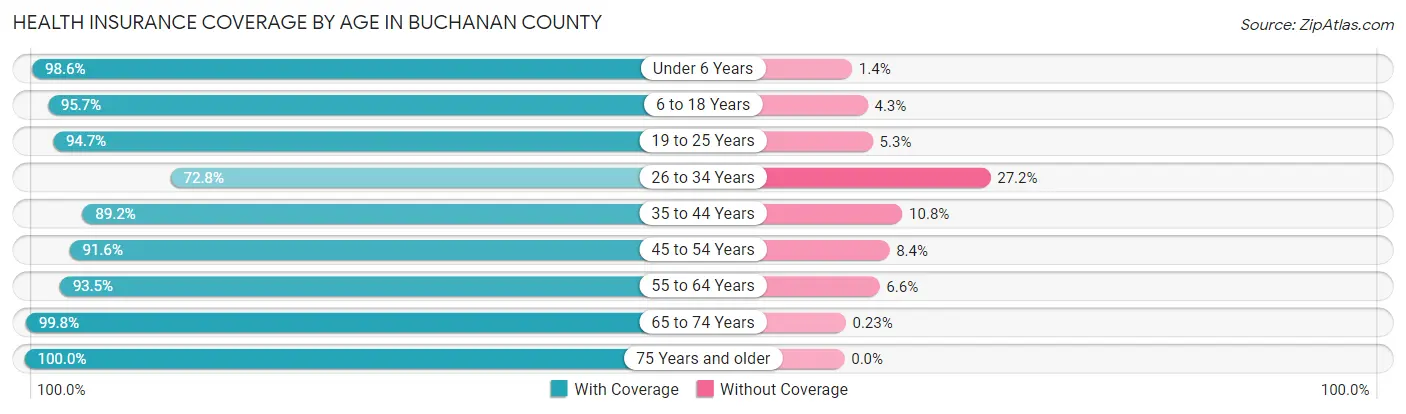
| Age Bracket | With Coverage | Without Coverage |
| Under 6 Years | 973 (98.6%) | 14 (1.4%) |
| 6 to 18 Years | 2,407 (95.7%) | 109 (4.3%) |
| 19 to 25 Years | 1,324 (94.7%) | 74 (5.3%) |
| 26 to 34 Years | 1,395 (72.8%) | 522 (27.2%) |
| 35 to 44 Years | 1,902 (89.2%) | 230 (10.8%) |
| 45 to 54 Years | 2,537 (91.6%) | 232 (8.4%) |
| 55 to 64 Years | 2,911 (93.4%) | 204 (6.6%) |
| 65 to 74 Years | 2,634 (99.8%) | 6 (0.2%) |
| 75 Years and older | 1,844 (100.0%) | 0 (0.0%) |
| Total | 17,927 (92.8%) | 1,391 (7.2%) |
Health Insurance Coverage by Citizenship Status in Buchanan County
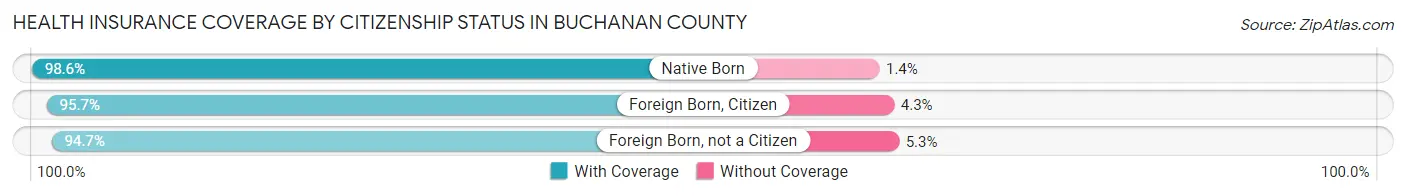
| Citizenship Status | With Coverage | Without Coverage |
| Native Born | 973 (98.6%) | 14 (1.4%) |
| Foreign Born, Citizen | 2,407 (95.7%) | 109 (4.3%) |
| Foreign Born, not a Citizen | 1,324 (94.7%) | 74 (5.3%) |
Health Insurance Coverage by Household Income in Buchanan County
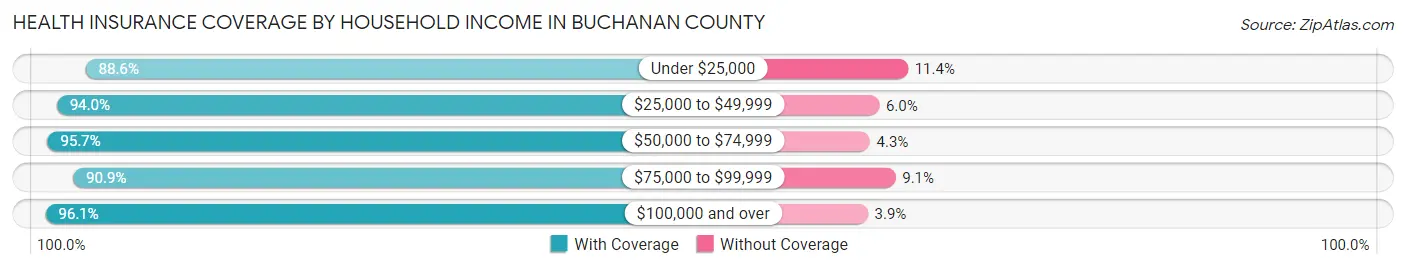
| Household Income | With Coverage | Without Coverage |
| Under $25,000 | 4,686 (88.6%) | 604 (11.4%) |
| $25,000 to $49,999 | 4,874 (94.0%) | 313 (6.0%) |
| $50,000 to $74,999 | 2,671 (95.7%) | 119 (4.3%) |
| $75,000 to $99,999 | 2,103 (90.9%) | 210 (9.1%) |
| $100,000 and over | 3,571 (96.1%) | 145 (3.9%) |
Public vs Private Health Insurance Coverage by Age in Buchanan County
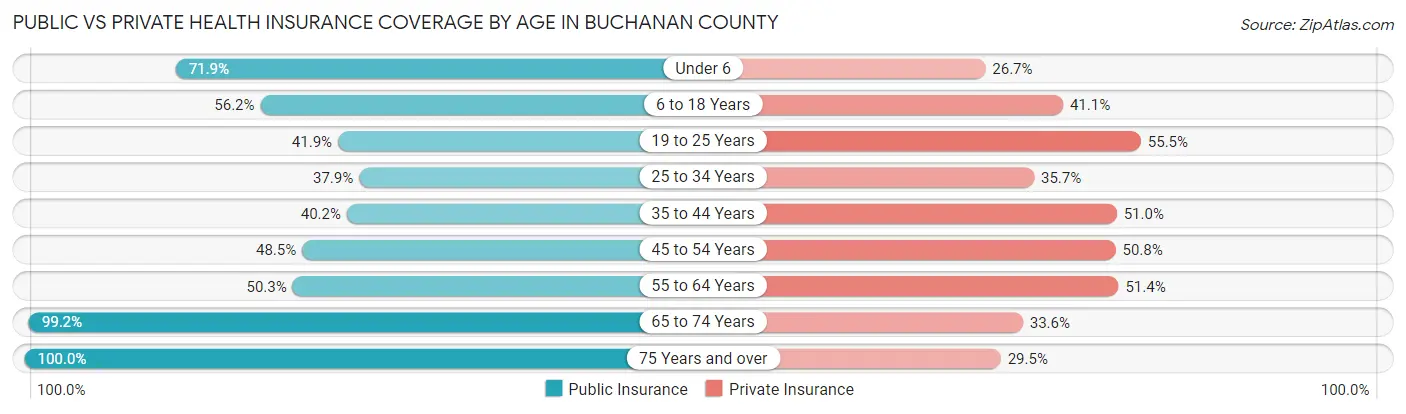
| Age Bracket | Public Insurance | Private Insurance |
| Under 6 | 710 (71.9%) | 263 (26.7%) |
| 6 to 18 Years | 1,415 (56.2%) | 1,033 (41.1%) |
| 19 to 25 Years | 585 (41.8%) | 776 (55.5%) |
| 25 to 34 Years | 727 (37.9%) | 684 (35.7%) |
| 35 to 44 Years | 857 (40.2%) | 1,088 (51.0%) |
| 45 to 54 Years | 1,343 (48.5%) | 1,407 (50.8%) |
| 55 to 64 Years | 1,566 (50.3%) | 1,600 (51.4%) |
| 65 to 74 Years | 2,619 (99.2%) | 887 (33.6%) |
| 75 Years and over | 1,844 (100.0%) | 544 (29.5%) |
| Total | 11,666 (60.4%) | 8,282 (42.9%) |
Disability Status by Sex by Age in Buchanan County
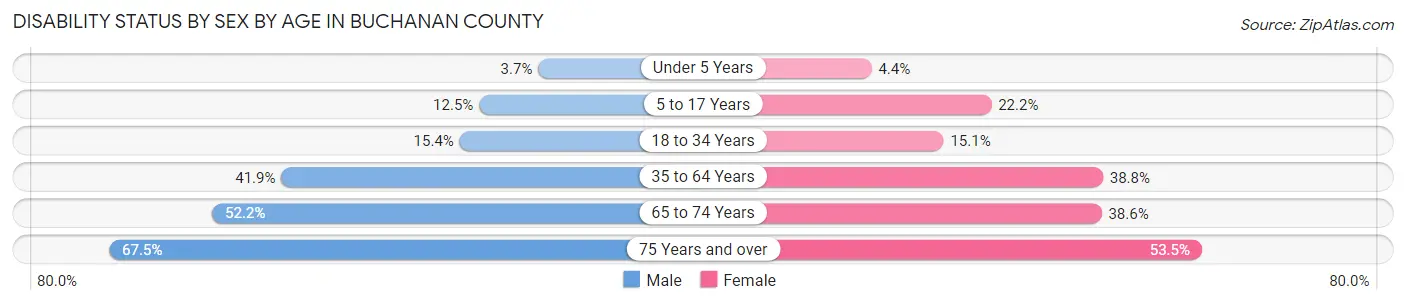
| Age Bracket | Male | Female |
| Under 5 Years | 16 (3.7%) | 18 (4.4%) |
| 5 to 17 Years | 158 (12.5%) | 272 (22.2%) |
| 18 to 34 Years | 298 (15.4%) | 235 (15.1%) |
| 35 to 64 Years | 1,724 (41.9%) | 1,511 (38.8%) |
| 65 to 74 Years | 652 (52.2%) | 536 (38.6%) |
| 75 Years and over | 541 (67.5%) | 557 (53.4%) |
Disability Class by Sex by Age in Buchanan County
Disability Class: Hearing Difficulty
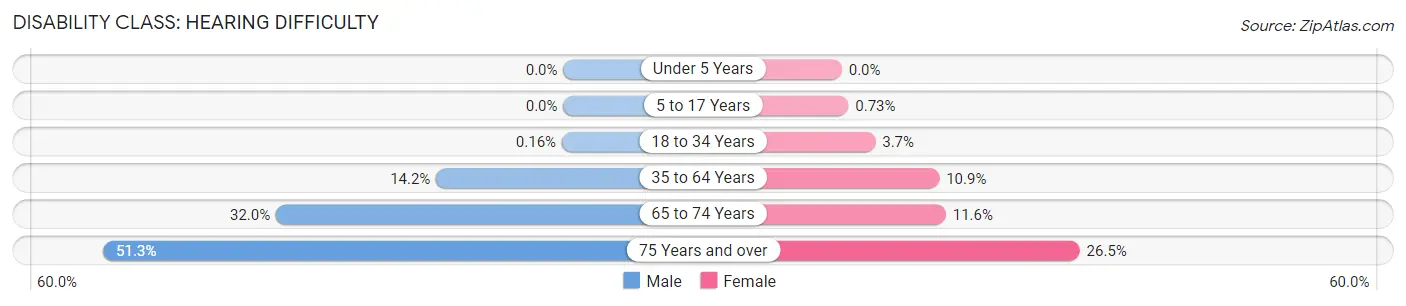
| Age Bracket | Male | Female |
| Under 5 Years | 0 (0.0%) | 0 (0.0%) |
| 5 to 17 Years | 0 (0.0%) | 9 (0.7%) |
| 18 to 34 Years | 3 (0.2%) | 58 (3.7%) |
| 35 to 64 Years | 583 (14.2%) | 423 (10.8%) |
| 65 to 74 Years | 400 (32.0%) | 161 (11.6%) |
| 75 Years and over | 411 (51.2%) | 276 (26.5%) |
Disability Class: Vision Difficulty
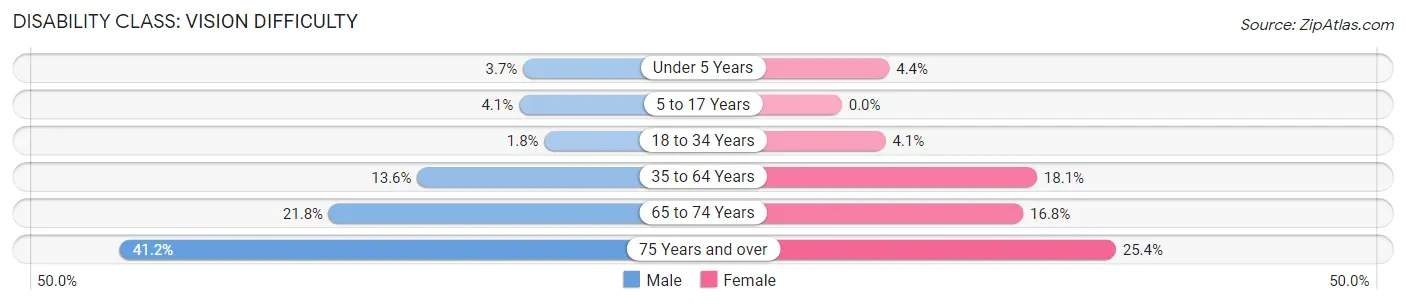
| Age Bracket | Male | Female |
| Under 5 Years | 16 (3.7%) | 18 (4.4%) |
| 5 to 17 Years | 52 (4.1%) | 0 (0.0%) |
| 18 to 34 Years | 34 (1.8%) | 63 (4.1%) |
| 35 to 64 Years | 558 (13.6%) | 706 (18.1%) |
| 65 to 74 Years | 272 (21.8%) | 234 (16.8%) |
| 75 Years and over | 330 (41.1%) | 265 (25.4%) |
Disability Class: Cognitive Difficulty
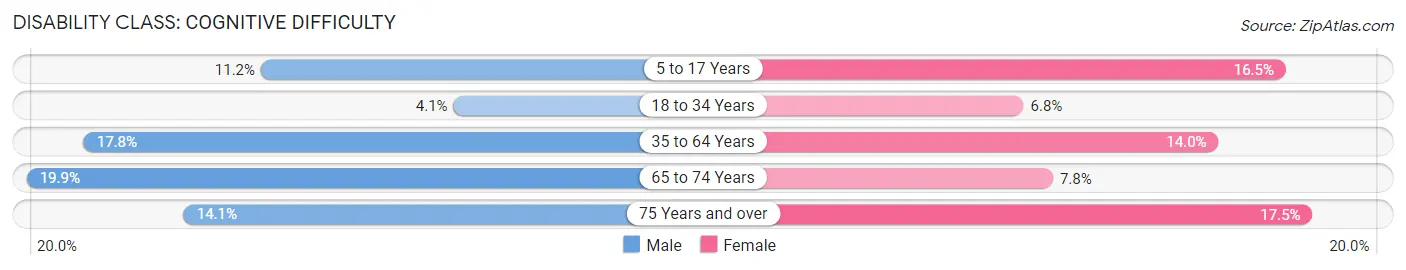
| Age Bracket | Male | Female |
| 5 to 17 Years | 142 (11.2%) | 202 (16.5%) |
| 18 to 34 Years | 79 (4.1%) | 105 (6.8%) |
| 35 to 64 Years | 733 (17.8%) | 545 (14.0%) |
| 65 to 74 Years | 249 (19.9%) | 109 (7.8%) |
| 75 Years and over | 113 (14.1%) | 182 (17.5%) |
Disability Class: Ambulatory Difficulty
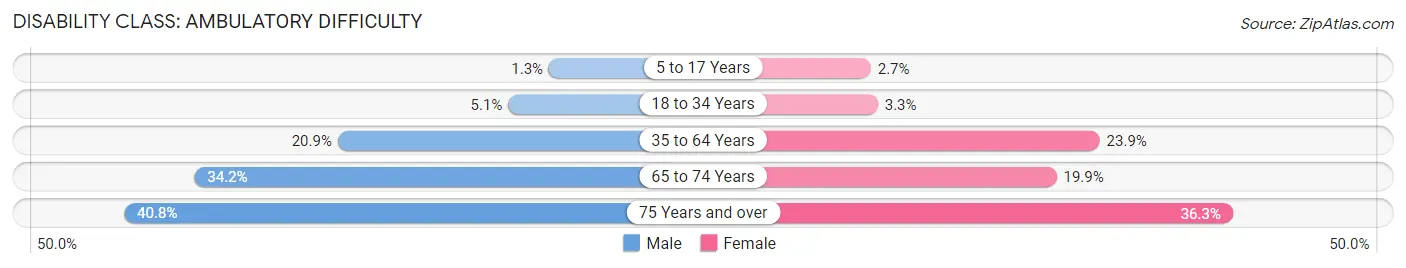
| Age Bracket | Male | Female |
| 5 to 17 Years | 17 (1.3%) | 33 (2.7%) |
| 18 to 34 Years | 99 (5.1%) | 52 (3.3%) |
| 35 to 64 Years | 862 (20.9%) | 933 (23.9%) |
| 65 to 74 Years | 428 (34.2%) | 277 (19.9%) |
| 75 Years and over | 327 (40.8%) | 378 (36.3%) |
Disability Class: Self-Care Difficulty
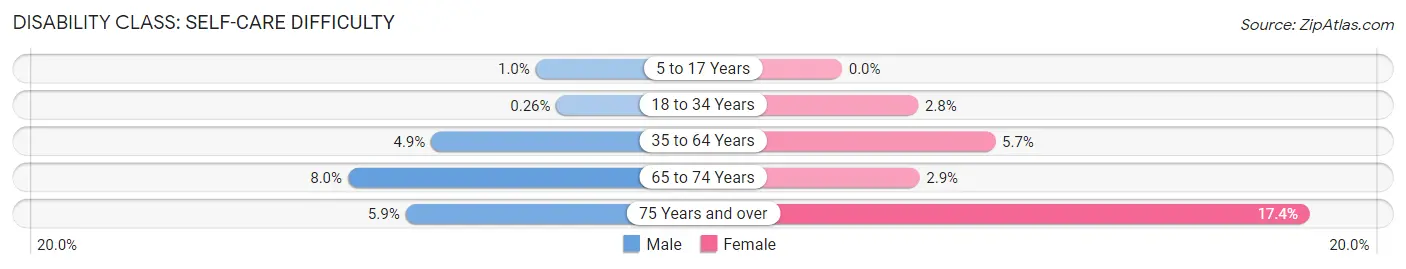
| Age Bracket | Male | Female |
| 5 to 17 Years | 13 (1.0%) | 0 (0.0%) |
| 18 to 34 Years | 5 (0.3%) | 44 (2.8%) |
| 35 to 64 Years | 202 (4.9%) | 222 (5.7%) |
| 65 to 74 Years | 100 (8.0%) | 40 (2.9%) |
| 75 Years and over | 47 (5.9%) | 181 (17.4%) |
Technology Access in Buchanan County
Computing Device Access in Buchanan County
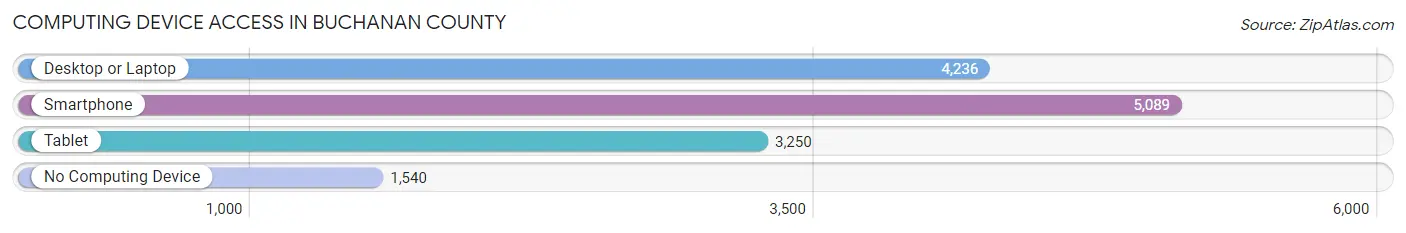
| Device Type | # Households | % Households |
| Desktop or Laptop | 4,236 | 56.5% |
| Smartphone | 5,089 | 67.9% |
| Tablet | 3,250 | 43.4% |
| No Computing Device | 1,540 | 20.5% |
| Total | 7,494 | 100.0% |
Internet Access in Buchanan County
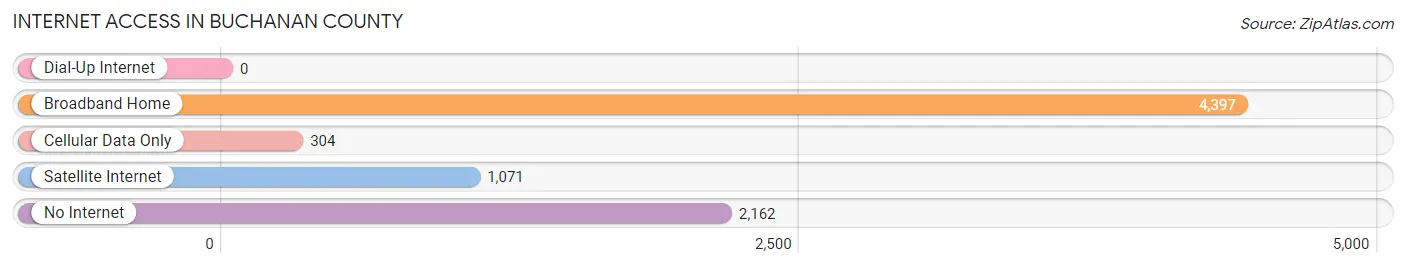
| Internet Type | # Households | % Households |
| Dial-Up Internet | 0 | 0.0% |
| Broadband Home | 4,397 | 58.7% |
| Cellular Data Only | 304 | 4.1% |
| Satellite Internet | 1,071 | 14.3% |
| No Internet | 2,162 | 28.8% |
| Total | 7,494 | 100.0% |
Buchanan County Summary
Buchanan County, Virginia is located in the southwestern part of the state, and is part of the Appalachian region. It is bordered by Dickenson County to the north, Russell County to the east, Tazewell County to the south, and Wise County to the west. The county seat is Grundy, and the county was named after James Buchanan, the 15th President of the United States.
Geography
Buchanan County is located in the Appalachian Mountains, and is part of the Cumberland Plateau. The county is mostly mountainous, with elevations ranging from 1,000 to 3,000 feet. The highest point in the county is Big A Mountain, which has an elevation of 3,093 feet. The county is home to several rivers, including the Russell Fork, the Levisa Fork, and the Pound River. The county is also home to several state parks, including Breaks Interstate Park, which is located on the Virginia-Kentucky border.
The county has a total area of 437 square miles, of which 435 square miles is land and 2 square miles is water. The county is home to several small towns, including Grundy, Vansant, Hurley, and Oakwood.
Economy
Buchanan County has a largely rural economy, with the majority of the population employed in agriculture and forestry. The county is home to several large coal mines, and coal mining is a major industry in the area. The county is also home to several timber companies, and timber harvesting is a major source of employment.
The county is home to several manufacturing companies, including a furniture factory, a paper mill, and a plastics plant. The county is also home to several small businesses, including restaurants, retail stores, and service providers.
Demographics
As of the 2010 census, Buchanan County had a population of 24,098. The population was spread out, with 19.7% under the age of 18, 8.2% from 18 to 24, 28.2% from 25 to 44, 25.2% from 45 to 64, and 18.7% who were 65 years of age or older. The median age was 40.2 years.
The median income for a household in the county was $30,945, and the median income for a family was $37,945. The per capita income for the county was $17,845. About 17.2% of the population was below the poverty line.
The racial makeup of the county was 97.2% White, 0.9% African American, 0.2% Native American, 0.2% Asian, 0.1% Pacific Islander, 0.4% from other races, and 1.0% from two or more races. Hispanic or Latino of any race were 1.2% of the population.
Conclusion
Buchanan County, Virginia is a rural county located in the Appalachian Mountains. The county is home to several coal mines, timber companies, and manufacturing companies, and is a major source of employment for the area. The county has a population of 24,098, and the median income for a household is $30,945. The racial makeup of the county is 97.2% White, 0.9% African American, 0.2% Native American, 0.2% Asian, 0.1% Pacific Islander, 0.4% from other races, and 1.0% from two or more races.
Common Questions
What is Per Capita Income in Buchanan County?
Per Capita income in Buchanan County is $24,126.
What is the Median Family Income in Buchanan County?
Median Family Income in Buchanan County is $46,783.
What is the Median Household income in Buchanan County?
Median Household Income in Buchanan County is $39,591.
What is Income or Wage Gap in Buchanan County?
Income or Wage Gap in Buchanan County is 28.4%.
Women in Buchanan County earn 71.6 cents for every dollar earned by a man.
What is Family Income Deficit in Buchanan County?
Family Income Deficit in Buchanan County is $11,656.
Families that are below poverty line in Buchanan County earn $11,656 less on average than the poverty threshold level.
What is Inequality or Gini Index in Buchanan County?
Inequality or Gini Index in Buchanan County is 0.47.
What is the Total Population of Buchanan County?
Total Population of Buchanan County is 20,246.
What is the Total Male Population of Buchanan County?
Total Male Population of Buchanan County is 10,504.
What is the Total Female Population of Buchanan County?
Total Female Population of Buchanan County is 9,742.
What is the Ratio of Males per 100 Females in Buchanan County?
There are 107.82 Males per 100 Females in Buchanan County.
What is the Ratio of Females per 100 Males in Buchanan County?
There are 92.75 Females per 100 Males in Buchanan County.
What is the Median Population Age in Buchanan County?
Median Population Age in Buchanan County is 47.6 Years.
What is the Average Family Size in Buchanan County
Average Family Size in Buchanan County is 3.1 People.
What is the Average Household Size in Buchanan County
Average Household Size in Buchanan County is 2.6 People.
How Large is the Labor Force in Buchanan County?
There are 6,376 People in the Labor Forcein in Buchanan County.
What is the Percentage of People in the Labor Force in Buchanan County?
36.7% of People are in the Labor Force in Buchanan County.
What is the Unemployment Rate in Buchanan County?
Unemployment Rate in Buchanan County is 6.0%.