Bristol city, VA Map & Demographics
Bristol city Map
Bristol city Overview
$30,419
PER CAPITA INCOME
$71,500
AVG FAMILY INCOME
$45,250
AVG HOUSEHOLD INCOME
19.2%
WAGE / INCOME GAP [ % ]
80.8¢/ $1
WAGE / INCOME GAP [ $ ]
$12,261
FAMILY INCOME DEFICIT
0.48
INEQUALITY / GINI INDEX
17,036
TOTAL POPULATION
8,213
MALE POPULATION
8,823
FEMALE POPULATION
93.09
MALES / 100 FEMALES
107.43
FEMALES / 100 MALES
43.7
MEDIAN AGE
3.1
AVG FAMILY SIZE
2.3
AVG HOUSEHOLD SIZE
7,745
LABOR FORCE [ PEOPLE ]
55.7%
PERCENT IN LABOR FORCE
4.1%
UNEMPLOYMENT RATE
Bristol city Area Codes
Income in Bristol city
Income Overview in Bristol city
Per Capita Income in Bristol city is $30,419, while median incomes of families and households are $71,500 and $45,250 respectively.
| Characteristic | Number | Measure |
| Per Capita Income | 17,036 | $30,419 |
| Median Family Income | 4,166 | $71,500 |
| Mean Family Income | 4,166 | $86,539 |
| Median Household Income | 7,299 | $45,250 |
| Mean Household Income | 7,299 | $66,716 |
| Income Deficit | 4,166 | $12,261 |
| Wage / Income Gap (%) | 17,036 | 19.23% |
| Wage / Income Gap ($) | 17,036 | 80.77¢ per $1 |
| Gini / Inequality Index | 17,036 | 0.48 |
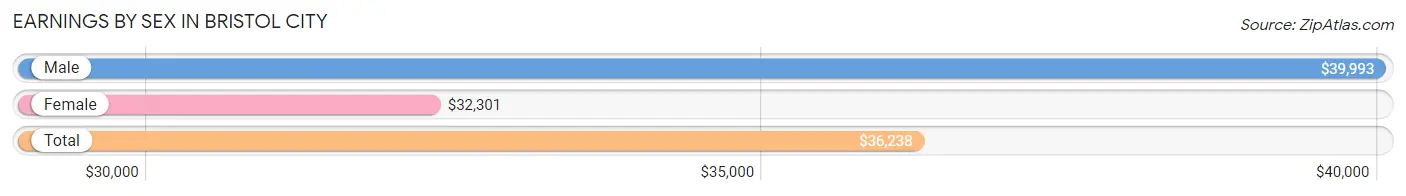
Earnings by Sex in Bristol city
Average Earnings in Bristol city are $36,238, $39,993 for men and $32,301 for women, a difference of 19.2%.
| Sex | Number | Average Earnings |
| Male | 4,219 (51.3%) | $39,993 |
| Female | 4,010 (48.7%) | $32,301 |
| Total | 8,229 (100.0%) | $36,238 |
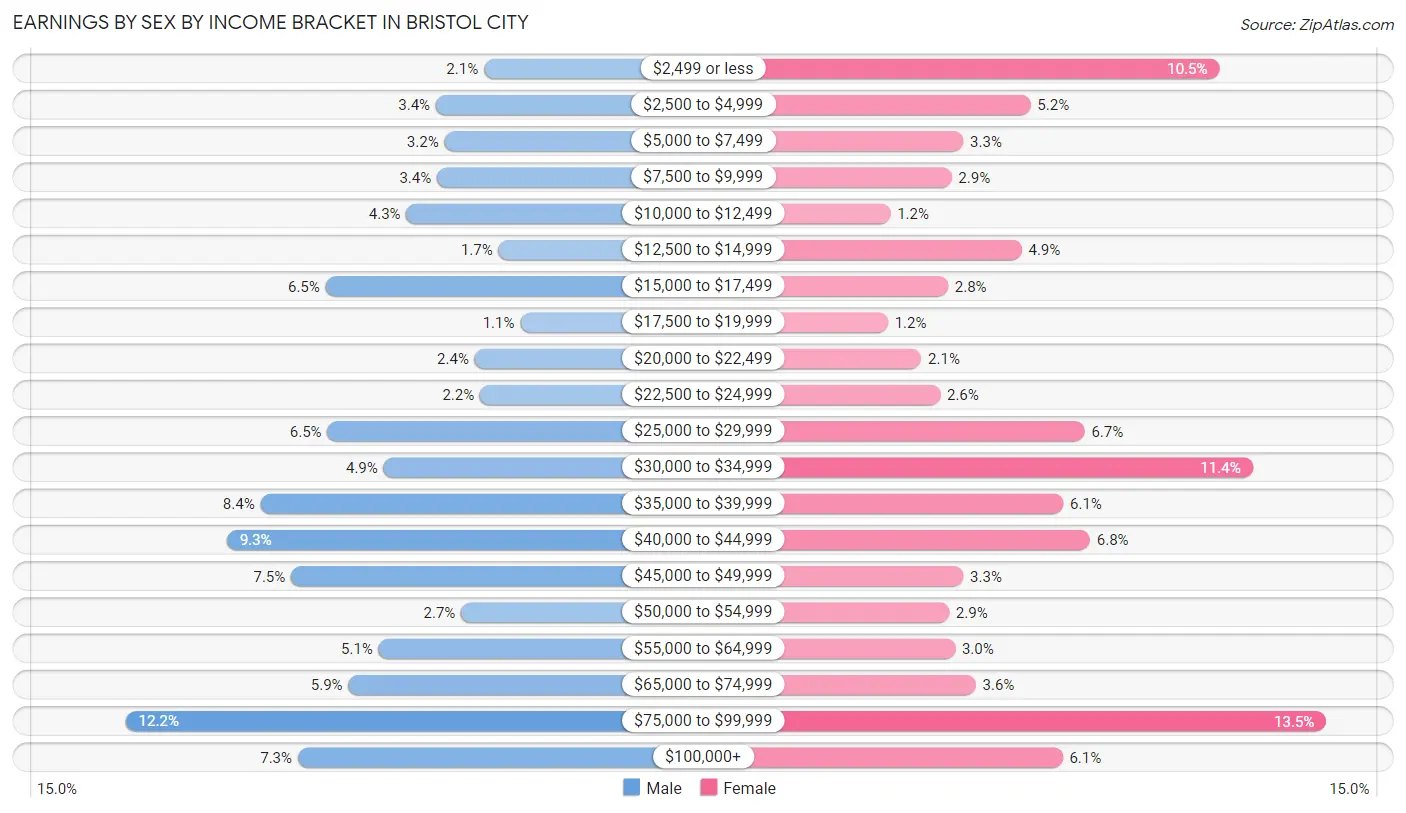
Earnings by Sex by Income Bracket in Bristol city
The most common earnings brackets in Bristol city are $75,000 to $99,999 for men (513 | 12.2%) and $75,000 to $99,999 for women (540 | 13.5%).
| Income | Male | Female |
| $2,499 or less | 88 (2.1%) | 420 (10.5%) |
| $2,500 to $4,999 | 145 (3.4%) | 207 (5.2%) |
| $5,000 to $7,499 | 135 (3.2%) | 131 (3.3%) |
| $7,500 to $9,999 | 144 (3.4%) | 118 (2.9%) |
| $10,000 to $12,499 | 180 (4.3%) | 49 (1.2%) |
| $12,500 to $14,999 | 71 (1.7%) | 197 (4.9%) |
| $15,000 to $17,499 | 276 (6.5%) | 114 (2.8%) |
| $17,500 to $19,999 | 45 (1.1%) | 46 (1.1%) |
| $20,000 to $22,499 | 99 (2.4%) | 84 (2.1%) |
| $22,500 to $24,999 | 93 (2.2%) | 105 (2.6%) |
| $25,000 to $29,999 | 274 (6.5%) | 268 (6.7%) |
| $30,000 to $34,999 | 207 (4.9%) | 457 (11.4%) |
| $35,000 to $39,999 | 353 (8.4%) | 244 (6.1%) |
| $40,000 to $44,999 | 393 (9.3%) | 274 (6.8%) |
| $45,000 to $49,999 | 317 (7.5%) | 131 (3.3%) |
| $50,000 to $54,999 | 115 (2.7%) | 115 (2.9%) |
| $55,000 to $64,999 | 213 (5.1%) | 122 (3.0%) |
| $65,000 to $74,999 | 249 (5.9%) | 145 (3.6%) |
| $75,000 to $99,999 | 513 (12.2%) | 540 (13.5%) |
| $100,000+ | 309 (7.3%) | 243 (6.1%) |
| Total | 4,219 (100.0%) | 4,010 (100.0%) |
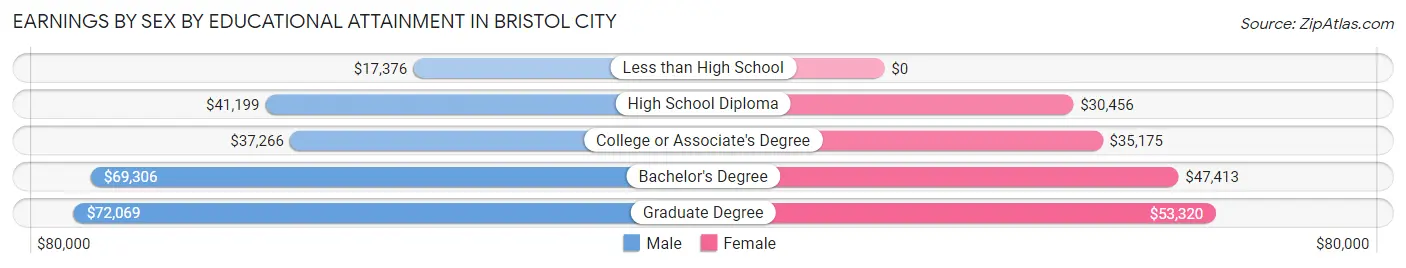
Earnings by Sex by Educational Attainment in Bristol city
Average earnings in Bristol city are $42,386 for men and $36,684 for women, a difference of 13.5%. Men with an educational attainment of graduate degree enjoy the highest average annual earnings of $72,069, while those with less than high school education earn the least with $17,376. Women with an educational attainment of graduate degree earn the most with the average annual earnings of $53,320, while those with high school diploma education have the smallest earnings of $30,456.
| Educational Attainment | Male Income | Female Income |
| Less than High School | $17,376 | $0 |
| High School Diploma | $41,199 | $30,456 |
| College or Associate's Degree | $37,266 | $35,175 |
| Bachelor's Degree | $69,306 | $47,413 |
| Graduate Degree | $72,069 | $53,320 |
| Total | $42,386 | $36,684 |
Family Income in Bristol city
Family Income Brackets in Bristol city
According to the Bristol city family income data, there are 821 families falling into the $100,000 to $149,999 income range, which is the most common income bracket and makes up 19.7% of all families. Conversely, the $10,000 to $14,999 income bracket is the least frequent group with only 117 families (2.8%) belonging to this category.
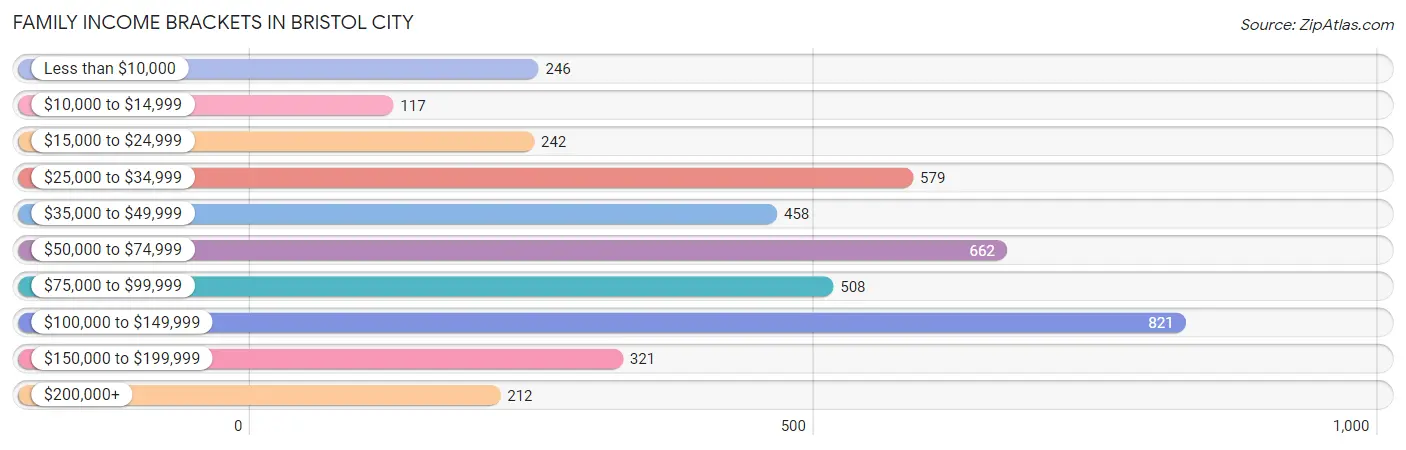
| Income Bracket | # Families | % Families |
| Less than $10,000 | 246 | 5.9% |
| $10,000 to $14,999 | 117 | 2.8% |
| $15,000 to $24,999 | 242 | 5.8% |
| $25,000 to $34,999 | 579 | 13.9% |
| $35,000 to $49,999 | 458 | 11.0% |
| $50,000 to $74,999 | 662 | 15.9% |
| $75,000 to $99,999 | 508 | 12.2% |
| $100,000 to $149,999 | 821 | 19.7% |
| $150,000 to $199,999 | 321 | 7.7% |
| $200,000+ | 212 | 5.1% |
Family Income by Famaliy Size in Bristol city
6-person families (98 | 2.4%) account for the highest median family income in Bristol city with $142,727 per family, while 2-person families (2,503 | 60.1%) have the highest median income of $35,570 per family member.
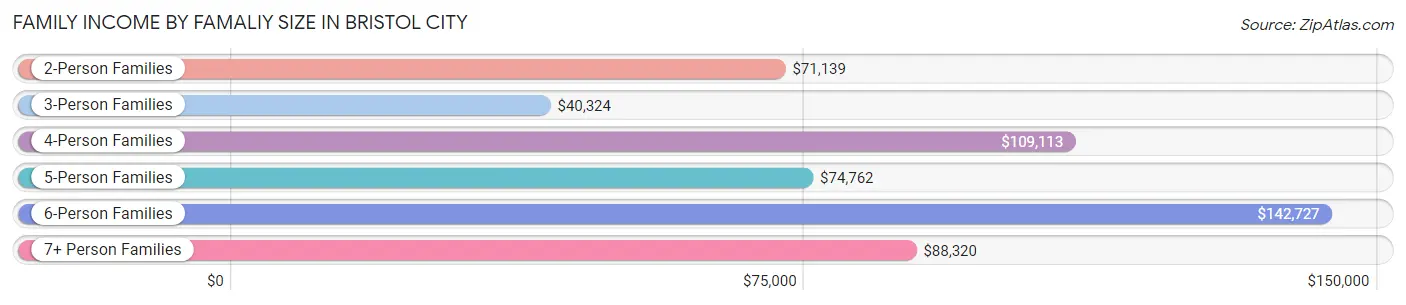
| Income Bracket | # Families | Median Income |
| 2-Person Families | 2,503 (60.1%) | $71,139 |
| 3-Person Families | 926 (22.2%) | $40,324 |
| 4-Person Families | 368 (8.8%) | $109,113 |
| 5-Person Families | 178 (4.3%) | $74,762 |
| 6-Person Families | 98 (2.4%) | $142,727 |
| 7+ Person Families | 93 (2.2%) | $88,320 |
| Total | 4,166 (100.0%) | $71,500 |
Family Income by Number of Earners in Bristol city
The median family income in Bristol city is $71,500, with families comprising 3+ earners (279) having the highest median family income of $120,233, while families with no earners (701) have the lowest median family income of $39,238, accounting for 6.7% and 16.8% of families, respectively.
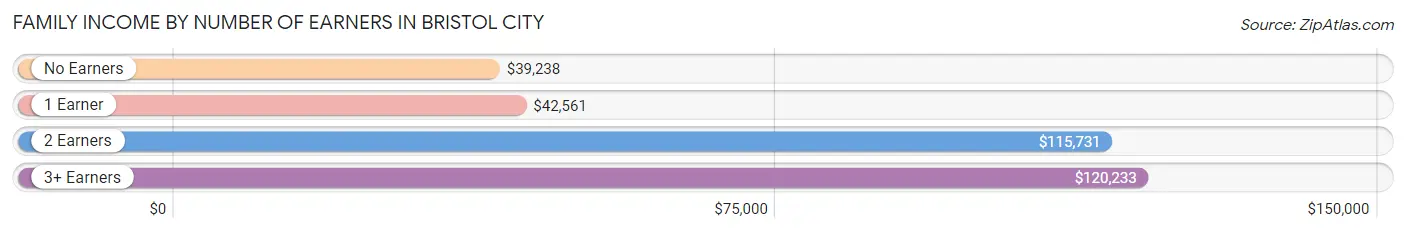
| Number of Earners | # Families | Median Income |
| No Earners | 701 (16.8%) | $39,238 |
| 1 Earner | 1,712 (41.1%) | $42,561 |
| 2 Earners | 1,474 (35.4%) | $115,731 |
| 3+ Earners | 279 (6.7%) | $120,233 |
| Total | 4,166 (100.0%) | $71,500 |
Household Income in Bristol city
Household Income Brackets in Bristol city
With 1,299 households falling in the category, the $35,000 to $49,999 income range is the most frequent in Bristol city, accounting for 17.8% of all households. In contrast, only 255 households (3.5%) fall into the $200,000+ income bracket, making it the least populous group.
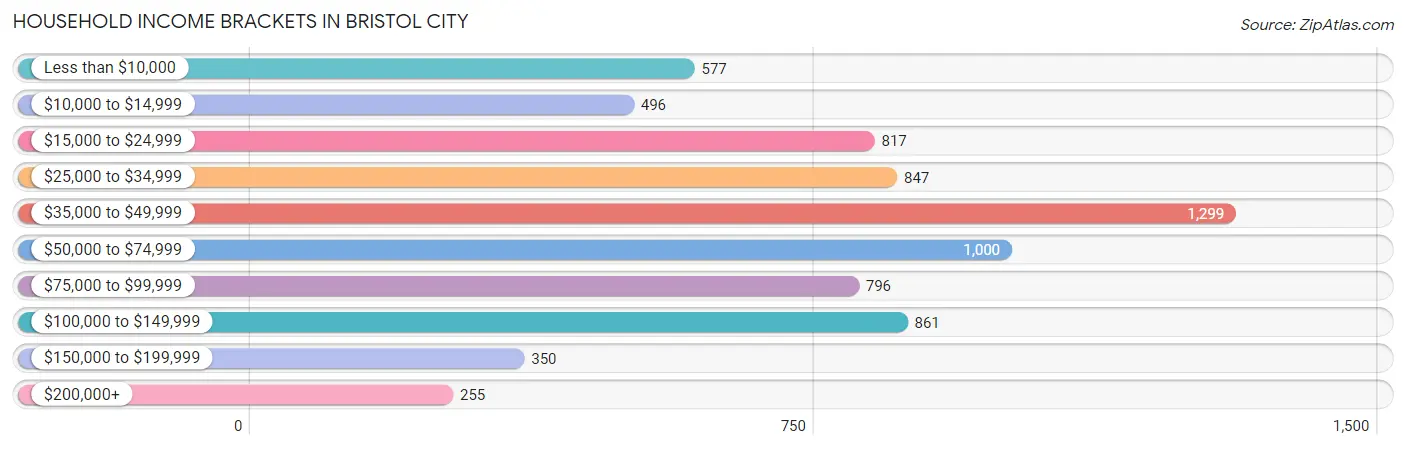
| Income Bracket | # Households | % Households |
| Less than $10,000 | 577 | 7.9% |
| $10,000 to $14,999 | 496 | 6.8% |
| $15,000 to $24,999 | 817 | 11.2% |
| $25,000 to $34,999 | 847 | 11.6% |
| $35,000 to $49,999 | 1,299 | 17.8% |
| $50,000 to $74,999 | 1,000 | 13.7% |
| $75,000 to $99,999 | 796 | 10.9% |
| $100,000 to $149,999 | 861 | 11.8% |
| $150,000 to $199,999 | 350 | 4.8% |
| $200,000+ | 255 | 3.5% |
Household Income by Householder Age in Bristol city
The median household income in Bristol city is $45,250, with the highest median household income of $73,018 found in the 45 to 64 years age bracket for the primary householder. A total of 2,396 households (32.8%) fall into this category. Meanwhile, the 15 to 24 years age bracket for the primary householder has the lowest median household income of $37,848, with 334 households (4.6%) in this group.
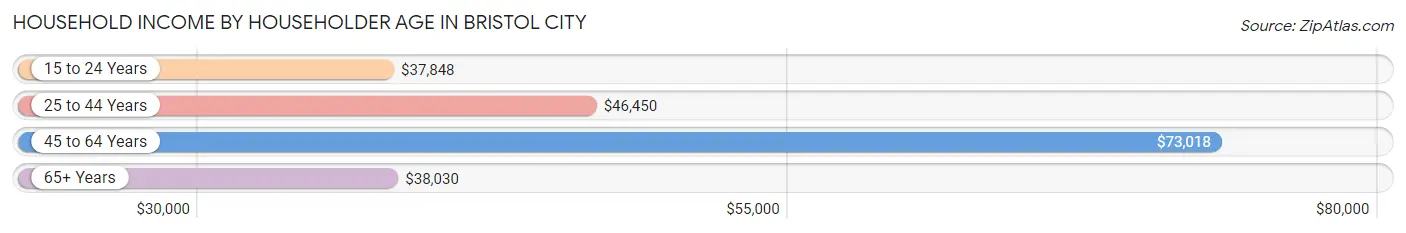
| Income Bracket | # Households | Median Income |
| 15 to 24 Years | 334 (4.6%) | $37,848 |
| 25 to 44 Years | 1,906 (26.1%) | $46,450 |
| 45 to 64 Years | 2,396 (32.8%) | $73,018 |
| 65+ Years | 2,663 (36.5%) | $38,030 |
| Total | 7,299 (100.0%) | $45,250 |
Poverty in Bristol city
Income Below Poverty by Sex and Age in Bristol city
With 15.9% poverty level for males and 17.9% for females among the residents of Bristol city, 15 year old males and under 5 year old females are the most vulnerable to poverty, with 80 males (40.4%) and 162 females (47.5%) in their respective age groups living below the poverty level.
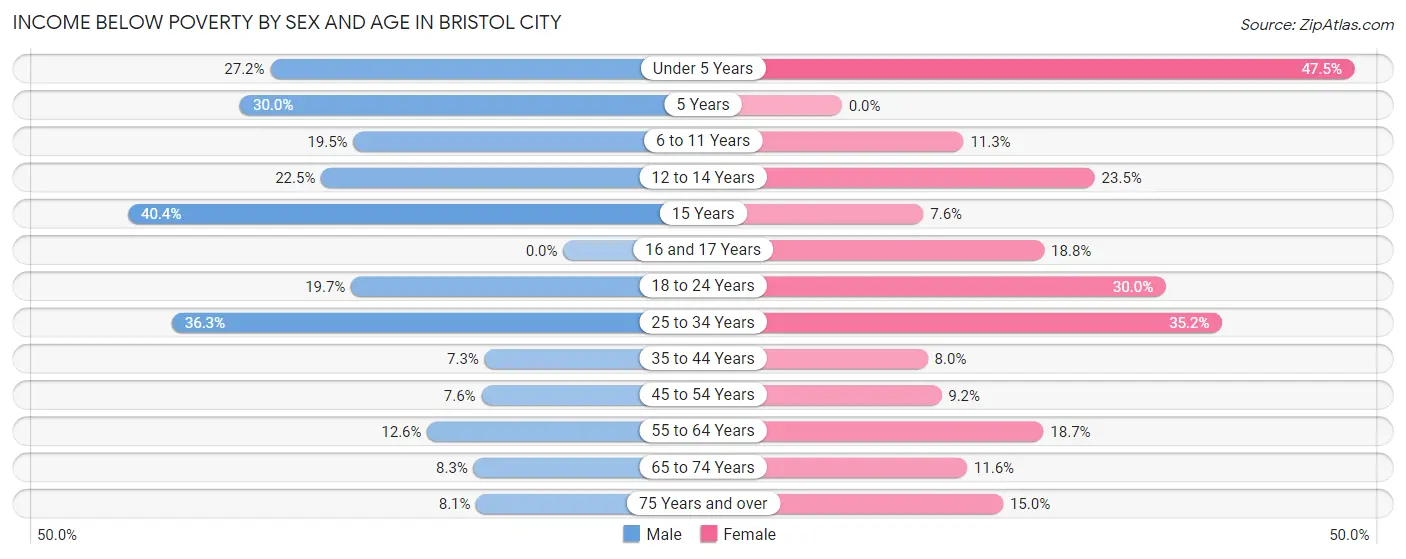
| Age Bracket | Male | Female |
| Under 5 Years | 143 (27.2%) | 162 (47.5%) |
| 5 Years | 12 (30.0%) | 0 (0.0%) |
| 6 to 11 Years | 97 (19.5%) | 72 (11.3%) |
| 12 to 14 Years | 91 (22.5%) | 50 (23.5%) |
| 15 Years | 80 (40.4%) | 14 (7.6%) |
| 16 and 17 Years | 0 (0.0%) | 37 (18.8%) |
| 18 to 24 Years | 141 (19.7%) | 174 (30.0%) |
| 25 to 34 Years | 299 (36.3%) | 350 (35.2%) |
| 35 to 44 Years | 82 (7.3%) | 81 (8.0%) |
| 45 to 54 Years | 78 (7.6%) | 92 (9.2%) |
| 55 to 64 Years | 132 (12.6%) | 212 (18.7%) |
| 65 to 74 Years | 80 (8.3%) | 134 (11.6%) |
| 75 Years and over | 53 (8.1%) | 174 (15.0%) |
| Total | 1,288 (15.9%) | 1,552 (17.9%) |
Income Above Poverty by Sex and Age in Bristol city
According to the poverty statistics in Bristol city, males aged 16 and 17 years and females aged 5 years are the age groups that are most secure financially, with 100.0% of males and 100.0% of females in these age groups living above the poverty line.
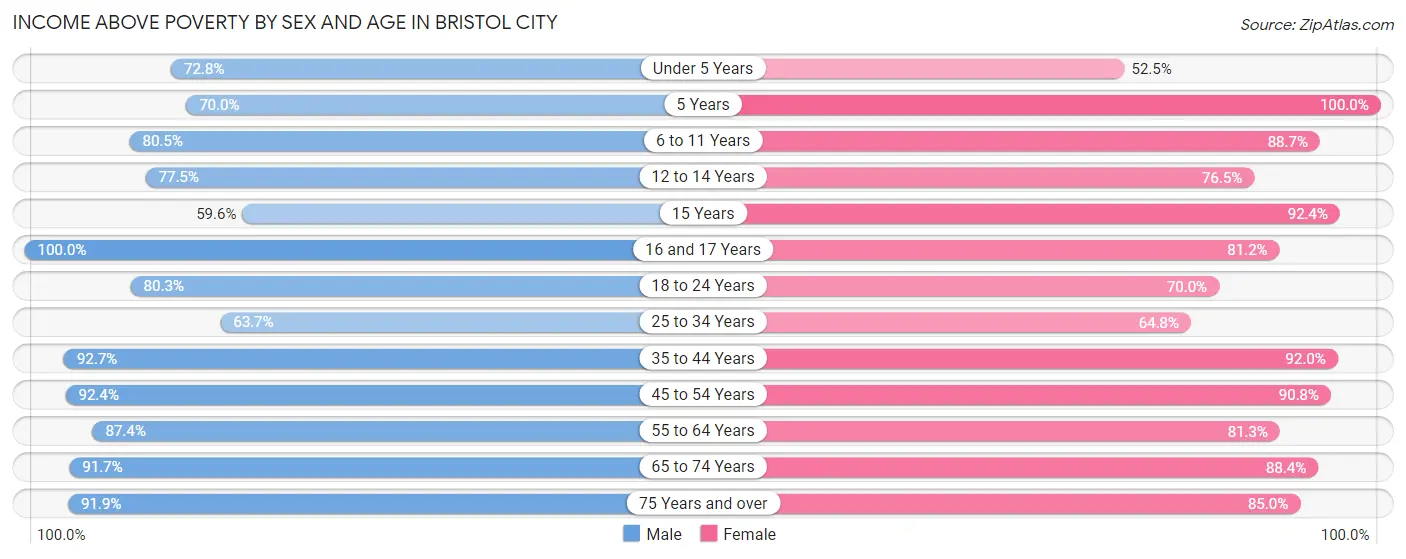
| Age Bracket | Male | Female |
| Under 5 Years | 383 (72.8%) | 179 (52.5%) |
| 5 Years | 28 (70.0%) | 60 (100.0%) |
| 6 to 11 Years | 401 (80.5%) | 566 (88.7%) |
| 12 to 14 Years | 314 (77.5%) | 163 (76.5%) |
| 15 Years | 118 (59.6%) | 171 (92.4%) |
| 16 and 17 Years | 61 (100.0%) | 160 (81.2%) |
| 18 to 24 Years | 575 (80.3%) | 406 (70.0%) |
| 25 to 34 Years | 524 (63.7%) | 644 (64.8%) |
| 35 to 44 Years | 1,041 (92.7%) | 935 (92.0%) |
| 45 to 54 Years | 948 (92.4%) | 905 (90.8%) |
| 55 to 64 Years | 914 (87.4%) | 921 (81.3%) |
| 65 to 74 Years | 881 (91.7%) | 1,020 (88.4%) |
| 75 Years and over | 604 (91.9%) | 989 (85.0%) |
| Total | 6,792 (84.1%) | 7,119 (82.1%) |
Income Below Poverty Among Married-Couple Families in Bristol city
The poverty statistics for married-couple families in Bristol city show that 6.0% or 160 of the total 2,663 families live below the poverty line. Families with 5 or more children have the highest poverty rate of 100.0%, comprising of 17 families. On the other hand, families with 3 or 4 children have the lowest poverty rate of 1.8%, which includes 3 families.
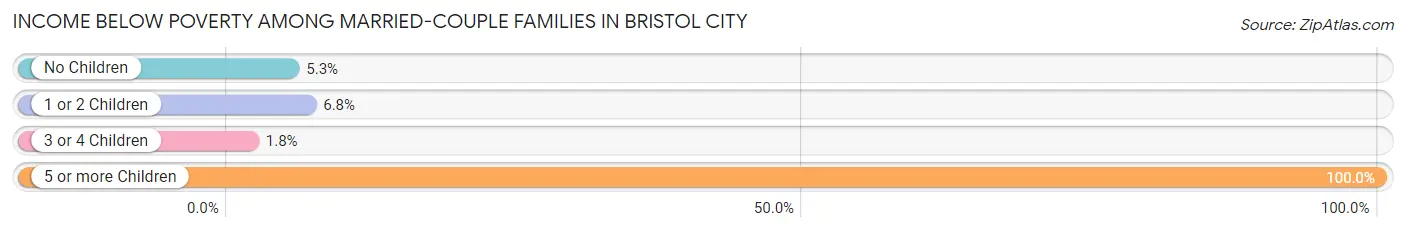
| Children | Above Poverty | Below Poverty |
| No Children | 1,861 (94.7%) | 105 (5.3%) |
| 1 or 2 Children | 479 (93.2%) | 35 (6.8%) |
| 3 or 4 Children | 163 (98.2%) | 3 (1.8%) |
| 5 or more Children | 0 (0.0%) | 17 (100.0%) |
| Total | 2,503 (94.0%) | 160 (6.0%) |
Income Below Poverty Among Single-Parent Households in Bristol city
According to the poverty data in Bristol city, 12.3% or 42 single-father households and 22.4% or 260 single-mother households are living below the poverty line. Among single-father households, those with no children have the highest poverty rate, with 16 households (12.5%) experiencing poverty. Likewise, among single-mother households, those with 5 or more children have the highest poverty rate, with 22 households (55.0%) falling below the poverty line.
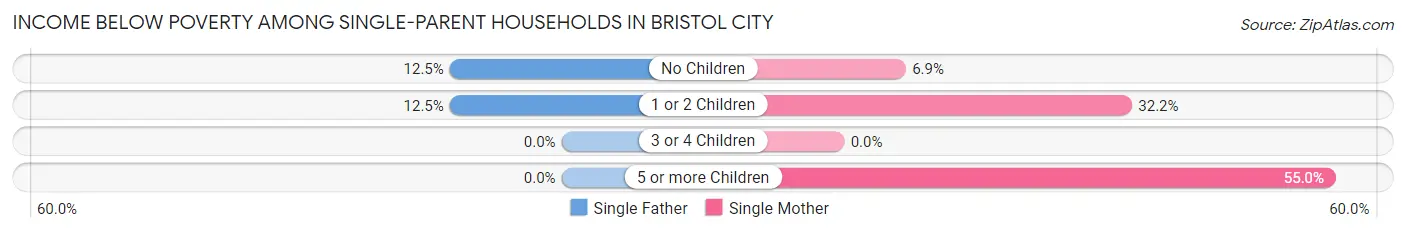
| Children | Single Father | Single Mother |
| No Children | 16 (12.5%) | 30 (6.9%) |
| 1 or 2 Children | 26 (12.5%) | 208 (32.2%) |
| 3 or 4 Children | 0 (0.0%) | 0 (0.0%) |
| 5 or more Children | 0 (0.0%) | 22 (55.0%) |
| Total | 42 (12.3%) | 260 (22.4%) |
Income Below Poverty Among Married-Couple vs Single-Parent Households in Bristol city
The poverty data for Bristol city shows that 160 of the married-couple family households (6.0%) and 302 of the single-parent households (20.1%) are living below the poverty level. Within the married-couple family households, those with 5 or more children have the highest poverty rate, with 17 households (100.0%) falling below the poverty line. Among the single-parent households, those with 5 or more children have the highest poverty rate, with 22 household (55.0%) living below poverty.
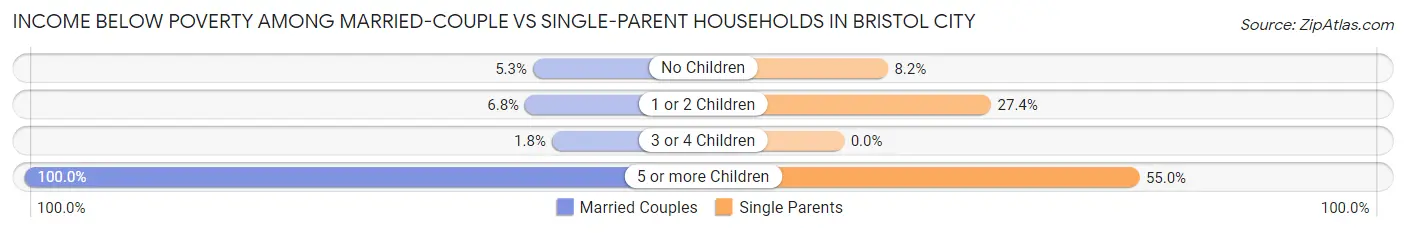
| Children | Married-Couple Families | Single-Parent Households |
| No Children | 105 (5.3%) | 46 (8.2%) |
| 1 or 2 Children | 35 (6.8%) | 234 (27.4%) |
| 3 or 4 Children | 3 (1.8%) | 0 (0.0%) |
| 5 or more Children | 17 (100.0%) | 22 (55.0%) |
| Total | 160 (6.0%) | 302 (20.1%) |
Race in Bristol city
The most populous races in Bristol city are White / Caucasian (14,892 | 87.4%), Black / African American (1,066 | 6.3%), and Two or more Races (857 | 5.0%).
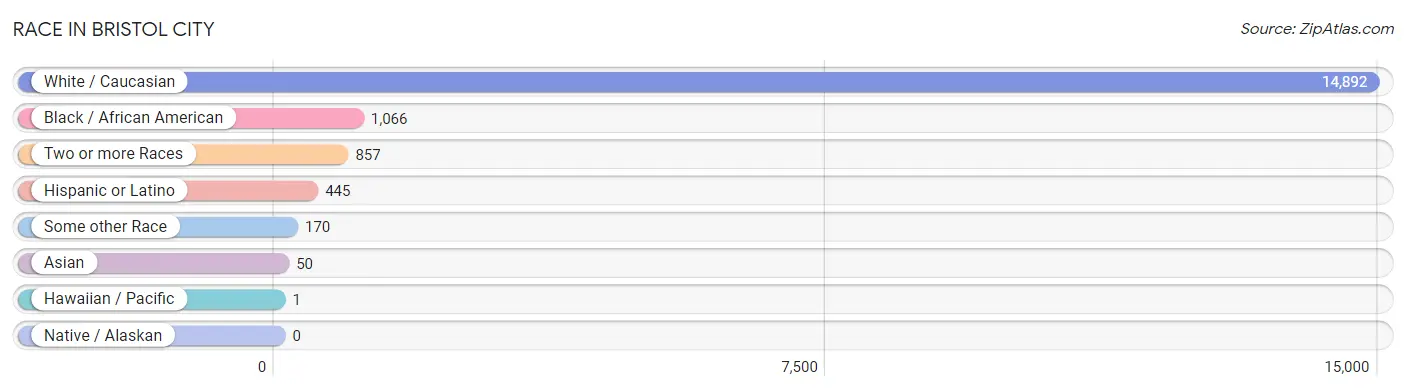
| Race | # Population | % Population |
| Asian | 50 | 0.3% |
| Black / African American | 1,066 | 6.3% |
| Hawaiian / Pacific | 1 | 0.0% |
| Hispanic or Latino | 445 | 2.6% |
| Native / Alaskan | 0 | 0.0% |
| White / Caucasian | 14,892 | 87.4% |
| Two or more Races | 857 | 5.0% |
| Some other Race | 170 | 1.0% |
| Total | 17,036 | 100.0% |
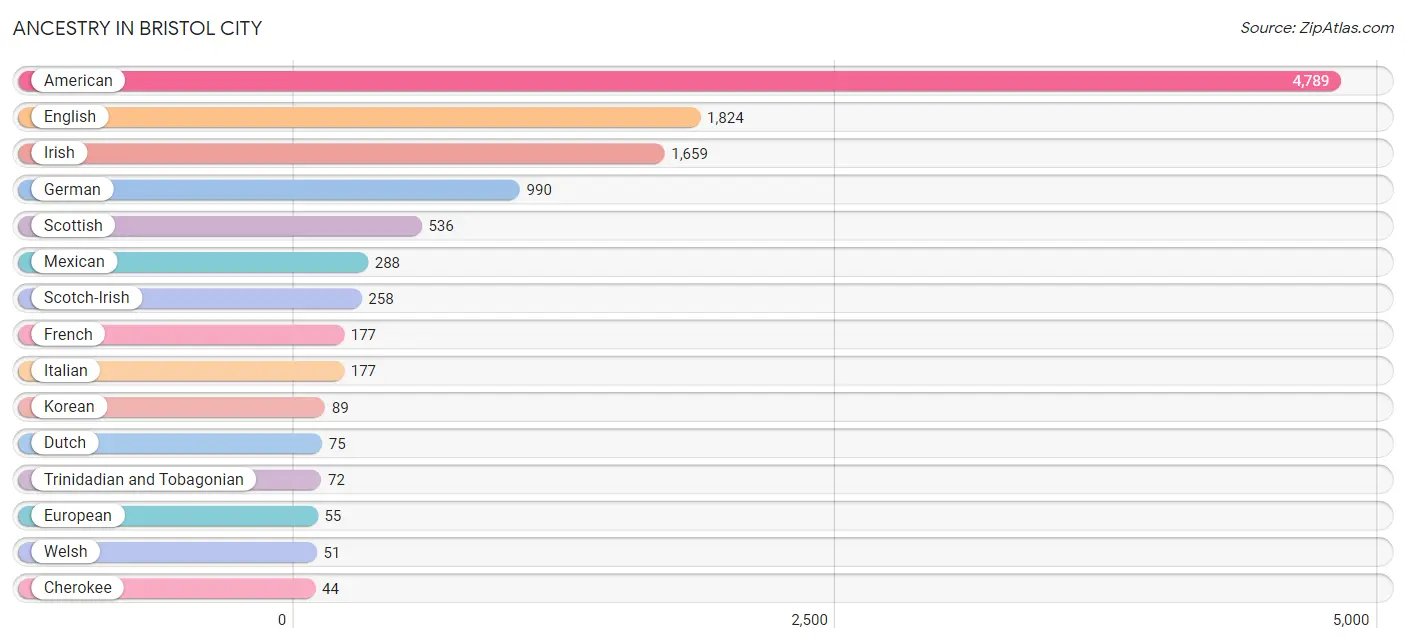
Ancestry in Bristol city
The most populous ancestries reported in Bristol city are American (4,789 | 28.1%), English (1,824 | 10.7%), Irish (1,659 | 9.7%), German (990 | 5.8%), and Scottish (536 | 3.2%), together accounting for 57.5% of all Bristol city residents.
| Ancestry | # Population | % Population |
| African | 9 | 0.1% |
| American | 4,789 | 28.1% |
| Arab | 23 | 0.1% |
| Austrian | 10 | 0.1% |
| Bhutanese | 1 | 0.0% |
| British | 34 | 0.2% |
| Burmese | 30 | 0.2% |
| Central American | 36 | 0.2% |
| Cherokee | 44 | 0.3% |
| Dutch | 75 | 0.4% |
| Egyptian | 23 | 0.1% |
| English | 1,824 | 10.7% |
| Ethiopian | 1 | 0.0% |
| European | 55 | 0.3% |
| French | 177 | 1.0% |
| French Canadian | 17 | 0.1% |
| German | 990 | 5.8% |
| Haitian | 44 | 0.3% |
| Hungarian | 30 | 0.2% |
| Irish | 1,659 | 9.7% |
| Italian | 177 | 1.0% |
| Jamaican | 39 | 0.2% |
| Korean | 89 | 0.5% |
| Mexican | 288 | 1.7% |
| Mongolian | 2 | 0.0% |
| Native Hawaiian | 1 | 0.0% |
| Nicaraguan | 36 | 0.2% |
| Norwegian | 40 | 0.2% |
| Polish | 6 | 0.0% |
| Portuguese | 22 | 0.1% |
| Puerto Rican | 40 | 0.2% |
| Romanian | 30 | 0.2% |
| Russian | 42 | 0.3% |
| Scandinavian | 26 | 0.2% |
| Scotch-Irish | 258 | 1.5% |
| Scottish | 536 | 3.2% |
| South American | 6 | 0.0% |
| Subsaharan African | 10 | 0.1% |
| Swedish | 6 | 0.0% |
| Swiss | 8 | 0.1% |
| Trinidadian and Tobagonian | 72 | 0.4% |
| Venezuelan | 6 | 0.0% |
| Welsh | 51 | 0.3% |
| Yugoslavian | 5 | 0.0% | View All 44 Rows |
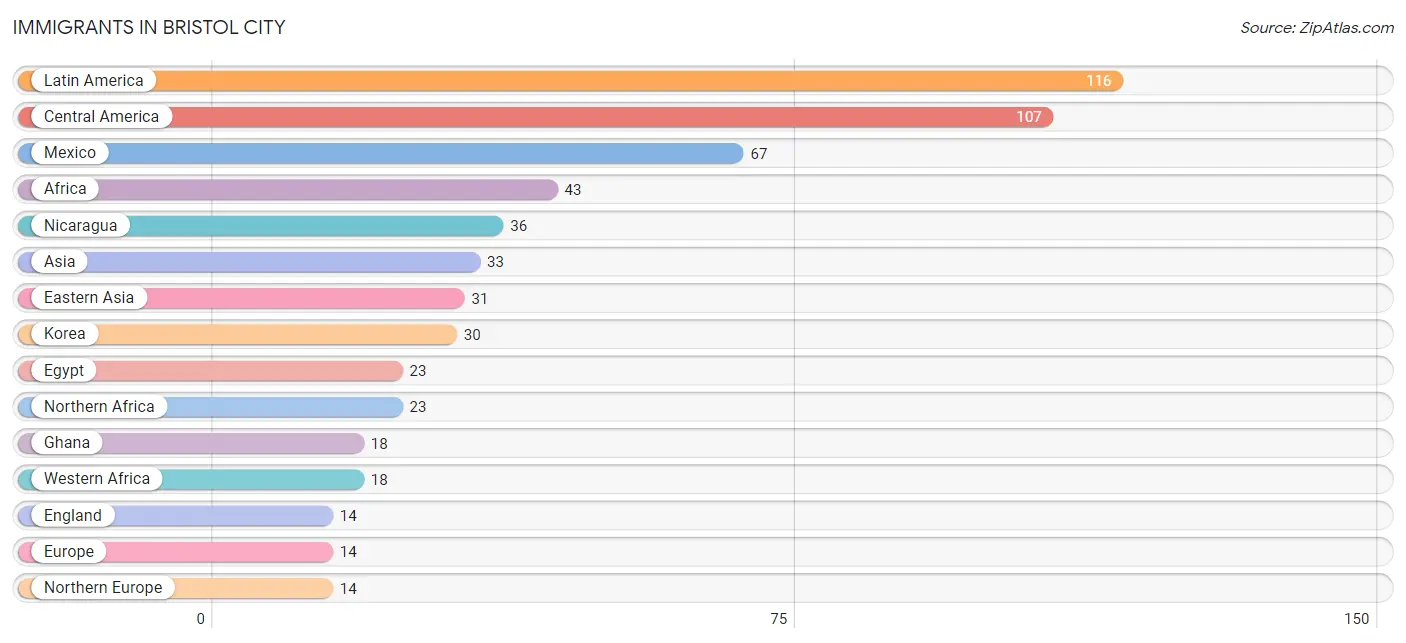
Immigrants in Bristol city
The most numerous immigrant groups reported in Bristol city came from Latin America (116 | 0.7%), Central America (107 | 0.6%), Mexico (67 | 0.4%), Africa (43 | 0.3%), and Nicaragua (36 | 0.2%), together accounting for 2.2% of all Bristol city residents.
| Immigration Origin | # Population | % Population |
| Africa | 43 | 0.3% |
| Asia | 33 | 0.2% |
| Central America | 107 | 0.6% |
| Chile | 9 | 0.1% |
| Eastern Africa | 2 | 0.0% |
| Eastern Asia | 31 | 0.2% |
| Egypt | 23 | 0.1% |
| England | 14 | 0.1% |
| Ethiopia | 1 | 0.0% |
| Europe | 14 | 0.1% |
| Ghana | 18 | 0.1% |
| Japan | 1 | 0.0% |
| Korea | 30 | 0.2% |
| Latin America | 116 | 0.7% |
| Malaysia | 2 | 0.0% |
| Mexico | 67 | 0.4% |
| Nicaragua | 36 | 0.2% |
| Northern Africa | 23 | 0.1% |
| Northern Europe | 14 | 0.1% |
| Panama | 4 | 0.0% |
| South America | 9 | 0.1% |
| South Eastern Asia | 2 | 0.0% |
| Western Africa | 18 | 0.1% | View All 23 Rows |
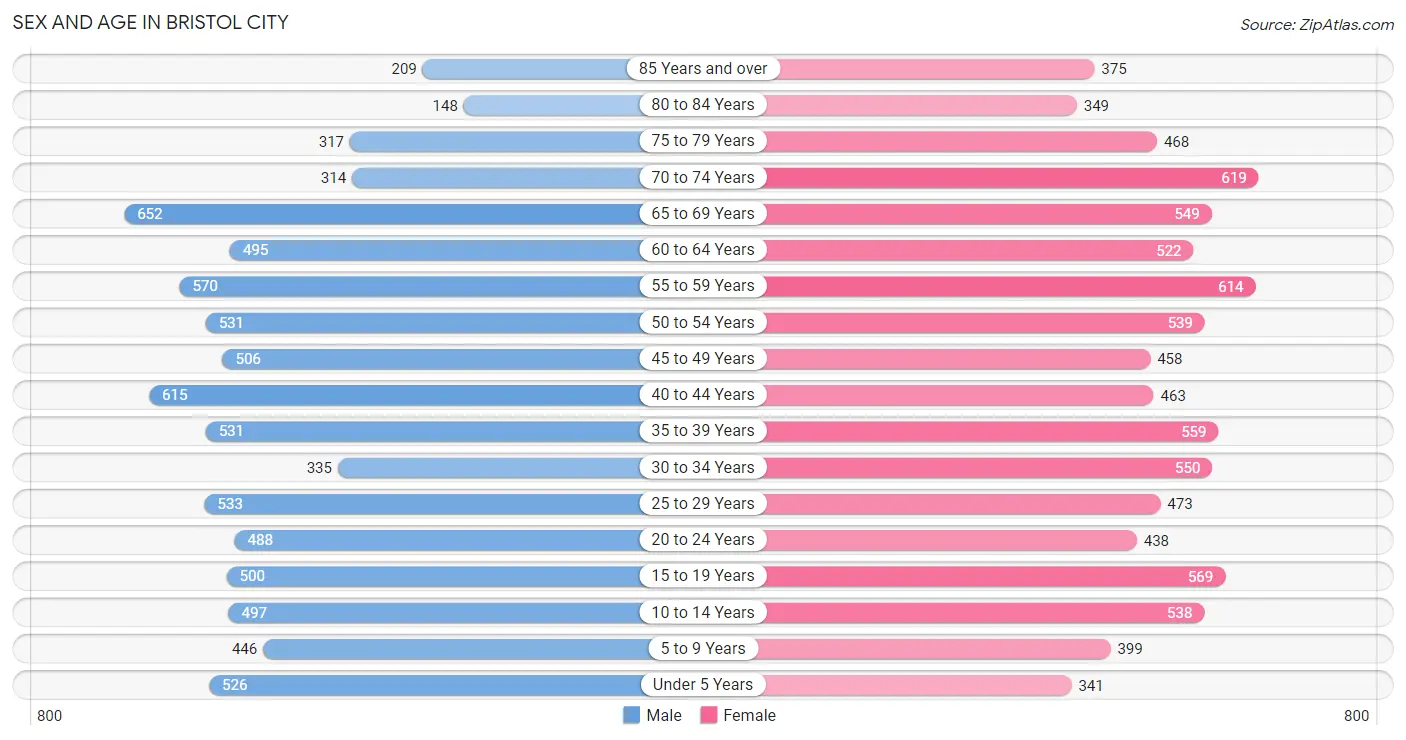
Sex and Age in Bristol city
Sex and Age in Bristol city
The most populous age groups in Bristol city are 65 to 69 Years (652 | 7.9%) for men and 70 to 74 Years (619 | 7.0%) for women.
| Age Bracket | Male | Female |
| Under 5 Years | 526 (6.4%) | 341 (3.9%) |
| 5 to 9 Years | 446 (5.4%) | 399 (4.5%) |
| 10 to 14 Years | 497 (6.0%) | 538 (6.1%) |
| 15 to 19 Years | 500 (6.1%) | 569 (6.5%) |
| 20 to 24 Years | 488 (5.9%) | 438 (5.0%) |
| 25 to 29 Years | 533 (6.5%) | 473 (5.4%) |
| 30 to 34 Years | 335 (4.1%) | 550 (6.2%) |
| 35 to 39 Years | 531 (6.5%) | 559 (6.3%) |
| 40 to 44 Years | 615 (7.5%) | 463 (5.2%) |
| 45 to 49 Years | 506 (6.2%) | 458 (5.2%) |
| 50 to 54 Years | 531 (6.5%) | 539 (6.1%) |
| 55 to 59 Years | 570 (6.9%) | 614 (7.0%) |
| 60 to 64 Years | 495 (6.0%) | 522 (5.9%) |
| 65 to 69 Years | 652 (7.9%) | 549 (6.2%) |
| 70 to 74 Years | 314 (3.8%) | 619 (7.0%) |
| 75 to 79 Years | 317 (3.9%) | 468 (5.3%) |
| 80 to 84 Years | 148 (1.8%) | 349 (4.0%) |
| 85 Years and over | 209 (2.5%) | 375 (4.3%) |
| Total | 8,213 (100.0%) | 8,823 (100.0%) |
Families and Households in Bristol city
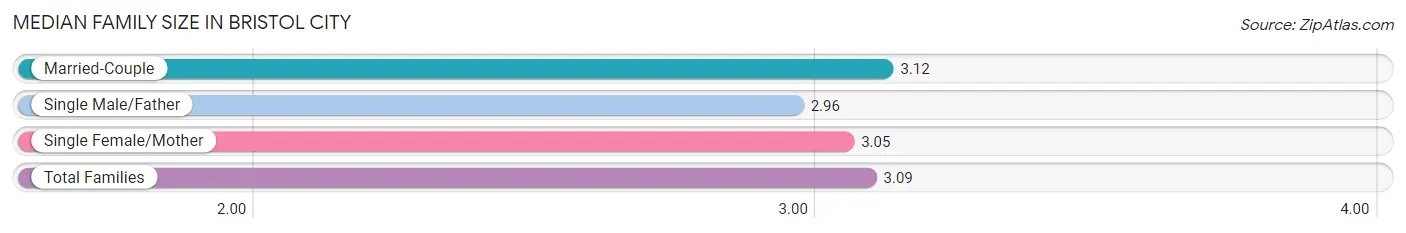
Median Family Size in Bristol city
The median family size in Bristol city is 3.09 persons per family, with married-couple families (2,663 | 63.9%) accounting for the largest median family size of 3.12 persons per family. On the other hand, single male/father families (342 | 8.2%) represent the smallest median family size with 2.96 persons per family.
| Family Type | # Families | Family Size |
| Married-Couple | 2,663 (63.9%) | 3.12 |
| Single Male/Father | 342 (8.2%) | 2.96 |
| Single Female/Mother | 1,161 (27.9%) | 3.05 |
| Total Families | 4,166 (100.0%) | 3.09 |
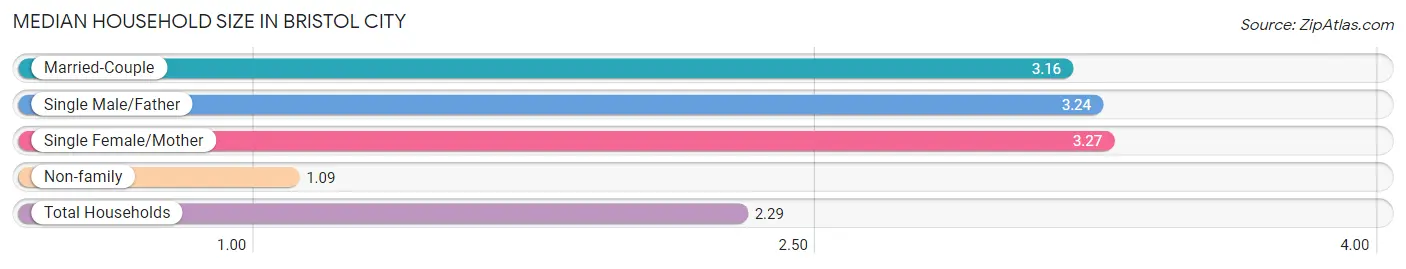
Median Household Size in Bristol city
The median household size in Bristol city is 2.29 persons per household, with single female/mother households (1,161 | 15.9%) accounting for the largest median household size of 3.27 persons per household. non-family households (3,133 | 42.9%) represent the smallest median household size with 1.09 persons per household.
| Household Type | # Households | Household Size |
| Married-Couple | 2,663 (36.5%) | 3.16 |
| Single Male/Father | 342 (4.7%) | 3.24 |
| Single Female/Mother | 1,161 (15.9%) | 3.27 |
| Non-family | 3,133 (42.9%) | 1.09 |
| Total Households | 7,299 (100.0%) | 2.29 |
Household Size by Marriage Status in Bristol city
Out of a total of 7,299 households in Bristol city, 4,166 (57.1%) are family households, while 3,133 (42.9%) are nonfamily households. The most numerous type of family households are 2-person households, comprising 2,322, and the most common type of nonfamily households are 1-person households, comprising 2,907.
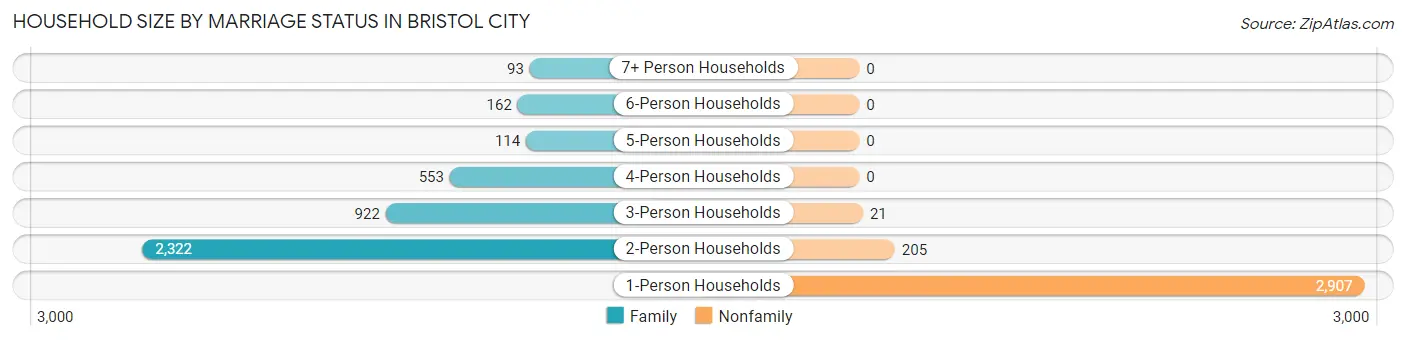
| Household Size | Family Households | Nonfamily Households |
| 1-Person Households | - | 2,907 (39.8%) |
| 2-Person Households | 2,322 (31.8%) | 205 (2.8%) |
| 3-Person Households | 922 (12.6%) | 21 (0.3%) |
| 4-Person Households | 553 (7.6%) | 0 (0.0%) |
| 5-Person Households | 114 (1.6%) | 0 (0.0%) |
| 6-Person Households | 162 (2.2%) | 0 (0.0%) |
| 7+ Person Households | 93 (1.3%) | 0 (0.0%) |
| Total | 4,166 (57.1%) | 3,133 (42.9%) |
Female Fertility in Bristol city
Fertility by Age in Bristol city
Average fertility rate in Bristol city is 59.0 births per 1,000 women. Women in the age bracket of 35 to 50 years have the highest fertility rate with 78.0 births per 1,000 women. Women in the age bracket of 35 to 50 years acount for 56.5% of all women with births.
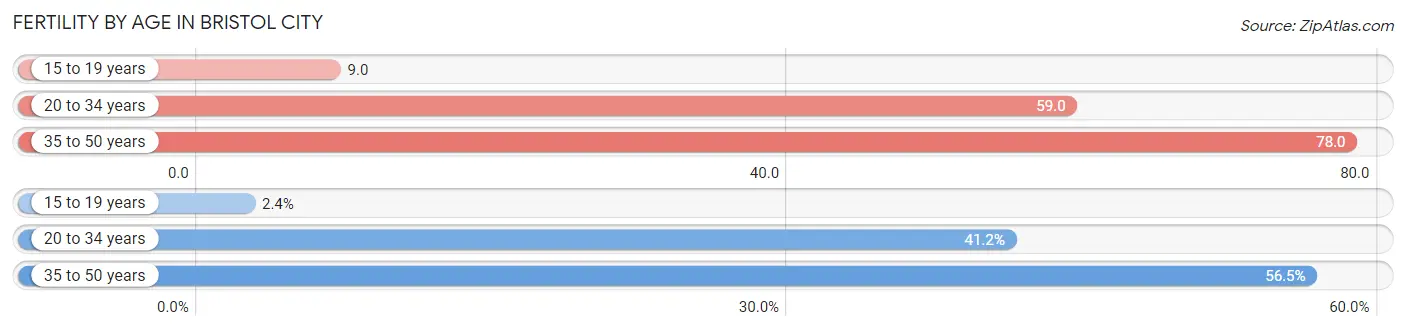
| Age Bracket | Women with Births | Births / 1,000 Women |
| 15 to 19 years | 5 (2.4%) | 9.0 |
| 20 to 34 years | 86 (41.1%) | 59.0 |
| 35 to 50 years | 118 (56.5%) | 78.0 |
| Total | 209 (100.0%) | 59.0 |
Fertility by Age by Marriage Status in Bristol city
35.9% of women with births (209) in Bristol city are married. The highest percentage of unmarried women with births falls into 15 to 19 years age bracket with 100.0% of them unmarried at the time of birth, while the lowest percentage of unmarried women with births belong to 20 to 34 years age bracket with 12.8% of them unmarried.
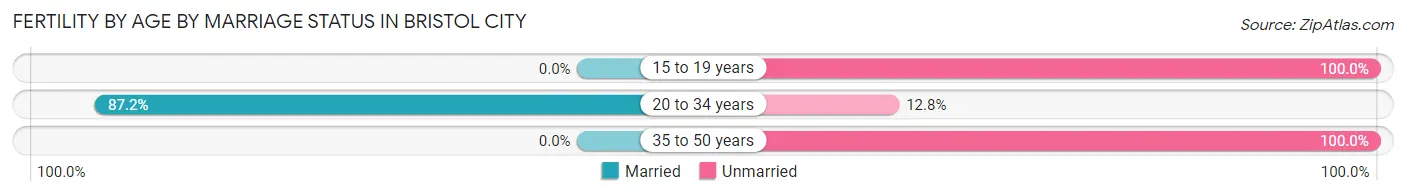
| Age Bracket | Married | Unmarried |
| 15 to 19 years | 0 (0.0%) | 5 (100.0%) |
| 20 to 34 years | 75 (87.2%) | 11 (12.8%) |
| 35 to 50 years | 0 (0.0%) | 118 (100.0%) |
| Total | 75 (35.9%) | 134 (64.1%) |
Fertility by Education in Bristol city
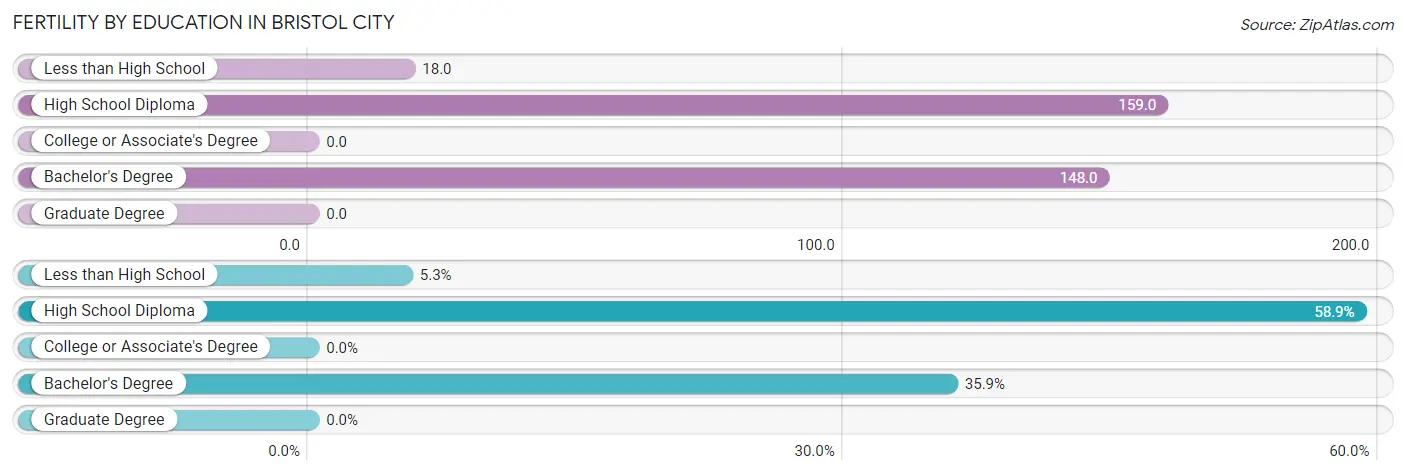
| Educational Attainment | Women with Births | Births / 1,000 Women |
| Less than High School | 11 (5.3%) | 18.0 |
| High School Diploma | 123 (58.9%) | 159.0 |
| College or Associate's Degree | 0 (0.0%) | 0.0 |
| Bachelor's Degree | 75 (35.9%) | 148.0 |
| Graduate Degree | 0 (0.0%) | 0.0 |
| Total | 209 (100.0%) | 59.0 |
Fertility by Education by Marriage Status in Bristol city
64.1% of women with births in Bristol city are unmarried. Women with the educational attainment of bachelor's degree are most likely to be married with 85.3% of them married at childbirth, while women with the educational attainment of high school diploma are least likely to be married with 95.9% of them unmarried at childbirth.
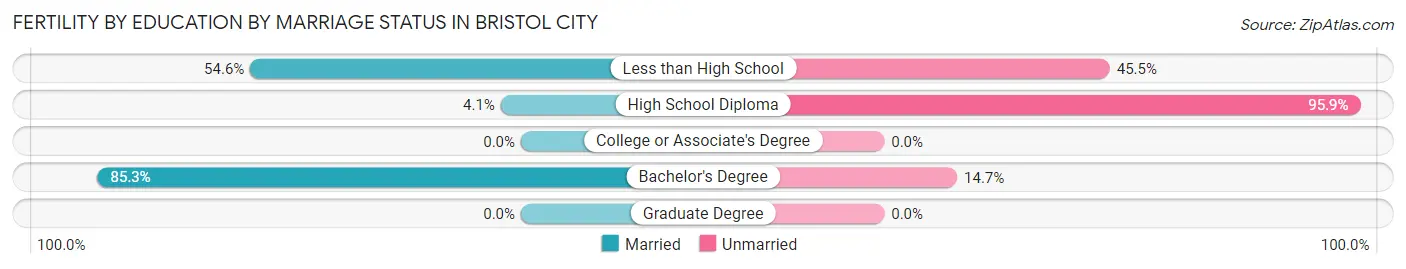
| Educational Attainment | Married | Unmarried |
| Less than High School | 6 (54.5%) | 5 (45.5%) |
| High School Diploma | 5 (4.1%) | 118 (95.9%) |
| College or Associate's Degree | 0 (0.0%) | 0 (0.0%) |
| Bachelor's Degree | 64 (85.3%) | 11 (14.7%) |
| Graduate Degree | 0 (0.0%) | 0 (0.0%) |
| Total | 75 (35.9%) | 134 (64.1%) |
Employment Characteristics in Bristol city
Employment by Class of Employer in Bristol city
Among the 7,286 employed individuals in Bristol city, private company employees (5,135 | 70.5%), not-for-profit organizations (766 | 10.5%), and local government employees (503 | 6.9%) make up the most common classes of employment.
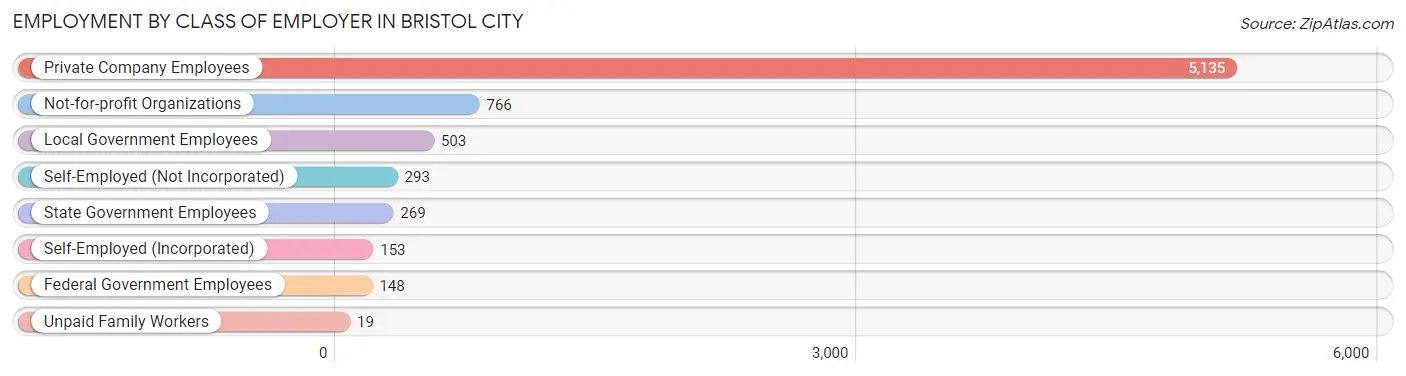
| Employer Class | # Employees | % Employees |
| Private Company Employees | 5,135 | 70.5% |
| Self-Employed (Incorporated) | 153 | 2.1% |
| Self-Employed (Not Incorporated) | 293 | 4.0% |
| Not-for-profit Organizations | 766 | 10.5% |
| Local Government Employees | 503 | 6.9% |
| State Government Employees | 269 | 3.7% |
| Federal Government Employees | 148 | 2.0% |
| Unpaid Family Workers | 19 | 0.3% |
| Total | 7,286 | 100.0% |
Employment Status by Age in Bristol city
According to the labor force statistics for Bristol city, out of the total population over 16 years of age (13,904), 55.7% or 7,745 individuals are in the labor force, with 4.1% or 318 of them unemployed. The age group with the highest labor force participation rate is 35 to 44 years, with 80.3% or 1,741 individuals in the labor force. Within the labor force, the 20 to 24 years age range has the highest percentage of unemployed individuals, with 15.7% or 105 of them being unemployed.
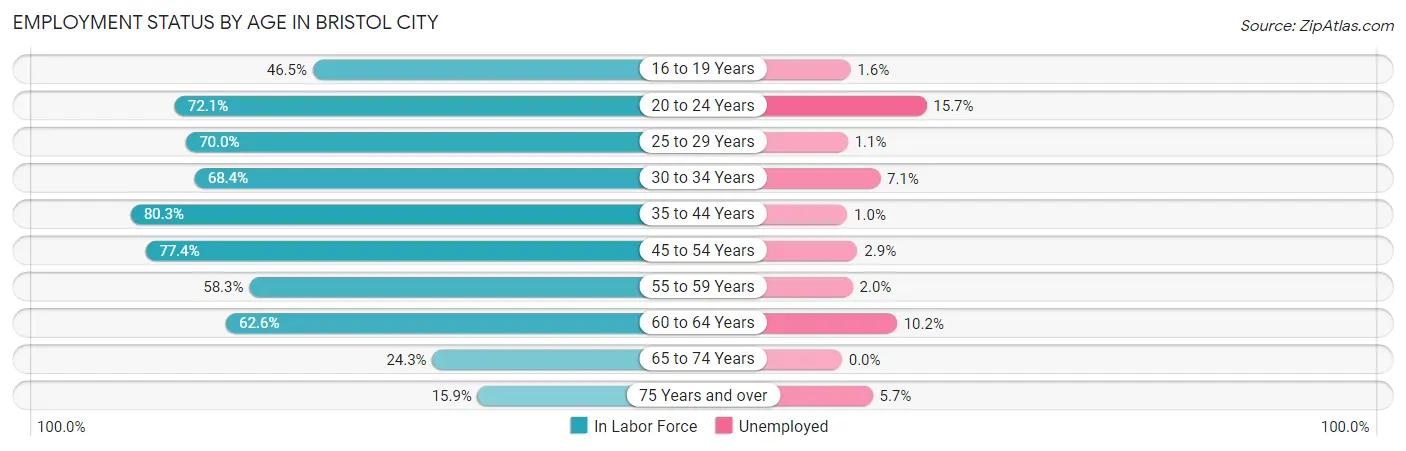
| Age Bracket | In Labor Force | Unemployed |
| 16 to 19 Years | 318 (46.5%) | 5 (1.6%) |
| 20 to 24 Years | 668 (72.1%) | 105 (15.7%) |
| 25 to 29 Years | 704 (70.0%) | 8 (1.1%) |
| 30 to 34 Years | 605 (68.4%) | 43 (7.1%) |
| 35 to 44 Years | 1,741 (80.3%) | 17 (1.0%) |
| 45 to 54 Years | 1,574 (77.4%) | 46 (2.9%) |
| 55 to 59 Years | 690 (58.3%) | 14 (2.0%) |
| 60 to 64 Years | 637 (62.6%) | 65 (10.2%) |
| 65 to 74 Years | 519 (24.3%) | 0 (0.0%) |
| 75 Years and over | 297 (15.9%) | 17 (5.7%) |
| Total | 7,745 (55.7%) | 318 (4.1%) |
Employment Status by Educational Attainment in Bristol city
According to labor force statistics for Bristol city, 71.8% of individuals (5,955) out of the total population between 25 and 64 years of age (8,294) are in the labor force, with 3.3% or 197 of them being unemployed. The group with the highest labor force participation rate are those with the educational attainment of bachelor's degree or higher, with 94.4% or 1,949 individuals in the labor force. Within the labor force, individuals with college / associate degree education have the highest percentage of unemployment, with 5.6% or 99 of them being unemployed.
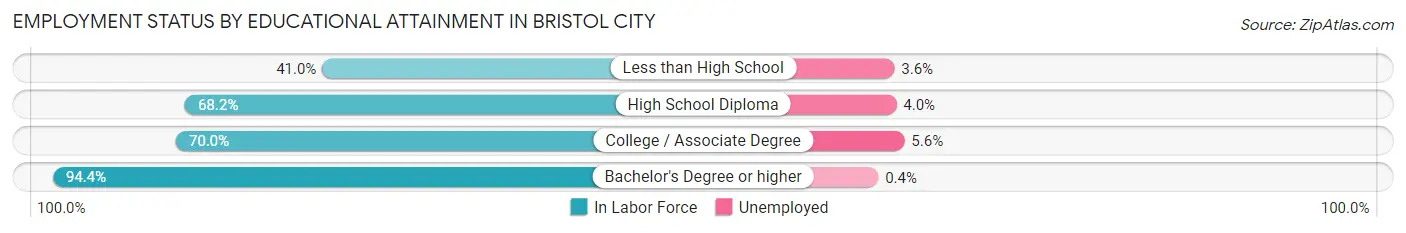
| Educational Attainment | In Labor Force | Unemployed |
| Less than High School | 440 (41.0%) | 39 (3.6%) |
| High School Diploma | 1,788 (68.2%) | 105 (4.0%) |
| College / Associate Degree | 1,774 (70.0%) | 142 (5.6%) |
| Bachelor's Degree or higher | 1,949 (94.4%) | 8 (0.4%) |
| Total | 5,955 (71.8%) | 274 (3.3%) |
Employment Occupations by Sex in Bristol city
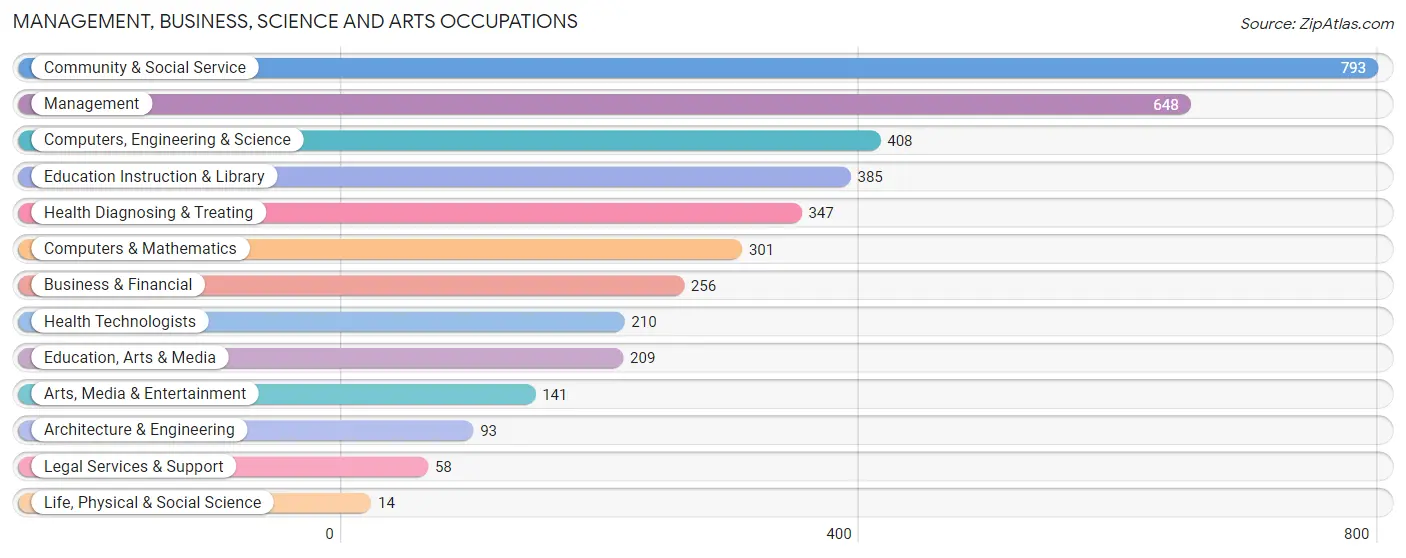
Management, Business, Science and Arts Occupations
The most common Management, Business, Science and Arts occupations in Bristol city are Community & Social Service (793 | 10.7%), Management (648 | 8.7%), Computers, Engineering & Science (408 | 5.5%), Education Instruction & Library (385 | 5.2%), and Health Diagnosing & Treating (347 | 4.7%).
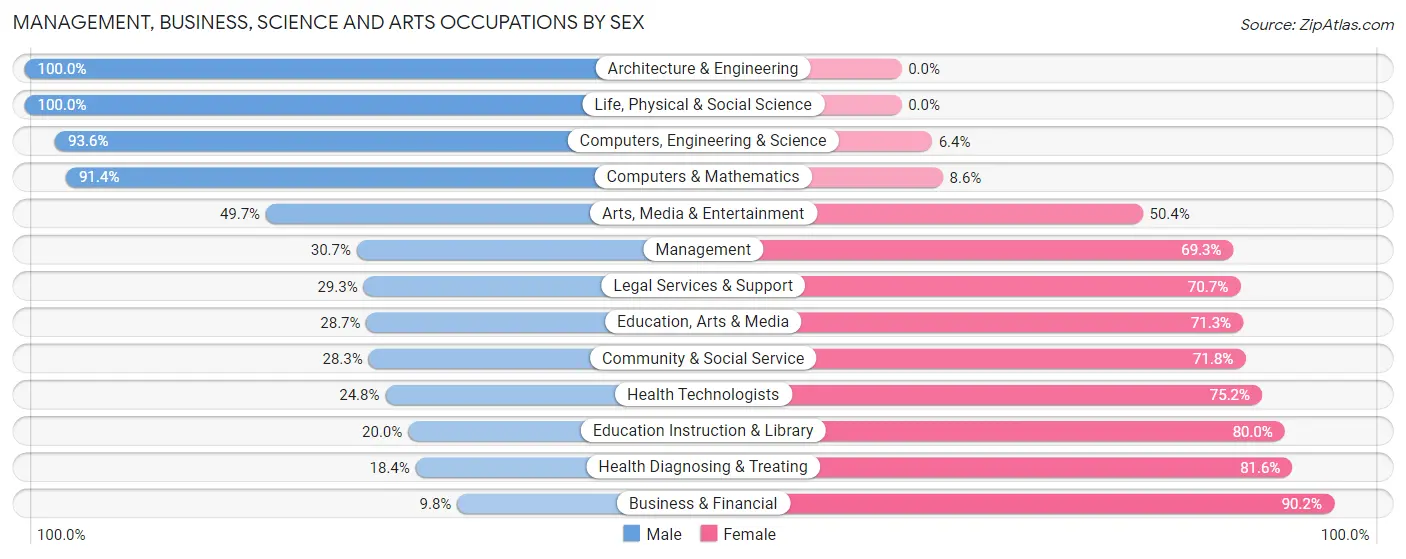
Management, Business, Science and Arts Occupations by Sex
Within the Management, Business, Science and Arts occupations in Bristol city, the most male-oriented occupations are Architecture & Engineering (100.0%), Life, Physical & Social Science (100.0%), and Computers, Engineering & Science (93.6%), while the most female-oriented occupations are Business & Financial (90.2%), Health Diagnosing & Treating (81.6%), and Education Instruction & Library (80.0%).
| Occupation | Male | Female |
| Management | 199 (30.7%) | 449 (69.3%) |
| Business & Financial | 25 (9.8%) | 231 (90.2%) |
| Computers, Engineering & Science | 382 (93.6%) | 26 (6.4%) |
| Computers & Mathematics | 275 (91.4%) | 26 (8.6%) |
| Architecture & Engineering | 93 (100.0%) | 0 (0.0%) |
| Life, Physical & Social Science | 14 (100.0%) | 0 (0.0%) |
| Community & Social Service | 224 (28.2%) | 569 (71.8%) |
| Education, Arts & Media | 60 (28.7%) | 149 (71.3%) |
| Legal Services & Support | 17 (29.3%) | 41 (70.7%) |
| Education Instruction & Library | 77 (20.0%) | 308 (80.0%) |
| Arts, Media & Entertainment | 70 (49.6%) | 71 (50.3%) |
| Health Diagnosing & Treating | 64 (18.4%) | 283 (81.6%) |
| Health Technologists | 52 (24.8%) | 158 (75.2%) |
| Total (Category) | 894 (36.5%) | 1,558 (63.5%) |
| Total (Overall) | 3,714 (50.0%) | 3,716 (50.0%) |
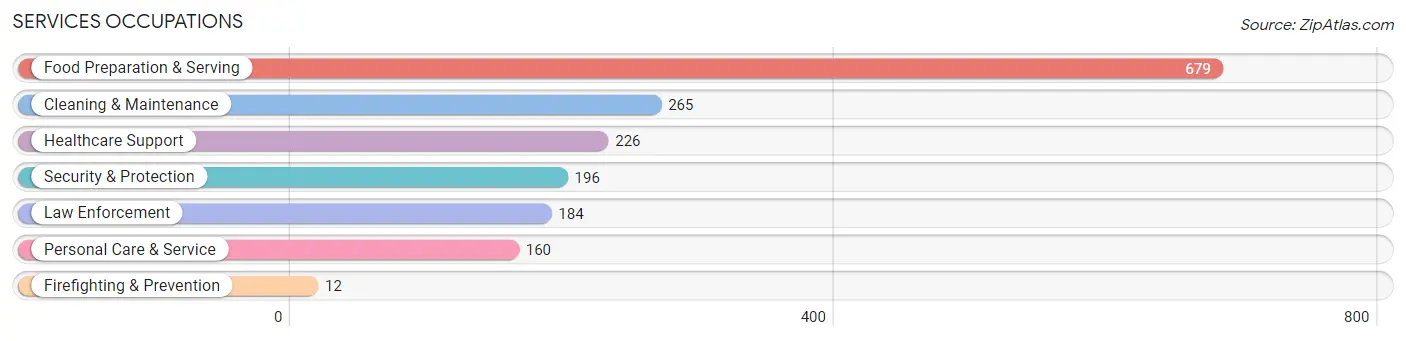
Services Occupations
The most common Services occupations in Bristol city are Food Preparation & Serving (679 | 9.1%), Cleaning & Maintenance (265 | 3.6%), Healthcare Support (226 | 3.0%), Security & Protection (196 | 2.6%), and Law Enforcement (184 | 2.5%).
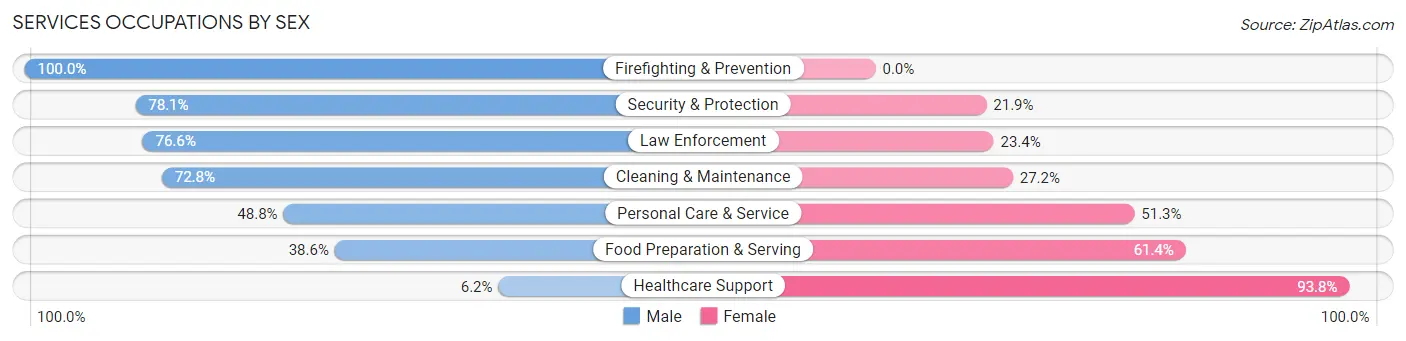
Services Occupations by Sex
Within the Services occupations in Bristol city, the most male-oriented occupations are Firefighting & Prevention (100.0%), Security & Protection (78.1%), and Law Enforcement (76.6%), while the most female-oriented occupations are Healthcare Support (93.8%), Food Preparation & Serving (61.4%), and Personal Care & Service (51.2%).
| Occupation | Male | Female |
| Healthcare Support | 14 (6.2%) | 212 (93.8%) |
| Security & Protection | 153 (78.1%) | 43 (21.9%) |
| Firefighting & Prevention | 12 (100.0%) | 0 (0.0%) |
| Law Enforcement | 141 (76.6%) | 43 (23.4%) |
| Food Preparation & Serving | 262 (38.6%) | 417 (61.4%) |
| Cleaning & Maintenance | 193 (72.8%) | 72 (27.2%) |
| Personal Care & Service | 78 (48.7%) | 82 (51.2%) |
| Total (Category) | 700 (45.9%) | 826 (54.1%) |
| Total (Overall) | 3,714 (50.0%) | 3,716 (50.0%) |
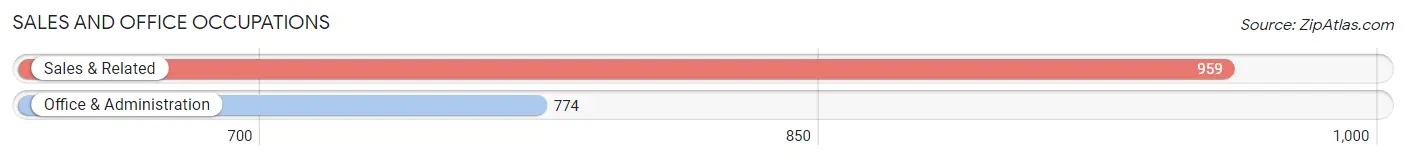
Sales and Office Occupations
The most common Sales and Office occupations in Bristol city are Sales & Related (959 | 12.9%), and Office & Administration (774 | 10.4%).
Sales and Office Occupations by Sex
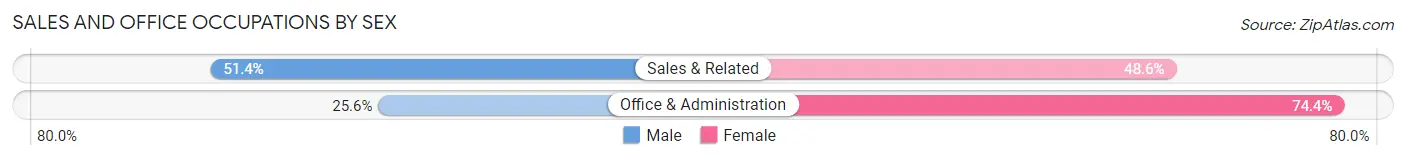
| Occupation | Male | Female |
| Sales & Related | 493 (51.4%) | 466 (48.6%) |
| Office & Administration | 198 (25.6%) | 576 (74.4%) |
| Total (Category) | 691 (39.9%) | 1,042 (60.1%) |
| Total (Overall) | 3,714 (50.0%) | 3,716 (50.0%) |
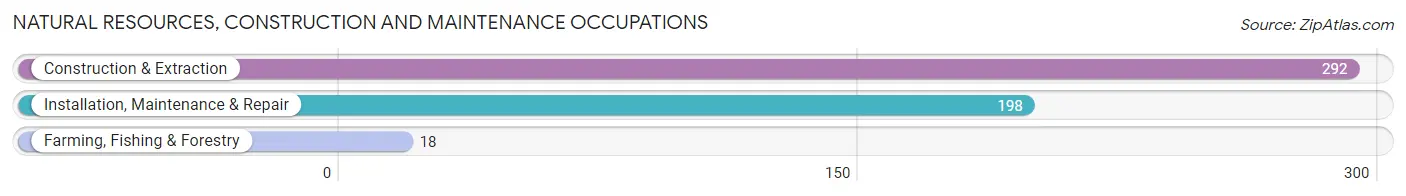
Natural Resources, Construction and Maintenance Occupations
The most common Natural Resources, Construction and Maintenance occupations in Bristol city are Construction & Extraction (292 | 3.9%), Installation, Maintenance & Repair (198 | 2.7%), and Farming, Fishing & Forestry (18 | 0.2%).
Natural Resources, Construction and Maintenance Occupations by Sex
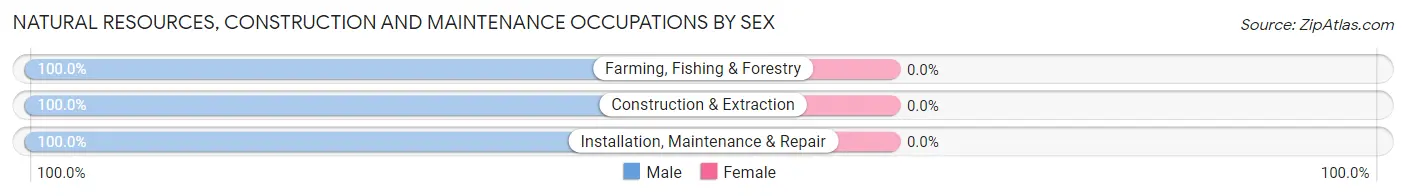
| Occupation | Male | Female |
| Farming, Fishing & Forestry | 18 (100.0%) | 0 (0.0%) |
| Construction & Extraction | 292 (100.0%) | 0 (0.0%) |
| Installation, Maintenance & Repair | 198 (100.0%) | 0 (0.0%) |
| Total (Category) | 508 (100.0%) | 0 (0.0%) |
| Total (Overall) | 3,714 (50.0%) | 3,716 (50.0%) |
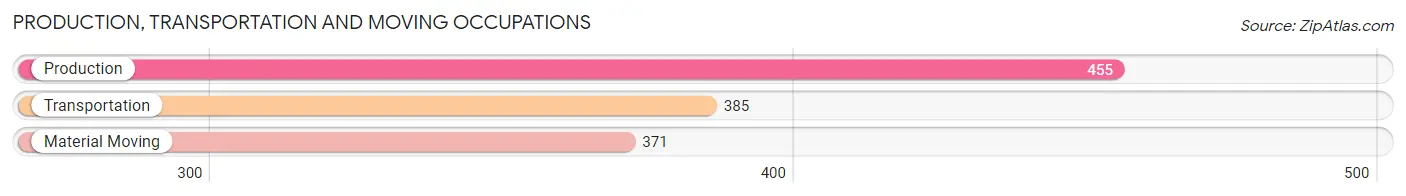
Production, Transportation and Moving Occupations
The most common Production, Transportation and Moving occupations in Bristol city are Production (455 | 6.1%), Transportation (385 | 5.2%), and Material Moving (371 | 5.0%).
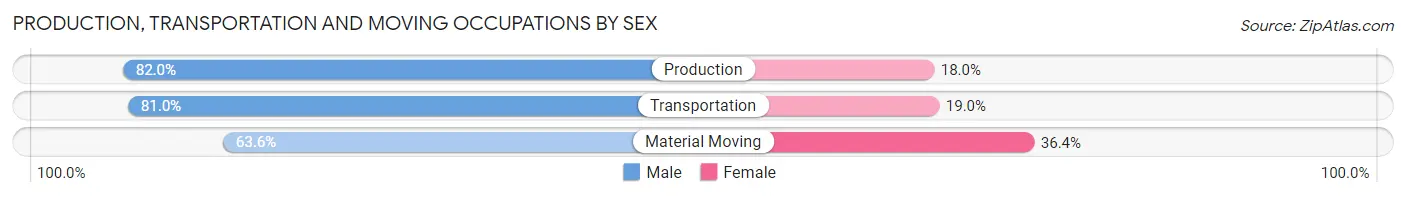
Production, Transportation and Moving Occupations by Sex
| Occupation | Male | Female |
| Production | 373 (82.0%) | 82 (18.0%) |
| Transportation | 312 (81.0%) | 73 (19.0%) |
| Material Moving | 236 (63.6%) | 135 (36.4%) |
| Total (Category) | 921 (76.0%) | 290 (23.9%) |
| Total (Overall) | 3,714 (50.0%) | 3,716 (50.0%) |
Employment Industries by Sex in Bristol city
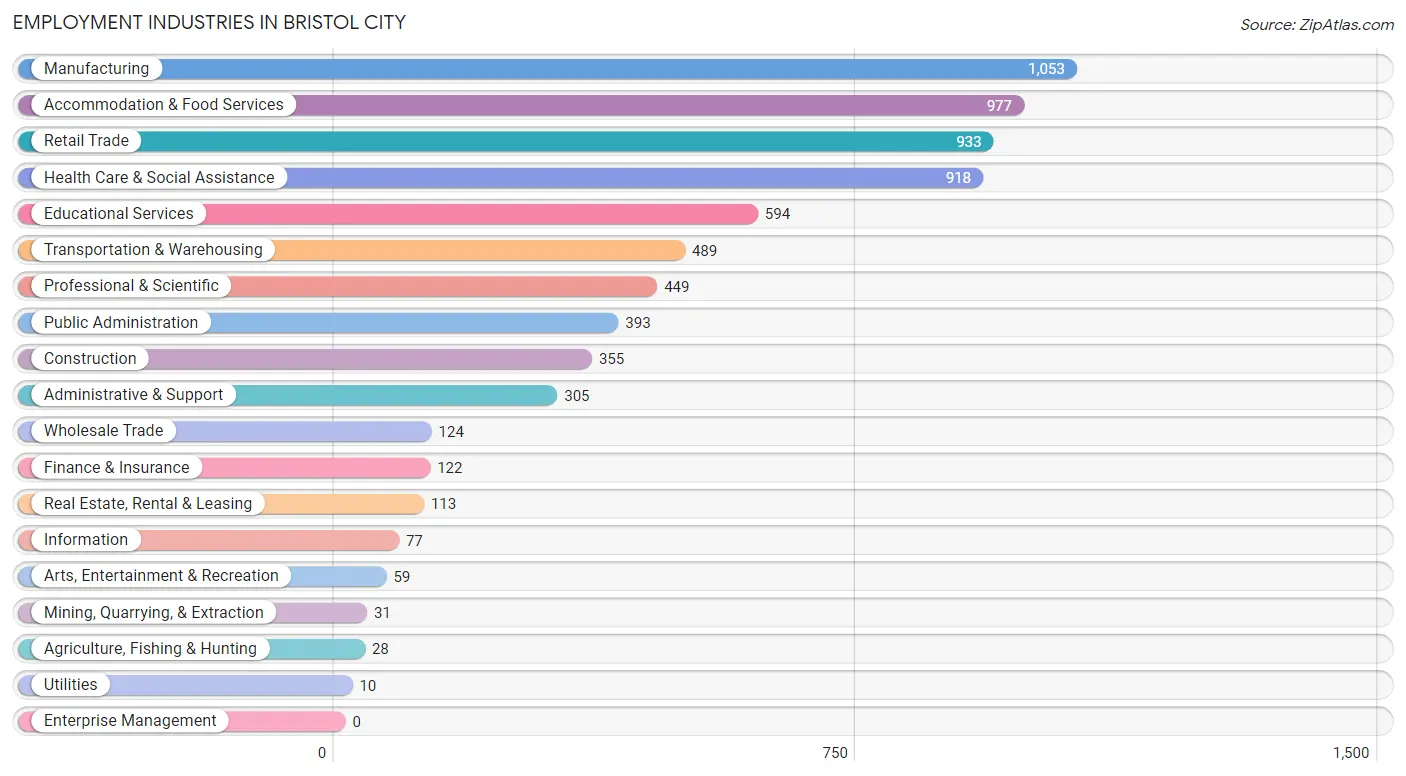
Employment Industries in Bristol city
The major employment industries in Bristol city include Manufacturing (1,053 | 14.2%), Accommodation & Food Services (977 | 13.2%), Retail Trade (933 | 12.6%), Health Care & Social Assistance (918 | 12.4%), and Educational Services (594 | 8.0%).
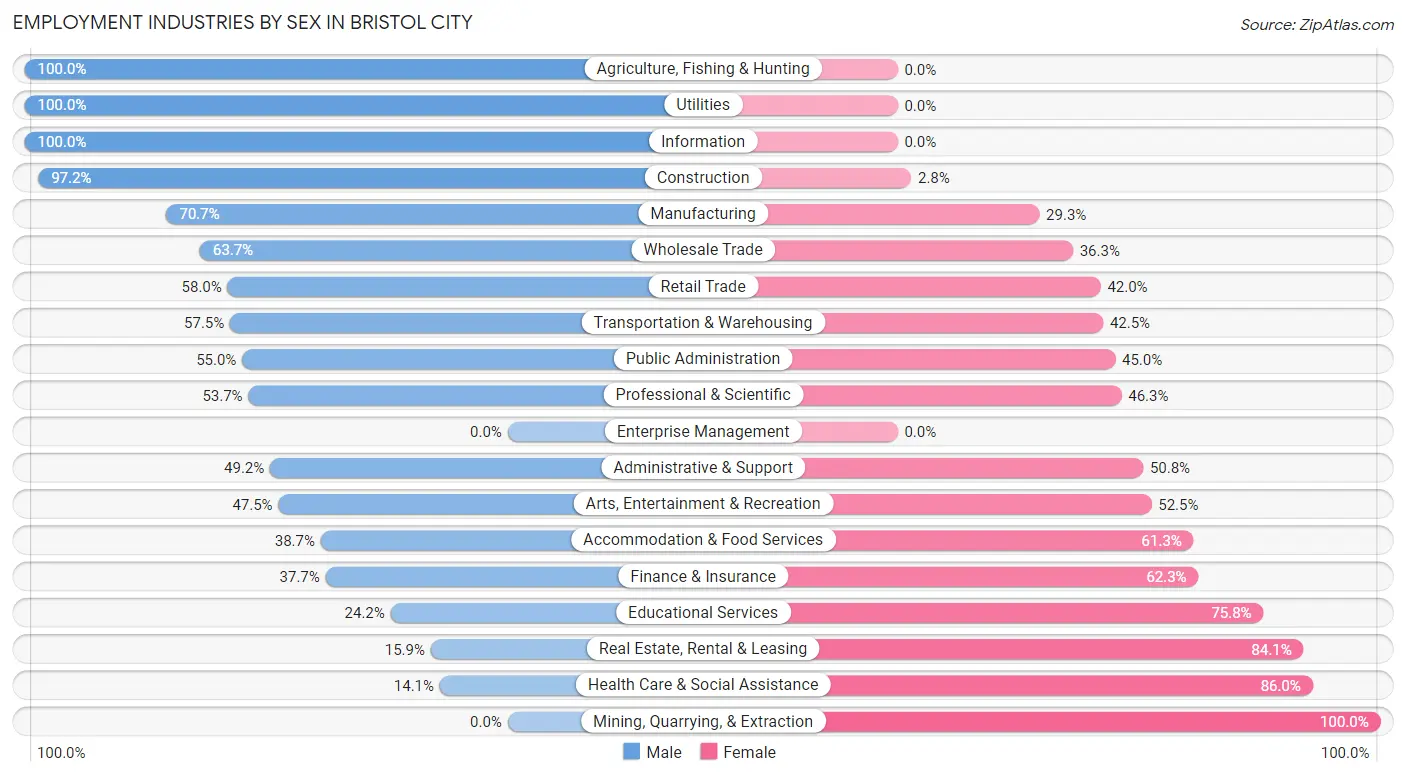
Employment Industries by Sex in Bristol city
The Bristol city industries that see more men than women are Agriculture, Fishing & Hunting (100.0%), Utilities (100.0%), and Information (100.0%), whereas the industries that tend to have a higher number of women are Mining, Quarrying, & Extraction (100.0%), Health Care & Social Assistance (86.0%), and Real Estate, Rental & Leasing (84.1%).
| Industry | Male | Female |
| Agriculture, Fishing & Hunting | 28 (100.0%) | 0 (0.0%) |
| Mining, Quarrying, & Extraction | 0 (0.0%) | 31 (100.0%) |
| Construction | 345 (97.2%) | 10 (2.8%) |
| Manufacturing | 744 (70.7%) | 309 (29.3%) |
| Wholesale Trade | 79 (63.7%) | 45 (36.3%) |
| Retail Trade | 541 (58.0%) | 392 (42.0%) |
| Transportation & Warehousing | 281 (57.5%) | 208 (42.5%) |
| Utilities | 10 (100.0%) | 0 (0.0%) |
| Information | 77 (100.0%) | 0 (0.0%) |
| Finance & Insurance | 46 (37.7%) | 76 (62.3%) |
| Real Estate, Rental & Leasing | 18 (15.9%) | 95 (84.1%) |
| Professional & Scientific | 241 (53.7%) | 208 (46.3%) |
| Enterprise Management | 0 (0.0%) | 0 (0.0%) |
| Administrative & Support | 150 (49.2%) | 155 (50.8%) |
| Educational Services | 144 (24.2%) | 450 (75.8%) |
| Health Care & Social Assistance | 129 (14.1%) | 789 (86.0%) |
| Arts, Entertainment & Recreation | 28 (47.5%) | 31 (52.5%) |
| Accommodation & Food Services | 378 (38.7%) | 599 (61.3%) |
| Public Administration | 216 (55.0%) | 177 (45.0%) |
| Total | 3,714 (50.0%) | 3,716 (50.0%) |
Education in Bristol city
School Enrollment in Bristol city
The most common levels of schooling among the 3,136 students in Bristol city are high school (821 | 26.2%), middle school (617 | 19.7%), and elementary school (584 | 18.6%).
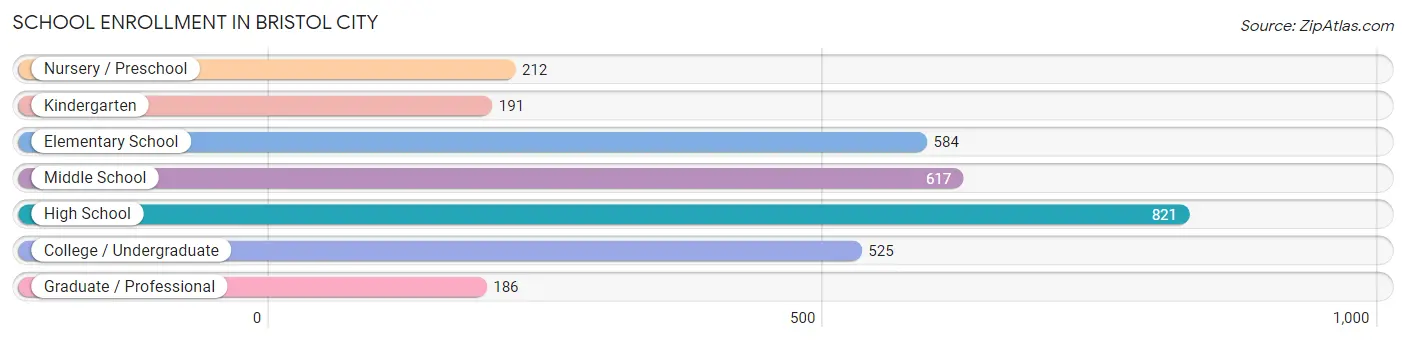
| School Level | # Students | % Students |
| Nursery / Preschool | 212 | 6.8% |
| Kindergarten | 191 | 6.1% |
| Elementary School | 584 | 18.6% |
| Middle School | 617 | 19.7% |
| High School | 821 | 26.2% |
| College / Undergraduate | 525 | 16.7% |
| Graduate / Professional | 186 | 5.9% |
| Total | 3,136 | 100.0% |
School Enrollment by Age by Funding Source in Bristol city
Out of a total of 3,136 students who are enrolled in schools in Bristol city, 721 (23.0%) attend a private institution, while the remaining 2,415 (77.0%) are enrolled in public schools. The age group of 15 to 17 year olds has the highest likelihood of being enrolled in private schools, with 169 (36.4% in the age bracket) enrolled. Conversely, the age group of 20 to 24 year olds has the lowest likelihood of being enrolled in a private school, with 183 (86.3% in the age bracket) attending a public institution.
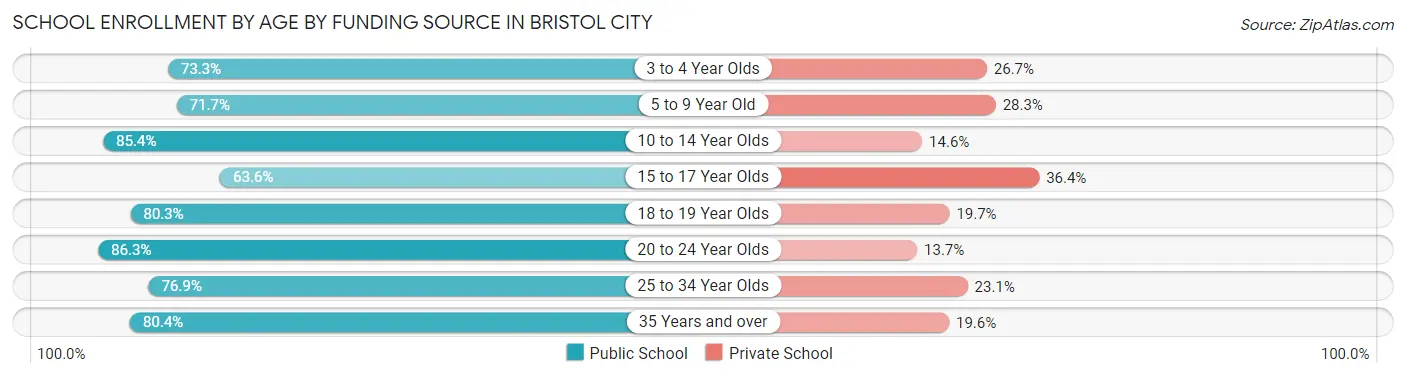
| Age Bracket | Public School | Private School |
| 3 to 4 Year Olds | 132 (73.3%) | 48 (26.7%) |
| 5 to 9 Year Old | 534 (71.7%) | 211 (28.3%) |
| 10 to 14 Year Olds | 730 (85.4%) | 125 (14.6%) |
| 15 to 17 Year Olds | 295 (63.6%) | 169 (36.4%) |
| 18 to 19 Year Olds | 212 (80.3%) | 52 (19.7%) |
| 20 to 24 Year Olds | 183 (86.3%) | 29 (13.7%) |
| 25 to 34 Year Olds | 120 (76.9%) | 36 (23.1%) |
| 35 Years and over | 209 (80.4%) | 51 (19.6%) |
| Total | 2,415 (77.0%) | 721 (23.0%) |
Educational Attainment by Field of Study in Bristol city
Business (545 | 17.6%), education (541 | 17.5%), social sciences (385 | 12.4%), science & technology (313 | 10.1%), and arts & humanities (243 | 7.9%) are the most common fields of study among 3,095 individuals in Bristol city who have obtained a bachelor's degree or higher.
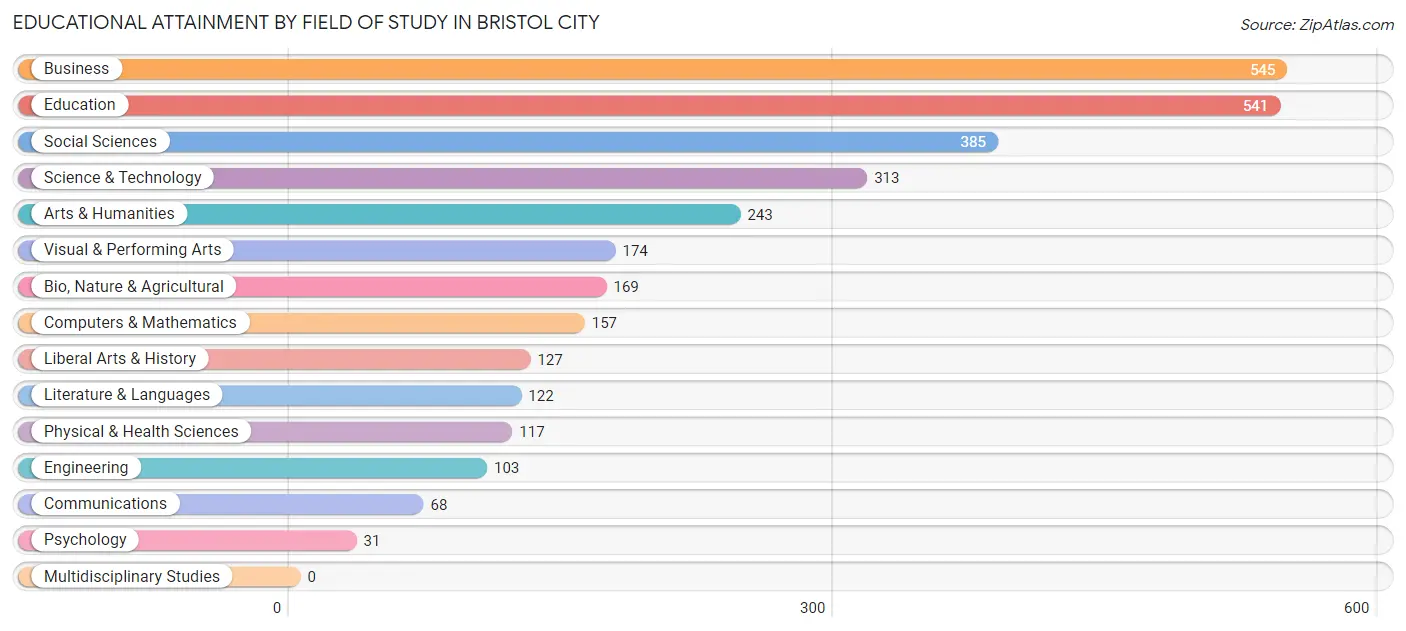
| Field of Study | # Graduates | % Graduates |
| Computers & Mathematics | 157 | 5.1% |
| Bio, Nature & Agricultural | 169 | 5.5% |
| Physical & Health Sciences | 117 | 3.8% |
| Psychology | 31 | 1.0% |
| Social Sciences | 385 | 12.4% |
| Engineering | 103 | 3.3% |
| Multidisciplinary Studies | 0 | 0.0% |
| Science & Technology | 313 | 10.1% |
| Business | 545 | 17.6% |
| Education | 541 | 17.5% |
| Literature & Languages | 122 | 3.9% |
| Liberal Arts & History | 127 | 4.1% |
| Visual & Performing Arts | 174 | 5.6% |
| Communications | 68 | 2.2% |
| Arts & Humanities | 243 | 7.9% |
| Total | 3,095 | 100.0% |
Transportation & Commute in Bristol city
Vehicle Availability by Sex in Bristol city
The most prevalent vehicle ownership categories in Bristol city are males with 2 vehicles (1,613, accounting for 44.3%) and females with 2 vehicles (1,576, making up 44.7%).
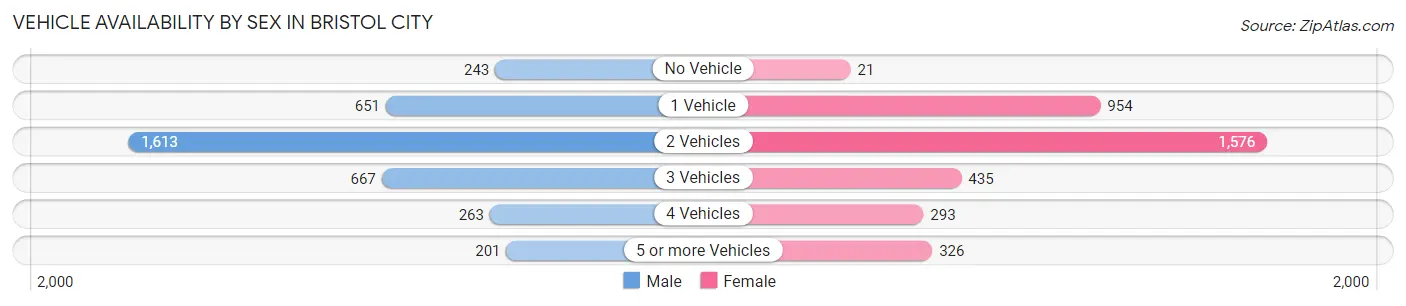
| Vehicles Available | Male | Female |
| No Vehicle | 243 (6.7%) | 21 (0.6%) |
| 1 Vehicle | 651 (17.9%) | 954 (26.5%) |
| 2 Vehicles | 1,613 (44.3%) | 1,576 (43.7%) |
| 3 Vehicles | 667 (18.3%) | 435 (12.1%) |
| 4 Vehicles | 263 (7.2%) | 293 (8.1%) |
| 5 or more Vehicles | 201 (5.5%) | 326 (9.0%) |
| Total | 3,638 (100.0%) | 3,605 (100.0%) |
Commute Time in Bristol city
The most frequently occuring commute durations in Bristol city are 10 to 14 minutes (1,351 commuters, 20.6%), 15 to 19 minutes (1,135 commuters, 17.3%), and 20 to 24 minutes (994 commuters, 15.2%).
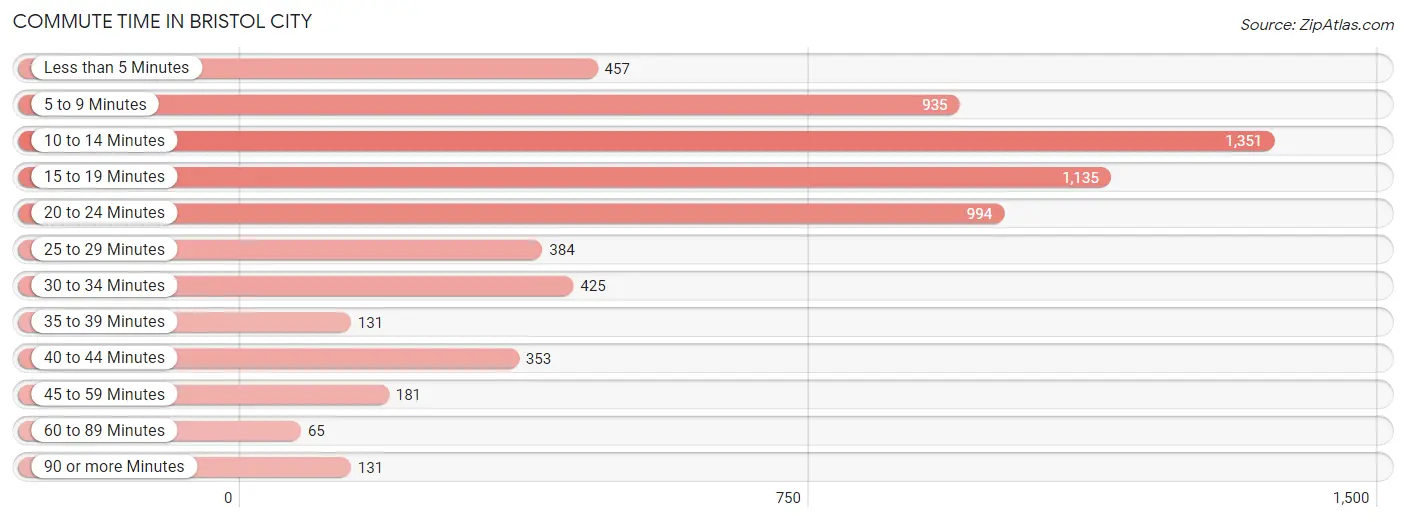
| Commute Time | # Commuters | % Commuters |
| Less than 5 Minutes | 457 | 7.0% |
| 5 to 9 Minutes | 935 | 14.3% |
| 10 to 14 Minutes | 1,351 | 20.6% |
| 15 to 19 Minutes | 1,135 | 17.3% |
| 20 to 24 Minutes | 994 | 15.2% |
| 25 to 29 Minutes | 384 | 5.9% |
| 30 to 34 Minutes | 425 | 6.5% |
| 35 to 39 Minutes | 131 | 2.0% |
| 40 to 44 Minutes | 353 | 5.4% |
| 45 to 59 Minutes | 181 | 2.8% |
| 60 to 89 Minutes | 65 | 1.0% |
| 90 or more Minutes | 131 | 2.0% |
Commute Time by Sex in Bristol city
The most common commute times in Bristol city are 15 to 19 minutes (601 commuters, 18.3%) for males and 10 to 14 minutes (790 commuters, 24.2%) for females.
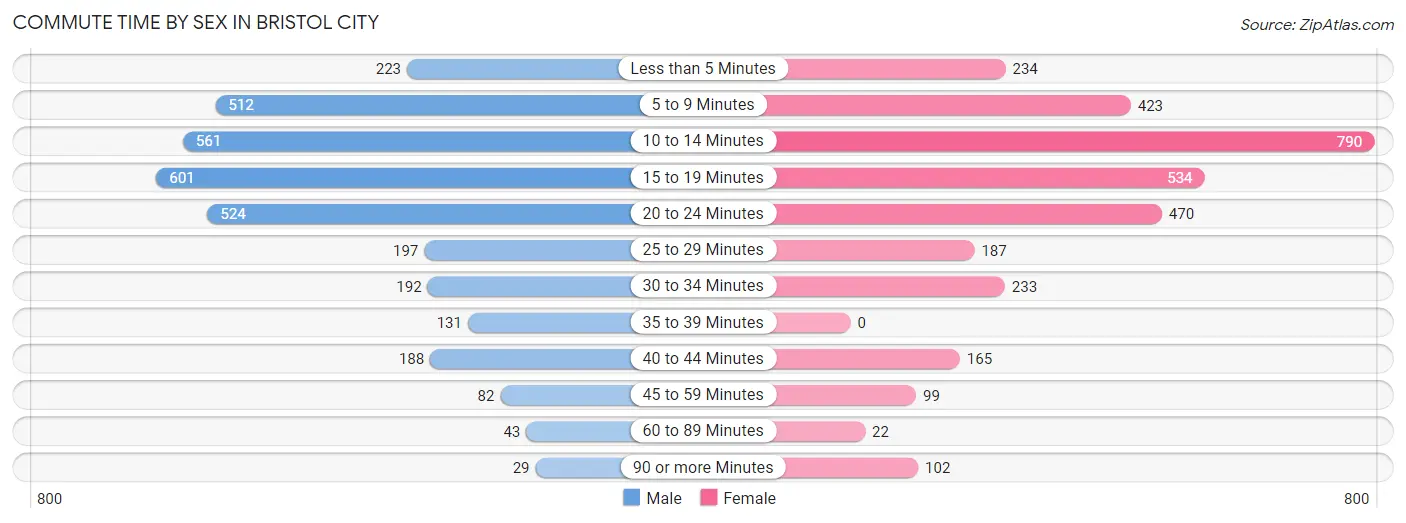
| Commute Time | Male | Female |
| Less than 5 Minutes | 223 (6.8%) | 234 (7.2%) |
| 5 to 9 Minutes | 512 (15.6%) | 423 (13.0%) |
| 10 to 14 Minutes | 561 (17.1%) | 790 (24.2%) |
| 15 to 19 Minutes | 601 (18.3%) | 534 (16.4%) |
| 20 to 24 Minutes | 524 (16.0%) | 470 (14.4%) |
| 25 to 29 Minutes | 197 (6.0%) | 187 (5.7%) |
| 30 to 34 Minutes | 192 (5.9%) | 233 (7.1%) |
| 35 to 39 Minutes | 131 (4.0%) | 0 (0.0%) |
| 40 to 44 Minutes | 188 (5.7%) | 165 (5.1%) |
| 45 to 59 Minutes | 82 (2.5%) | 99 (3.0%) |
| 60 to 89 Minutes | 43 (1.3%) | 22 (0.7%) |
| 90 or more Minutes | 29 (0.9%) | 102 (3.1%) |
Time of Departure to Work by Sex in Bristol city
The most frequent times of departure to work in Bristol city are 4:00 PM to 11:59 PM (633, 19.3%) for males and 8:00 AM to 8:29 AM (525, 16.1%) for females.
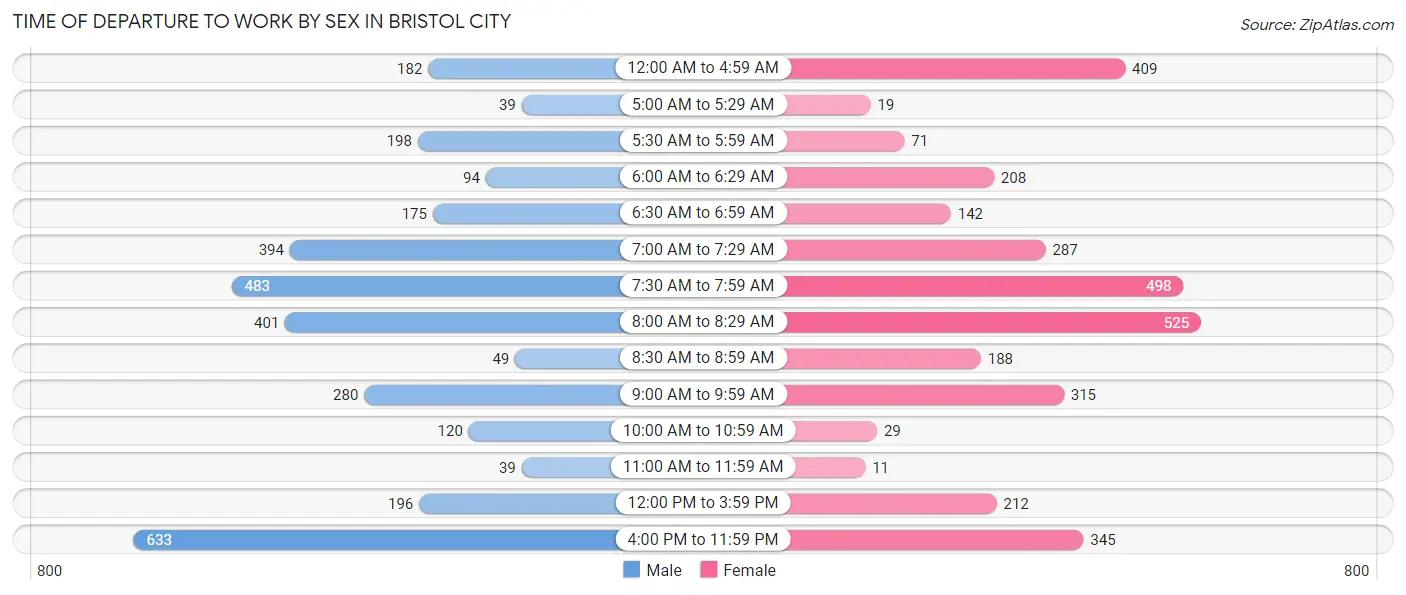
| Time of Departure | Male | Female |
| 12:00 AM to 4:59 AM | 182 (5.5%) | 409 (12.6%) |
| 5:00 AM to 5:29 AM | 39 (1.2%) | 19 (0.6%) |
| 5:30 AM to 5:59 AM | 198 (6.0%) | 71 (2.2%) |
| 6:00 AM to 6:29 AM | 94 (2.9%) | 208 (6.4%) |
| 6:30 AM to 6:59 AM | 175 (5.3%) | 142 (4.4%) |
| 7:00 AM to 7:29 AM | 394 (12.0%) | 287 (8.8%) |
| 7:30 AM to 7:59 AM | 483 (14.7%) | 498 (15.3%) |
| 8:00 AM to 8:29 AM | 401 (12.2%) | 525 (16.1%) |
| 8:30 AM to 8:59 AM | 49 (1.5%) | 188 (5.8%) |
| 9:00 AM to 9:59 AM | 280 (8.5%) | 315 (9.7%) |
| 10:00 AM to 10:59 AM | 120 (3.7%) | 29 (0.9%) |
| 11:00 AM to 11:59 AM | 39 (1.2%) | 11 (0.3%) |
| 12:00 PM to 3:59 PM | 196 (6.0%) | 212 (6.5%) |
| 4:00 PM to 11:59 PM | 633 (19.3%) | 345 (10.6%) |
| Total | 3,283 (100.0%) | 3,259 (100.0%) |
Housing Occupancy in Bristol city
Occupancy by Ownership in Bristol city
Of the total 7,299 dwellings in Bristol city, owner-occupied units account for 4,596 (63.0%), while renter-occupied units make up 2,703 (37.0%).
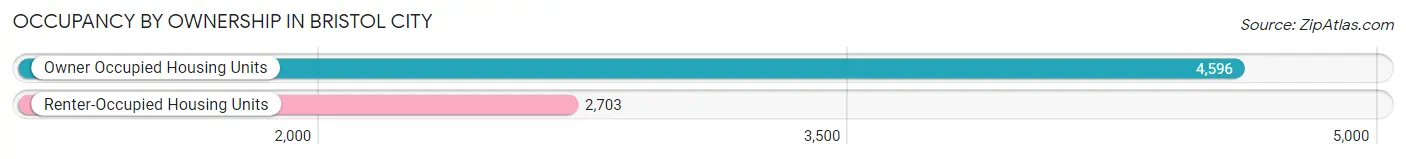
| Occupancy | # Housing Units | % Housing Units |
| Owner Occupied Housing Units | 4,596 | 63.0% |
| Renter-Occupied Housing Units | 2,703 | 37.0% |
| Total Occupied Housing Units | 7,299 | 100.0% |
Occupancy by Household Size in Bristol city
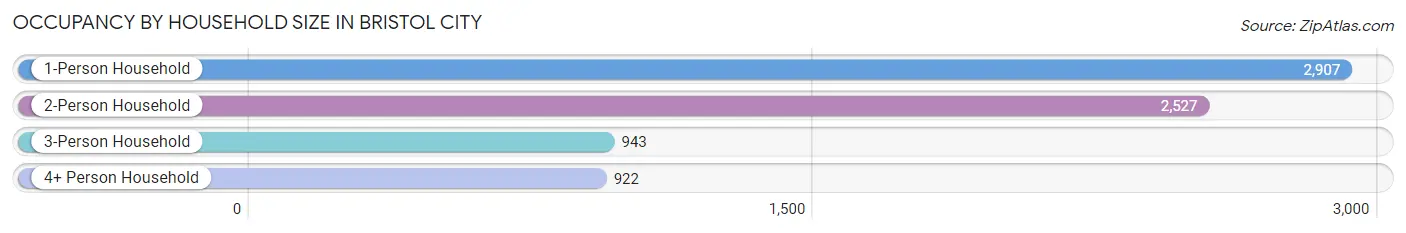
| Household Size | # Housing Units | % Housing Units |
| 1-Person Household | 2,907 | 39.8% |
| 2-Person Household | 2,527 | 34.6% |
| 3-Person Household | 943 | 12.9% |
| 4+ Person Household | 922 | 12.6% |
| Total Housing Units | 7,299 | 100.0% |
Occupancy by Ownership by Household Size in Bristol city
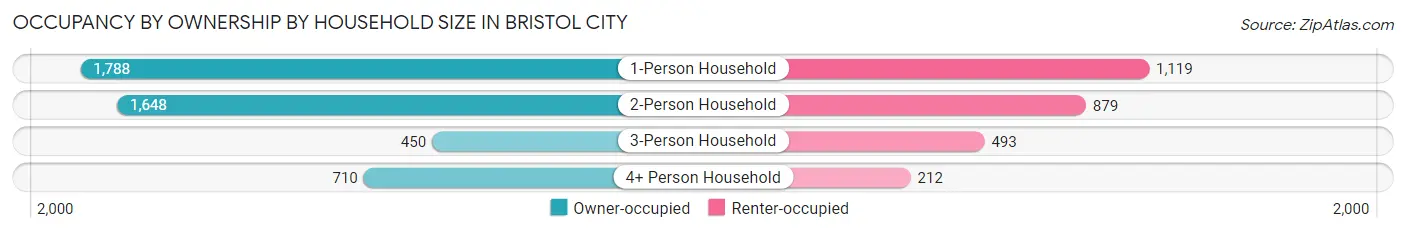
| Household Size | Owner-occupied | Renter-occupied |
| 1-Person Household | 1,788 (61.5%) | 1,119 (38.5%) |
| 2-Person Household | 1,648 (65.2%) | 879 (34.8%) |
| 3-Person Household | 450 (47.7%) | 493 (52.3%) |
| 4+ Person Household | 710 (77.0%) | 212 (23.0%) |
| Total Housing Units | 4,596 (63.0%) | 2,703 (37.0%) |
Occupancy by Educational Attainment in Bristol city
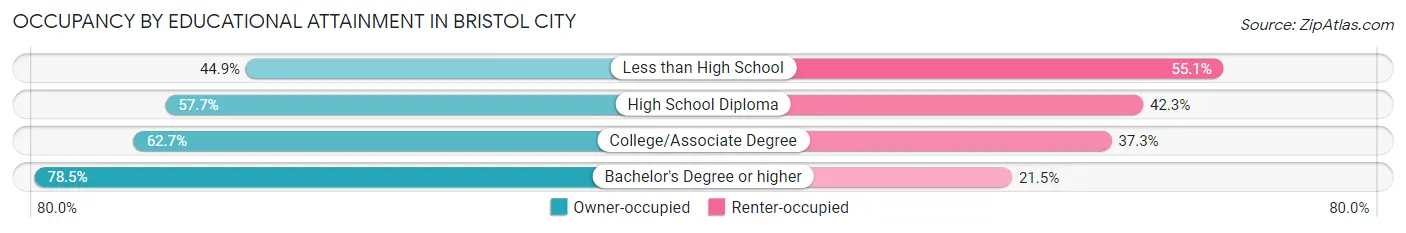
| Household Size | Owner-occupied | Renter-occupied |
| Less than High School | 391 (44.9%) | 480 (55.1%) |
| High School Diploma | 1,253 (57.7%) | 920 (42.3%) |
| College/Associate Degree | 1,535 (62.7%) | 914 (37.3%) |
| Bachelor's Degree or higher | 1,417 (78.5%) | 389 (21.5%) |
Occupancy by Age of Householder in Bristol city
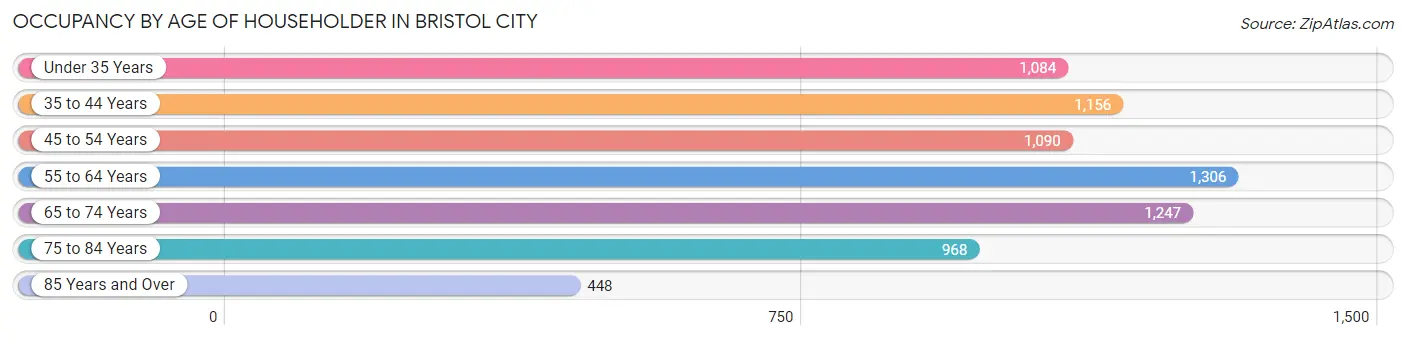
| Age Bracket | # Households | % Households |
| Under 35 Years | 1,084 | 14.8% |
| 35 to 44 Years | 1,156 | 15.8% |
| 45 to 54 Years | 1,090 | 14.9% |
| 55 to 64 Years | 1,306 | 17.9% |
| 65 to 74 Years | 1,247 | 17.1% |
| 75 to 84 Years | 968 | 13.3% |
| 85 Years and Over | 448 | 6.1% |
| Total | 7,299 | 100.0% |
Housing Finances in Bristol city
Median Income by Occupancy in Bristol city
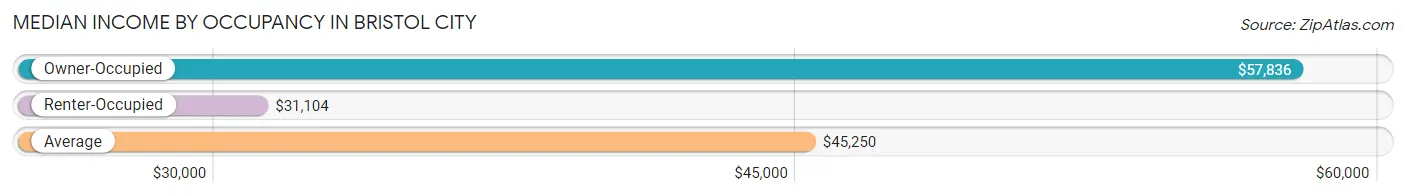
| Occupancy Type | # Households | Median Income |
| Owner-Occupied | 4,596 (63.0%) | $57,836 |
| Renter-Occupied | 2,703 (37.0%) | $31,104 |
| Average | 7,299 (100.0%) | $45,250 |
Occupancy by Householder Income Bracket in Bristol city
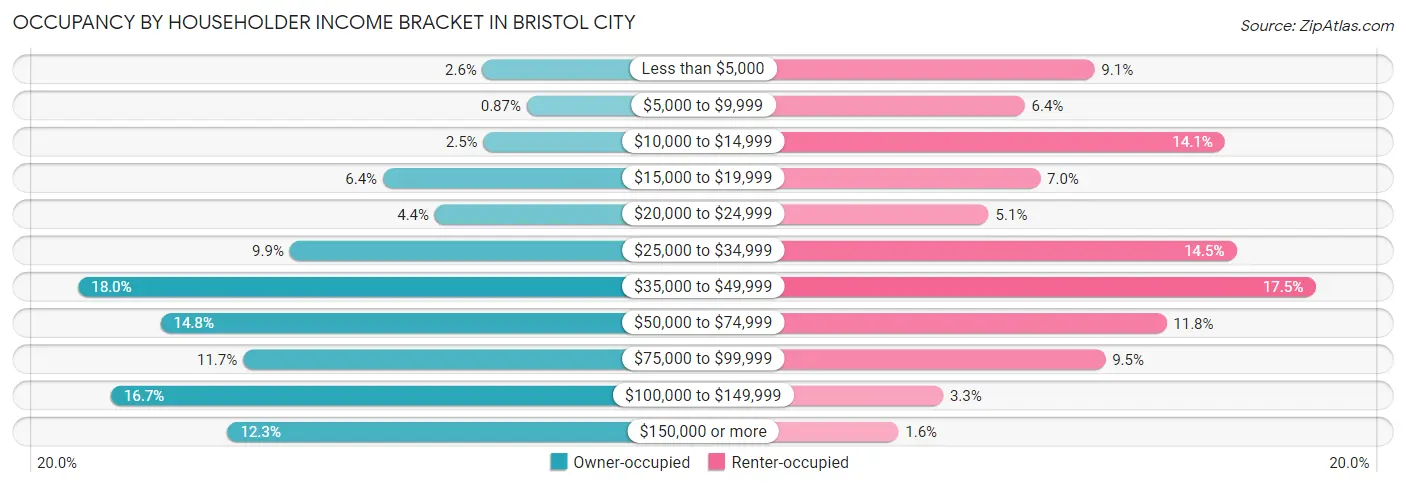
| Income Bracket | Owner-occupied | Renter-occupied |
| Less than $5,000 | 117 (2.5%) | 246 (9.1%) |
| $5,000 to $9,999 | 40 (0.9%) | 174 (6.4%) |
| $10,000 to $14,999 | 116 (2.5%) | 380 (14.1%) |
| $15,000 to $19,999 | 292 (6.4%) | 190 (7.0%) |
| $20,000 to $24,999 | 201 (4.4%) | 137 (5.1%) |
| $25,000 to $34,999 | 455 (9.9%) | 392 (14.5%) |
| $35,000 to $49,999 | 825 (17.9%) | 473 (17.5%) |
| $50,000 to $74,999 | 681 (14.8%) | 320 (11.8%) |
| $75,000 to $99,999 | 537 (11.7%) | 257 (9.5%) |
| $100,000 to $149,999 | 768 (16.7%) | 90 (3.3%) |
| $150,000 or more | 564 (12.3%) | 44 (1.6%) |
| Total | 4,596 (100.0%) | 2,703 (100.0%) |
Monthly Housing Cost Tiers in Bristol city
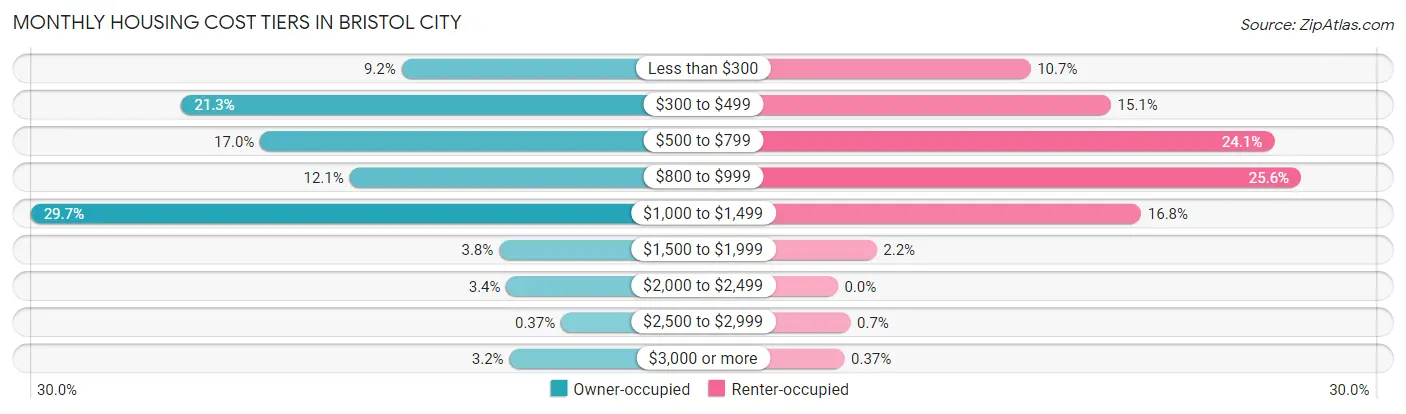
| Monthly Cost | Owner-occupied | Renter-occupied |
| Less than $300 | 422 (9.2%) | 288 (10.6%) |
| $300 to $499 | 981 (21.3%) | 408 (15.1%) |
| $500 to $799 | 781 (17.0%) | 652 (24.1%) |
| $800 to $999 | 554 (12.0%) | 692 (25.6%) |
| $1,000 to $1,499 | 1,363 (29.7%) | 453 (16.8%) |
| $1,500 to $1,999 | 174 (3.8%) | 58 (2.1%) |
| $2,000 to $2,499 | 156 (3.4%) | 0 (0.0%) |
| $2,500 to $2,999 | 17 (0.4%) | 19 (0.7%) |
| $3,000 or more | 148 (3.2%) | 10 (0.4%) |
| Total | 4,596 (100.0%) | 2,703 (100.0%) |
Physical Housing Characteristics in Bristol city
Housing Structures in Bristol city
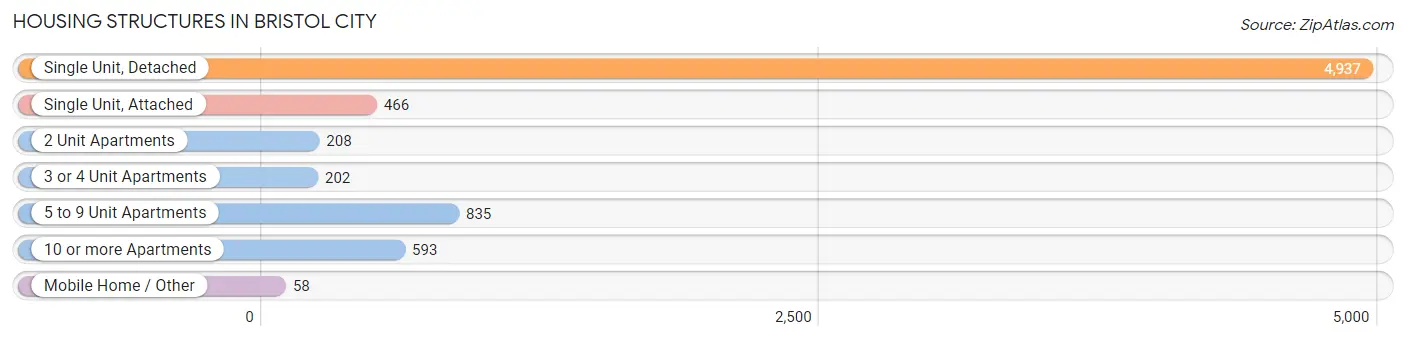
| Structure Type | # Housing Units | % Housing Units |
| Single Unit, Detached | 4,937 | 67.6% |
| Single Unit, Attached | 466 | 6.4% |
| 2 Unit Apartments | 208 | 2.9% |
| 3 or 4 Unit Apartments | 202 | 2.8% |
| 5 to 9 Unit Apartments | 835 | 11.4% |
| 10 or more Apartments | 593 | 8.1% |
| Mobile Home / Other | 58 | 0.8% |
| Total | 7,299 | 100.0% |
Housing Structures by Occupancy in Bristol city
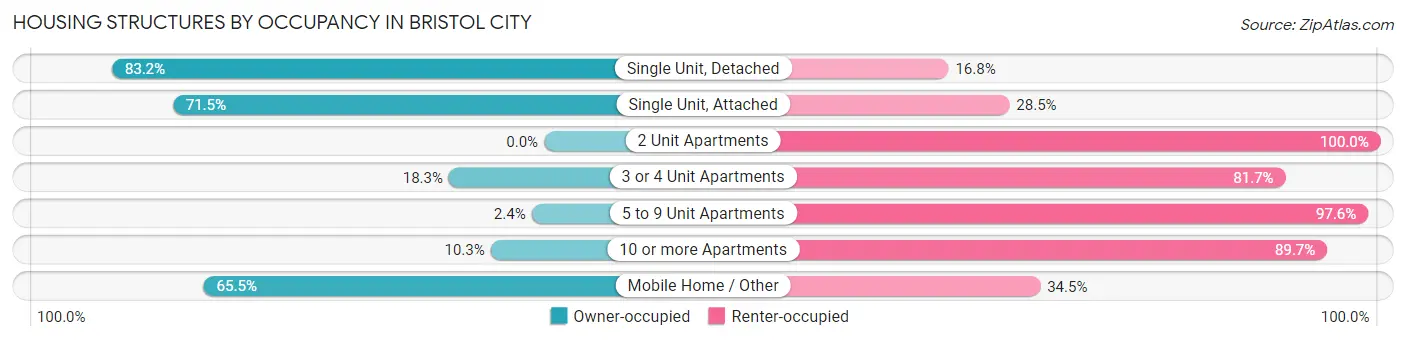
| Structure Type | Owner-occupied | Renter-occupied |
| Single Unit, Detached | 4,107 (83.2%) | 830 (16.8%) |
| Single Unit, Attached | 333 (71.5%) | 133 (28.5%) |
| 2 Unit Apartments | 0 (0.0%) | 208 (100.0%) |
| 3 or 4 Unit Apartments | 37 (18.3%) | 165 (81.7%) |
| 5 to 9 Unit Apartments | 20 (2.4%) | 815 (97.6%) |
| 10 or more Apartments | 61 (10.3%) | 532 (89.7%) |
| Mobile Home / Other | 38 (65.5%) | 20 (34.5%) |
| Total | 4,596 (63.0%) | 2,703 (37.0%) |
Housing Structures by Number of Rooms in Bristol city
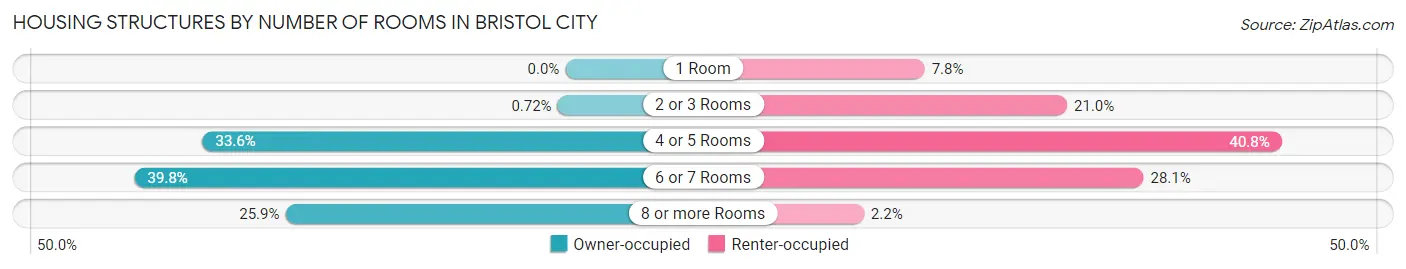
| Number of Rooms | Owner-occupied | Renter-occupied |
| 1 Room | 0 (0.0%) | 212 (7.8%) |
| 2 or 3 Rooms | 33 (0.7%) | 568 (21.0%) |
| 4 or 5 Rooms | 1,542 (33.6%) | 1,104 (40.8%) |
| 6 or 7 Rooms | 1,831 (39.8%) | 759 (28.1%) |
| 8 or more Rooms | 1,190 (25.9%) | 60 (2.2%) |
| Total | 4,596 (100.0%) | 2,703 (100.0%) |
Housing Structure by Heating Type in Bristol city
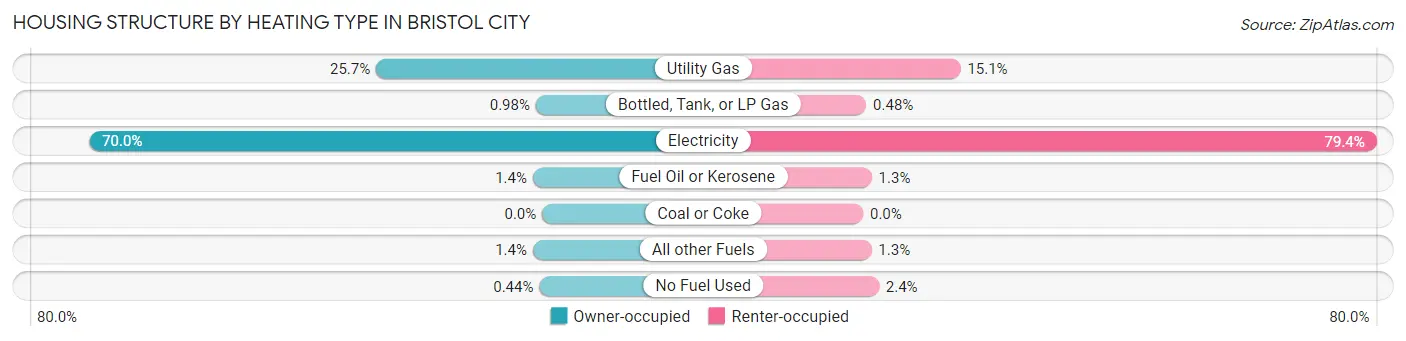
| Heating Type | Owner-occupied | Renter-occupied |
| Utility Gas | 1,180 (25.7%) | 407 (15.1%) |
| Bottled, Tank, or LP Gas | 45 (1.0%) | 13 (0.5%) |
| Electricity | 3,219 (70.0%) | 2,146 (79.4%) |
| Fuel Oil or Kerosene | 66 (1.4%) | 36 (1.3%) |
| Coal or Coke | 0 (0.0%) | 0 (0.0%) |
| All other Fuels | 66 (1.4%) | 35 (1.3%) |
| No Fuel Used | 20 (0.4%) | 66 (2.4%) |
| Total | 4,596 (100.0%) | 2,703 (100.0%) |
Household Vehicle Usage in Bristol city
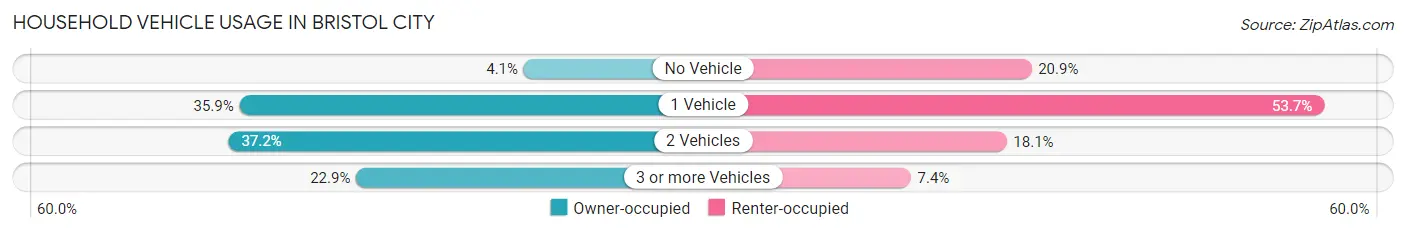
| Vehicles per Household | Owner-occupied | Renter-occupied |
| No Vehicle | 187 (4.1%) | 564 (20.9%) |
| 1 Vehicle | 1,651 (35.9%) | 1,451 (53.7%) |
| 2 Vehicles | 1,708 (37.2%) | 489 (18.1%) |
| 3 or more Vehicles | 1,050 (22.9%) | 199 (7.4%) |
| Total | 4,596 (100.0%) | 2,703 (100.0%) |
Real Estate & Mortgages in Bristol city
Real Estate and Mortgage Overview in Bristol city
| Characteristic | Without Mortgage | With Mortgage |
| Housing Units | 1,964 | 2,632 |
| Median Property Value | $126,200 | $169,500 |
| Median Household Income | $44,838 | $407 |
| Monthly Housing Costs | $398 | $148 |
| Real Estate Taxes | $1,188 | $13 |
Property Value by Mortgage Status in Bristol city
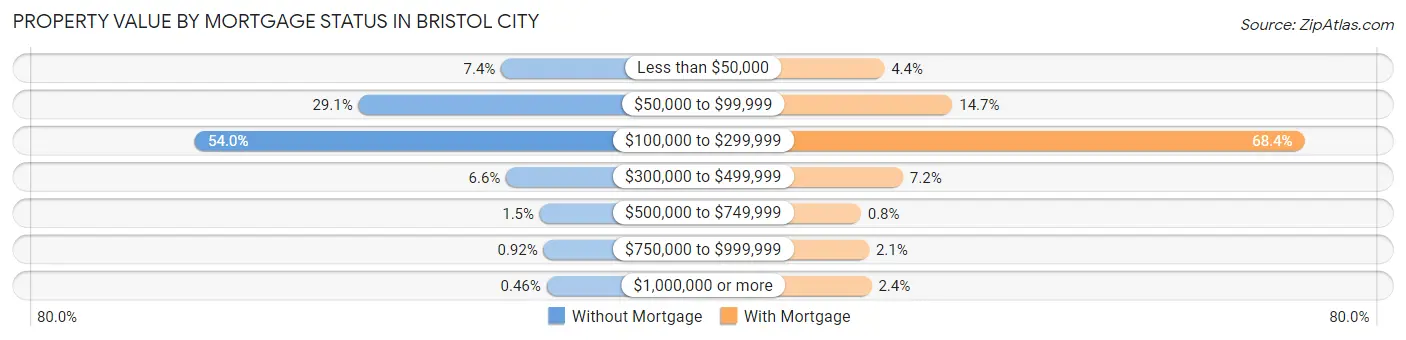
| Property Value | Without Mortgage | With Mortgage |
| Less than $50,000 | 145 (7.4%) | 115 (4.4%) |
| $50,000 to $99,999 | 572 (29.1%) | 388 (14.7%) |
| $100,000 to $299,999 | 1,061 (54.0%) | 1,800 (68.4%) |
| $300,000 to $499,999 | 130 (6.6%) | 190 (7.2%) |
| $500,000 to $749,999 | 29 (1.5%) | 21 (0.8%) |
| $750,000 to $999,999 | 18 (0.9%) | 54 (2.1%) |
| $1,000,000 or more | 9 (0.5%) | 64 (2.4%) |
| Total | 1,964 (100.0%) | 2,632 (100.0%) |
Household Income by Mortgage Status in Bristol city
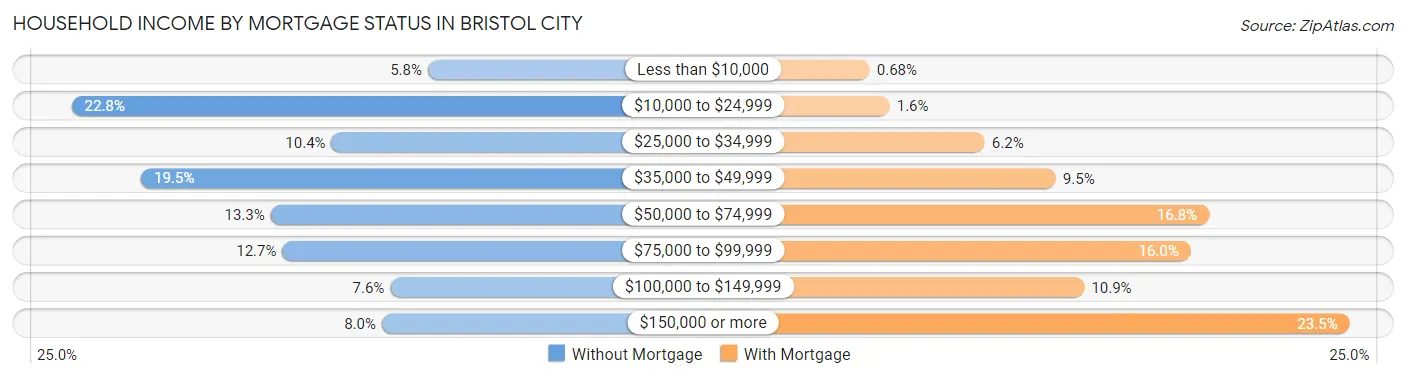
| Household Income | Without Mortgage | With Mortgage |
| Less than $10,000 | 114 (5.8%) | 18 (0.7%) |
| $10,000 to $24,999 | 447 (22.8%) | 43 (1.6%) |
| $25,000 to $34,999 | 204 (10.4%) | 162 (6.2%) |
| $35,000 to $49,999 | 382 (19.5%) | 251 (9.5%) |
| $50,000 to $74,999 | 261 (13.3%) | 443 (16.8%) |
| $75,000 to $99,999 | 250 (12.7%) | 420 (16.0%) |
| $100,000 to $149,999 | 149 (7.6%) | 287 (10.9%) |
| $150,000 or more | 157 (8.0%) | 619 (23.5%) |
| Total | 1,964 (100.0%) | 2,632 (100.0%) |
Property Value to Household Income Ratio in Bristol city
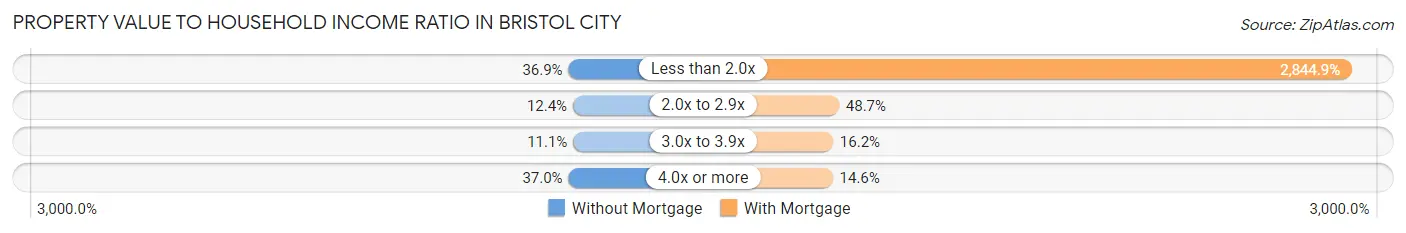
| Value-to-Income Ratio | Without Mortgage | With Mortgage |
| Less than 2.0x | 724 (36.9%) | 74,877 (2,844.9%) |
| 2.0x to 2.9x | 244 (12.4%) | 1,282 (48.7%) |
| 3.0x to 3.9x | 217 (11.1%) | 427 (16.2%) |
| 4.0x or more | 726 (37.0%) | 384 (14.6%) |
| Total | 1,964 (100.0%) | 2,632 (100.0%) |
Real Estate Taxes by Mortgage Status in Bristol city
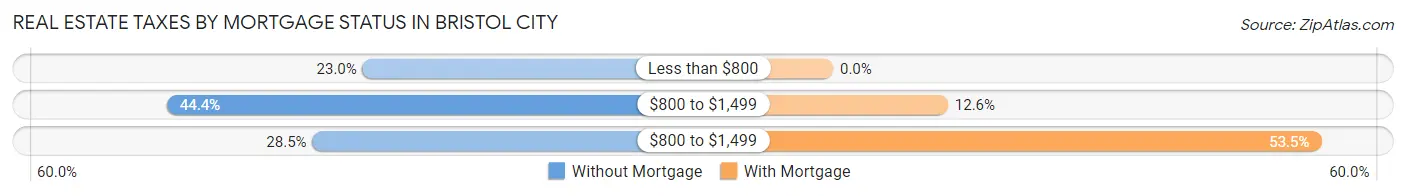
| Property Taxes | Without Mortgage | With Mortgage |
| Less than $800 | 451 (23.0%) | 0 (0.0%) |
| $800 to $1,499 | 872 (44.4%) | 331 (12.6%) |
| $800 to $1,499 | 559 (28.5%) | 1,408 (53.5%) |
| Total | 1,964 (100.0%) | 2,632 (100.0%) |
Health & Disability in Bristol city
Health Insurance Coverage by Age in Bristol city
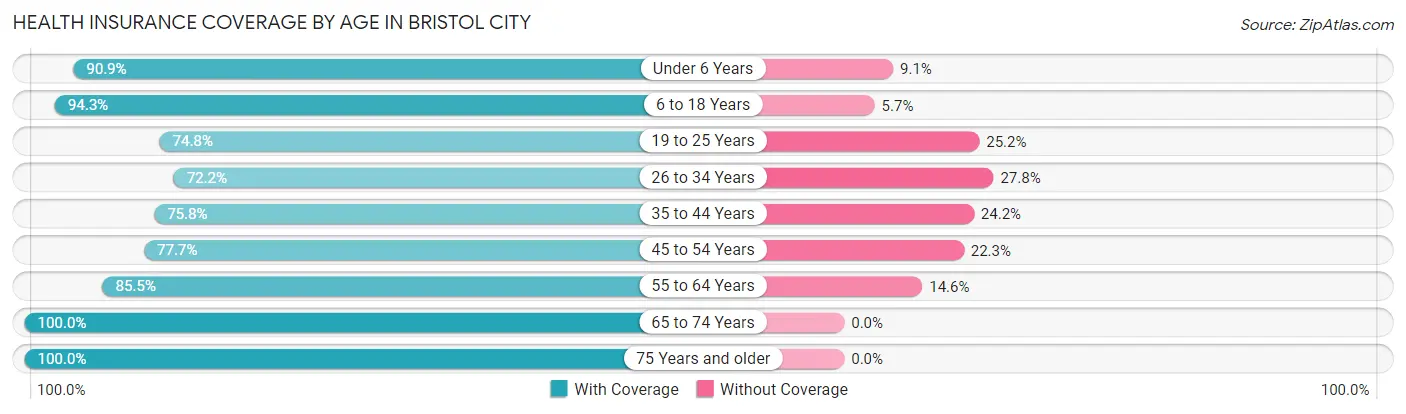
| Age Bracket | With Coverage | Without Coverage |
| Under 6 Years | 879 (90.9%) | 88 (9.1%) |
| 6 to 18 Years | 2,517 (94.3%) | 151 (5.7%) |
| 19 to 25 Years | 936 (74.8%) | 315 (25.2%) |
| 26 to 34 Years | 1,196 (72.2%) | 461 (27.8%) |
| 35 to 44 Years | 1,622 (75.8%) | 517 (24.2%) |
| 45 to 54 Years | 1,572 (77.7%) | 451 (22.3%) |
| 55 to 64 Years | 1,862 (85.5%) | 317 (14.5%) |
| 65 to 74 Years | 2,115 (100.0%) | 0 (0.0%) |
| 75 Years and older | 1,820 (100.0%) | 0 (0.0%) |
| Total | 14,519 (86.3%) | 2,300 (13.7%) |
Health Insurance Coverage by Citizenship Status in Bristol city
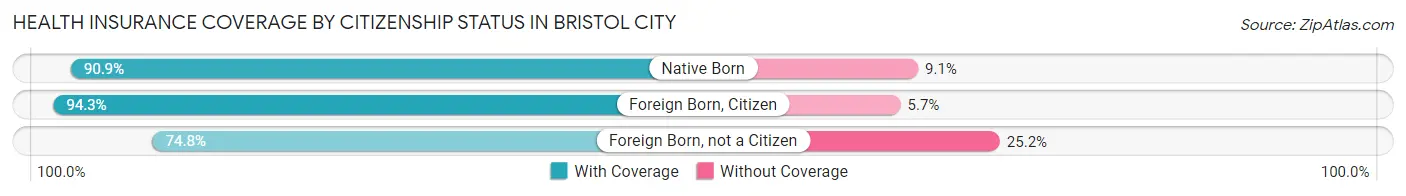
| Citizenship Status | With Coverage | Without Coverage |
| Native Born | 879 (90.9%) | 88 (9.1%) |
| Foreign Born, Citizen | 2,517 (94.3%) | 151 (5.7%) |
| Foreign Born, not a Citizen | 936 (74.8%) | 315 (25.2%) |
Health Insurance Coverage by Household Income in Bristol city
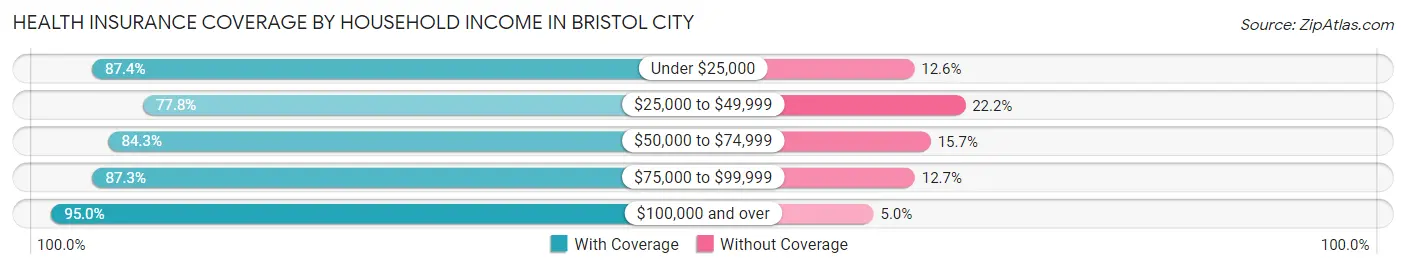
| Household Income | With Coverage | Without Coverage |
| Under $25,000 | 2,682 (87.4%) | 388 (12.6%) |
| $25,000 to $49,999 | 3,396 (77.8%) | 968 (22.2%) |
| $50,000 to $74,999 | 2,341 (84.3%) | 437 (15.7%) |
| $75,000 to $99,999 | 2,027 (87.3%) | 296 (12.7%) |
| $100,000 and over | 4,003 (95.0%) | 211 (5.0%) |
Public vs Private Health Insurance Coverage by Age in Bristol city
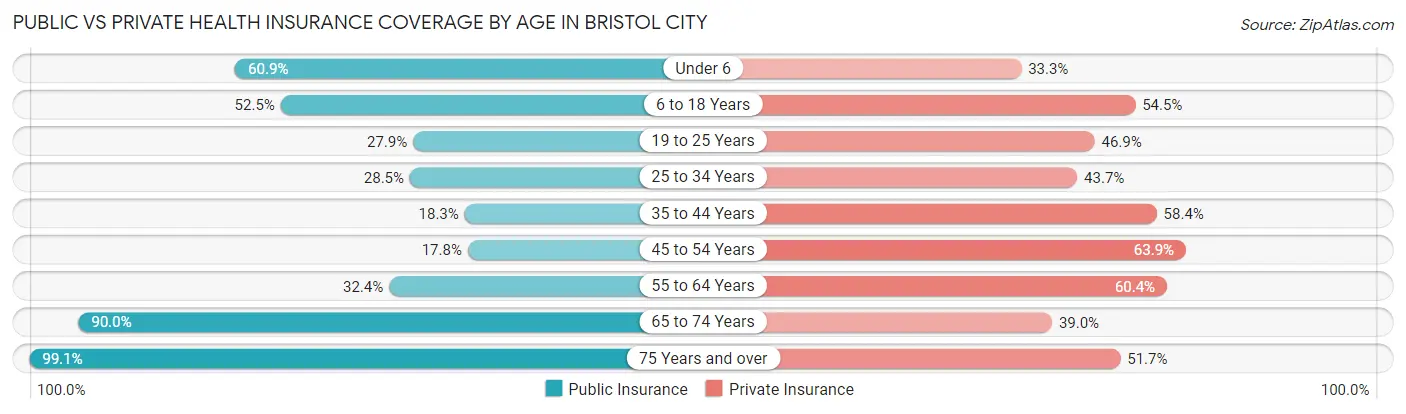
| Age Bracket | Public Insurance | Private Insurance |
| Under 6 | 589 (60.9%) | 322 (33.3%) |
| 6 to 18 Years | 1,400 (52.5%) | 1,453 (54.5%) |
| 19 to 25 Years | 349 (27.9%) | 587 (46.9%) |
| 25 to 34 Years | 472 (28.5%) | 724 (43.7%) |
| 35 to 44 Years | 392 (18.3%) | 1,250 (58.4%) |
| 45 to 54 Years | 359 (17.7%) | 1,292 (63.9%) |
| 55 to 64 Years | 705 (32.4%) | 1,315 (60.4%) |
| 65 to 74 Years | 1,904 (90.0%) | 825 (39.0%) |
| 75 Years and over | 1,804 (99.1%) | 941 (51.7%) |
| Total | 7,974 (47.4%) | 8,709 (51.8%) |
Disability Status by Sex by Age in Bristol city
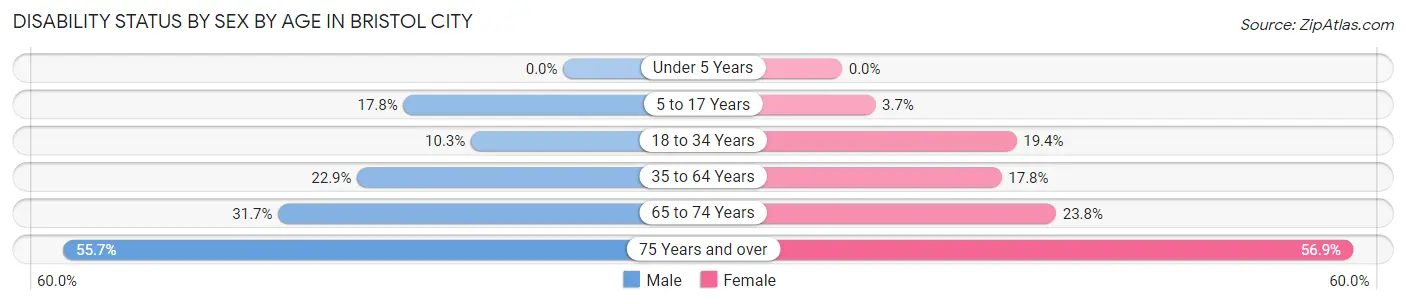
| Age Bracket | Male | Female |
| Under 5 Years | 0 (0.0%) | 0 (0.0%) |
| 5 to 17 Years | 214 (17.8%) | 49 (3.7%) |
| 18 to 34 Years | 158 (10.3%) | 314 (19.4%) |
| 35 to 64 Years | 733 (22.9%) | 559 (17.8%) |
| 65 to 74 Years | 305 (31.7%) | 275 (23.8%) |
| 75 Years and over | 366 (55.7%) | 662 (56.9%) |
Disability Class by Sex by Age in Bristol city
Disability Class: Hearing Difficulty
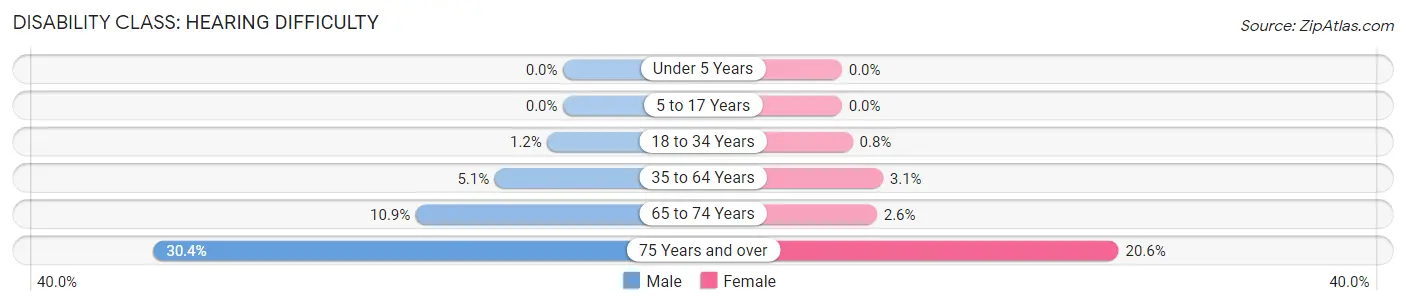
| Age Bracket | Male | Female |
| Under 5 Years | 0 (0.0%) | 0 (0.0%) |
| 5 to 17 Years | 0 (0.0%) | 0 (0.0%) |
| 18 to 34 Years | 18 (1.2%) | 13 (0.8%) |
| 35 to 64 Years | 162 (5.1%) | 96 (3.0%) |
| 65 to 74 Years | 105 (10.9%) | 30 (2.6%) |
| 75 Years and over | 200 (30.4%) | 239 (20.5%) |
Disability Class: Vision Difficulty
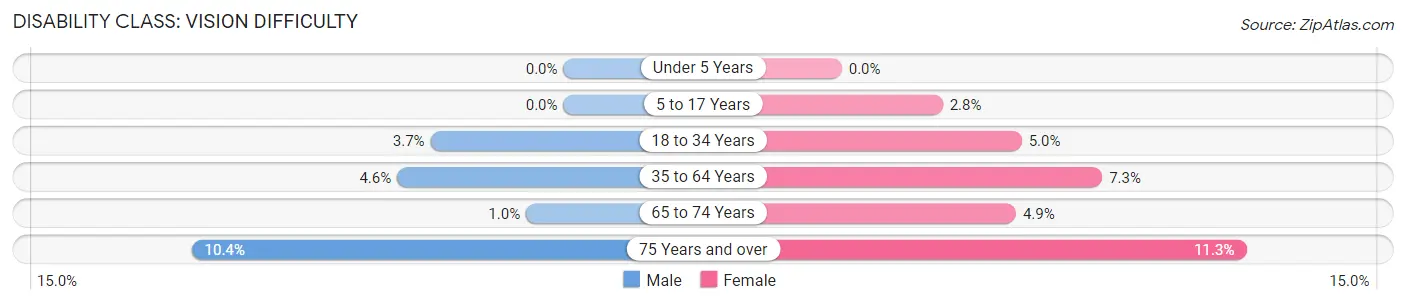
| Age Bracket | Male | Female |
| Under 5 Years | 0 (0.0%) | 0 (0.0%) |
| 5 to 17 Years | 0 (0.0%) | 37 (2.8%) |
| 18 to 34 Years | 57 (3.7%) | 81 (5.0%) |
| 35 to 64 Years | 148 (4.6%) | 228 (7.2%) |
| 65 to 74 Years | 10 (1.0%) | 56 (4.9%) |
| 75 Years and over | 68 (10.3%) | 131 (11.3%) |
Disability Class: Cognitive Difficulty
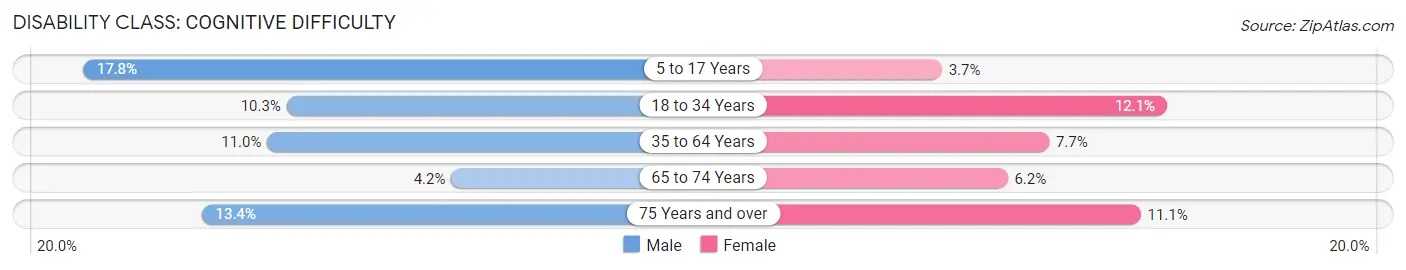
| Age Bracket | Male | Female |
| 5 to 17 Years | 214 (17.8%) | 49 (3.7%) |
| 18 to 34 Years | 158 (10.3%) | 195 (12.1%) |
| 35 to 64 Years | 351 (11.0%) | 242 (7.7%) |
| 65 to 74 Years | 40 (4.2%) | 71 (6.1%) |
| 75 Years and over | 88 (13.4%) | 129 (11.1%) |
Disability Class: Ambulatory Difficulty
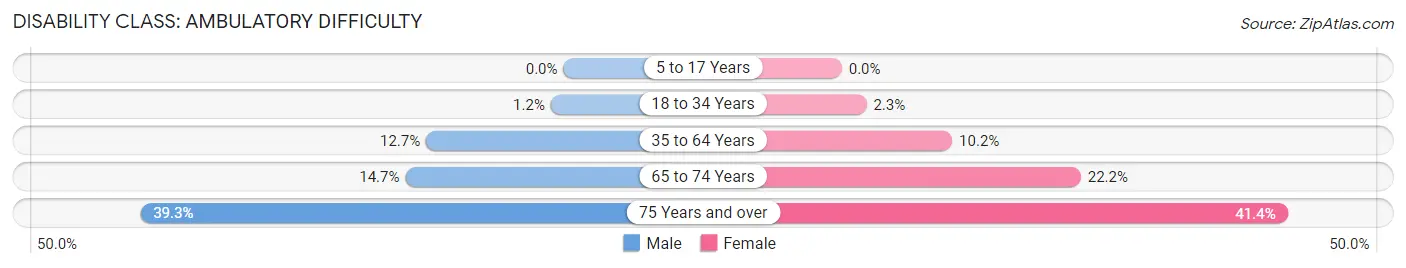
| Age Bracket | Male | Female |
| 5 to 17 Years | 0 (0.0%) | 0 (0.0%) |
| 18 to 34 Years | 18 (1.2%) | 37 (2.3%) |
| 35 to 64 Years | 407 (12.7%) | 322 (10.2%) |
| 65 to 74 Years | 141 (14.7%) | 256 (22.2%) |
| 75 Years and over | 258 (39.3%) | 481 (41.4%) |
Disability Class: Self-Care Difficulty
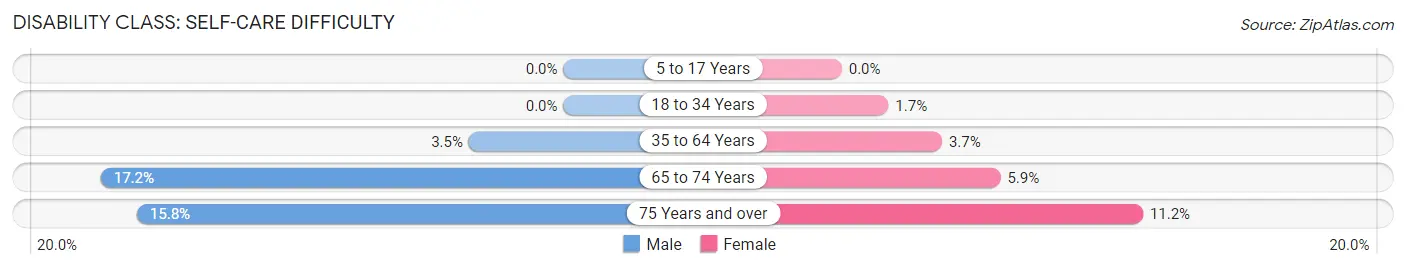
| Age Bracket | Male | Female |
| 5 to 17 Years | 0 (0.0%) | 0 (0.0%) |
| 18 to 34 Years | 0 (0.0%) | 28 (1.7%) |
| 35 to 64 Years | 112 (3.5%) | 117 (3.7%) |
| 65 to 74 Years | 165 (17.2%) | 68 (5.9%) |
| 75 Years and over | 104 (15.8%) | 130 (11.2%) |
Technology Access in Bristol city
Computing Device Access in Bristol city
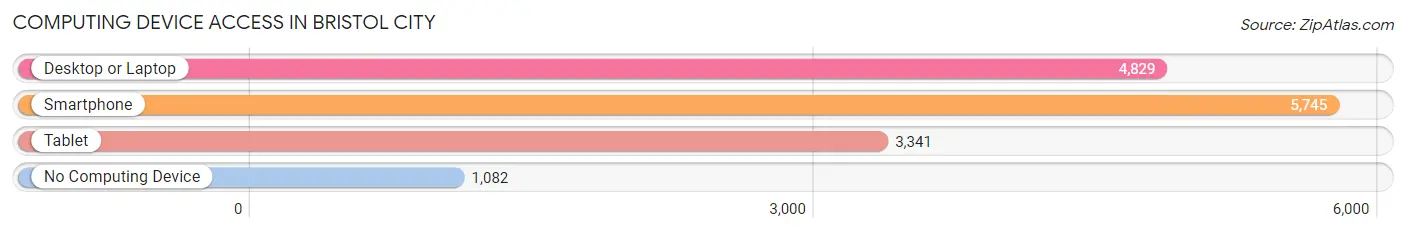
| Device Type | # Households | % Households |
| Desktop or Laptop | 4,829 | 66.2% |
| Smartphone | 5,745 | 78.7% |
| Tablet | 3,341 | 45.8% |
| No Computing Device | 1,082 | 14.8% |
| Total | 7,299 | 100.0% |
Internet Access in Bristol city
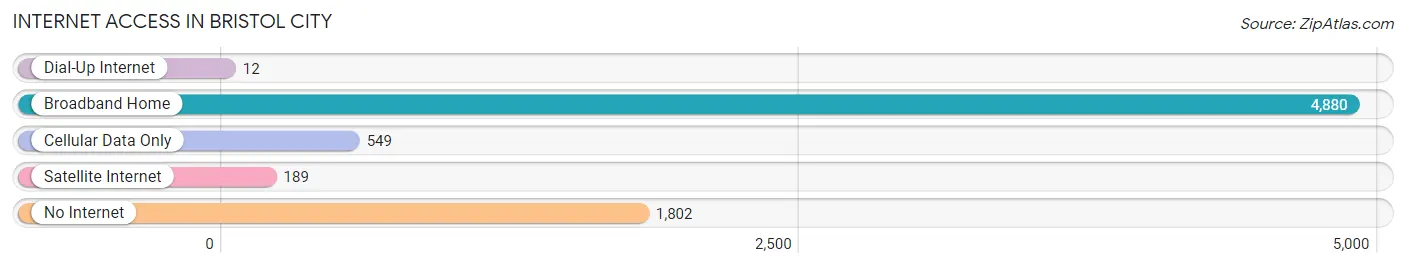
| Internet Type | # Households | % Households |
| Dial-Up Internet | 12 | 0.2% |
| Broadband Home | 4,880 | 66.9% |
| Cellular Data Only | 549 | 7.5% |
| Satellite Internet | 189 | 2.6% |
| No Internet | 1,802 | 24.7% |
| Total | 7,299 | 100.0% |
Bristol city Summary
Bristol City, Virginia is a small city located in the southwestern corner of the state, near the border of Tennessee. It is part of the Tri-Cities region, which includes the cities of Bristol, Kingsport, and Johnson City, Tennessee. The city has a population of 17,835, according to the 2019 U.S. Census.
History
Bristol City was founded in 1852 as a railroad town, and was named after the city of Bristol, England. The city was originally part of Washington County, Virginia, but was annexed by the city of Bristol, Tennessee in 1890. The city was officially incorporated in 1890, and has since grown to become the largest city in the Tri-Cities region.
Geography
Bristol City is located in the southwestern corner of Virginia, near the border of Tennessee. The city is situated in the Appalachian Mountains, and is surrounded by the Blue Ridge Mountains to the east and the Cumberland Mountains to the west. The city is located along the Holston River, which flows through the city and is a major source of water for the area. The city is also located near the Cherokee National Forest, which provides a variety of recreational activities for residents and visitors.
Economy
Bristol City’s economy is largely based on manufacturing and retail. The city is home to several large manufacturing companies, including Eastman Chemical Company, which produces chemicals and plastics, and Alpha Natural Resources, which produces coal and other minerals. The city is also home to several retail stores, including Walmart, Target, and Lowe’s.
Demographics
According to the 2019 U.S. Census, the population of Bristol City is 17,835. The city has a median age of 38.7 years, and the median household income is $41,945. The city is predominantly white (90.2%), with a small percentage of African Americans (4.3%), Hispanics (2.3%), and Asians (1.2%). The city also has a large population of Native Americans (0.7%).
Conclusion
Bristol City, Virginia is a small city located in the southwestern corner of the state, near the border of Tennessee. The city has a population of 17,835, and is part of the Tri-Cities region. The city was founded in 1852 as a railroad town, and has since grown to become the largest city in the region. The city’s economy is largely based on manufacturing and retail, and the city is home to several large companies and retail stores. The city is predominantly white, with a small percentage of African Americans, Hispanics, Asians, and Native Americans.
Common Questions
What is Per Capita Income in Bristol city?
Per Capita income in Bristol city is $30,419.
What is the Median Family Income in Bristol city?
Median Family Income in Bristol city is $71,500.
What is the Median Household income in Bristol city?
Median Household Income in Bristol city is $45,250.
What is Income or Wage Gap in Bristol city?
Income or Wage Gap in Bristol city is 19.2%.
Women in Bristol city earn 80.8 cents for every dollar earned by a man.
What is Family Income Deficit in Bristol city?
Family Income Deficit in Bristol city is $12,261.
Families that are below poverty line in Bristol city earn $12,261 less on average than the poverty threshold level.
What is Inequality or Gini Index in Bristol city?
Inequality or Gini Index in Bristol city is 0.48.
What is the Total Population of Bristol city?
Total Population of Bristol city is 17,036.
What is the Total Male Population of Bristol city?
Total Male Population of Bristol city is 8,213.
What is the Total Female Population of Bristol city?
Total Female Population of Bristol city is 8,823.
What is the Ratio of Males per 100 Females in Bristol city?
There are 93.09 Males per 100 Females in Bristol city.
What is the Ratio of Females per 100 Males in Bristol city?
There are 107.43 Females per 100 Males in Bristol city.
What is the Median Population Age in Bristol city?
Median Population Age in Bristol city is 43.7 Years.
What is the Average Family Size in Bristol city
Average Family Size in Bristol city is 3.1 People.
What is the Average Household Size in Bristol city
Average Household Size in Bristol city is 2.3 People.
How Large is the Labor Force in Bristol city?
There are 7,745 People in the Labor Forcein in Bristol city.
What is the Percentage of People in the Labor Force in Bristol city?
55.7% of People are in the Labor Force in Bristol city.
What is the Unemployment Rate in Bristol city?
Unemployment Rate in Bristol city is 4.1%.