Botetourt County, VA Map & Demographics
Botetourt County Map
Botetourt County Overview
$40,289
PER CAPITA INCOME
$92,908
AVG FAMILY INCOME
$77,680
AVG HOUSEHOLD INCOME
27.9%
WAGE / INCOME GAP [ % ]
72.1¢/ $1
WAGE / INCOME GAP [ $ ]
$8,892
FAMILY INCOME DEFICIT
0.43
INEQUALITY / GINI INDEX
33,734
TOTAL POPULATION
16,820
MALE POPULATION
16,914
FEMALE POPULATION
99.44
MALES / 100 FEMALES
100.56
FEMALES / 100 MALES
47.5
MEDIAN AGE
3.1
AVG FAMILY SIZE
2.6
AVG HOUSEHOLD SIZE
16,780
LABOR FORCE [ PEOPLE ]
59.4%
PERCENT IN LABOR FORCE
3.1%
UNEMPLOYMENT RATE
Botetourt County Area Codes
Income in Botetourt County
Income Overview in Botetourt County
Per Capita Income in Botetourt County is $40,289, while median incomes of families and households are $92,908 and $77,680 respectively.
| Characteristic | Number | Measure |
| Per Capita Income | 33,734 | $40,289 |
| Median Family Income | 9,044 | $92,908 |
| Mean Family Income | 9,044 | $118,459 |
| Median Household Income | 12,916 | $77,680 |
| Mean Household Income | 12,916 | $99,520 |
| Income Deficit | 9,044 | $8,892 |
| Wage / Income Gap (%) | 33,734 | 27.94% |
| Wage / Income Gap ($) | 33,734 | 72.06¢ per $1 |
| Gini / Inequality Index | 33,734 | 0.43 |
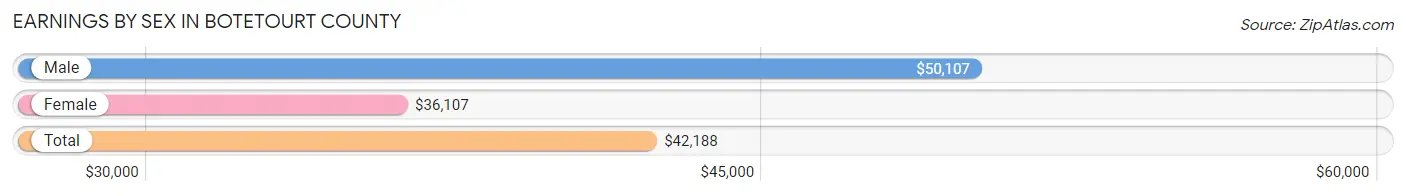
Earnings by Sex in Botetourt County
Average Earnings in Botetourt County are $42,188, $50,107 for men and $36,107 for women, a difference of 27.9%.
| Sex | Number | Average Earnings |
| Male | 9,613 (54.4%) | $50,107 |
| Female | 8,066 (45.6%) | $36,107 |
| Total | 17,679 (100.0%) | $42,188 |
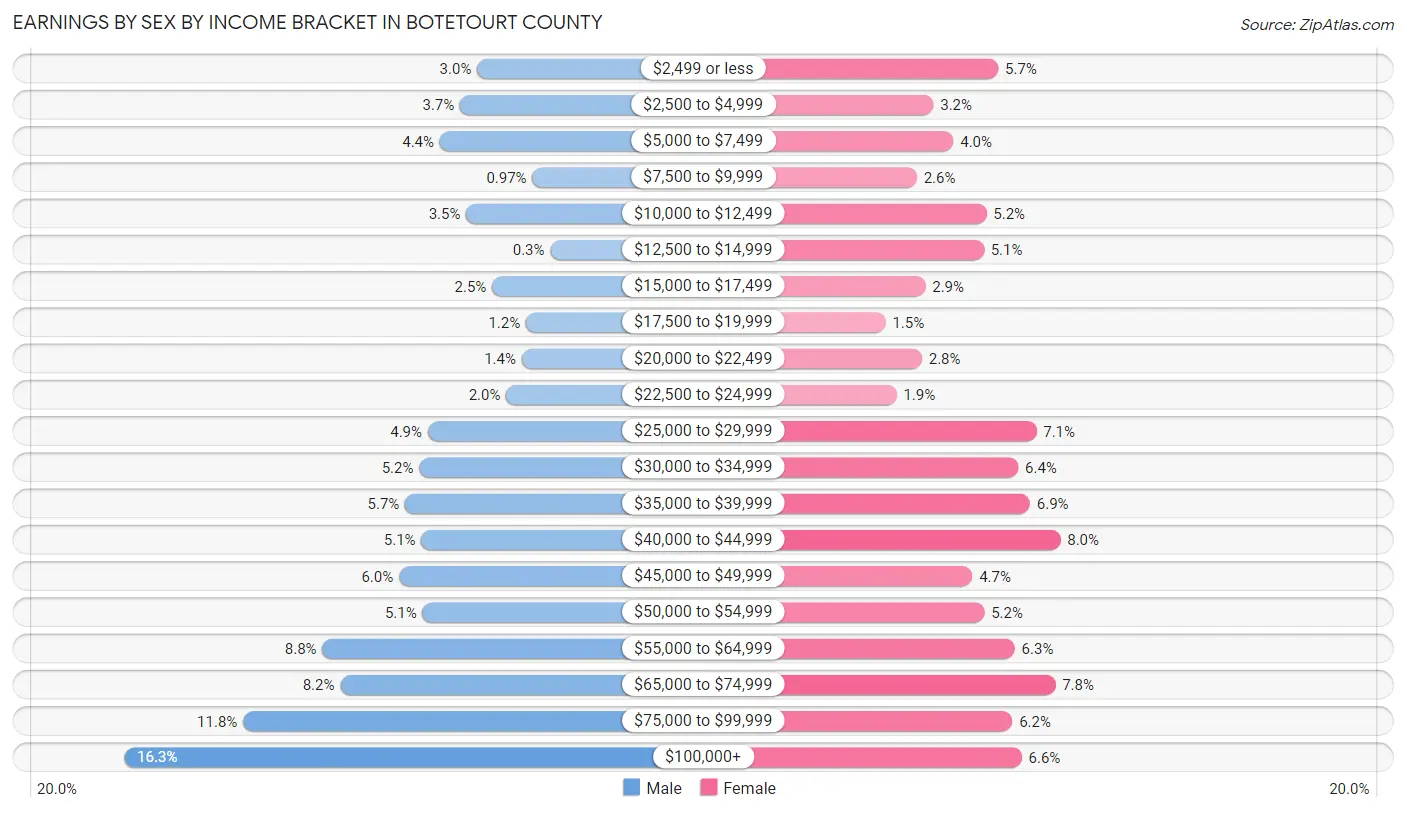
Earnings by Sex by Income Bracket in Botetourt County
The most common earnings brackets in Botetourt County are $100,000+ for men (1,564 | 16.3%) and $40,000 to $44,999 for women (645 | 8.0%).
| Income | Male | Female |
| $2,499 or less | 292 (3.0%) | 457 (5.7%) |
| $2,500 to $4,999 | 354 (3.7%) | 261 (3.2%) |
| $5,000 to $7,499 | 427 (4.4%) | 322 (4.0%) |
| $7,500 to $9,999 | 93 (1.0%) | 211 (2.6%) |
| $10,000 to $12,499 | 332 (3.5%) | 422 (5.2%) |
| $12,500 to $14,999 | 29 (0.3%) | 414 (5.1%) |
| $15,000 to $17,499 | 238 (2.5%) | 237 (2.9%) |
| $17,500 to $19,999 | 116 (1.2%) | 117 (1.5%) |
| $20,000 to $22,499 | 132 (1.4%) | 227 (2.8%) |
| $22,500 to $24,999 | 187 (1.9%) | 150 (1.9%) |
| $25,000 to $29,999 | 470 (4.9%) | 573 (7.1%) |
| $30,000 to $34,999 | 501 (5.2%) | 518 (6.4%) |
| $35,000 to $39,999 | 552 (5.7%) | 553 (6.9%) |
| $40,000 to $44,999 | 493 (5.1%) | 645 (8.0%) |
| $45,000 to $49,999 | 574 (6.0%) | 379 (4.7%) |
| $50,000 to $54,999 | 489 (5.1%) | 415 (5.1%) |
| $55,000 to $64,999 | 850 (8.8%) | 507 (6.3%) |
| $65,000 to $74,999 | 785 (8.2%) | 630 (7.8%) |
| $75,000 to $99,999 | 1,135 (11.8%) | 500 (6.2%) |
| $100,000+ | 1,564 (16.3%) | 528 (6.6%) |
| Total | 9,613 (100.0%) | 8,066 (100.0%) |
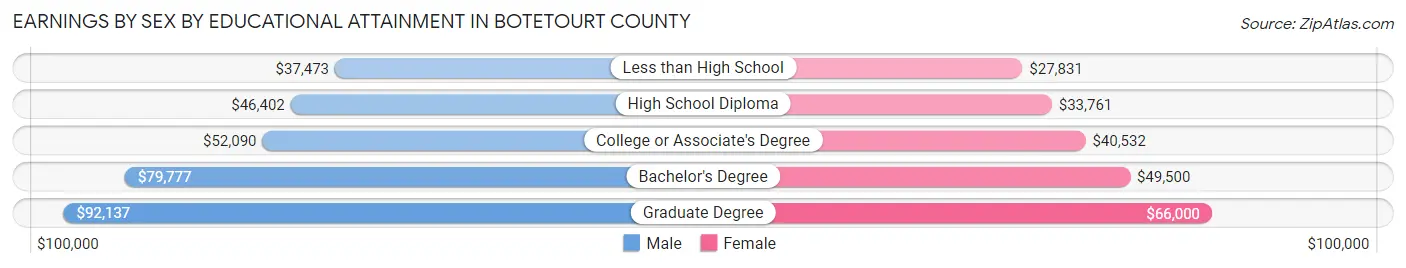
Earnings by Sex by Educational Attainment in Botetourt County
Average earnings in Botetourt County are $54,634 for men and $40,438 for women, a difference of 26.0%. Men with an educational attainment of graduate degree enjoy the highest average annual earnings of $92,137, while those with less than high school education earn the least with $37,473. Women with an educational attainment of graduate degree earn the most with the average annual earnings of $66,000, while those with less than high school education have the smallest earnings of $27,831.
| Educational Attainment | Male Income | Female Income |
| Less than High School | $37,473 | $27,831 |
| High School Diploma | $46,402 | $33,761 |
| College or Associate's Degree | $52,090 | $40,532 |
| Bachelor's Degree | $79,777 | $49,500 |
| Graduate Degree | $92,137 | $66,000 |
| Total | $54,634 | $40,438 |
Family Income in Botetourt County
Family Income Brackets in Botetourt County
According to the Botetourt County family income data, there are 2,098 families falling into the $100,000 to $149,999 income range, which is the most common income bracket and makes up 23.2% of all families. Conversely, the less than $10,000 income bracket is the least frequent group with only 99 families (1.1%) belonging to this category.
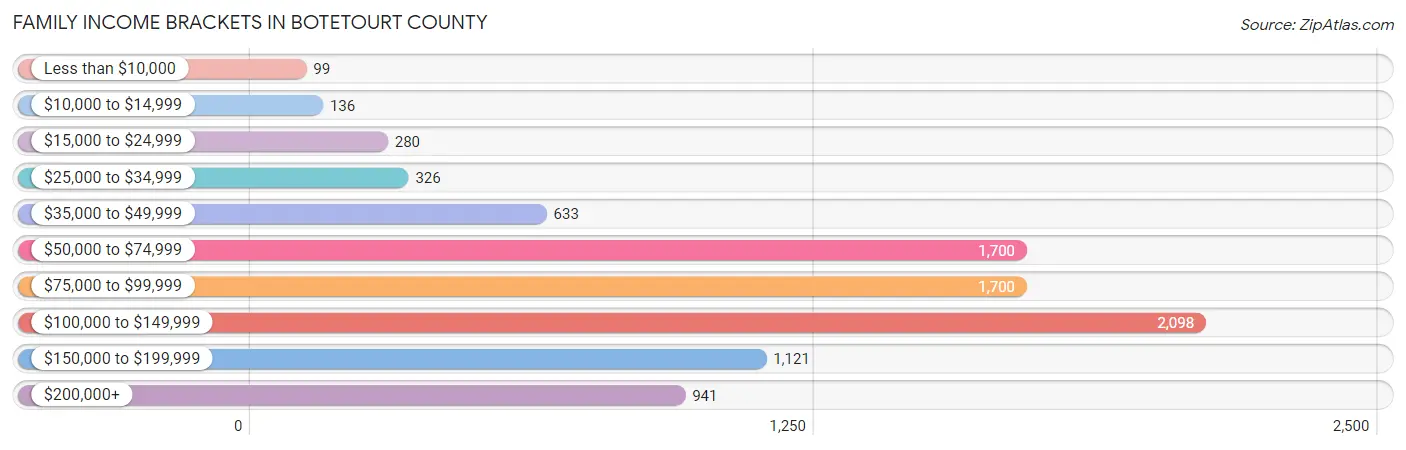
| Income Bracket | # Families | % Families |
| Less than $10,000 | 99 | 1.1% |
| $10,000 to $14,999 | 136 | 1.5% |
| $15,000 to $24,999 | 280 | 3.1% |
| $25,000 to $34,999 | 326 | 3.6% |
| $35,000 to $49,999 | 633 | 7.0% |
| $50,000 to $74,999 | 1,700 | 18.8% |
| $75,000 to $99,999 | 1,700 | 18.8% |
| $100,000 to $149,999 | 2,098 | 23.2% |
| $150,000 to $199,999 | 1,121 | 12.4% |
| $200,000+ | 941 | 10.4% |
Family Income by Famaliy Size in Botetourt County
6-person families (144 | 1.6%) account for the highest median family income in Botetourt County with $160,345 per family, while 2-person families (4,963 | 54.9%) have the highest median income of $40,156 per family member.
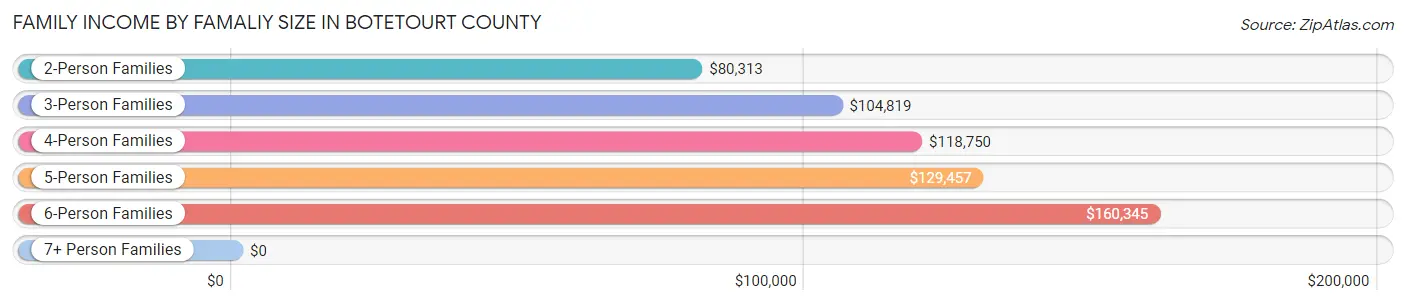
| Income Bracket | # Families | Median Income |
| 2-Person Families | 4,963 (54.9%) | $80,313 |
| 3-Person Families | 1,814 (20.1%) | $104,819 |
| 4-Person Families | 1,618 (17.9%) | $118,750 |
| 5-Person Families | 438 (4.8%) | $129,457 |
| 6-Person Families | 144 (1.6%) | $160,345 |
| 7+ Person Families | 67 (0.7%) | $0 |
| Total | 9,044 (100.0%) | $92,908 |
Family Income by Number of Earners in Botetourt County
The median family income in Botetourt County is $92,908, with families comprising 3+ earners (1,039) having the highest median family income of $129,917, while families with no earners (1,977) have the lowest median family income of $58,684, accounting for 11.5% and 21.9% of families, respectively.
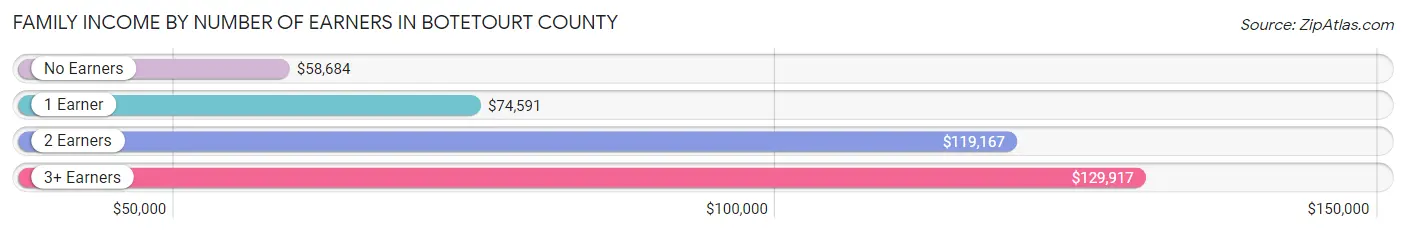
| Number of Earners | # Families | Median Income |
| No Earners | 1,977 (21.9%) | $58,684 |
| 1 Earner | 2,262 (25.0%) | $74,591 |
| 2 Earners | 3,766 (41.6%) | $119,167 |
| 3+ Earners | 1,039 (11.5%) | $129,917 |
| Total | 9,044 (100.0%) | $92,908 |
Household Income in Botetourt County
Household Income Brackets in Botetourt County
With 2,544 households falling in the category, the $50,000 to $74,999 income range is the most frequent in Botetourt County, accounting for 19.7% of all households. In contrast, only 362 households (2.8%) fall into the $10,000 to $14,999 income bracket, making it the least populous group.
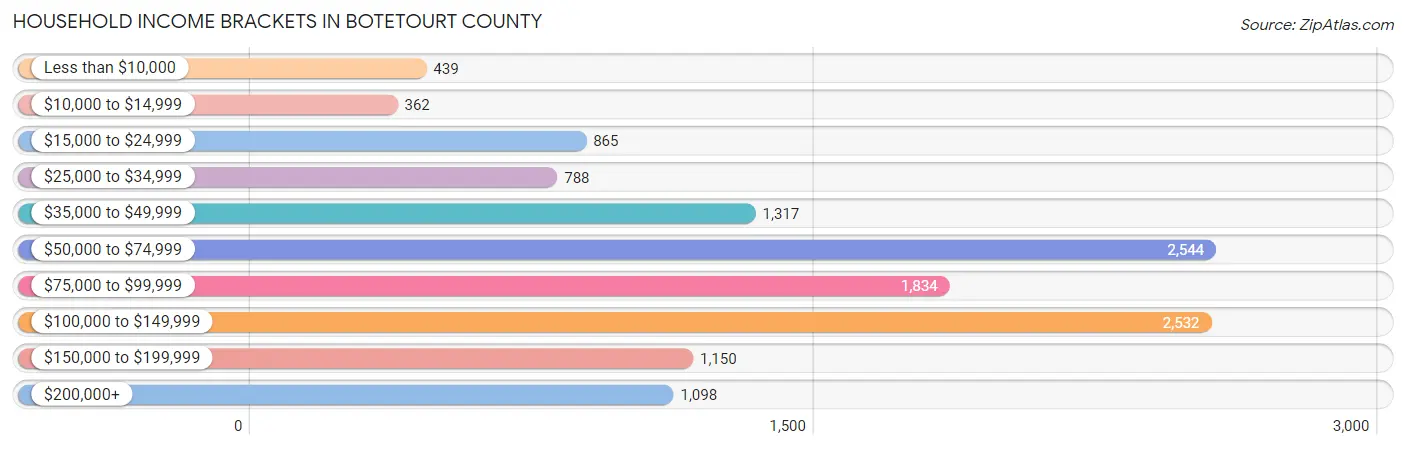
| Income Bracket | # Households | % Households |
| Less than $10,000 | 439 | 3.4% |
| $10,000 to $14,999 | 362 | 2.8% |
| $15,000 to $24,999 | 865 | 6.7% |
| $25,000 to $34,999 | 788 | 6.1% |
| $35,000 to $49,999 | 1,317 | 10.2% |
| $50,000 to $74,999 | 2,544 | 19.7% |
| $75,000 to $99,999 | 1,834 | 14.2% |
| $100,000 to $149,999 | 2,532 | 19.6% |
| $150,000 to $199,999 | 1,150 | 8.9% |
| $200,000+ | 1,098 | 8.5% |
Household Income by Householder Age in Botetourt County
The median household income in Botetourt County is $77,680, with the highest median household income of $106,620 found in the 25 to 44 years age bracket for the primary householder. A total of 2,798 households (21.7%) fall into this category. Meanwhile, the 65+ years age bracket for the primary householder has the lowest median household income of $59,943, with 4,591 households (35.5%) in this group.
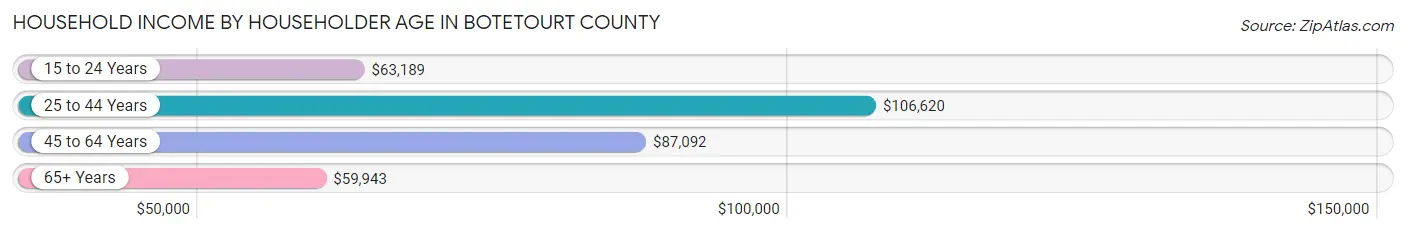
| Income Bracket | # Households | Median Income |
| 15 to 24 Years | 233 (1.8%) | $63,189 |
| 25 to 44 Years | 2,798 (21.7%) | $106,620 |
| 45 to 64 Years | 5,294 (41.0%) | $87,092 |
| 65+ Years | 4,591 (35.5%) | $59,943 |
| Total | 12,916 (100.0%) | $77,680 |
Poverty in Botetourt County
Income Below Poverty by Sex and Age in Botetourt County
With 6.2% poverty level for males and 8.1% for females among the residents of Botetourt County, 6 to 11 year old males and 55 to 64 year old females are the most vulnerable to poverty, with 170 males (18.0%) and 329 females (12.0%) in their respective age groups living below the poverty level.
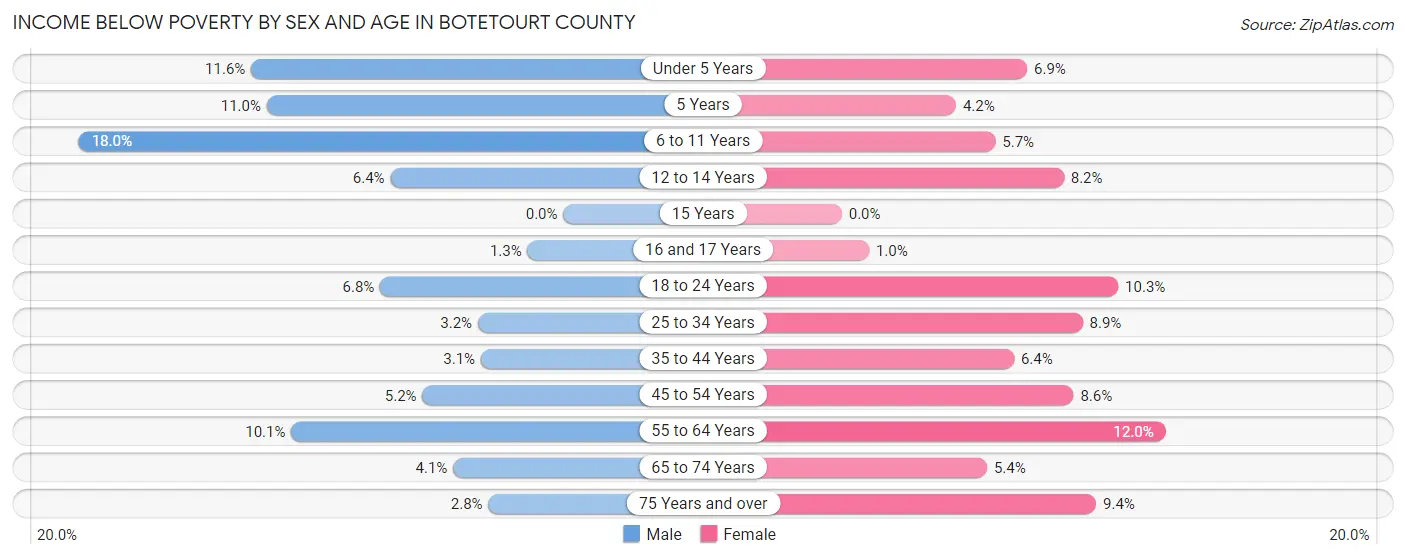
| Age Bracket | Male | Female |
| Under 5 Years | 81 (11.6%) | 48 (6.9%) |
| 5 Years | 12 (11.0%) | 5 (4.2%) |
| 6 to 11 Years | 170 (18.0%) | 72 (5.7%) |
| 12 to 14 Years | 46 (6.4%) | 37 (8.2%) |
| 15 Years | 0 (0.0%) | 0 (0.0%) |
| 16 and 17 Years | 6 (1.3%) | 4 (1.0%) |
| 18 to 24 Years | 86 (6.8%) | 125 (10.3%) |
| 25 to 34 Years | 54 (3.2%) | 139 (8.9%) |
| 35 to 44 Years | 54 (3.1%) | 110 (6.4%) |
| 45 to 54 Years | 123 (5.2%) | 201 (8.6%) |
| 55 to 64 Years | 274 (10.1%) | 329 (12.0%) |
| 65 to 74 Years | 92 (4.1%) | 121 (5.4%) |
| 75 Years and over | 37 (2.8%) | 171 (9.4%) |
| Total | 1,035 (6.2%) | 1,362 (8.1%) |
Income Above Poverty by Sex and Age in Botetourt County
According to the poverty statistics in Botetourt County, males aged 15 years and females aged 15 years are the age groups that are most secure financially, with 100.0% of males and 100.0% of females in these age groups living above the poverty line.
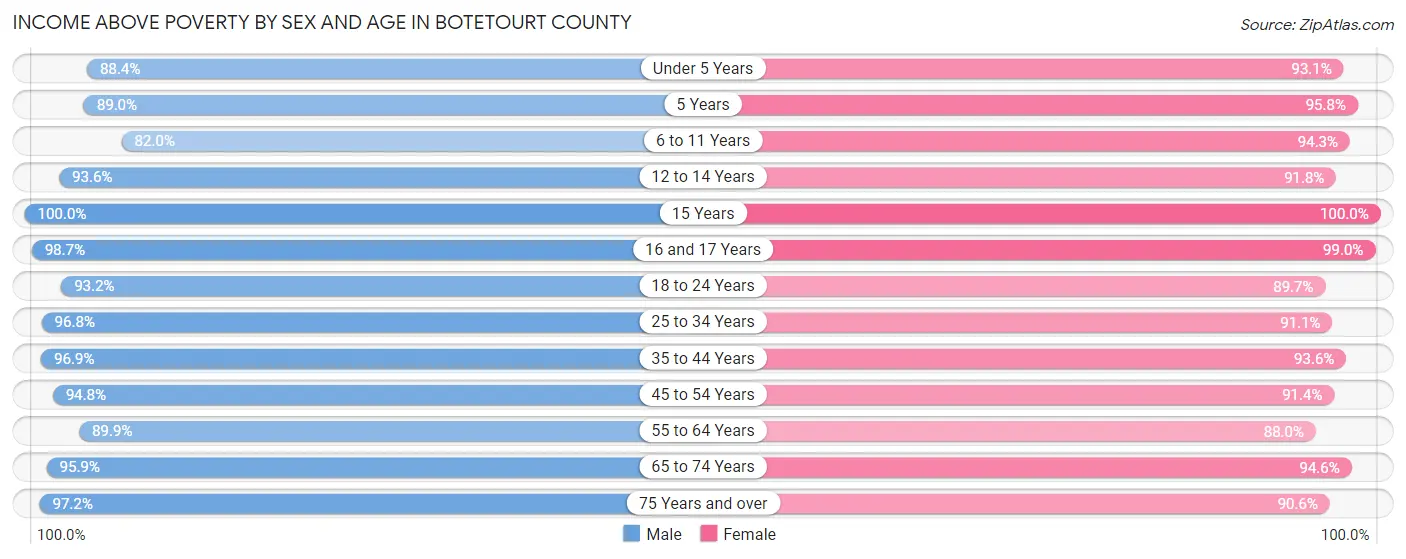
| Age Bracket | Male | Female |
| Under 5 Years | 618 (88.4%) | 650 (93.1%) |
| 5 Years | 97 (89.0%) | 113 (95.8%) |
| 6 to 11 Years | 775 (82.0%) | 1,192 (94.3%) |
| 12 to 14 Years | 671 (93.6%) | 412 (91.8%) |
| 15 Years | 285 (100.0%) | 189 (100.0%) |
| 16 and 17 Years | 445 (98.7%) | 391 (99.0%) |
| 18 to 24 Years | 1,179 (93.2%) | 1,093 (89.7%) |
| 25 to 34 Years | 1,652 (96.8%) | 1,415 (91.1%) |
| 35 to 44 Years | 1,711 (96.9%) | 1,612 (93.6%) |
| 45 to 54 Years | 2,231 (94.8%) | 2,135 (91.4%) |
| 55 to 64 Years | 2,440 (89.9%) | 2,407 (88.0%) |
| 65 to 74 Years | 2,156 (95.9%) | 2,123 (94.6%) |
| 75 Years and over | 1,293 (97.2%) | 1,640 (90.6%) |
| Total | 15,553 (93.8%) | 15,372 (91.9%) |
Income Below Poverty Among Married-Couple Families in Botetourt County
The poverty statistics for married-couple families in Botetourt County show that 2.9% or 222 of the total 7,728 families live below the poverty line. Families with 3 or 4 children have the highest poverty rate of 8.4%, comprising of 26 families. On the other hand, families with 5 or more children have the lowest poverty rate of 0.0%, which includes 0 families.
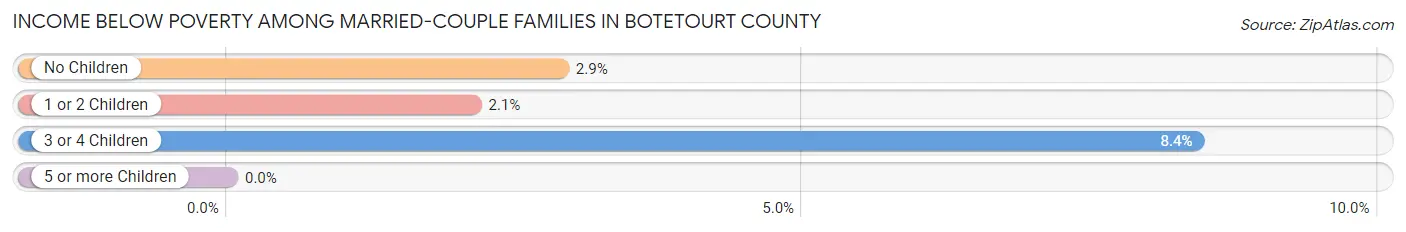
| Children | Above Poverty | Below Poverty |
| No Children | 4,986 (97.1%) | 148 (2.9%) |
| 1 or 2 Children | 2,219 (97.9%) | 48 (2.1%) |
| 3 or 4 Children | 283 (91.6%) | 26 (8.4%) |
| 5 or more Children | 18 (100.0%) | 0 (0.0%) |
| Total | 7,506 (97.1%) | 222 (2.9%) |
Income Below Poverty Among Single-Parent Households in Botetourt County
According to the poverty data in Botetourt County, 9.7% or 48 single-father households and 16.4% or 135 single-mother households are living below the poverty line. Among single-father households, those with 1 or 2 children have the highest poverty rate, with 32 households (14.7%) experiencing poverty. Likewise, among single-mother households, those with 3 or 4 children have the highest poverty rate, with 37 households (69.8%) falling below the poverty line.
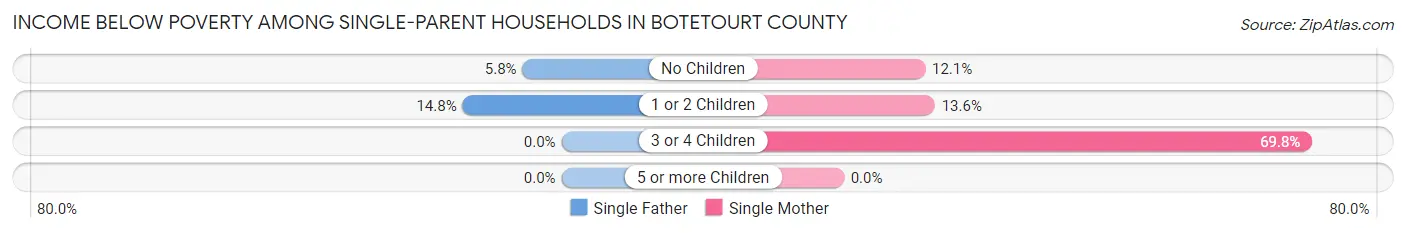
| Children | Single Father | Single Mother |
| No Children | 16 (5.8%) | 41 (12.1%) |
| 1 or 2 Children | 32 (14.7%) | 57 (13.6%) |
| 3 or 4 Children | 0 (0.0%) | 37 (69.8%) |
| 5 or more Children | 0 (0.0%) | 0 (0.0%) |
| Total | 48 (9.7%) | 135 (16.4%) |
Income Below Poverty Among Married-Couple vs Single-Parent Households in Botetourt County
The poverty data for Botetourt County shows that 222 of the married-couple family households (2.9%) and 183 of the single-parent households (13.9%) are living below the poverty level. Within the married-couple family households, those with 3 or 4 children have the highest poverty rate, with 26 households (8.4%) falling below the poverty line. Among the single-parent households, those with 3 or 4 children have the highest poverty rate, with 37 household (66.1%) living below poverty.
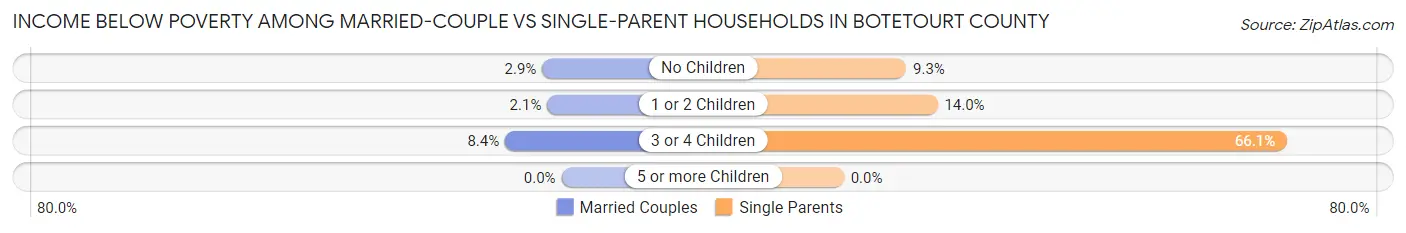
| Children | Married-Couple Families | Single-Parent Households |
| No Children | 148 (2.9%) | 57 (9.3%) |
| 1 or 2 Children | 48 (2.1%) | 89 (14.0%) |
| 3 or 4 Children | 26 (8.4%) | 37 (66.1%) |
| 5 or more Children | 0 (0.0%) | 0 (0.0%) |
| Total | 222 (2.9%) | 183 (13.9%) |
Race in Botetourt County
The most populous races in Botetourt County are White / Caucasian (31,350 | 92.9%), Two or more Races (1,091 | 3.2%), and Black / African American (858 | 2.5%).
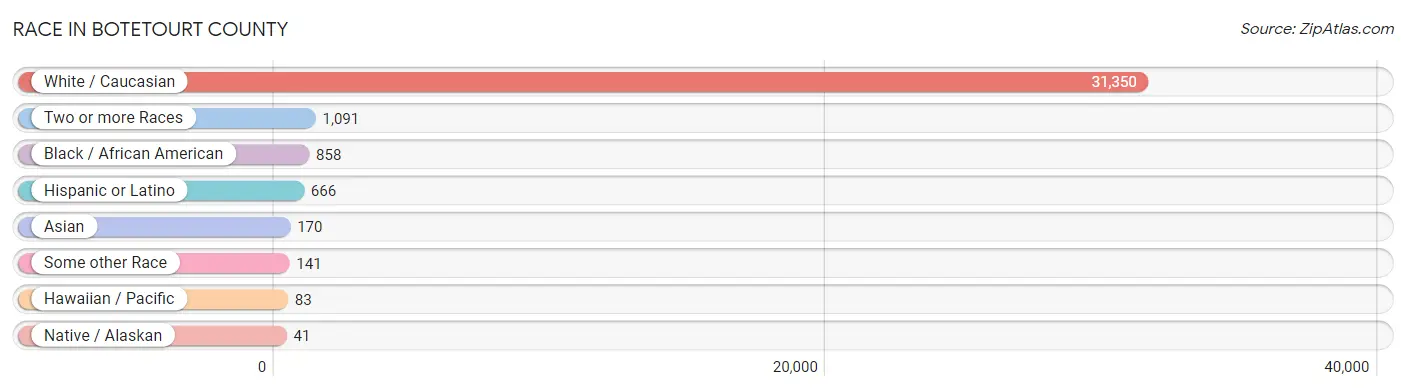
| Race | # Population | % Population |
| Asian | 170 | 0.5% |
| Black / African American | 858 | 2.5% |
| Hawaiian / Pacific | 83 | 0.3% |
| Hispanic or Latino | 666 | 2.0% |
| Native / Alaskan | 41 | 0.1% |
| White / Caucasian | 31,350 | 92.9% |
| Two or more Races | 1,091 | 3.2% |
| Some other Race | 141 | 0.4% |
| Total | 33,734 | 100.0% |
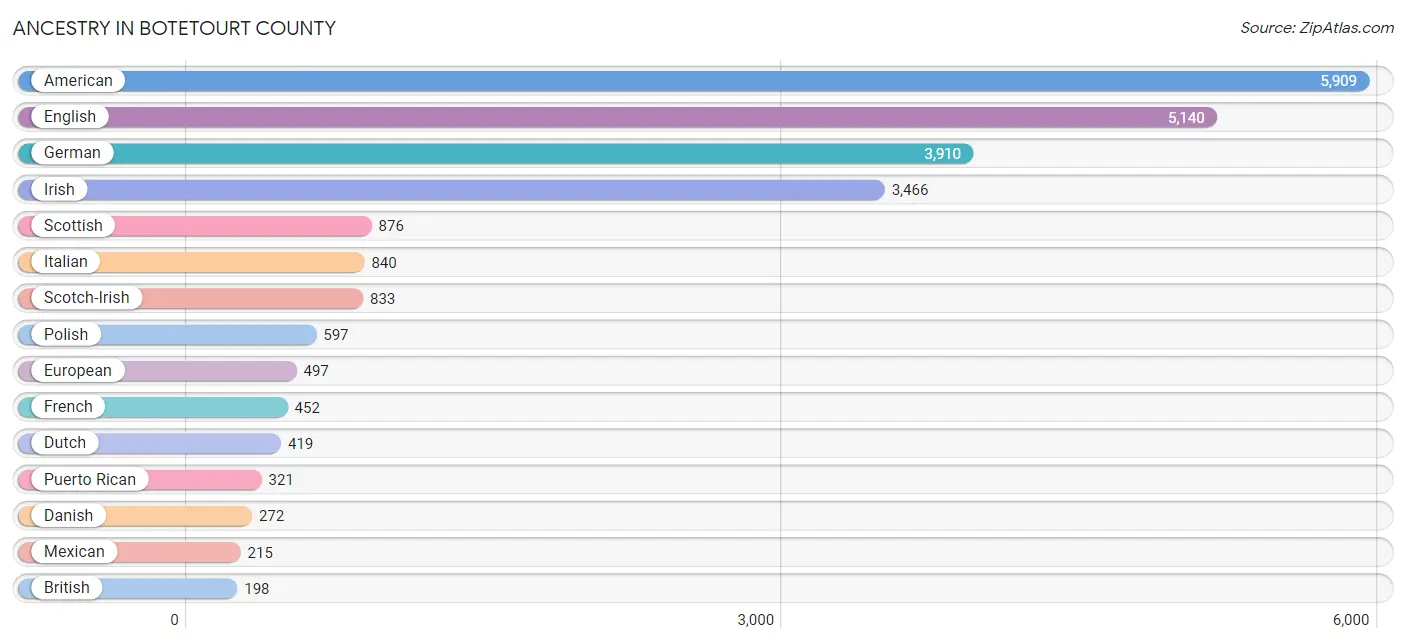
Ancestry in Botetourt County
The most populous ancestries reported in Botetourt County are American (5,909 | 17.5%), English (5,140 | 15.2%), German (3,910 | 11.6%), Irish (3,466 | 10.3%), and Scottish (876 | 2.6%), together accounting for 57.2% of all Botetourt County residents.
| Ancestry | # Population | % Population |
| African | 24 | 0.1% |
| Albanian | 6 | 0.0% |
| American | 5,909 | 17.5% |
| Arab | 35 | 0.1% |
| Australian | 11 | 0.0% |
| Austrian | 62 | 0.2% |
| Belgian | 18 | 0.1% |
| Bhutanese | 54 | 0.2% |
| Blackfeet | 15 | 0.0% |
| Bolivian | 75 | 0.2% |
| British | 198 | 0.6% |
| Burmese | 63 | 0.2% |
| Canadian | 26 | 0.1% |
| Carpatho Rusyn | 94 | 0.3% |
| Celtic | 1 | 0.0% |
| Central American | 4 | 0.0% |
| Cherokee | 51 | 0.2% |
| Chippewa | 13 | 0.0% |
| Cuban | 5 | 0.0% |
| Czech | 6 | 0.0% |
| Czechoslovakian | 23 | 0.1% |
| Danish | 272 | 0.8% |
| Dutch | 419 | 1.2% |
| Eastern European | 96 | 0.3% |
| English | 5,140 | 15.2% |
| Estonian | 26 | 0.1% |
| European | 497 | 1.5% |
| Filipino | 42 | 0.1% |
| Finnish | 33 | 0.1% |
| French | 452 | 1.3% |
| French Canadian | 168 | 0.5% |
| German | 3,910 | 11.6% |
| Greek | 61 | 0.2% |
| Haitian | 4 | 0.0% |
| Hungarian | 99 | 0.3% |
| Indian (Asian) | 6 | 0.0% |
| Irish | 3,466 | 10.3% |
| Italian | 840 | 2.5% |
| Korean | 42 | 0.1% |
| Lebanese | 35 | 0.1% |
| Lithuanian | 9 | 0.0% |
| Mexican | 215 | 0.6% |
| Nigerian | 60 | 0.2% |
| Northern European | 48 | 0.1% |
| Norwegian | 122 | 0.4% |
| Osage | 31 | 0.1% |
| Pennsylvania German | 29 | 0.1% |
| Peruvian | 38 | 0.1% |
| Polish | 597 | 1.8% |
| Portuguese | 61 | 0.2% |
| Puerto Rican | 321 | 0.9% |
| Puget Sound Salish | 19 | 0.1% |
| Russian | 38 | 0.1% |
| Salvadoran | 4 | 0.0% |
| Samoan | 87 | 0.3% |
| Scandinavian | 126 | 0.4% |
| Scotch-Irish | 833 | 2.5% |
| Scottish | 876 | 2.6% |
| Sioux | 1 | 0.0% |
| Slovene | 5 | 0.0% |
| South American | 113 | 0.3% |
| Spaniard | 8 | 0.0% |
| Sri Lankan | 99 | 0.3% |
| Subsaharan African | 96 | 0.3% |
| Swedish | 113 | 0.3% |
| Swiss | 165 | 0.5% |
| Thai | 83 | 0.3% |
| Ukrainian | 136 | 0.4% |
| Welsh | 114 | 0.3% | View All 69 Rows |
Immigrants in Botetourt County
The most numerous immigrant groups reported in Botetourt County came from Europe (217 | 0.6%), Western Europe (144 | 0.4%), Latin America (139 | 0.4%), Asia (128 | 0.4%), and Germany (101 | 0.3%), together accounting for 2.2% of all Botetourt County residents.
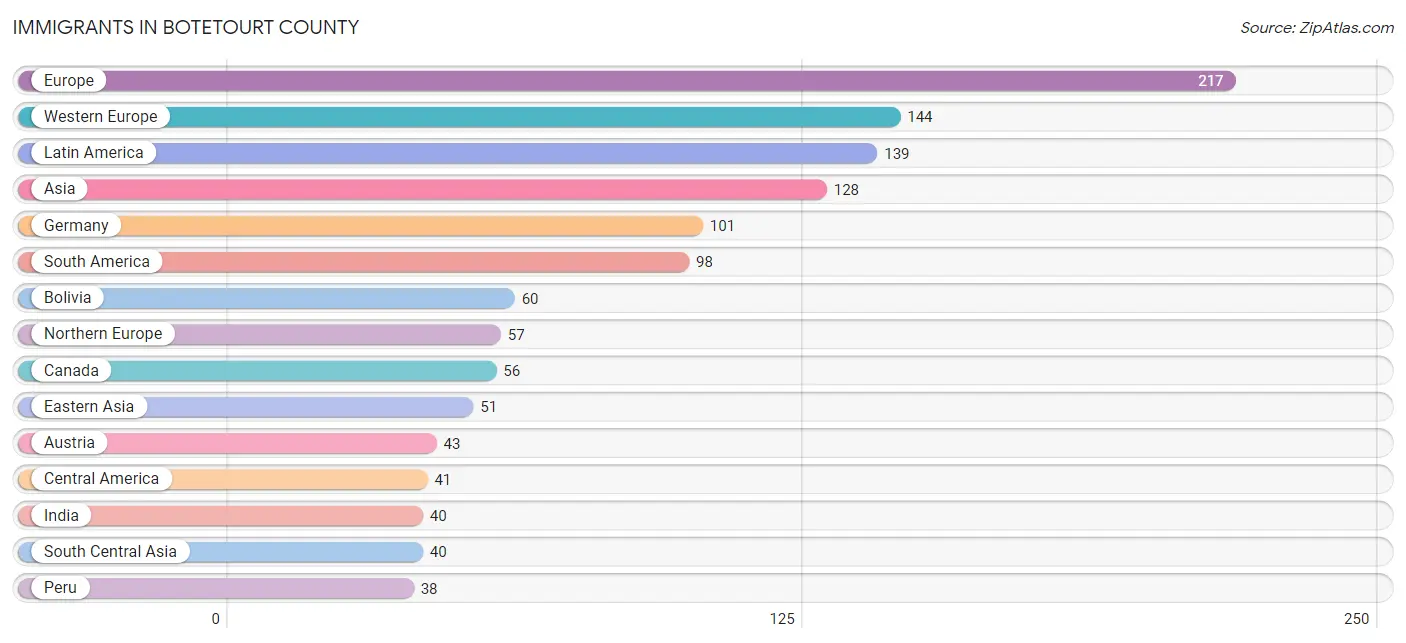
| Immigration Origin | # Population | % Population |
| Asia | 128 | 0.4% |
| Austria | 43 | 0.1% |
| Bolivia | 60 | 0.2% |
| Canada | 56 | 0.2% |
| Central America | 41 | 0.1% |
| China | 5 | 0.0% |
| Eastern Asia | 51 | 0.2% |
| Eastern Europe | 16 | 0.1% |
| El Salvador | 4 | 0.0% |
| England | 28 | 0.1% |
| Europe | 217 | 0.6% |
| Germany | 101 | 0.3% |
| India | 40 | 0.1% |
| Japan | 14 | 0.0% |
| Korea | 32 | 0.1% |
| Latin America | 139 | 0.4% |
| Mexico | 37 | 0.1% |
| Northern Europe | 57 | 0.2% |
| Oceania | 4 | 0.0% |
| Peru | 38 | 0.1% |
| Philippines | 5 | 0.0% |
| South America | 98 | 0.3% |
| South Central Asia | 40 | 0.1% |
| South Eastern Asia | 37 | 0.1% |
| Ukraine | 16 | 0.1% |
| Vietnam | 32 | 0.1% |
| Western Europe | 144 | 0.4% | View All 27 Rows |
Sex and Age in Botetourt County
Sex and Age in Botetourt County
The most populous age groups in Botetourt County are 60 to 64 Years (1,434 | 8.5%) for men and 60 to 64 Years (1,461 | 8.6%) for women.
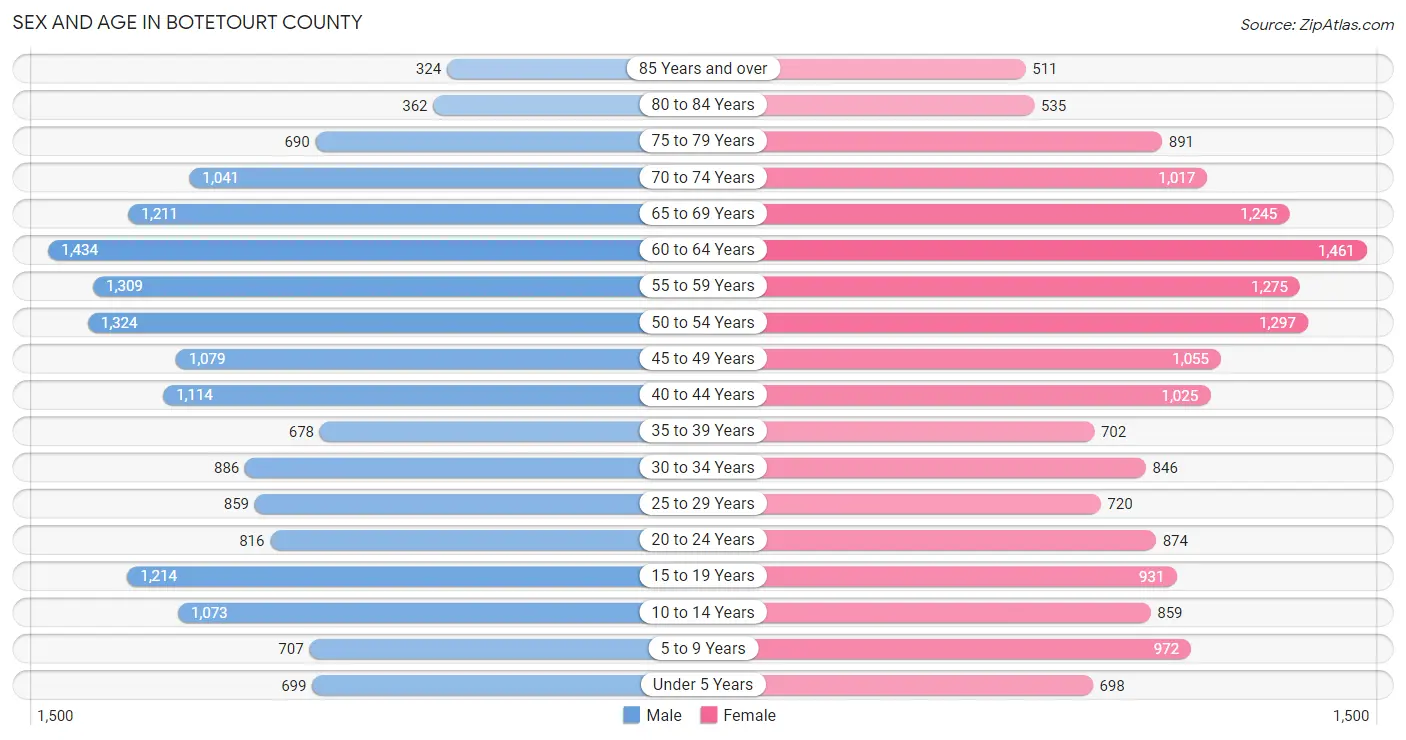
| Age Bracket | Male | Female |
| Under 5 Years | 699 (4.2%) | 698 (4.1%) |
| 5 to 9 Years | 707 (4.2%) | 972 (5.8%) |
| 10 to 14 Years | 1,073 (6.4%) | 859 (5.1%) |
| 15 to 19 Years | 1,214 (7.2%) | 931 (5.5%) |
| 20 to 24 Years | 816 (4.9%) | 874 (5.2%) |
| 25 to 29 Years | 859 (5.1%) | 720 (4.3%) |
| 30 to 34 Years | 886 (5.3%) | 846 (5.0%) |
| 35 to 39 Years | 678 (4.0%) | 702 (4.2%) |
| 40 to 44 Years | 1,114 (6.6%) | 1,025 (6.1%) |
| 45 to 49 Years | 1,079 (6.4%) | 1,055 (6.2%) |
| 50 to 54 Years | 1,324 (7.9%) | 1,297 (7.7%) |
| 55 to 59 Years | 1,309 (7.8%) | 1,275 (7.5%) |
| 60 to 64 Years | 1,434 (8.5%) | 1,461 (8.6%) |
| 65 to 69 Years | 1,211 (7.2%) | 1,245 (7.4%) |
| 70 to 74 Years | 1,041 (6.2%) | 1,017 (6.0%) |
| 75 to 79 Years | 690 (4.1%) | 891 (5.3%) |
| 80 to 84 Years | 362 (2.1%) | 535 (3.2%) |
| 85 Years and over | 324 (1.9%) | 511 (3.0%) |
| Total | 16,820 (100.0%) | 16,914 (100.0%) |
Families and Households in Botetourt County
Median Family Size in Botetourt County
The median family size in Botetourt County is 3.15 persons per family, with single male/father families (495 | 5.5%) accounting for the largest median family size of 3.64 persons per family. On the other hand, married-couple families (7,728 | 85.5%) represent the smallest median family size with 3.08 persons per family.
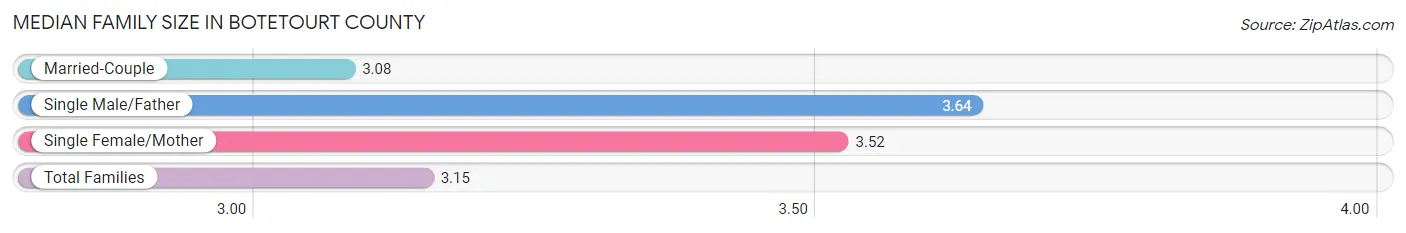
| Family Type | # Families | Family Size |
| Married-Couple | 7,728 (85.5%) | 3.08 |
| Single Male/Father | 495 (5.5%) | 3.64 |
| Single Female/Mother | 821 (9.1%) | 3.52 |
| Total Families | 9,044 (100.0%) | 3.15 |
Median Household Size in Botetourt County
The median household size in Botetourt County is 2.58 persons per household, with single male/father households (495 | 3.8%) accounting for the largest median household size of 3.88 persons per household. non-family households (3,872 | 30.0%) represent the smallest median household size with 1.11 persons per household.
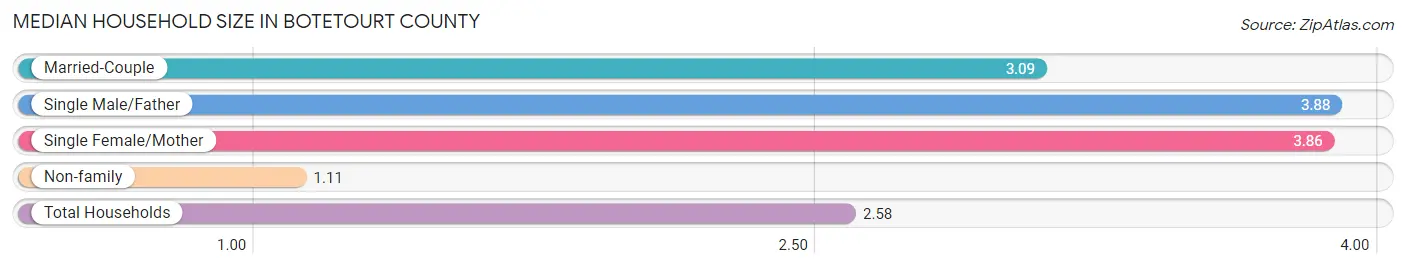
| Household Type | # Households | Household Size |
| Married-Couple | 7,728 (59.8%) | 3.09 |
| Single Male/Father | 495 (3.8%) | 3.88 |
| Single Female/Mother | 821 (6.4%) | 3.86 |
| Non-family | 3,872 (30.0%) | 1.11 |
| Total Households | 12,916 (100.0%) | 2.58 |
Household Size by Marriage Status in Botetourt County
Out of a total of 12,916 households in Botetourt County, 9,044 (70.0%) are family households, while 3,872 (30.0%) are nonfamily households. The most numerous type of family households are 2-person households, comprising 4,811, and the most common type of nonfamily households are 1-person households, comprising 3,597.
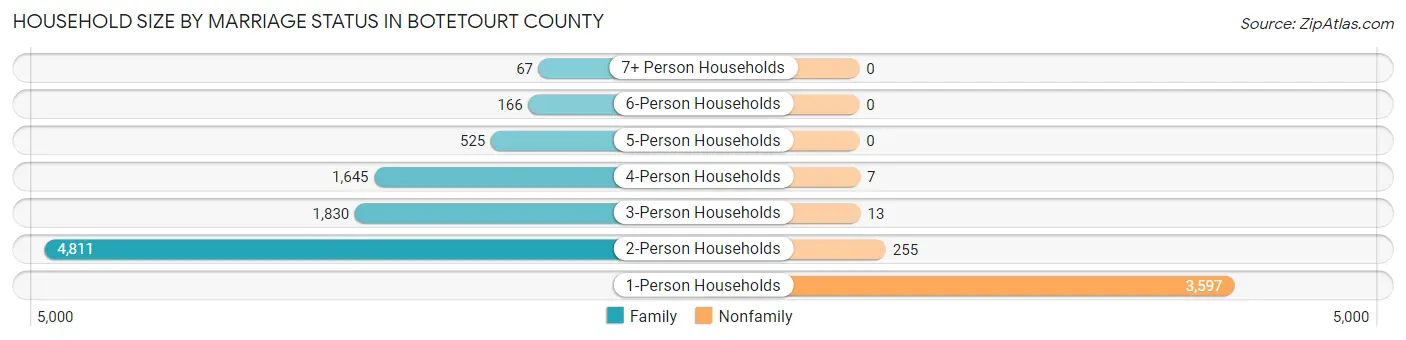
| Household Size | Family Households | Nonfamily Households |
| 1-Person Households | - | 3,597 (27.9%) |
| 2-Person Households | 4,811 (37.2%) | 255 (2.0%) |
| 3-Person Households | 1,830 (14.2%) | 13 (0.1%) |
| 4-Person Households | 1,645 (12.7%) | 7 (0.1%) |
| 5-Person Households | 525 (4.1%) | 0 (0.0%) |
| 6-Person Households | 166 (1.3%) | 0 (0.0%) |
| 7+ Person Households | 67 (0.5%) | 0 (0.0%) |
| Total | 9,044 (70.0%) | 3,872 (30.0%) |
Female Fertility in Botetourt County
Fertility by Age in Botetourt County
Average fertility rate in Botetourt County is 46.0 births per 1,000 women. Women in the age bracket of 20 to 34 years have the highest fertility rate with 77.0 births per 1,000 women. Women in the age bracket of 20 to 34 years acount for 64.7% of all women with births.
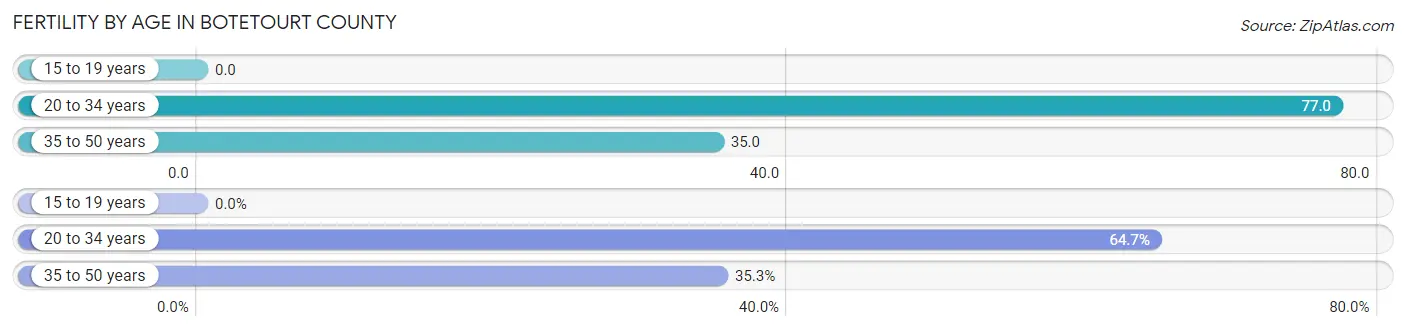
| Age Bracket | Women with Births | Births / 1,000 Women |
| 15 to 19 years | 0 (0.0%) | 0.0 |
| 20 to 34 years | 187 (64.7%) | 77.0 |
| 35 to 50 years | 102 (35.3%) | 35.0 |
| Total | 289 (100.0%) | 46.0 |
Fertility by Age by Marriage Status in Botetourt County
82.7% of women with births (289) in Botetourt County are married. The highest percentage of unmarried women with births falls into 20 to 34 years age bracket with 26.7% of them unmarried at the time of birth, while the lowest percentage of unmarried women with births belong to 35 to 50 years age bracket with 0.0% of them unmarried.
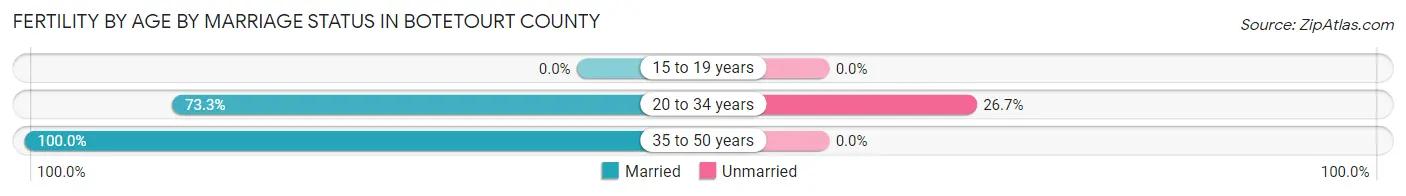
| Age Bracket | Married | Unmarried |
| 15 to 19 years | 0 (0.0%) | 0 (0.0%) |
| 20 to 34 years | 137 (73.3%) | 50 (26.7%) |
| 35 to 50 years | 102 (100.0%) | 0 (0.0%) |
| Total | 239 (82.7%) | 50 (17.3%) |
Fertility by Education in Botetourt County
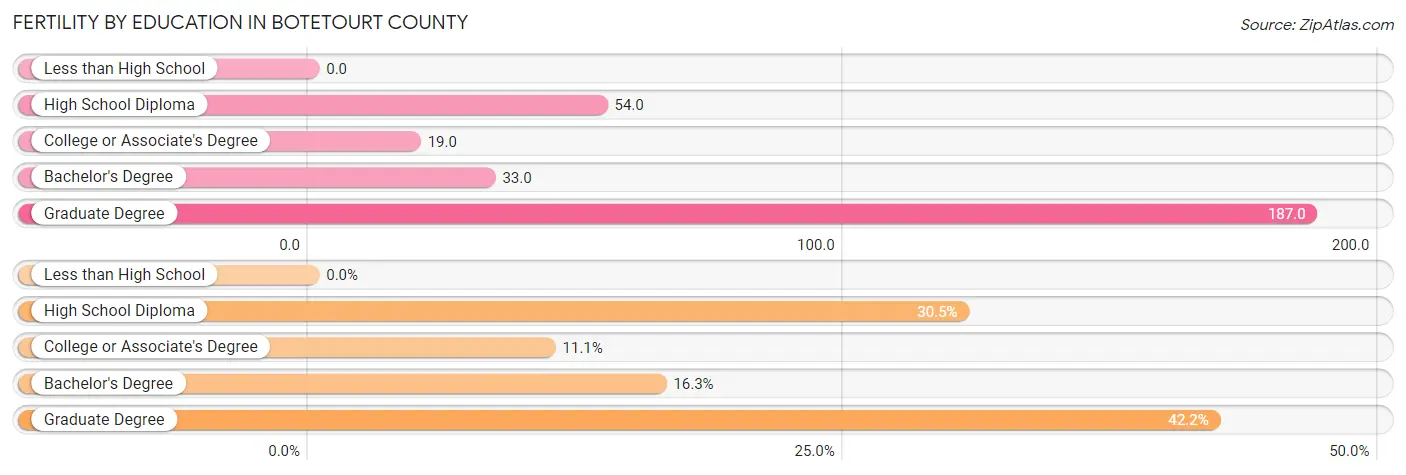
| Educational Attainment | Women with Births | Births / 1,000 Women |
| Less than High School | 0 (0.0%) | 0.0 |
| High School Diploma | 88 (30.4%) | 54.0 |
| College or Associate's Degree | 32 (11.1%) | 19.0 |
| Bachelor's Degree | 47 (16.3%) | 33.0 |
| Graduate Degree | 122 (42.2%) | 187.0 |
| Total | 289 (100.0%) | 46.0 |
Fertility by Education by Marriage Status in Botetourt County
17.3% of women with births in Botetourt County are unmarried. Women with the educational attainment of graduate degree are most likely to be married with 100.0% of them married at childbirth, while women with the educational attainment of high school diploma are least likely to be married with 33.0% of them unmarried at childbirth.
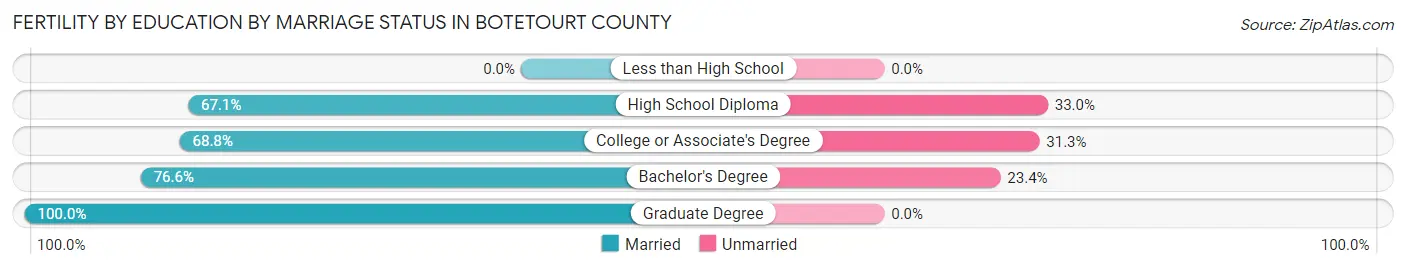
| Educational Attainment | Married | Unmarried |
| Less than High School | 0 (0.0%) | 0 (0.0%) |
| High School Diploma | 59 (67.0%) | 29 (33.0%) |
| College or Associate's Degree | 22 (68.8%) | 10 (31.2%) |
| Bachelor's Degree | 36 (76.6%) | 11 (23.4%) |
| Graduate Degree | 122 (100.0%) | 0 (0.0%) |
| Total | 239 (82.7%) | 50 (17.3%) |
Employment Characteristics in Botetourt County
Employment by Class of Employer in Botetourt County
Among the 15,827 employed individuals in Botetourt County, private company employees (10,885 | 68.8%), local government employees (1,289 | 8.1%), and self-employed (not incorporated) (1,183 | 7.5%) make up the most common classes of employment.
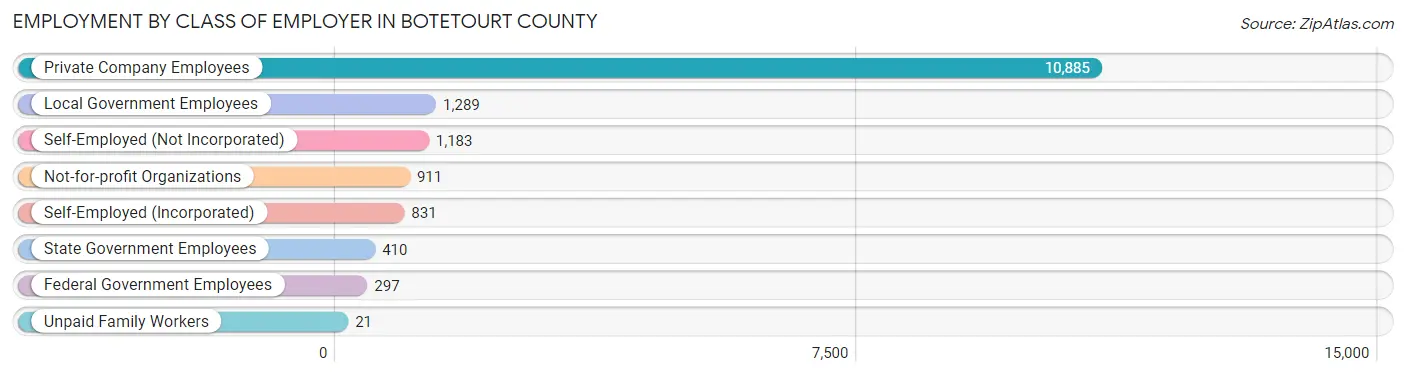
| Employer Class | # Employees | % Employees |
| Private Company Employees | 10,885 | 68.8% |
| Self-Employed (Incorporated) | 831 | 5.2% |
| Self-Employed (Not Incorporated) | 1,183 | 7.5% |
| Not-for-profit Organizations | 911 | 5.8% |
| Local Government Employees | 1,289 | 8.1% |
| State Government Employees | 410 | 2.6% |
| Federal Government Employees | 297 | 1.9% |
| Unpaid Family Workers | 21 | 0.1% |
| Total | 15,827 | 100.0% |
Employment Status by Age in Botetourt County
According to the labor force statistics for Botetourt County, out of the total population over 16 years of age (28,249), 59.4% or 16,780 individuals are in the labor force, with 3.1% or 520 of them unemployed. The age group with the highest labor force participation rate is 35 to 44 years, with 87.4% or 3,076 individuals in the labor force. Within the labor force, the 20 to 24 years age range has the highest percentage of unemployed individuals, with 7.3% or 102 of them being unemployed.
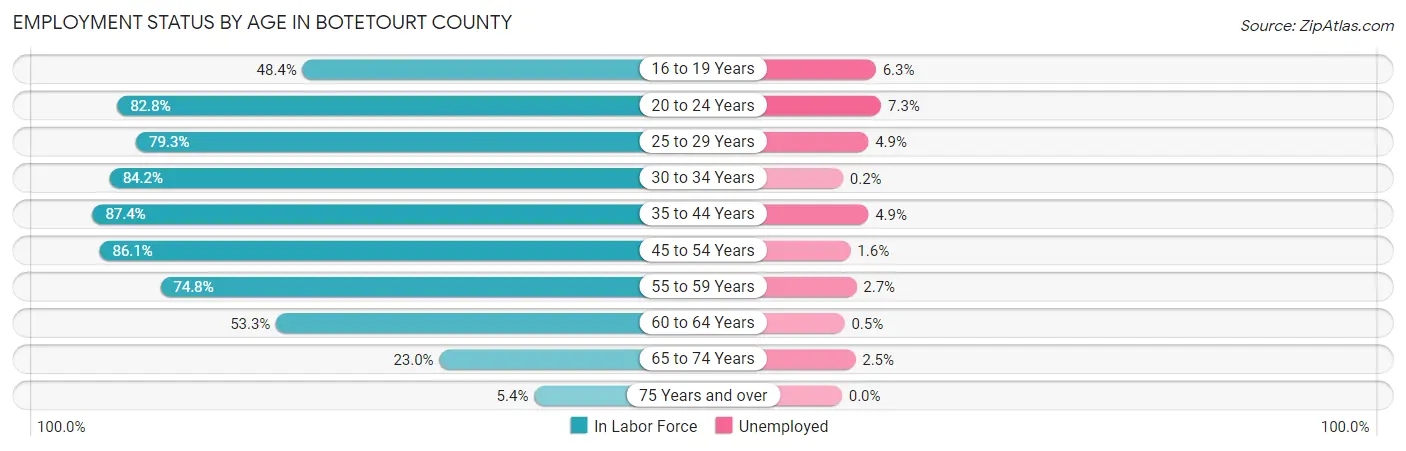
| Age Bracket | In Labor Force | Unemployed |
| 16 to 19 Years | 807 (48.4%) | 51 (6.3%) |
| 20 to 24 Years | 1,399 (82.8%) | 102 (7.3%) |
| 25 to 29 Years | 1,252 (79.3%) | 61 (4.9%) |
| 30 to 34 Years | 1,458 (84.2%) | 3 (0.2%) |
| 35 to 44 Years | 3,076 (87.4%) | 151 (4.9%) |
| 45 to 54 Years | 4,094 (86.1%) | 66 (1.6%) |
| 55 to 59 Years | 1,933 (74.8%) | 52 (2.7%) |
| 60 to 64 Years | 1,543 (53.3%) | 8 (0.5%) |
| 65 to 74 Years | 1,038 (23.0%) | 26 (2.5%) |
| 75 Years and over | 179 (5.4%) | 0 (0.0%) |
| Total | 16,780 (59.4%) | 520 (3.1%) |
Employment Status by Educational Attainment in Botetourt County
According to labor force statistics for Botetourt County, 78.3% of individuals (13,361) out of the total population between 25 and 64 years of age (17,064) are in the labor force, with 2.5% or 334 of them being unemployed. The group with the highest labor force participation rate are those with the educational attainment of college / associate degree, with 82.7% or 4,472 individuals in the labor force. Within the labor force, individuals with less than high school education have the highest percentage of unemployment, with 8.2% or 32 of them being unemployed.
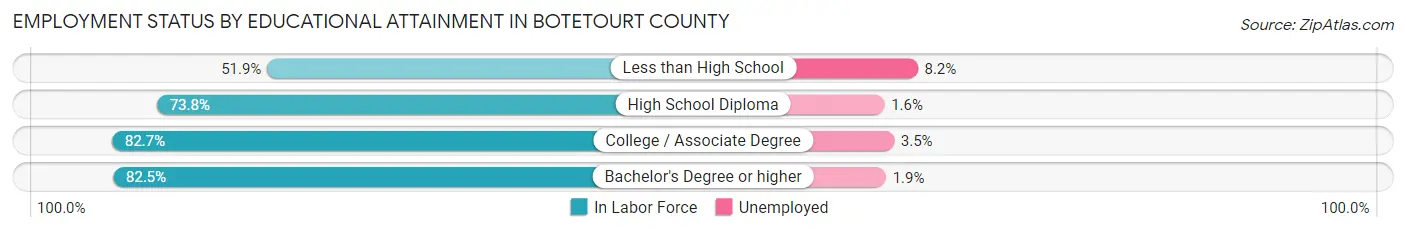
| Educational Attainment | In Labor Force | Unemployed |
| Less than High School | 389 (51.9%) | 61 (8.2%) |
| High School Diploma | 4,299 (73.8%) | 93 (1.6%) |
| College / Associate Degree | 4,472 (82.7%) | 189 (3.5%) |
| Bachelor's Degree or higher | 4,193 (82.5%) | 97 (1.9%) |
| Total | 13,361 (78.3%) | 427 (2.5%) |
Employment Occupations by Sex in Botetourt County
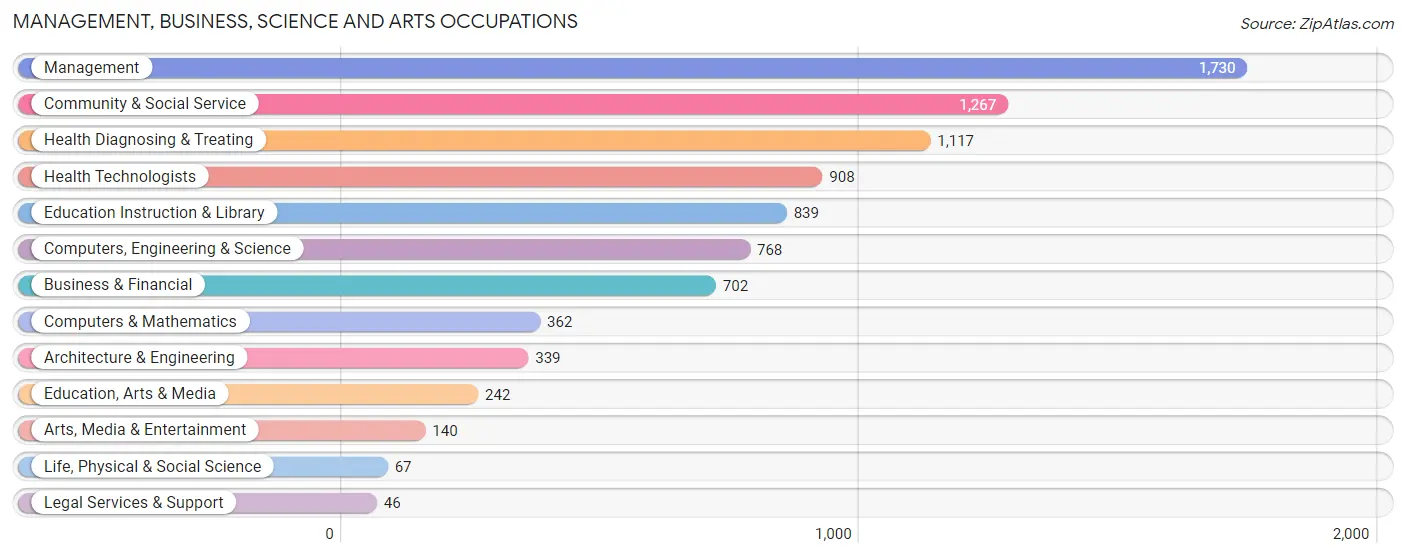
Management, Business, Science and Arts Occupations
The most common Management, Business, Science and Arts occupations in Botetourt County are Management (1,730 | 10.6%), Community & Social Service (1,267 | 7.8%), Health Diagnosing & Treating (1,117 | 6.9%), Health Technologists (908 | 5.6%), and Education Instruction & Library (839 | 5.2%).
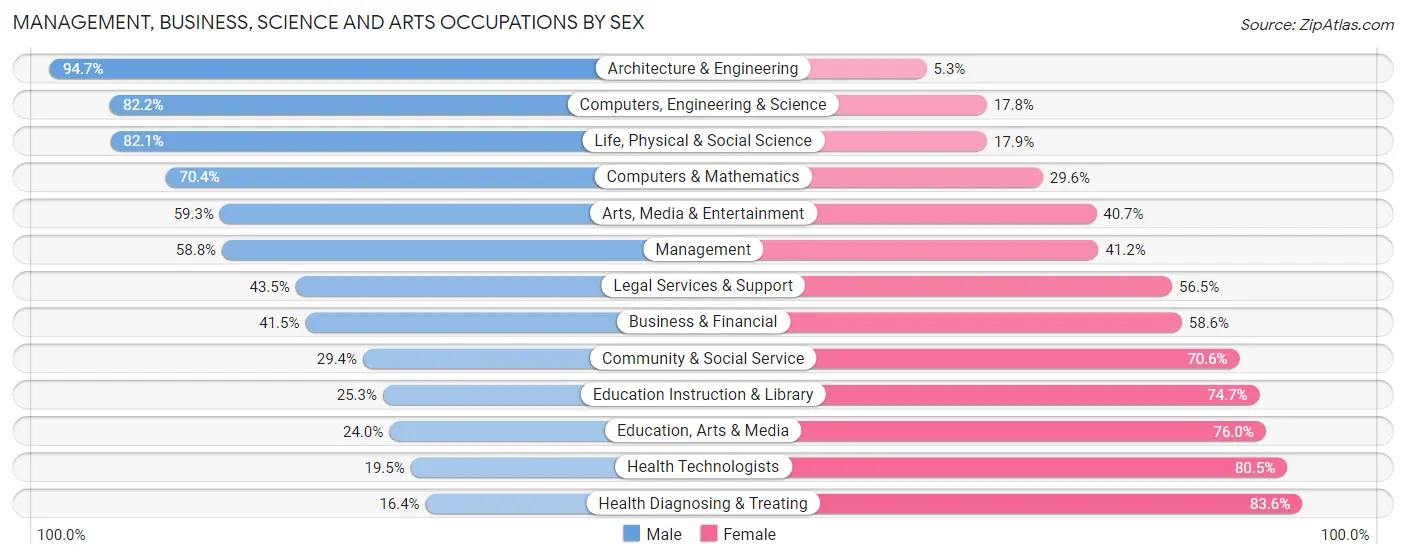
Management, Business, Science and Arts Occupations by Sex
Within the Management, Business, Science and Arts occupations in Botetourt County, the most male-oriented occupations are Architecture & Engineering (94.7%), Computers, Engineering & Science (82.2%), and Life, Physical & Social Science (82.1%), while the most female-oriented occupations are Health Diagnosing & Treating (83.6%), Health Technologists (80.5%), and Education, Arts & Media (76.0%).
| Occupation | Male | Female |
| Management | 1,018 (58.8%) | 712 (41.2%) |
| Business & Financial | 291 (41.4%) | 411 (58.6%) |
| Computers, Engineering & Science | 631 (82.2%) | 137 (17.8%) |
| Computers & Mathematics | 255 (70.4%) | 107 (29.6%) |
| Architecture & Engineering | 321 (94.7%) | 18 (5.3%) |
| Life, Physical & Social Science | 55 (82.1%) | 12 (17.9%) |
| Community & Social Service | 373 (29.4%) | 894 (70.6%) |
| Education, Arts & Media | 58 (24.0%) | 184 (76.0%) |
| Legal Services & Support | 20 (43.5%) | 26 (56.5%) |
| Education Instruction & Library | 212 (25.3%) | 627 (74.7%) |
| Arts, Media & Entertainment | 83 (59.3%) | 57 (40.7%) |
| Health Diagnosing & Treating | 183 (16.4%) | 934 (83.6%) |
| Health Technologists | 177 (19.5%) | 731 (80.5%) |
| Total (Category) | 2,496 (44.7%) | 3,088 (55.3%) |
| Total (Overall) | 8,737 (53.8%) | 7,500 (46.2%) |
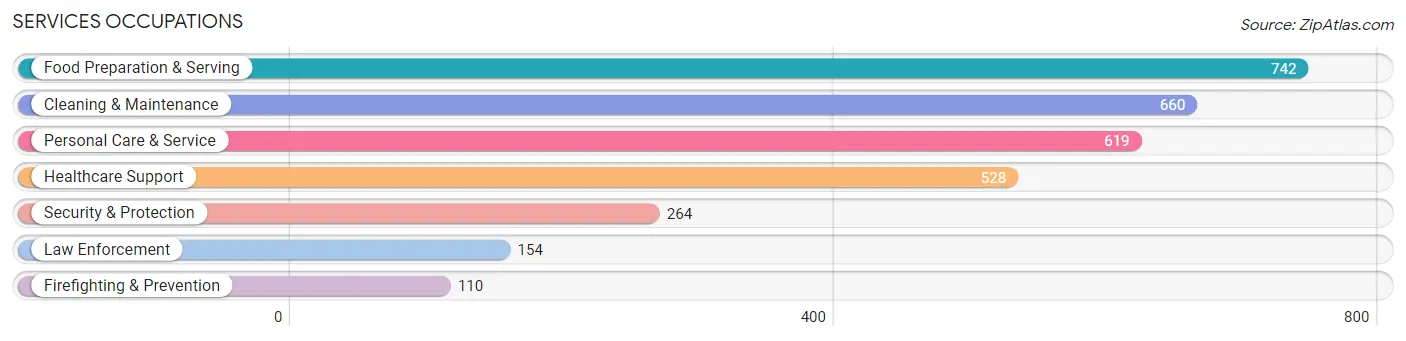
Services Occupations
The most common Services occupations in Botetourt County are Food Preparation & Serving (742 | 4.6%), Cleaning & Maintenance (660 | 4.1%), Personal Care & Service (619 | 3.8%), Healthcare Support (528 | 3.3%), and Security & Protection (264 | 1.6%).
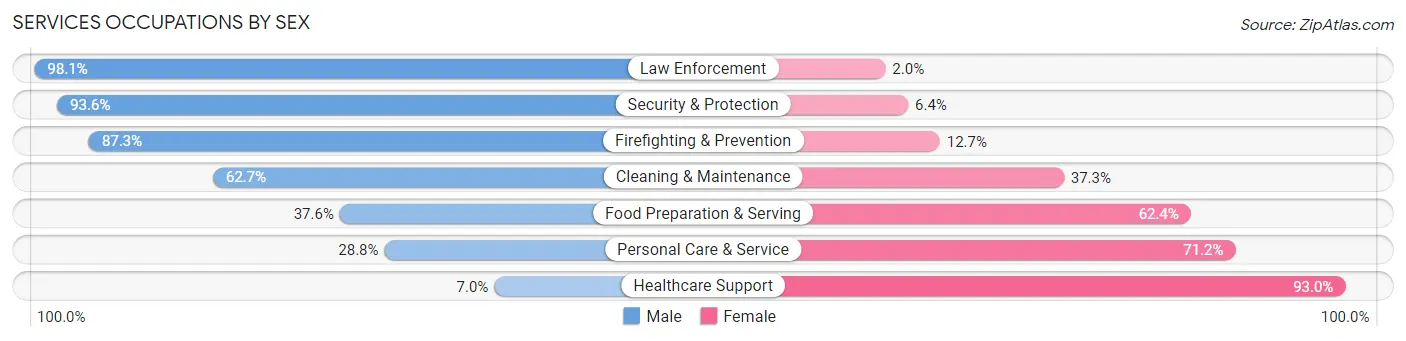
Services Occupations by Sex
Within the Services occupations in Botetourt County, the most male-oriented occupations are Law Enforcement (98.1%), Security & Protection (93.6%), and Firefighting & Prevention (87.3%), while the most female-oriented occupations are Healthcare Support (93.0%), Personal Care & Service (71.2%), and Food Preparation & Serving (62.4%).
| Occupation | Male | Female |
| Healthcare Support | 37 (7.0%) | 491 (93.0%) |
| Security & Protection | 247 (93.6%) | 17 (6.4%) |
| Firefighting & Prevention | 96 (87.3%) | 14 (12.7%) |
| Law Enforcement | 151 (98.1%) | 3 (1.9%) |
| Food Preparation & Serving | 279 (37.6%) | 463 (62.4%) |
| Cleaning & Maintenance | 414 (62.7%) | 246 (37.3%) |
| Personal Care & Service | 178 (28.8%) | 441 (71.2%) |
| Total (Category) | 1,155 (41.1%) | 1,658 (58.9%) |
| Total (Overall) | 8,737 (53.8%) | 7,500 (46.2%) |
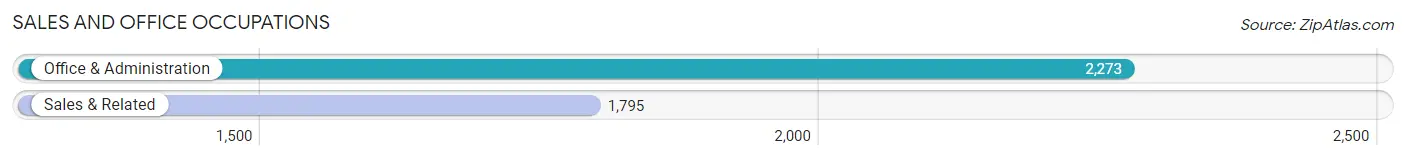
Sales and Office Occupations
The most common Sales and Office occupations in Botetourt County are Office & Administration (2,273 | 14.0%), and Sales & Related (1,795 | 11.1%).
Sales and Office Occupations by Sex
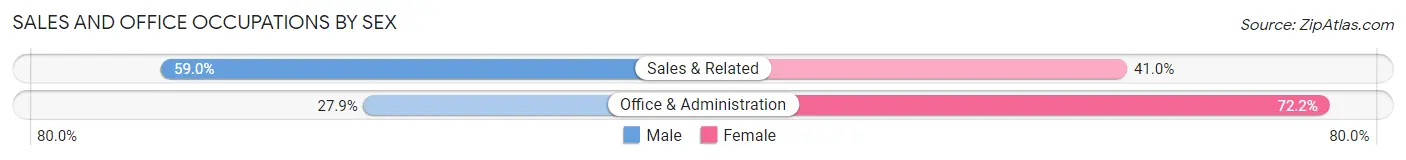
| Occupation | Male | Female |
| Sales & Related | 1,059 (59.0%) | 736 (41.0%) |
| Office & Administration | 633 (27.9%) | 1,640 (72.2%) |
| Total (Category) | 1,692 (41.6%) | 2,376 (58.4%) |
| Total (Overall) | 8,737 (53.8%) | 7,500 (46.2%) |
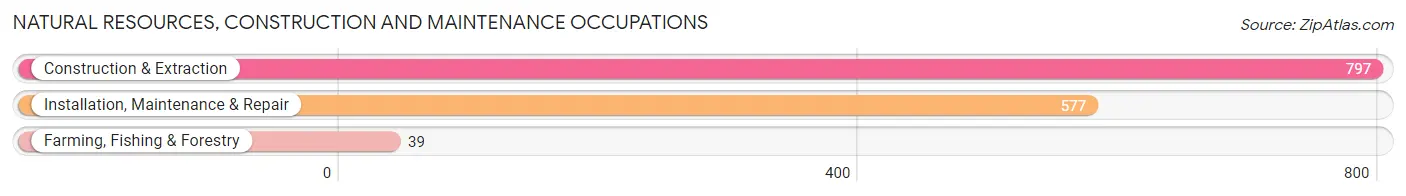
Natural Resources, Construction and Maintenance Occupations
The most common Natural Resources, Construction and Maintenance occupations in Botetourt County are Construction & Extraction (797 | 4.9%), Installation, Maintenance & Repair (577 | 3.5%), and Farming, Fishing & Forestry (39 | 0.2%).
Natural Resources, Construction and Maintenance Occupations by Sex
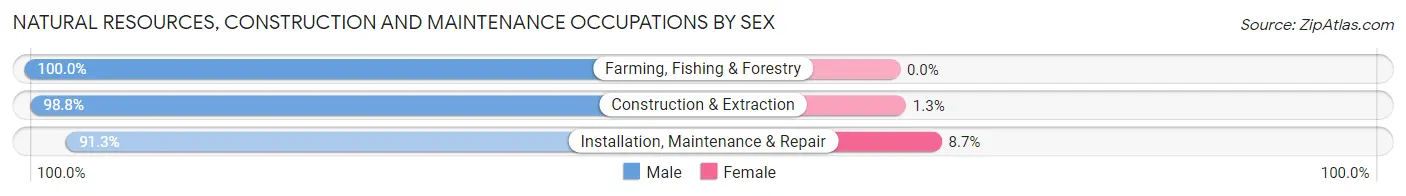
| Occupation | Male | Female |
| Farming, Fishing & Forestry | 39 (100.0%) | 0 (0.0%) |
| Construction & Extraction | 787 (98.8%) | 10 (1.3%) |
| Installation, Maintenance & Repair | 527 (91.3%) | 50 (8.7%) |
| Total (Category) | 1,353 (95.8%) | 60 (4.3%) |
| Total (Overall) | 8,737 (53.8%) | 7,500 (46.2%) |
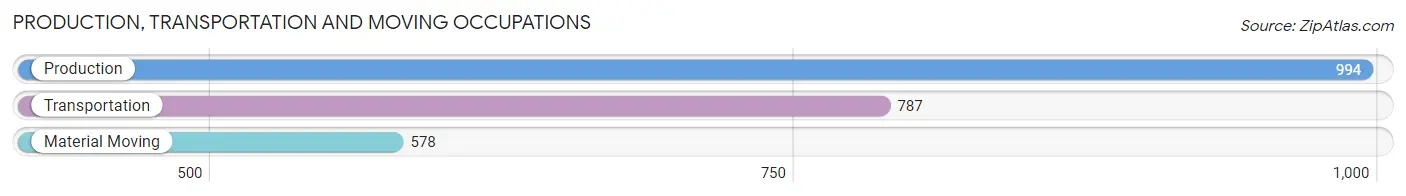
Production, Transportation and Moving Occupations
The most common Production, Transportation and Moving occupations in Botetourt County are Production (994 | 6.1%), Transportation (787 | 4.9%), and Material Moving (578 | 3.6%).
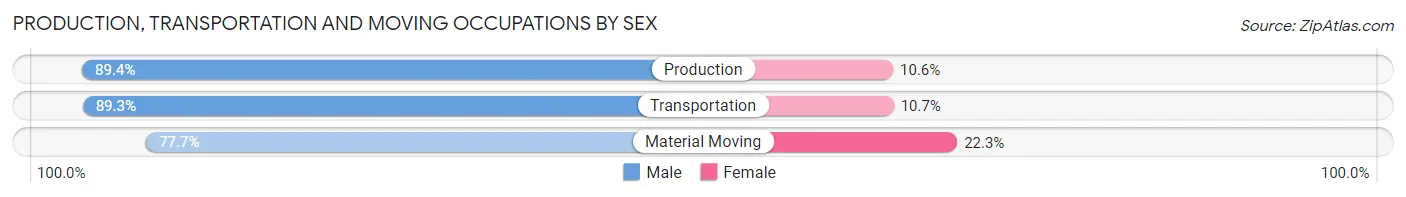
Production, Transportation and Moving Occupations by Sex
| Occupation | Male | Female |
| Production | 889 (89.4%) | 105 (10.6%) |
| Transportation | 703 (89.3%) | 84 (10.7%) |
| Material Moving | 449 (77.7%) | 129 (22.3%) |
| Total (Category) | 2,041 (86.5%) | 318 (13.5%) |
| Total (Overall) | 8,737 (53.8%) | 7,500 (46.2%) |
Employment Industries by Sex in Botetourt County
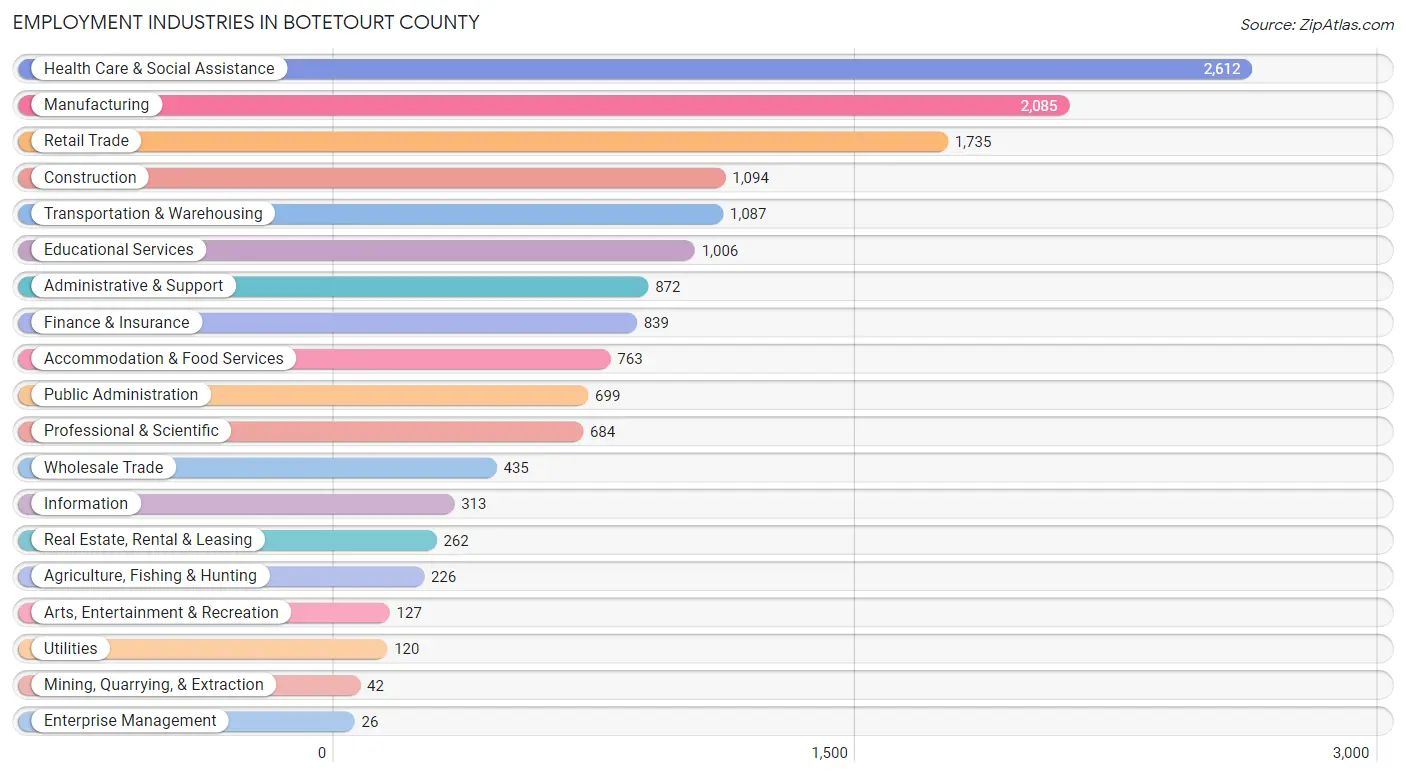
Employment Industries in Botetourt County
The major employment industries in Botetourt County include Health Care & Social Assistance (2,612 | 16.1%), Manufacturing (2,085 | 12.8%), Retail Trade (1,735 | 10.7%), Construction (1,094 | 6.7%), and Transportation & Warehousing (1,087 | 6.7%).
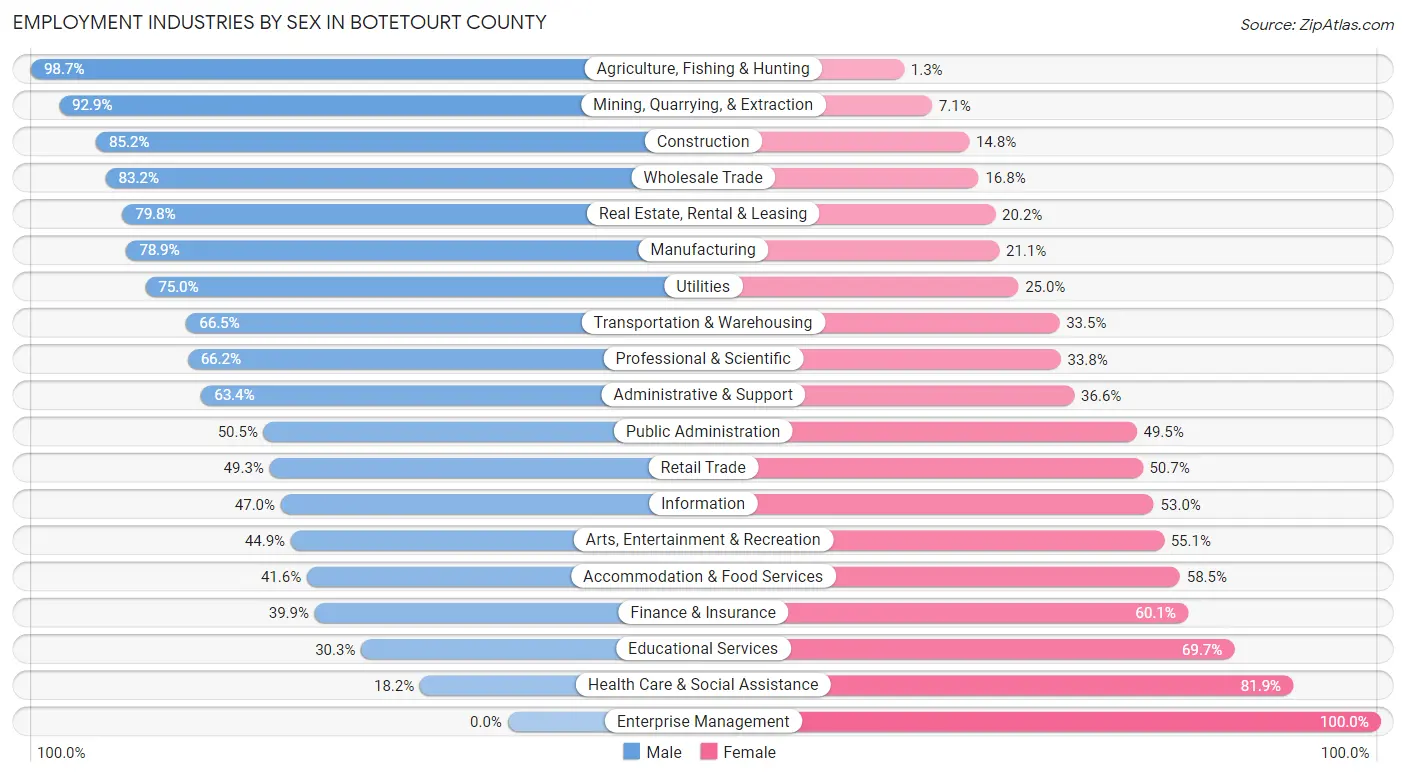
Employment Industries by Sex in Botetourt County
The Botetourt County industries that see more men than women are Agriculture, Fishing & Hunting (98.7%), Mining, Quarrying, & Extraction (92.9%), and Construction (85.2%), whereas the industries that tend to have a higher number of women are Enterprise Management (100.0%), Health Care & Social Assistance (81.9%), and Educational Services (69.7%).
| Industry | Male | Female |
| Agriculture, Fishing & Hunting | 223 (98.7%) | 3 (1.3%) |
| Mining, Quarrying, & Extraction | 39 (92.9%) | 3 (7.1%) |
| Construction | 932 (85.2%) | 162 (14.8%) |
| Manufacturing | 1,646 (78.9%) | 439 (21.1%) |
| Wholesale Trade | 362 (83.2%) | 73 (16.8%) |
| Retail Trade | 855 (49.3%) | 880 (50.7%) |
| Transportation & Warehousing | 723 (66.5%) | 364 (33.5%) |
| Utilities | 90 (75.0%) | 30 (25.0%) |
| Information | 147 (47.0%) | 166 (53.0%) |
| Finance & Insurance | 335 (39.9%) | 504 (60.1%) |
| Real Estate, Rental & Leasing | 209 (79.8%) | 53 (20.2%) |
| Professional & Scientific | 453 (66.2%) | 231 (33.8%) |
| Enterprise Management | 0 (0.0%) | 26 (100.0%) |
| Administrative & Support | 553 (63.4%) | 319 (36.6%) |
| Educational Services | 305 (30.3%) | 701 (69.7%) |
| Health Care & Social Assistance | 474 (18.1%) | 2,138 (81.9%) |
| Arts, Entertainment & Recreation | 57 (44.9%) | 70 (55.1%) |
| Accommodation & Food Services | 317 (41.5%) | 446 (58.5%) |
| Public Administration | 353 (50.5%) | 346 (49.5%) |
| Total | 8,737 (53.8%) | 7,500 (46.2%) |
Education in Botetourt County
School Enrollment in Botetourt County
The most common levels of schooling among the 6,455 students in Botetourt County are high school (1,914 | 29.6%), middle school (1,610 | 24.9%), and elementary school (1,285 | 19.9%).
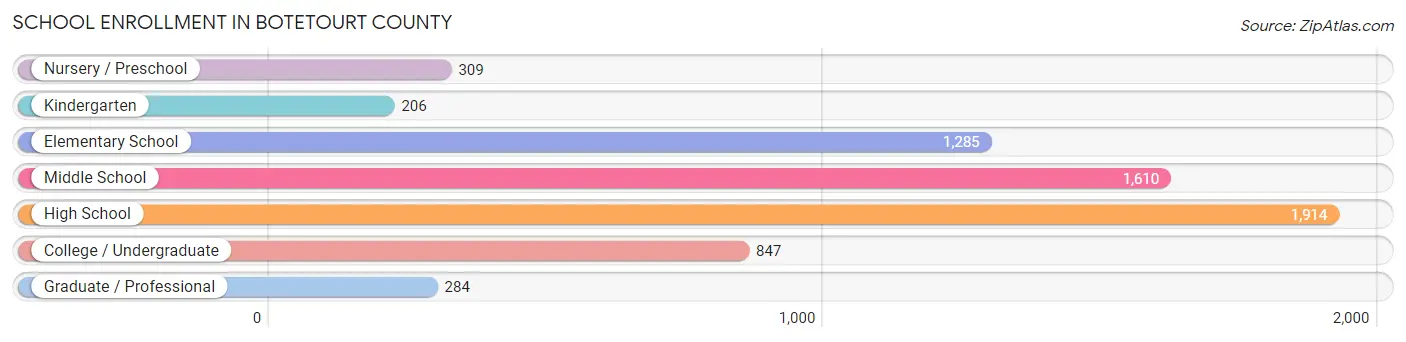
| School Level | # Students | % Students |
| Nursery / Preschool | 309 | 4.8% |
| Kindergarten | 206 | 3.2% |
| Elementary School | 1,285 | 19.9% |
| Middle School | 1,610 | 24.9% |
| High School | 1,914 | 29.6% |
| College / Undergraduate | 847 | 13.1% |
| Graduate / Professional | 284 | 4.4% |
| Total | 6,455 | 100.0% |
School Enrollment by Age by Funding Source in Botetourt County
Out of a total of 6,455 students who are enrolled in schools in Botetourt County, 917 (14.2%) attend a private institution, while the remaining 5,538 (85.8%) are enrolled in public schools. The age group of 35 years and over has the highest likelihood of being enrolled in private schools, with 132 (64.4% in the age bracket) enrolled. Conversely, the age group of 15 to 17 year olds has the lowest likelihood of being enrolled in a private school, with 1,174 (94.2% in the age bracket) attending a public institution.
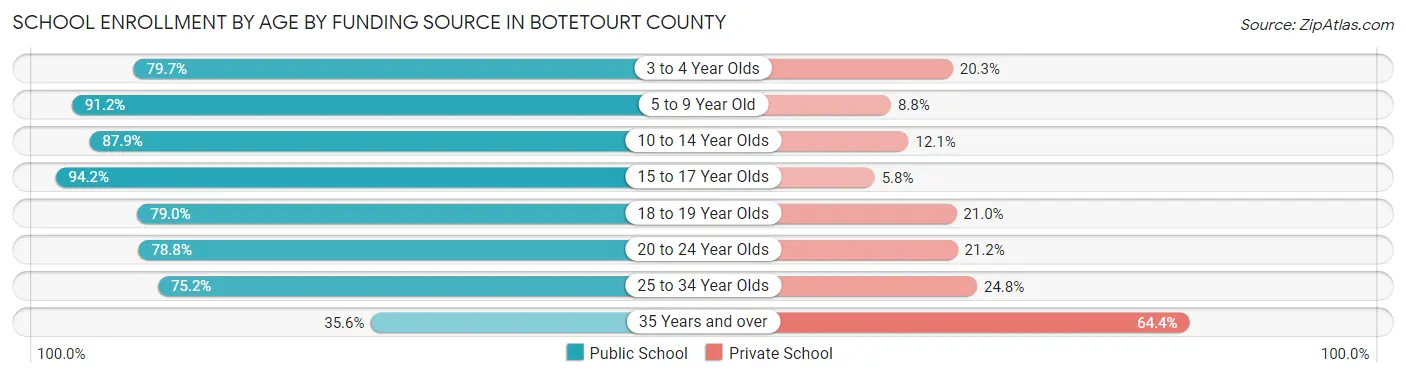
| Age Bracket | Public School | Private School |
| 3 to 4 Year Olds | 200 (79.7%) | 51 (20.3%) |
| 5 to 9 Year Old | 1,333 (91.2%) | 129 (8.8%) |
| 10 to 14 Year Olds | 1,652 (87.9%) | 227 (12.1%) |
| 15 to 17 Year Olds | 1,174 (94.2%) | 72 (5.8%) |
| 18 to 19 Year Olds | 523 (79.0%) | 139 (21.0%) |
| 20 to 24 Year Olds | 464 (78.8%) | 125 (21.2%) |
| 25 to 34 Year Olds | 121 (75.2%) | 40 (24.8%) |
| 35 Years and over | 73 (35.6%) | 132 (64.4%) |
| Total | 5,538 (85.8%) | 917 (14.2%) |
Educational Attainment by Field of Study in Botetourt County
Business (1,420 | 19.0%), education (970 | 13.0%), science & technology (761 | 10.2%), bio, nature & agricultural (639 | 8.6%), and liberal arts & history (628 | 8.4%) are the most common fields of study among 7,467 individuals in Botetourt County who have obtained a bachelor's degree or higher.
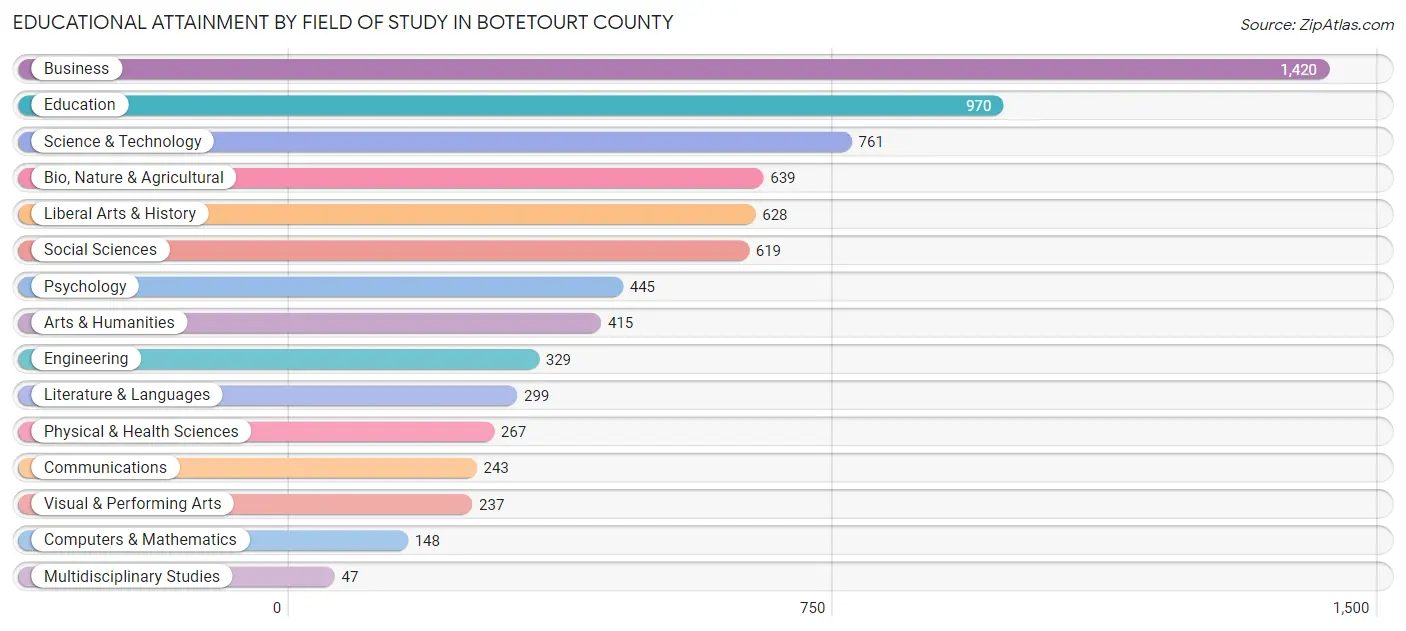
| Field of Study | # Graduates | % Graduates |
| Computers & Mathematics | 148 | 2.0% |
| Bio, Nature & Agricultural | 639 | 8.6% |
| Physical & Health Sciences | 267 | 3.6% |
| Psychology | 445 | 6.0% |
| Social Sciences | 619 | 8.3% |
| Engineering | 329 | 4.4% |
| Multidisciplinary Studies | 47 | 0.6% |
| Science & Technology | 761 | 10.2% |
| Business | 1,420 | 19.0% |
| Education | 970 | 13.0% |
| Literature & Languages | 299 | 4.0% |
| Liberal Arts & History | 628 | 8.4% |
| Visual & Performing Arts | 237 | 3.2% |
| Communications | 243 | 3.3% |
| Arts & Humanities | 415 | 5.6% |
| Total | 7,467 | 100.0% |
Transportation & Commute in Botetourt County
Vehicle Availability by Sex in Botetourt County
The most prevalent vehicle ownership categories in Botetourt County are males with 2 vehicles (2,936, accounting for 34.8%) and females with 2 vehicles (2,469, making up 39.7%).
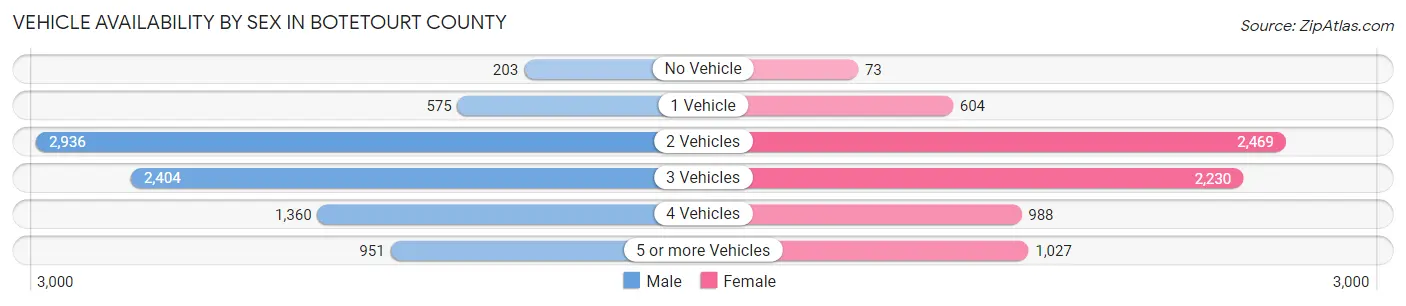
| Vehicles Available | Male | Female |
| No Vehicle | 203 (2.4%) | 73 (1.0%) |
| 1 Vehicle | 575 (6.8%) | 604 (8.2%) |
| 2 Vehicles | 2,936 (34.8%) | 2,469 (33.4%) |
| 3 Vehicles | 2,404 (28.5%) | 2,230 (30.2%) |
| 4 Vehicles | 1,360 (16.1%) | 988 (13.4%) |
| 5 or more Vehicles | 951 (11.3%) | 1,027 (13.9%) |
| Total | 8,429 (100.0%) | 7,391 (100.0%) |
Commute Time in Botetourt County
The most frequently occuring commute durations in Botetourt County are 30 to 34 minutes (2,434 commuters, 17.1%), 20 to 24 minutes (2,360 commuters, 16.6%), and 15 to 19 minutes (2,296 commuters, 16.2%).
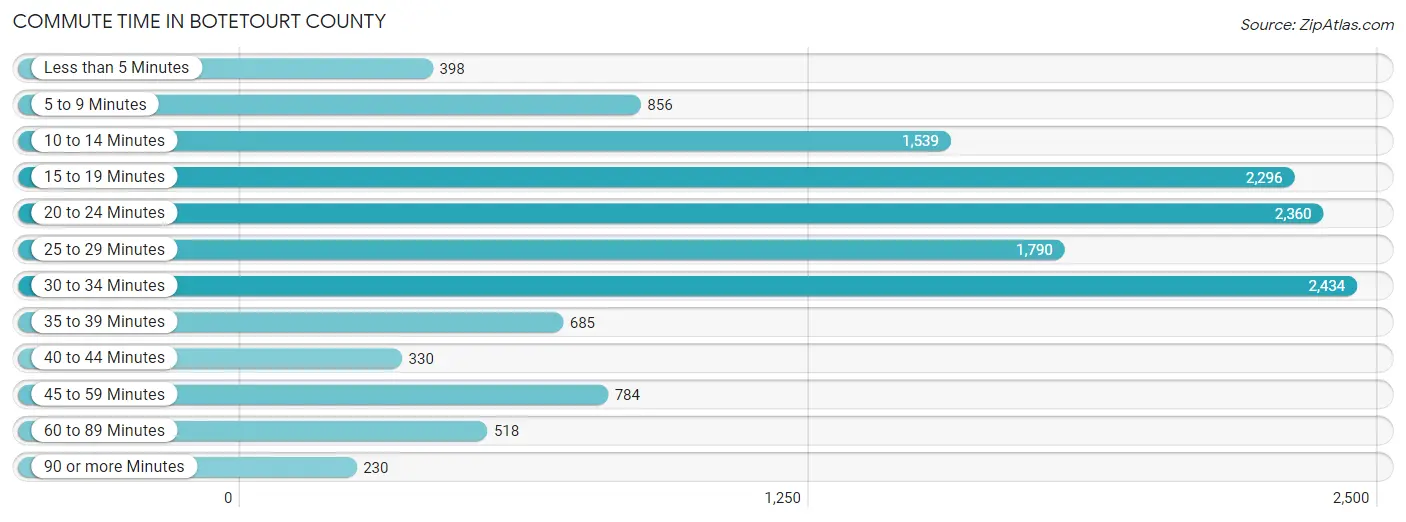
| Commute Time | # Commuters | % Commuters |
| Less than 5 Minutes | 398 | 2.8% |
| 5 to 9 Minutes | 856 | 6.0% |
| 10 to 14 Minutes | 1,539 | 10.8% |
| 15 to 19 Minutes | 2,296 | 16.2% |
| 20 to 24 Minutes | 2,360 | 16.6% |
| 25 to 29 Minutes | 1,790 | 12.6% |
| 30 to 34 Minutes | 2,434 | 17.1% |
| 35 to 39 Minutes | 685 | 4.8% |
| 40 to 44 Minutes | 330 | 2.3% |
| 45 to 59 Minutes | 784 | 5.5% |
| 60 to 89 Minutes | 518 | 3.6% |
| 90 or more Minutes | 230 | 1.6% |
Commute Time by Sex in Botetourt County
The most common commute times in Botetourt County are 20 to 24 minutes (1,393 commuters, 18.0%) for males and 30 to 34 minutes (1,203 commuters, 18.6%) for females.
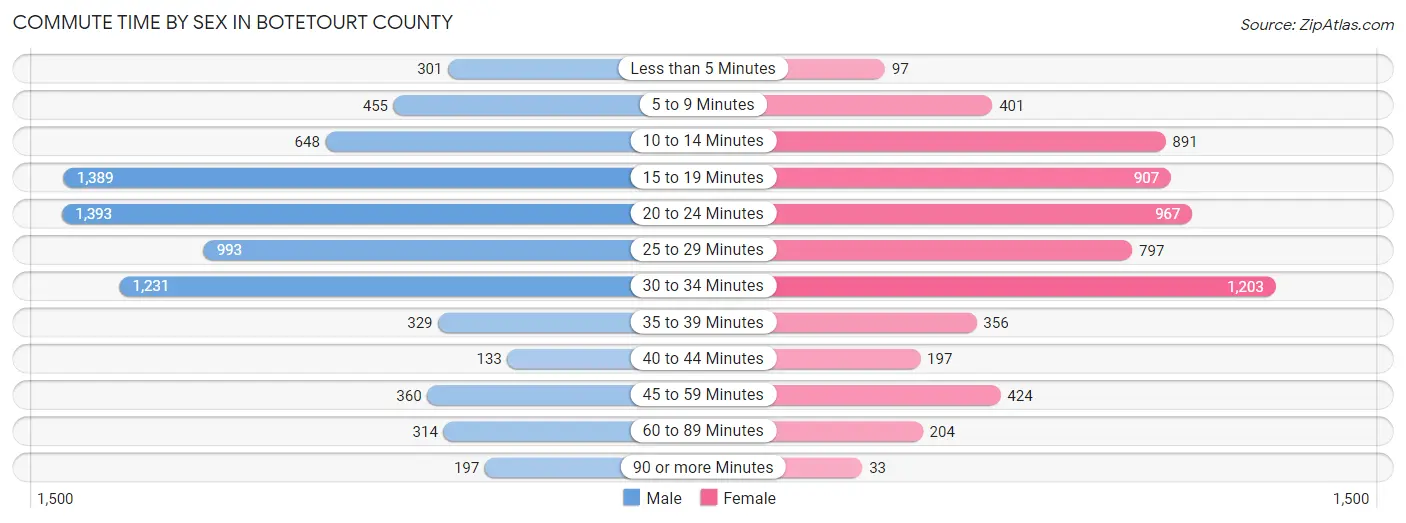
| Commute Time | Male | Female |
| Less than 5 Minutes | 301 (3.9%) | 97 (1.5%) |
| 5 to 9 Minutes | 455 (5.9%) | 401 (6.2%) |
| 10 to 14 Minutes | 648 (8.4%) | 891 (13.8%) |
| 15 to 19 Minutes | 1,389 (17.9%) | 907 (14.0%) |
| 20 to 24 Minutes | 1,393 (18.0%) | 967 (14.9%) |
| 25 to 29 Minutes | 993 (12.8%) | 797 (12.3%) |
| 30 to 34 Minutes | 1,231 (15.9%) | 1,203 (18.6%) |
| 35 to 39 Minutes | 329 (4.3%) | 356 (5.5%) |
| 40 to 44 Minutes | 133 (1.7%) | 197 (3.0%) |
| 45 to 59 Minutes | 360 (4.6%) | 424 (6.6%) |
| 60 to 89 Minutes | 314 (4.1%) | 204 (3.2%) |
| 90 or more Minutes | 197 (2.5%) | 33 (0.5%) |
Time of Departure to Work by Sex in Botetourt County
The most frequent times of departure to work in Botetourt County are 7:00 AM to 7:29 AM (1,285, 16.6%) for males and 7:30 AM to 7:59 AM (1,412, 21.8%) for females.
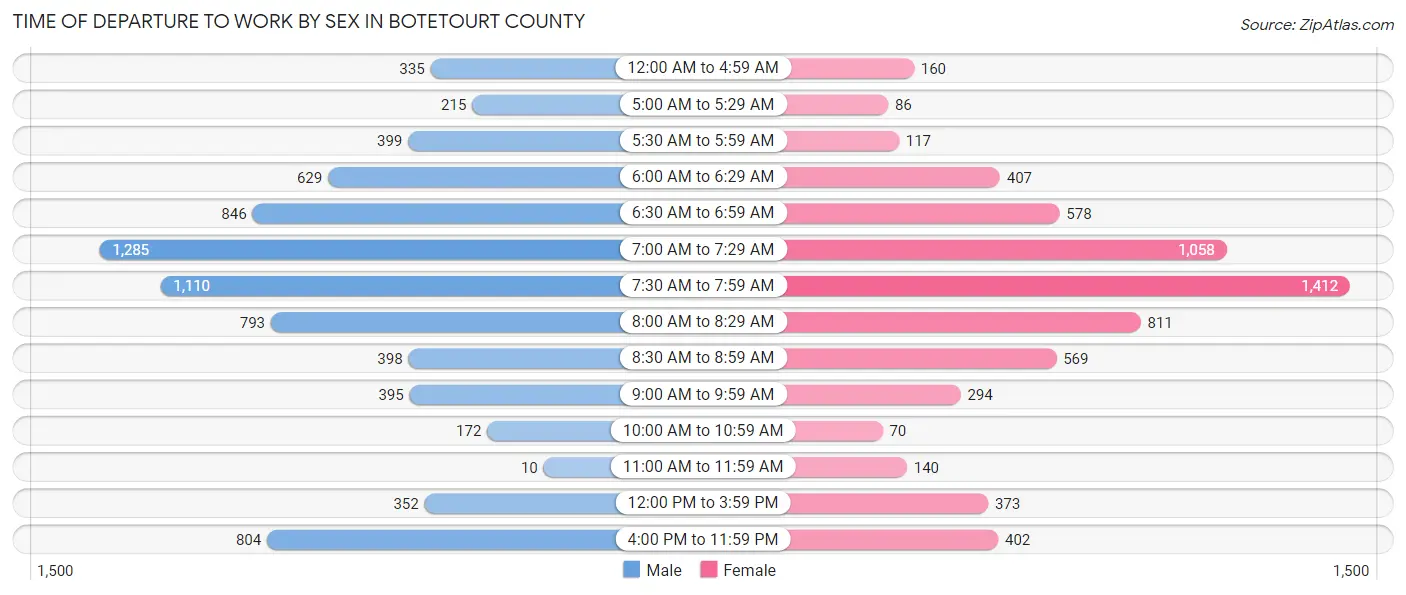
| Time of Departure | Male | Female |
| 12:00 AM to 4:59 AM | 335 (4.3%) | 160 (2.5%) |
| 5:00 AM to 5:29 AM | 215 (2.8%) | 86 (1.3%) |
| 5:30 AM to 5:59 AM | 399 (5.1%) | 117 (1.8%) |
| 6:00 AM to 6:29 AM | 629 (8.1%) | 407 (6.3%) |
| 6:30 AM to 6:59 AM | 846 (10.9%) | 578 (8.9%) |
| 7:00 AM to 7:29 AM | 1,285 (16.6%) | 1,058 (16.3%) |
| 7:30 AM to 7:59 AM | 1,110 (14.3%) | 1,412 (21.8%) |
| 8:00 AM to 8:29 AM | 793 (10.2%) | 811 (12.5%) |
| 8:30 AM to 8:59 AM | 398 (5.1%) | 569 (8.8%) |
| 9:00 AM to 9:59 AM | 395 (5.1%) | 294 (4.5%) |
| 10:00 AM to 10:59 AM | 172 (2.2%) | 70 (1.1%) |
| 11:00 AM to 11:59 AM | 10 (0.1%) | 140 (2.2%) |
| 12:00 PM to 3:59 PM | 352 (4.5%) | 373 (5.8%) |
| 4:00 PM to 11:59 PM | 804 (10.4%) | 402 (6.2%) |
| Total | 7,743 (100.0%) | 6,477 (100.0%) |
Housing Occupancy in Botetourt County
Occupancy by Ownership in Botetourt County
Of the total 12,916 dwellings in Botetourt County, owner-occupied units account for 11,198 (86.7%), while renter-occupied units make up 1,718 (13.3%).
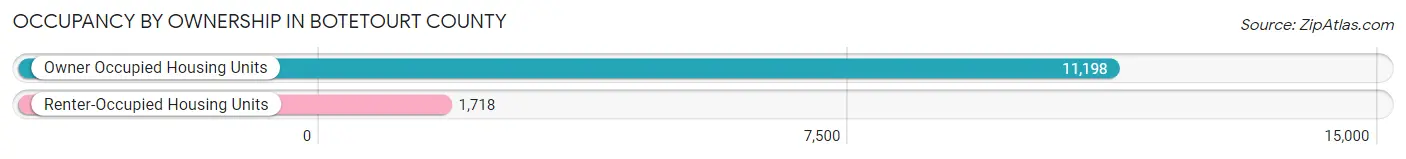
| Occupancy | # Housing Units | % Housing Units |
| Owner Occupied Housing Units | 11,198 | 86.7% |
| Renter-Occupied Housing Units | 1,718 | 13.3% |
| Total Occupied Housing Units | 12,916 | 100.0% |
Occupancy by Household Size in Botetourt County
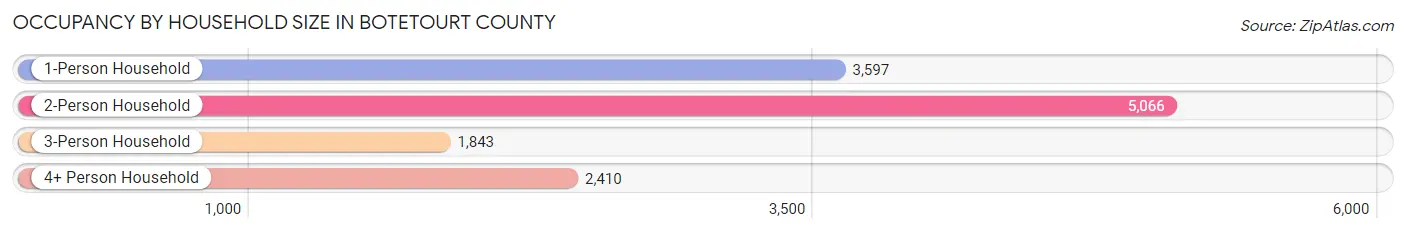
| Household Size | # Housing Units | % Housing Units |
| 1-Person Household | 3,597 | 27.9% |
| 2-Person Household | 5,066 | 39.2% |
| 3-Person Household | 1,843 | 14.3% |
| 4+ Person Household | 2,410 | 18.7% |
| Total Housing Units | 12,916 | 100.0% |
Occupancy by Ownership by Household Size in Botetourt County
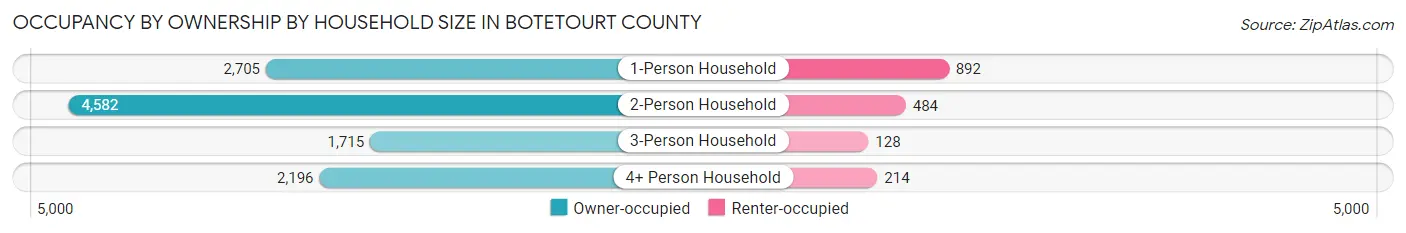
| Household Size | Owner-occupied | Renter-occupied |
| 1-Person Household | 2,705 (75.2%) | 892 (24.8%) |
| 2-Person Household | 4,582 (90.4%) | 484 (9.6%) |
| 3-Person Household | 1,715 (93.0%) | 128 (7.0%) |
| 4+ Person Household | 2,196 (91.1%) | 214 (8.9%) |
| Total Housing Units | 11,198 (86.7%) | 1,718 (13.3%) |
Occupancy by Educational Attainment in Botetourt County
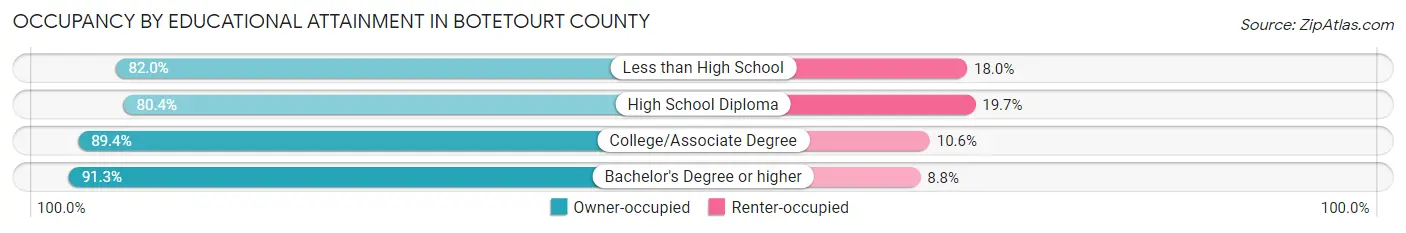
| Household Size | Owner-occupied | Renter-occupied |
| Less than High School | 596 (82.0%) | 131 (18.0%) |
| High School Diploma | 3,268 (80.3%) | 799 (19.7%) |
| College/Associate Degree | 3,672 (89.4%) | 437 (10.6%) |
| Bachelor's Degree or higher | 3,662 (91.2%) | 351 (8.7%) |
Occupancy by Age of Householder in Botetourt County
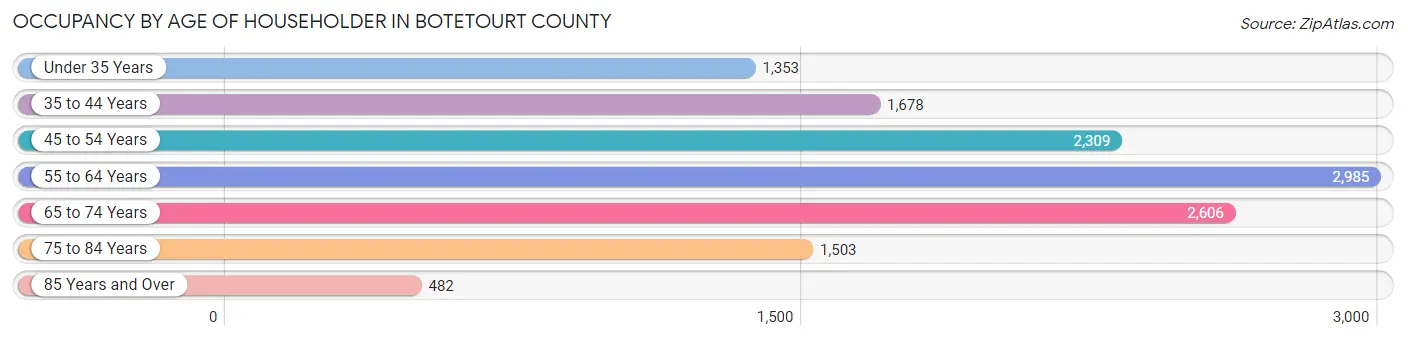
| Age Bracket | # Households | % Households |
| Under 35 Years | 1,353 | 10.5% |
| 35 to 44 Years | 1,678 | 13.0% |
| 45 to 54 Years | 2,309 | 17.9% |
| 55 to 64 Years | 2,985 | 23.1% |
| 65 to 74 Years | 2,606 | 20.2% |
| 75 to 84 Years | 1,503 | 11.6% |
| 85 Years and Over | 482 | 3.7% |
| Total | 12,916 | 100.0% |
Housing Finances in Botetourt County
Median Income by Occupancy in Botetourt County
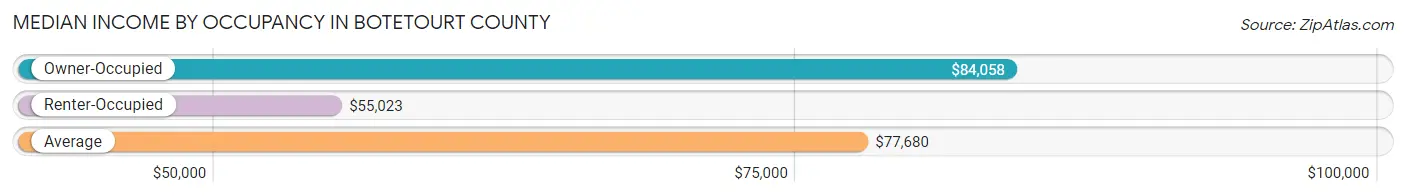
| Occupancy Type | # Households | Median Income |
| Owner-Occupied | 11,198 (86.7%) | $84,058 |
| Renter-Occupied | 1,718 (13.3%) | $55,023 |
| Average | 12,916 (100.0%) | $77,680 |
Occupancy by Householder Income Bracket in Botetourt County
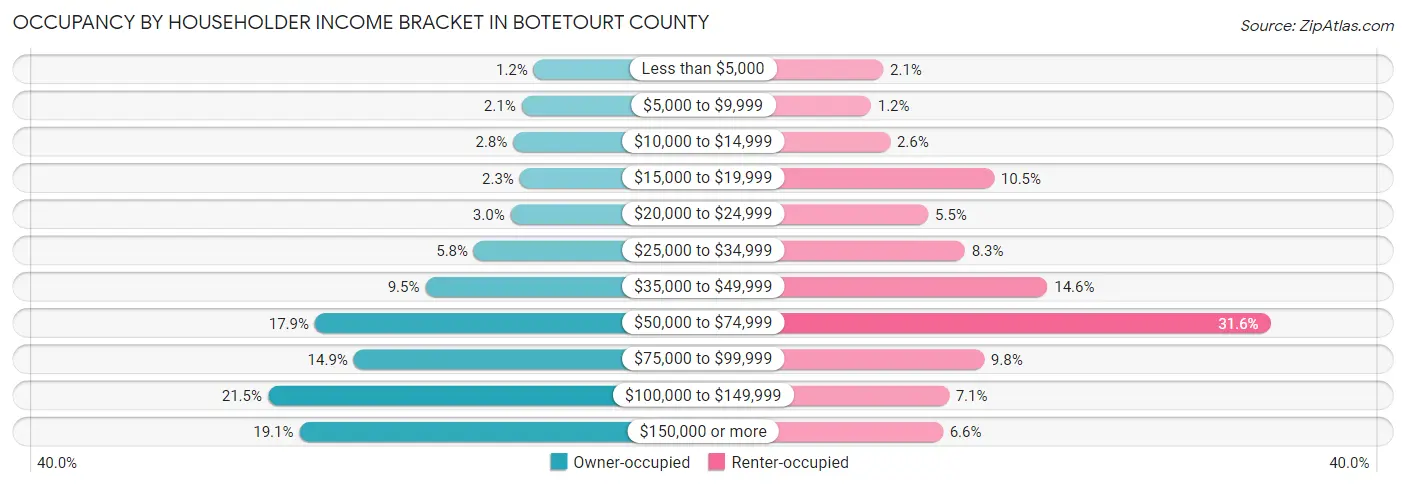
| Income Bracket | Owner-occupied | Renter-occupied |
| Less than $5,000 | 137 (1.2%) | 36 (2.1%) |
| $5,000 to $9,999 | 240 (2.1%) | 20 (1.2%) |
| $10,000 to $14,999 | 311 (2.8%) | 45 (2.6%) |
| $15,000 to $19,999 | 255 (2.3%) | 181 (10.5%) |
| $20,000 to $24,999 | 334 (3.0%) | 95 (5.5%) |
| $25,000 to $34,999 | 646 (5.8%) | 143 (8.3%) |
| $35,000 to $49,999 | 1,060 (9.5%) | 251 (14.6%) |
| $50,000 to $74,999 | 2,003 (17.9%) | 543 (31.6%) |
| $75,000 to $99,999 | 1,672 (14.9%) | 168 (9.8%) |
| $100,000 to $149,999 | 2,404 (21.5%) | 122 (7.1%) |
| $150,000 or more | 2,136 (19.1%) | 114 (6.6%) |
| Total | 11,198 (100.0%) | 1,718 (100.0%) |
Monthly Housing Cost Tiers in Botetourt County
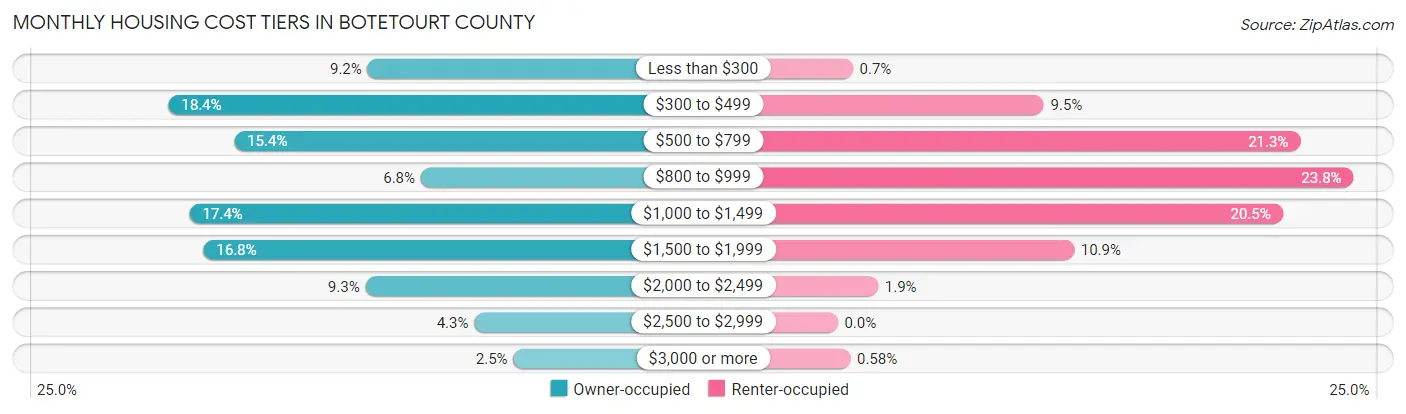
| Monthly Cost | Owner-occupied | Renter-occupied |
| Less than $300 | 1,031 (9.2%) | 12 (0.7%) |
| $300 to $499 | 2,058 (18.4%) | 163 (9.5%) |
| $500 to $799 | 1,720 (15.4%) | 366 (21.3%) |
| $800 to $999 | 757 (6.8%) | 408 (23.7%) |
| $1,000 to $1,499 | 1,950 (17.4%) | 352 (20.5%) |
| $1,500 to $1,999 | 1,878 (16.8%) | 187 (10.9%) |
| $2,000 to $2,499 | 1,043 (9.3%) | 32 (1.9%) |
| $2,500 to $2,999 | 481 (4.3%) | 0 (0.0%) |
| $3,000 or more | 280 (2.5%) | 10 (0.6%) |
| Total | 11,198 (100.0%) | 1,718 (100.0%) |
Physical Housing Characteristics in Botetourt County
Housing Structures in Botetourt County
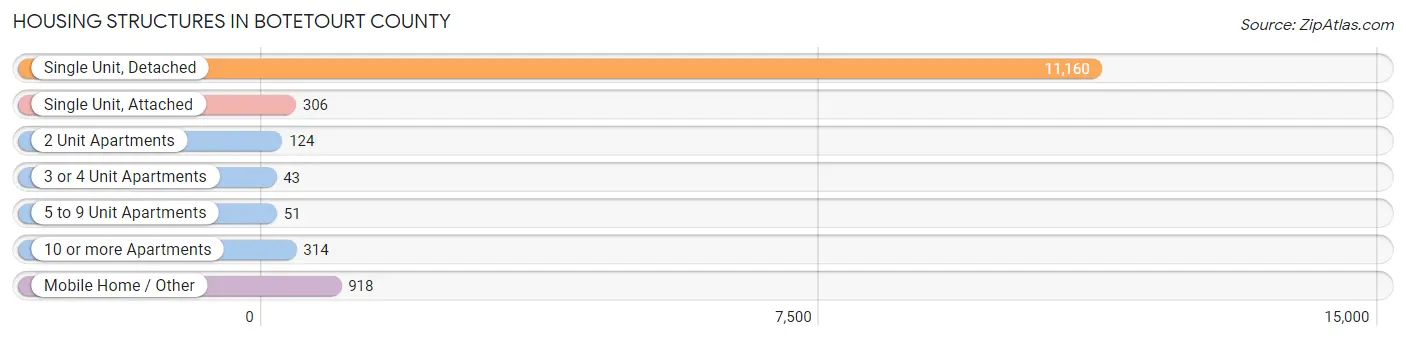
| Structure Type | # Housing Units | % Housing Units |
| Single Unit, Detached | 11,160 | 86.4% |
| Single Unit, Attached | 306 | 2.4% |
| 2 Unit Apartments | 124 | 1.0% |
| 3 or 4 Unit Apartments | 43 | 0.3% |
| 5 to 9 Unit Apartments | 51 | 0.4% |
| 10 or more Apartments | 314 | 2.4% |
| Mobile Home / Other | 918 | 7.1% |
| Total | 12,916 | 100.0% |
Housing Structures by Occupancy in Botetourt County
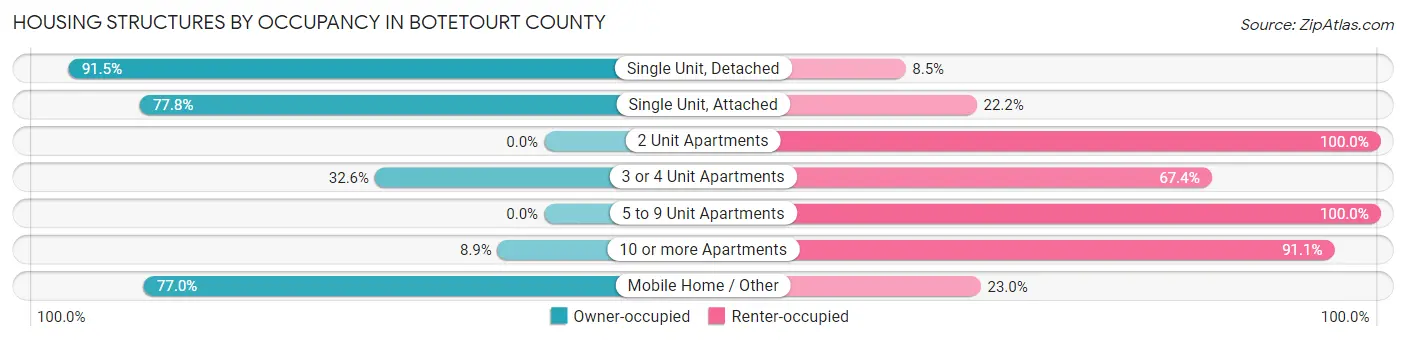
| Structure Type | Owner-occupied | Renter-occupied |
| Single Unit, Detached | 10,211 (91.5%) | 949 (8.5%) |
| Single Unit, Attached | 238 (77.8%) | 68 (22.2%) |
| 2 Unit Apartments | 0 (0.0%) | 124 (100.0%) |
| 3 or 4 Unit Apartments | 14 (32.6%) | 29 (67.4%) |
| 5 to 9 Unit Apartments | 0 (0.0%) | 51 (100.0%) |
| 10 or more Apartments | 28 (8.9%) | 286 (91.1%) |
| Mobile Home / Other | 707 (77.0%) | 211 (23.0%) |
| Total | 11,198 (86.7%) | 1,718 (13.3%) |
Housing Structures by Number of Rooms in Botetourt County
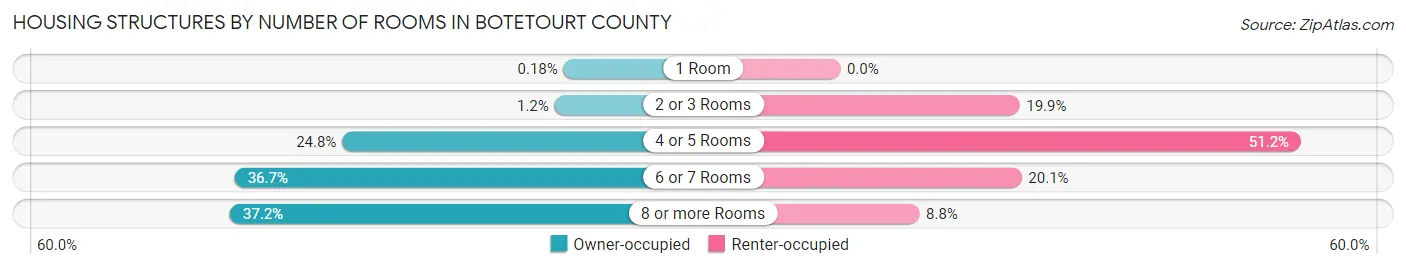
| Number of Rooms | Owner-occupied | Renter-occupied |
| 1 Room | 20 (0.2%) | 0 (0.0%) |
| 2 or 3 Rooms | 132 (1.2%) | 342 (19.9%) |
| 4 or 5 Rooms | 2,772 (24.7%) | 879 (51.2%) |
| 6 or 7 Rooms | 4,107 (36.7%) | 346 (20.1%) |
| 8 or more Rooms | 4,167 (37.2%) | 151 (8.8%) |
| Total | 11,198 (100.0%) | 1,718 (100.0%) |
Housing Structure by Heating Type in Botetourt County
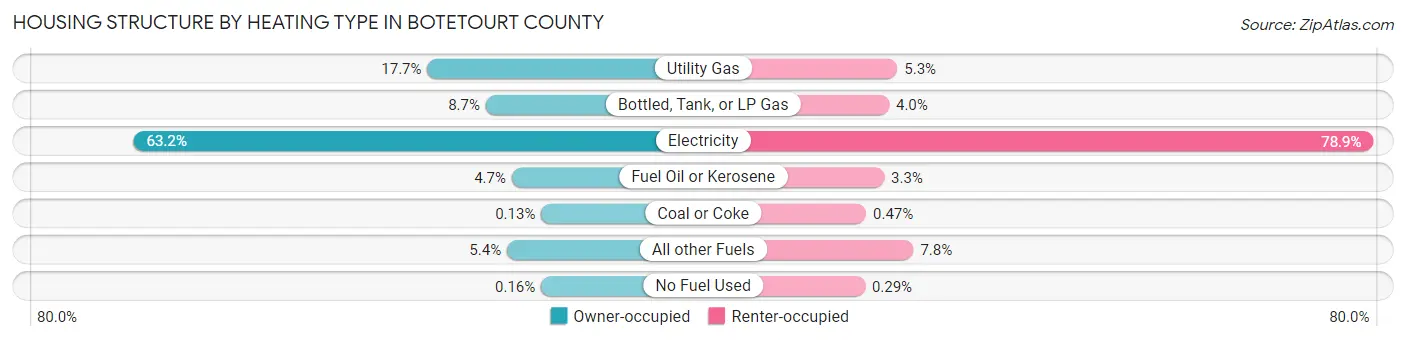
| Heating Type | Owner-occupied | Renter-occupied |
| Utility Gas | 1,987 (17.7%) | 91 (5.3%) |
| Bottled, Tank, or LP Gas | 974 (8.7%) | 69 (4.0%) |
| Electricity | 7,073 (63.2%) | 1,355 (78.9%) |
| Fuel Oil or Kerosene | 524 (4.7%) | 56 (3.3%) |
| Coal or Coke | 14 (0.1%) | 8 (0.5%) |
| All other Fuels | 608 (5.4%) | 134 (7.8%) |
| No Fuel Used | 18 (0.2%) | 5 (0.3%) |
| Total | 11,198 (100.0%) | 1,718 (100.0%) |
Household Vehicle Usage in Botetourt County
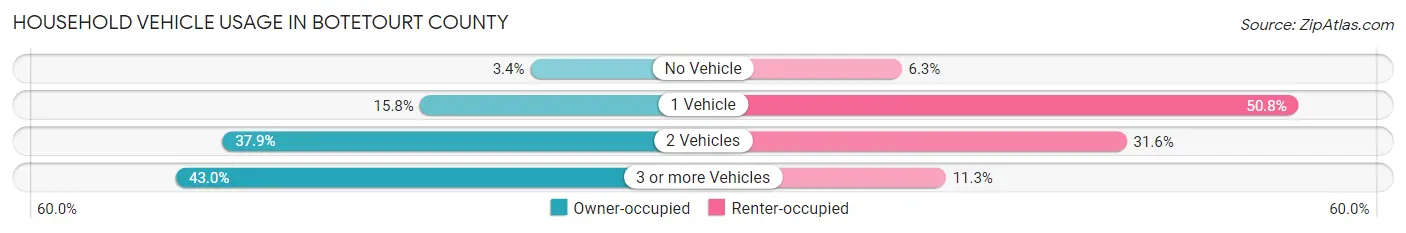
| Vehicles per Household | Owner-occupied | Renter-occupied |
| No Vehicle | 375 (3.4%) | 109 (6.3%) |
| 1 Vehicle | 1,764 (15.8%) | 873 (50.8%) |
| 2 Vehicles | 4,240 (37.9%) | 542 (31.6%) |
| 3 or more Vehicles | 4,819 (43.0%) | 194 (11.3%) |
| Total | 11,198 (100.0%) | 1,718 (100.0%) |
Real Estate & Mortgages in Botetourt County
Real Estate and Mortgage Overview in Botetourt County
| Characteristic | Without Mortgage | With Mortgage |
| Housing Units | 4,724 | 6,474 |
| Median Property Value | $235,400 | $281,200 |
| Median Household Income | $65,236 | $1,608 |
| Monthly Housing Costs | $448 | $271 |
| Real Estate Taxes | $1,751 | $122 |
Property Value by Mortgage Status in Botetourt County
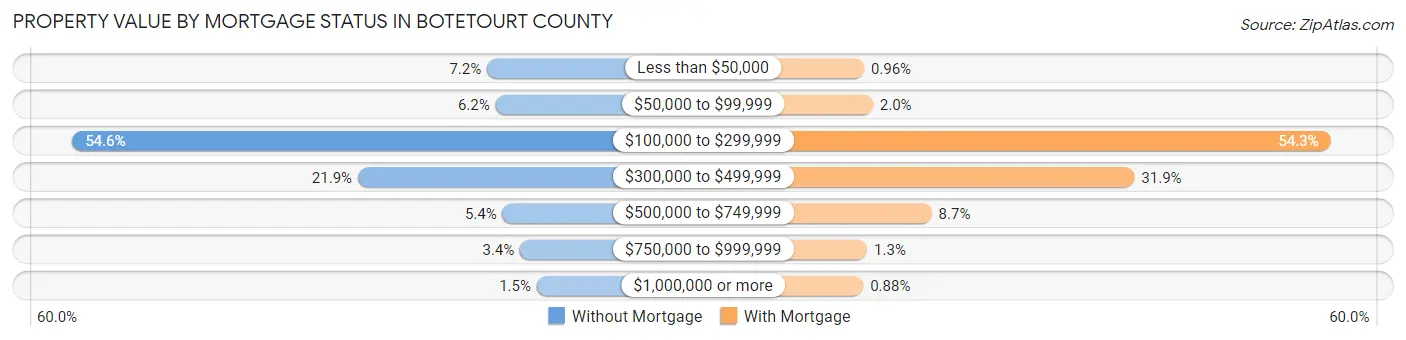
| Property Value | Without Mortgage | With Mortgage |
| Less than $50,000 | 338 (7.1%) | 62 (1.0%) |
| $50,000 to $99,999 | 292 (6.2%) | 128 (2.0%) |
| $100,000 to $299,999 | 2,577 (54.5%) | 3,515 (54.3%) |
| $300,000 to $499,999 | 1,035 (21.9%) | 2,063 (31.9%) |
| $500,000 to $749,999 | 254 (5.4%) | 563 (8.7%) |
| $750,000 to $999,999 | 159 (3.4%) | 86 (1.3%) |
| $1,000,000 or more | 69 (1.5%) | 57 (0.9%) |
| Total | 4,724 (100.0%) | 6,474 (100.0%) |
Household Income by Mortgage Status in Botetourt County
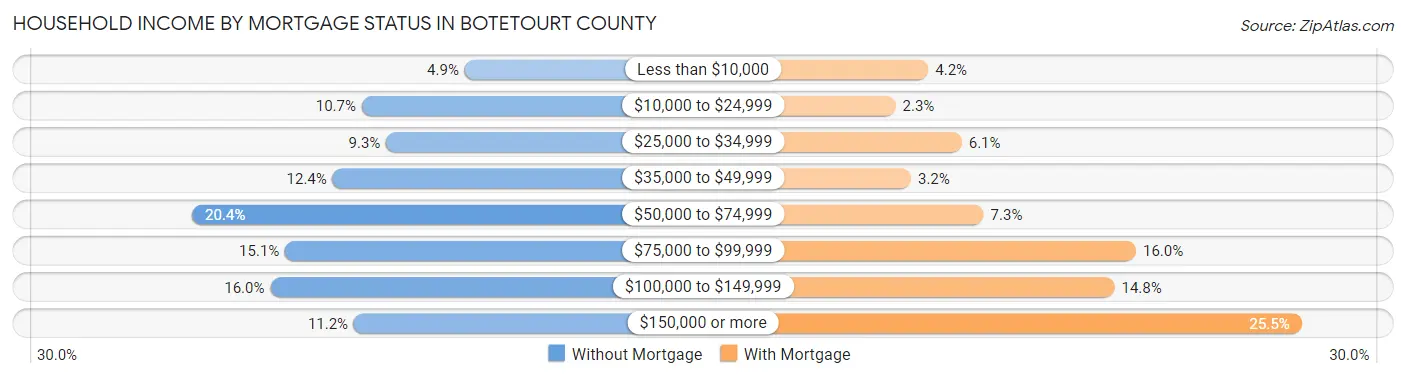
| Household Income | Without Mortgage | With Mortgage |
| Less than $10,000 | 229 (4.9%) | 269 (4.2%) |
| $10,000 to $24,999 | 507 (10.7%) | 148 (2.3%) |
| $25,000 to $34,999 | 441 (9.3%) | 393 (6.1%) |
| $35,000 to $49,999 | 586 (12.4%) | 205 (3.2%) |
| $50,000 to $74,999 | 965 (20.4%) | 474 (7.3%) |
| $75,000 to $99,999 | 714 (15.1%) | 1,038 (16.0%) |
| $100,000 to $149,999 | 754 (16.0%) | 958 (14.8%) |
| $150,000 or more | 528 (11.2%) | 1,650 (25.5%) |
| Total | 4,724 (100.0%) | 6,474 (100.0%) |
Property Value to Household Income Ratio in Botetourt County

| Value-to-Income Ratio | Without Mortgage | With Mortgage |
| Less than 2.0x | 1,263 (26.7%) | 100,921 (1,558.9%) |
| 2.0x to 2.9x | 713 (15.1%) | 1,733 (26.8%) |
| 3.0x to 3.9x | 530 (11.2%) | 1,794 (27.7%) |
| 4.0x or more | 2,210 (46.8%) | 805 (12.4%) |
| Total | 4,724 (100.0%) | 6,474 (100.0%) |
Real Estate Taxes by Mortgage Status in Botetourt County
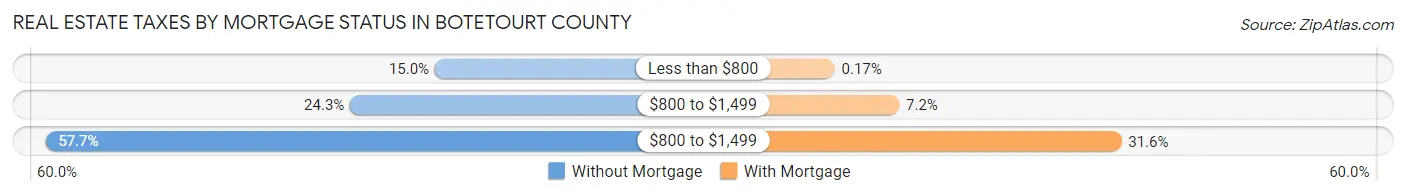
| Property Taxes | Without Mortgage | With Mortgage |
| Less than $800 | 710 (15.0%) | 11 (0.2%) |
| $800 to $1,499 | 1,149 (24.3%) | 469 (7.2%) |
| $800 to $1,499 | 2,727 (57.7%) | 2,045 (31.6%) |
| Total | 4,724 (100.0%) | 6,474 (100.0%) |
Health & Disability in Botetourt County
Health Insurance Coverage by Age in Botetourt County
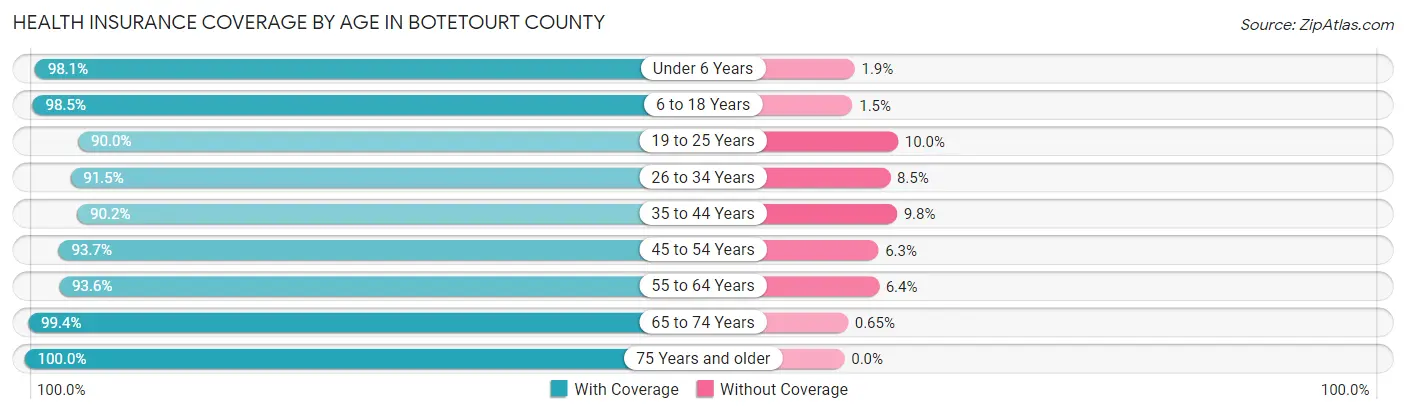
| Age Bracket | With Coverage | Without Coverage |
| Under 6 Years | 1,593 (98.1%) | 31 (1.9%) |
| 6 to 18 Years | 5,220 (98.5%) | 79 (1.5%) |
| 19 to 25 Years | 2,049 (90.0%) | 227 (10.0%) |
| 26 to 34 Years | 2,609 (91.5%) | 243 (8.5%) |
| 35 to 44 Years | 3,137 (90.2%) | 340 (9.8%) |
| 45 to 54 Years | 4,393 (93.7%) | 297 (6.3%) |
| 55 to 64 Years | 5,100 (93.6%) | 350 (6.4%) |
| 65 to 74 Years | 4,463 (99.4%) | 29 (0.6%) |
| 75 Years and older | 3,141 (100.0%) | 0 (0.0%) |
| Total | 31,705 (95.2%) | 1,596 (4.8%) |
Health Insurance Coverage by Citizenship Status in Botetourt County
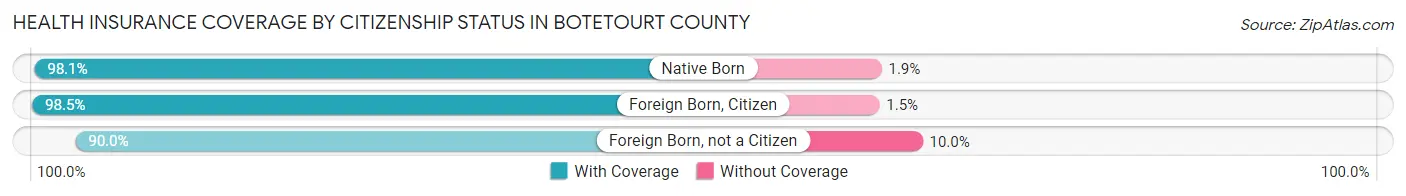
| Citizenship Status | With Coverage | Without Coverage |
| Native Born | 1,593 (98.1%) | 31 (1.9%) |
| Foreign Born, Citizen | 5,220 (98.5%) | 79 (1.5%) |
| Foreign Born, not a Citizen | 2,049 (90.0%) | 227 (10.0%) |
Health Insurance Coverage by Household Income in Botetourt County
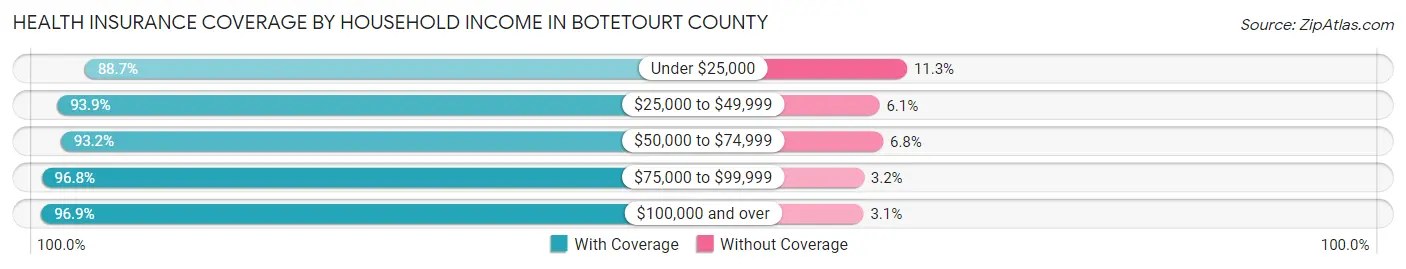
| Household Income | With Coverage | Without Coverage |
| Under $25,000 | 2,386 (88.7%) | 303 (11.3%) |
| $25,000 to $49,999 | 3,561 (93.9%) | 232 (6.1%) |
| $50,000 to $74,999 | 5,447 (93.2%) | 397 (6.8%) |
| $75,000 to $99,999 | 4,933 (96.8%) | 163 (3.2%) |
| $100,000 and over | 15,367 (96.9%) | 495 (3.1%) |
Public vs Private Health Insurance Coverage by Age in Botetourt County
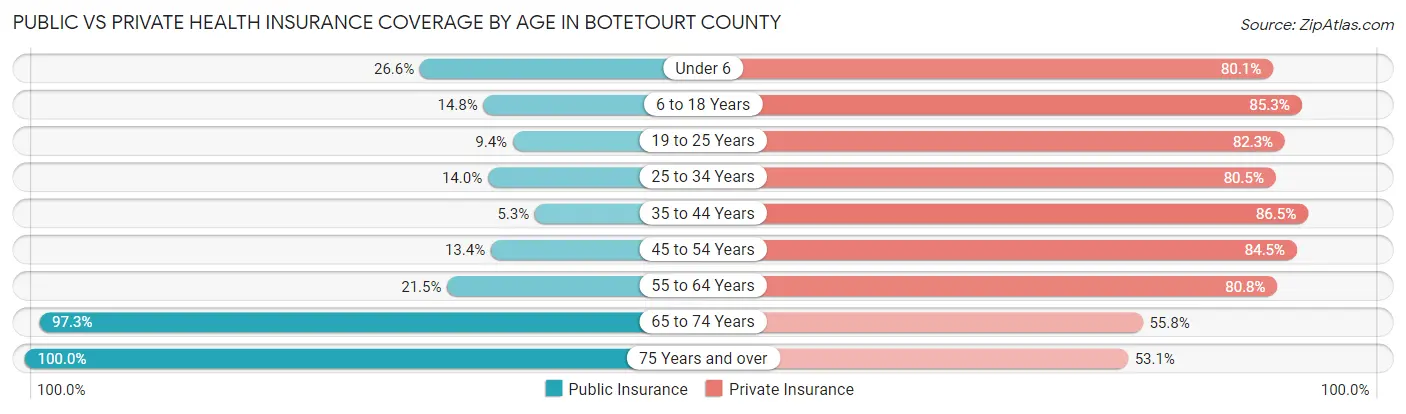
| Age Bracket | Public Insurance | Private Insurance |
| Under 6 | 432 (26.6%) | 1,300 (80.0%) |
| 6 to 18 Years | 785 (14.8%) | 4,522 (85.3%) |
| 19 to 25 Years | 213 (9.4%) | 1,872 (82.3%) |
| 25 to 34 Years | 399 (14.0%) | 2,297 (80.5%) |
| 35 to 44 Years | 183 (5.3%) | 3,009 (86.5%) |
| 45 to 54 Years | 630 (13.4%) | 3,961 (84.5%) |
| 55 to 64 Years | 1,174 (21.5%) | 4,406 (80.8%) |
| 65 to 74 Years | 4,371 (97.3%) | 2,507 (55.8%) |
| 75 Years and over | 3,141 (100.0%) | 1,667 (53.1%) |
| Total | 11,328 (34.0%) | 25,541 (76.7%) |
Disability Status by Sex by Age in Botetourt County
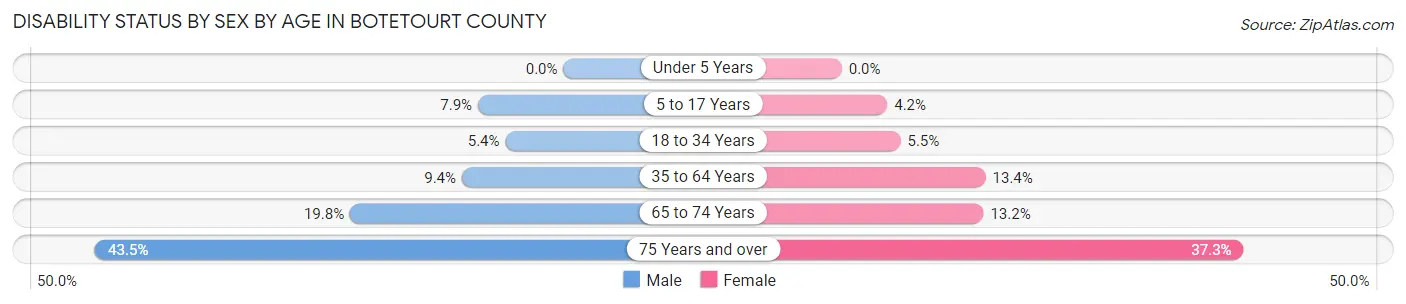
| Age Bracket | Male | Female |
| Under 5 Years | 0 (0.0%) | 0 (0.0%) |
| 5 to 17 Years | 199 (7.9%) | 102 (4.2%) |
| 18 to 34 Years | 159 (5.4%) | 151 (5.4%) |
| 35 to 64 Years | 643 (9.4%) | 907 (13.4%) |
| 65 to 74 Years | 445 (19.8%) | 295 (13.2%) |
| 75 Years and over | 578 (43.5%) | 675 (37.3%) |
Disability Class by Sex by Age in Botetourt County
Disability Class: Hearing Difficulty
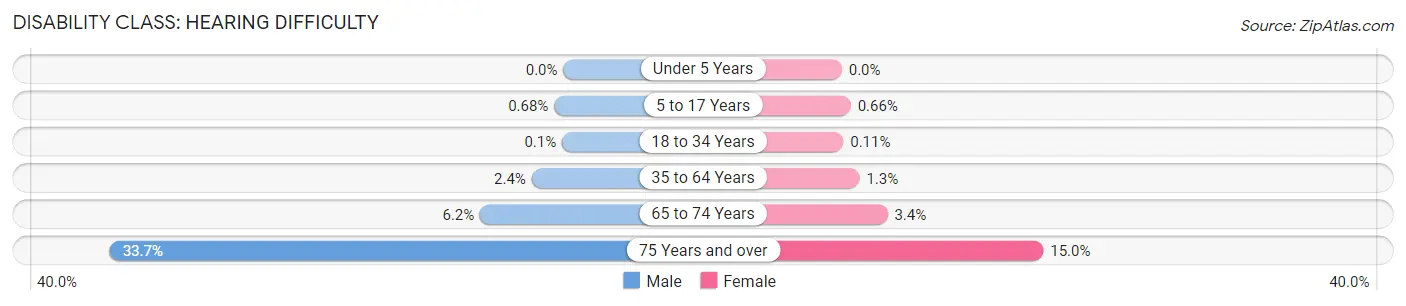
| Age Bracket | Male | Female |
| Under 5 Years | 0 (0.0%) | 0 (0.0%) |
| 5 to 17 Years | 17 (0.7%) | 16 (0.7%) |
| 18 to 34 Years | 3 (0.1%) | 3 (0.1%) |
| 35 to 64 Years | 160 (2.4%) | 89 (1.3%) |
| 65 to 74 Years | 139 (6.2%) | 76 (3.4%) |
| 75 Years and over | 448 (33.7%) | 271 (15.0%) |
Disability Class: Vision Difficulty
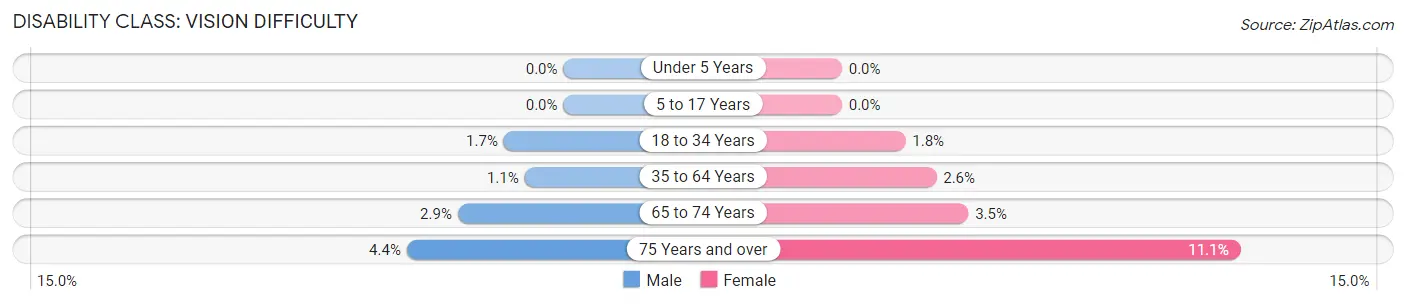
| Age Bracket | Male | Female |
| Under 5 Years | 0 (0.0%) | 0 (0.0%) |
| 5 to 17 Years | 0 (0.0%) | 0 (0.0%) |
| 18 to 34 Years | 49 (1.7%) | 49 (1.8%) |
| 35 to 64 Years | 74 (1.1%) | 179 (2.6%) |
| 65 to 74 Years | 66 (2.9%) | 79 (3.5%) |
| 75 Years and over | 58 (4.4%) | 201 (11.1%) |
Disability Class: Cognitive Difficulty
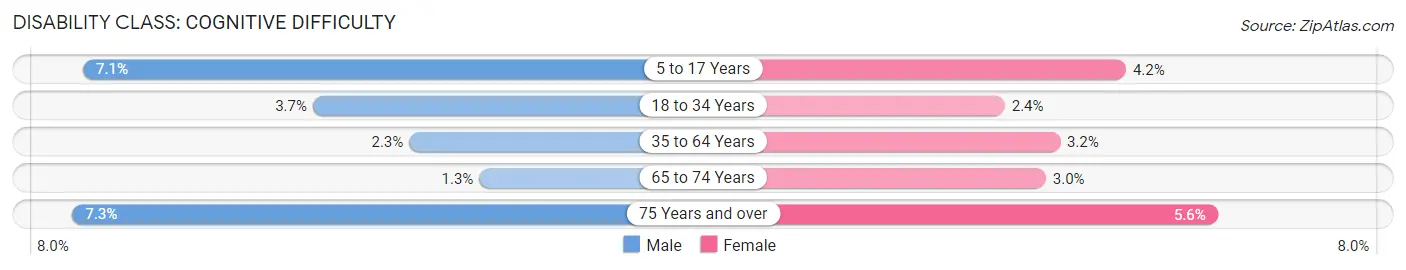
| Age Bracket | Male | Female |
| 5 to 17 Years | 179 (7.1%) | 102 (4.2%) |
| 18 to 34 Years | 110 (3.7%) | 67 (2.4%) |
| 35 to 64 Years | 156 (2.3%) | 220 (3.2%) |
| 65 to 74 Years | 28 (1.3%) | 68 (3.0%) |
| 75 Years and over | 97 (7.3%) | 101 (5.6%) |
Disability Class: Ambulatory Difficulty
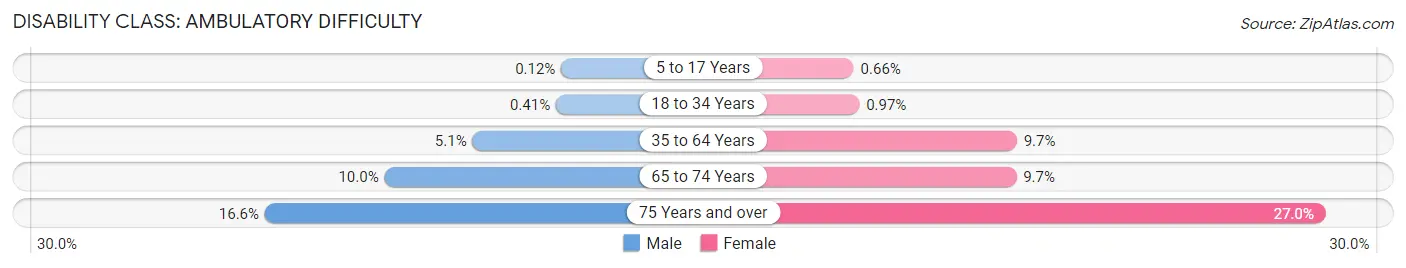
| Age Bracket | Male | Female |
| 5 to 17 Years | 3 (0.1%) | 16 (0.7%) |
| 18 to 34 Years | 12 (0.4%) | 27 (1.0%) |
| 35 to 64 Years | 345 (5.1%) | 662 (9.7%) |
| 65 to 74 Years | 224 (10.0%) | 218 (9.7%) |
| 75 Years and over | 221 (16.6%) | 488 (27.0%) |
Disability Class: Self-Care Difficulty
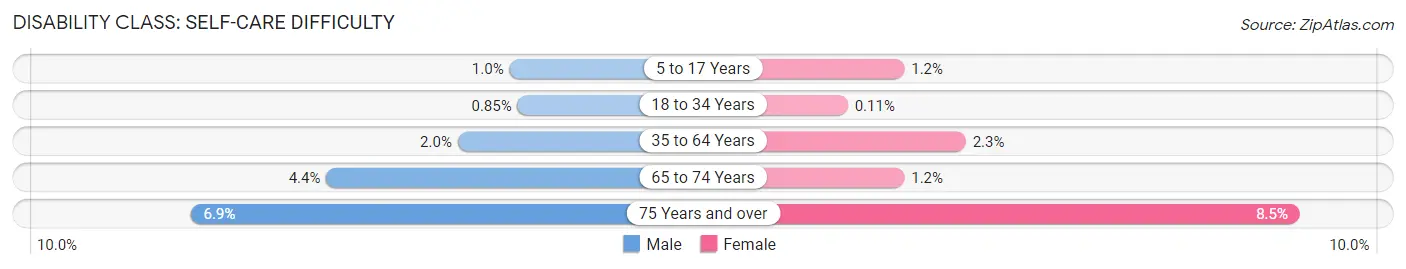
| Age Bracket | Male | Female |
| 5 to 17 Years | 25 (1.0%) | 28 (1.2%) |
| 18 to 34 Years | 25 (0.9%) | 3 (0.1%) |
| 35 to 64 Years | 134 (2.0%) | 156 (2.3%) |
| 65 to 74 Years | 99 (4.4%) | 26 (1.2%) |
| 75 Years and over | 92 (6.9%) | 154 (8.5%) |
Technology Access in Botetourt County
Computing Device Access in Botetourt County
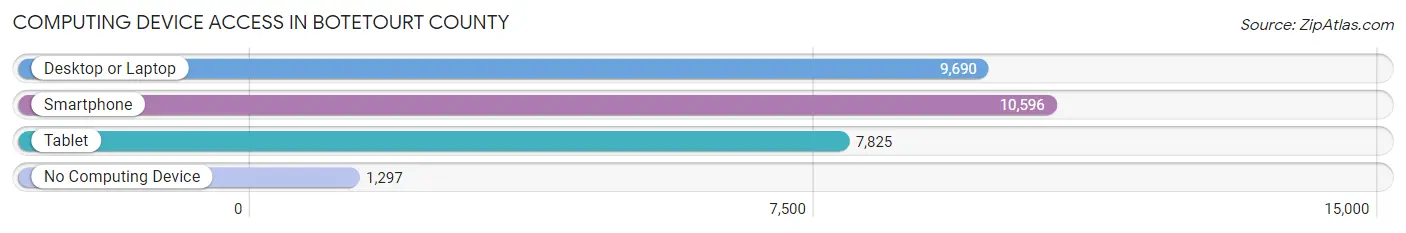
| Device Type | # Households | % Households |
| Desktop or Laptop | 9,690 | 75.0% |
| Smartphone | 10,596 | 82.0% |
| Tablet | 7,825 | 60.6% |
| No Computing Device | 1,297 | 10.0% |
| Total | 12,916 | 100.0% |
Internet Access in Botetourt County
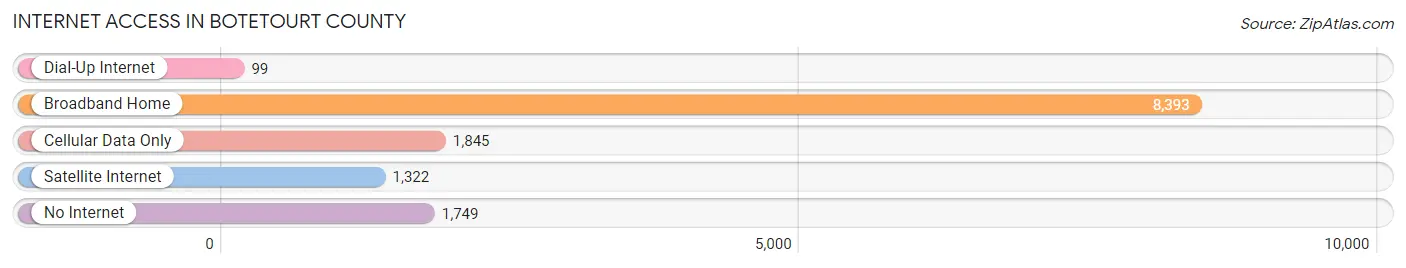
| Internet Type | # Households | % Households |
| Dial-Up Internet | 99 | 0.8% |
| Broadband Home | 8,393 | 65.0% |
| Cellular Data Only | 1,845 | 14.3% |
| Satellite Internet | 1,322 | 10.2% |
| No Internet | 1,749 | 13.5% |
| Total | 12,916 | 100.0% |
Botetourt County Summary
Botetourt County, Virginia is located in the western part of the state, in the Roanoke Valley region. It is bordered by Roanoke County to the north, Craig County to the east, Alleghany County to the south, and Rockbridge County to the west. The county seat is Fincastle, and the county is part of the Roanoke Metropolitan Statistical Area.
History
Botetourt County was formed in 1770 from Augusta and Fincastle counties. It was named for Norborne Berkeley, Baron de Botetourt, who served as the royal governor of Virginia from 1768 to 1770. The county was originally part of the vast frontier of the Virginia Colony, and was home to several Native American tribes, including the Monacan, the Tutelo, and the Saponi.
During the American Revolution, Botetourt County was the site of several battles, including the Battle of Iron Works Hill in 1781. After the war, the county was divided into several smaller counties, including Roanoke, Craig, and Alleghany.
Geography
Botetourt County covers an area of 517 square miles, making it the second-largest county in Virginia. The county is located in the Appalachian Mountains, and is home to several mountain ranges, including the Blue Ridge Mountains, the Allegheny Mountains, and the Appalachian Plateau. The county is also home to several rivers, including the James, the Roanoke, and the New.
The county is divided into several townships, including Fincastle, Troutville, Buchanan, Eagle Rock, and Cloverdale. The county seat is Fincastle, and the largest city is Troutville.
Economy
The economy of Botetourt County is largely based on agriculture and manufacturing. The county is home to several large farms, and is a major producer of tobacco, corn, and hay. The county is also home to several manufacturing companies, including the Roanoke Valley Manufacturing Company, which produces furniture, and the Botetourt County Manufacturing Company, which produces textiles.
The county is also home to several tourist attractions, including the Blue Ridge Parkway, the Appalachian Trail, and the James River.
Demographics
As of the 2010 census, Botetourt County had a population of 33,148. The racial makeup of the county was 92.3% White, 4.3% African American, 0.4% Native American, 0.7% Asian, 0.1% Pacific Islander, 0.7% from other races, and 1.5% from two or more races. Hispanic or Latino of any race were 2.2% of the population.
The median income for a household in the county was $45,945, and the median income for a family was $54,945. The per capita income for the county was $22,945. About 8.3% of families and 11.2% of the population were below the poverty line, including 15.2% of those under age 18 and 8.2% of those age 65 or over.
Common Questions
What is Per Capita Income in Botetourt County?
Per Capita income in Botetourt County is $40,289.
What is the Median Family Income in Botetourt County?
Median Family Income in Botetourt County is $92,908.
What is the Median Household income in Botetourt County?
Median Household Income in Botetourt County is $77,680.
What is Income or Wage Gap in Botetourt County?
Income or Wage Gap in Botetourt County is 27.9%.
Women in Botetourt County earn 72.1 cents for every dollar earned by a man.
What is Family Income Deficit in Botetourt County?
Family Income Deficit in Botetourt County is $8,892.
Families that are below poverty line in Botetourt County earn $8,892 less on average than the poverty threshold level.
What is Inequality or Gini Index in Botetourt County?
Inequality or Gini Index in Botetourt County is 0.43.
What is the Total Population of Botetourt County?
Total Population of Botetourt County is 33,734.
What is the Total Male Population of Botetourt County?
Total Male Population of Botetourt County is 16,820.
What is the Total Female Population of Botetourt County?
Total Female Population of Botetourt County is 16,914.
What is the Ratio of Males per 100 Females in Botetourt County?
There are 99.44 Males per 100 Females in Botetourt County.
What is the Ratio of Females per 100 Males in Botetourt County?
There are 100.56 Females per 100 Males in Botetourt County.
What is the Median Population Age in Botetourt County?
Median Population Age in Botetourt County is 47.5 Years.
What is the Average Family Size in Botetourt County
Average Family Size in Botetourt County is 3.1 People.
What is the Average Household Size in Botetourt County
Average Household Size in Botetourt County is 2.6 People.
How Large is the Labor Force in Botetourt County?
There are 16,780 People in the Labor Forcein in Botetourt County.
What is the Percentage of People in the Labor Force in Botetourt County?
59.4% of People are in the Labor Force in Botetourt County.
What is the Unemployment Rate in Botetourt County?
Unemployment Rate in Botetourt County is 3.1%.