Bland County, VA Map & Demographics
Bland County Map
Bland County Overview
$27,904
PER CAPITA INCOME
$67,350
AVG FAMILY INCOME
$59,901
AVG HOUSEHOLD INCOME
10.3%
WAGE / INCOME GAP [ % ]
89.7¢/ $1
WAGE / INCOME GAP [ $ ]
0.38
INEQUALITY / GINI INDEX
6,241
TOTAL POPULATION
3,540
MALE POPULATION
2,701
FEMALE POPULATION
131.06
MALES / 100 FEMALES
76.30
FEMALES / 100 MALES
46.4
MEDIAN AGE
3.0
AVG FAMILY SIZE
2.4
AVG HOUSEHOLD SIZE
2,359
LABOR FORCE [ PEOPLE ]
43.5%
PERCENT IN LABOR FORCE
3.3%
UNEMPLOYMENT RATE
Bland County Area Codes
Income in Bland County
Income Overview in Bland County
Per Capita Income in Bland County is $27,904, while median incomes of families and households are $67,350 and $59,901 respectively.
| Characteristic | Number | Measure |
| Per Capita Income | 6,241 | $27,904 |
| Median Family Income | 1,409 | $67,350 |
| Mean Family Income | 1,409 | $86,783 |
| Median Household Income | 2,235 | $59,901 |
| Mean Household Income | 2,235 | $74,177 |
| Income Deficit | 1,409 | $0 |
| Wage / Income Gap (%) | 6,241 | 10.35% |
| Wage / Income Gap ($) | 6,241 | 89.65¢ per $1 |
| Gini / Inequality Index | 6,241 | 0.38 |
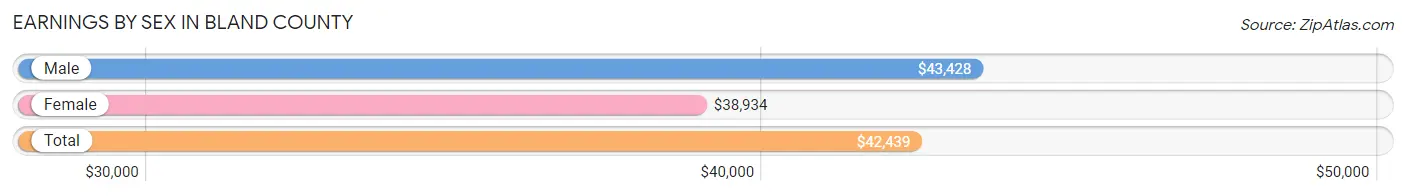
Earnings by Sex in Bland County
Average Earnings in Bland County are $42,439, $43,428 for men and $38,934 for women, a difference of 10.3%.
| Sex | Number | Average Earnings |
| Male | 1,413 (53.7%) | $43,428 |
| Female | 1,219 (46.3%) | $38,934 |
| Total | 2,632 (100.0%) | $42,439 |
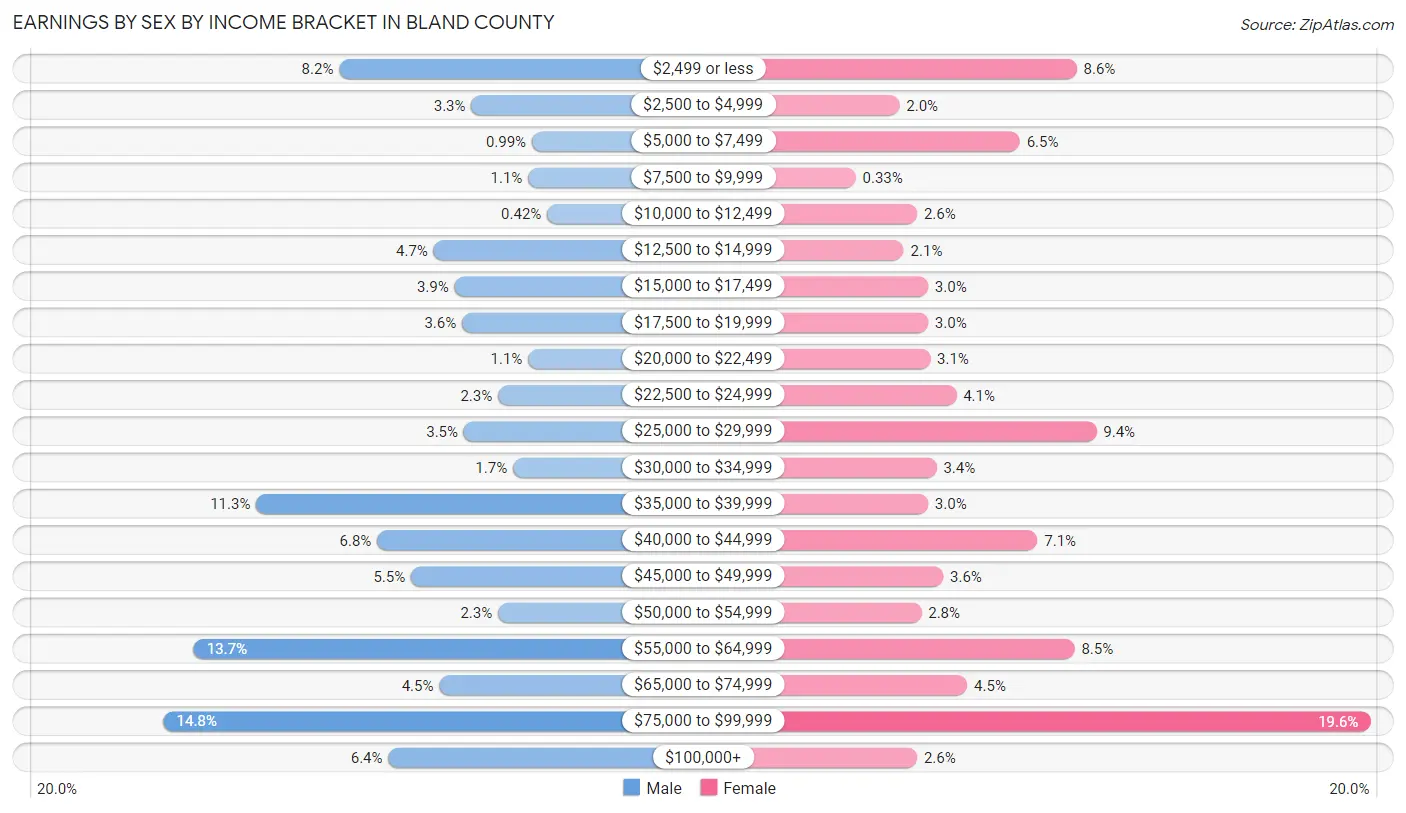
Earnings by Sex by Income Bracket in Bland County
The most common earnings brackets in Bland County are $75,000 to $99,999 for men (209 | 14.8%) and $75,000 to $99,999 for women (239 | 19.6%).
| Income | Male | Female |
| $2,499 or less | 116 (8.2%) | 105 (8.6%) |
| $2,500 to $4,999 | 46 (3.3%) | 24 (2.0%) |
| $5,000 to $7,499 | 14 (1.0%) | 79 (6.5%) |
| $7,500 to $9,999 | 16 (1.1%) | 4 (0.3%) |
| $10,000 to $12,499 | 6 (0.4%) | 32 (2.6%) |
| $12,500 to $14,999 | 66 (4.7%) | 26 (2.1%) |
| $15,000 to $17,499 | 55 (3.9%) | 37 (3.0%) |
| $17,500 to $19,999 | 51 (3.6%) | 37 (3.0%) |
| $20,000 to $22,499 | 16 (1.1%) | 38 (3.1%) |
| $22,500 to $24,999 | 32 (2.3%) | 50 (4.1%) |
| $25,000 to $29,999 | 50 (3.5%) | 114 (9.3%) |
| $30,000 to $34,999 | 24 (1.7%) | 41 (3.4%) |
| $35,000 to $39,999 | 160 (11.3%) | 37 (3.0%) |
| $40,000 to $44,999 | 96 (6.8%) | 87 (7.1%) |
| $45,000 to $49,999 | 78 (5.5%) | 44 (3.6%) |
| $50,000 to $54,999 | 32 (2.3%) | 34 (2.8%) |
| $55,000 to $64,999 | 193 (13.7%) | 104 (8.5%) |
| $65,000 to $74,999 | 63 (4.5%) | 55 (4.5%) |
| $75,000 to $99,999 | 209 (14.8%) | 239 (19.6%) |
| $100,000+ | 90 (6.4%) | 32 (2.6%) |
| Total | 1,413 (100.0%) | 1,219 (100.0%) |
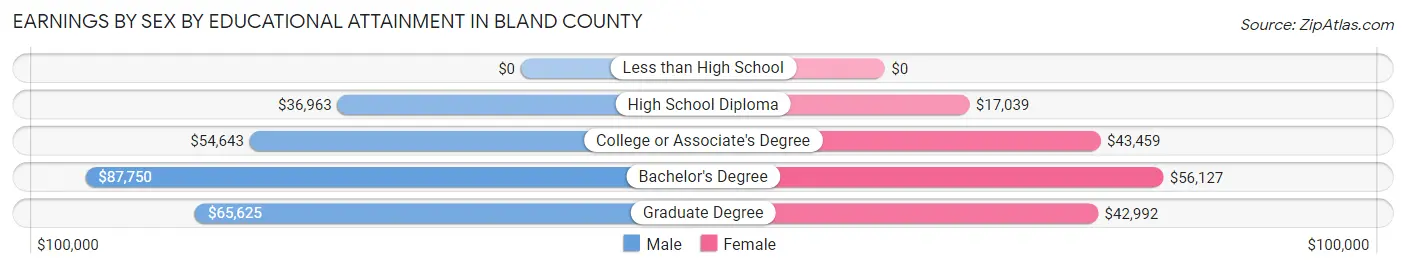
Earnings by Sex by Educational Attainment in Bland County
Average earnings in Bland County are $47,097 for men and $42,961 for women, a difference of 8.8%. Men with an educational attainment of bachelor's degree enjoy the highest average annual earnings of $87,750, while those with high school diploma education earn the least with $36,963. Women with an educational attainment of bachelor's degree earn the most with the average annual earnings of $56,127, while those with high school diploma education have the smallest earnings of $17,039.
| Educational Attainment | Male Income | Female Income |
| Less than High School | - | - |
| High School Diploma | $36,963 | $17,039 |
| College or Associate's Degree | $54,643 | $43,459 |
| Bachelor's Degree | $87,750 | $56,127 |
| Graduate Degree | $65,625 | $42,992 |
| Total | $47,097 | $42,961 |
Family Income in Bland County
Family Income Brackets in Bland County
According to the Bland County family income data, there are 358 families falling into the $50,000 to $74,999 income range, which is the most common income bracket and makes up 25.4% of all families. Conversely, the less than $10,000 income bracket is the least frequent group with only 13 families (0.9%) belonging to this category.
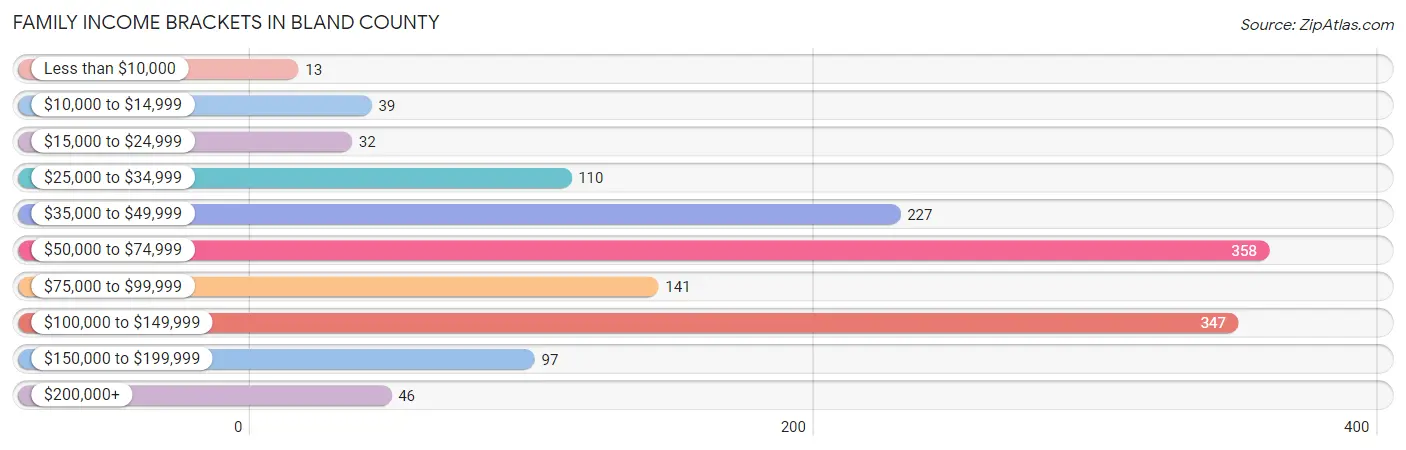
| Income Bracket | # Families | % Families |
| Less than $10,000 | 13 | 0.9% |
| $10,000 to $14,999 | 39 | 2.8% |
| $15,000 to $24,999 | 32 | 2.3% |
| $25,000 to $34,999 | 110 | 7.8% |
| $35,000 to $49,999 | 227 | 16.1% |
| $50,000 to $74,999 | 358 | 25.4% |
| $75,000 to $99,999 | 141 | 10.0% |
| $100,000 to $149,999 | 347 | 24.6% |
| $150,000 to $199,999 | 97 | 6.9% |
| $200,000+ | 46 | 3.3% |
Family Income by Famaliy Size in Bland County
4-person families (191 | 13.6%) account for the highest median family income in Bland County with $122,689 per family, while 4-person families (191 | 13.6%) have the highest median income of $30,672 per family member.
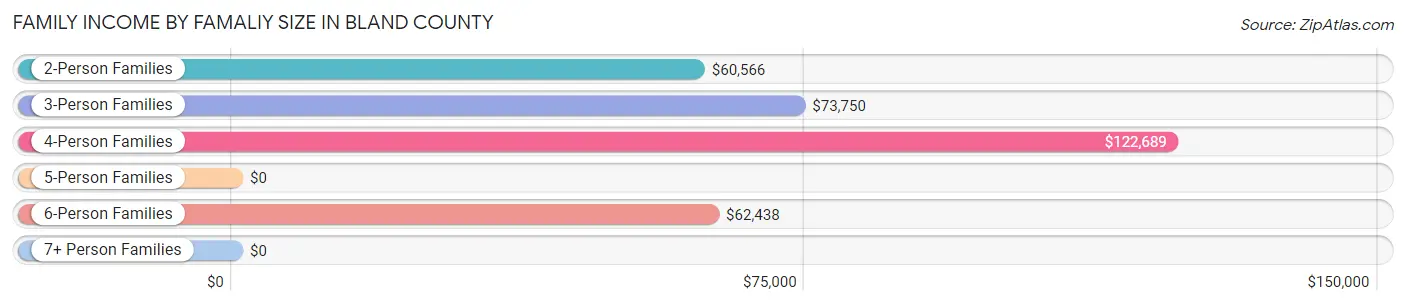
| Income Bracket | # Families | Median Income |
| 2-Person Families | 890 (63.2%) | $60,566 |
| 3-Person Families | 247 (17.5%) | $73,750 |
| 4-Person Families | 191 (13.6%) | $122,689 |
| 5-Person Families | 42 (3.0%) | $0 |
| 6-Person Families | 39 (2.8%) | $62,438 |
| 7+ Person Families | 0 (0.0%) | $0 |
| Total | 1,409 (100.0%) | $67,350 |
Family Income by Number of Earners in Bland County
The median family income in Bland County is $67,350, with families comprising 3+ earners (82) having the highest median family income of $154,107, while families with no earners (319) have the lowest median family income of $56,250, accounting for 5.8% and 22.6% of families, respectively.
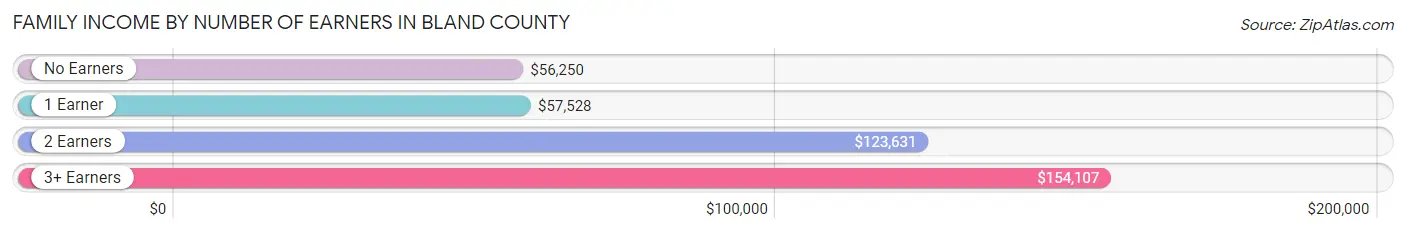
| Number of Earners | # Families | Median Income |
| No Earners | 319 (22.6%) | $56,250 |
| 1 Earner | 504 (35.8%) | $57,528 |
| 2 Earners | 504 (35.8%) | $123,631 |
| 3+ Earners | 82 (5.8%) | $154,107 |
| Total | 1,409 (100.0%) | $67,350 |
Household Income in Bland County
Household Income Brackets in Bland County
With 532 households falling in the category, the $50,000 to $74,999 income range is the most frequent in Bland County, accounting for 23.8% of all households. In contrast, only 47 households (2.1%) fall into the $200,000+ income bracket, making it the least populous group.
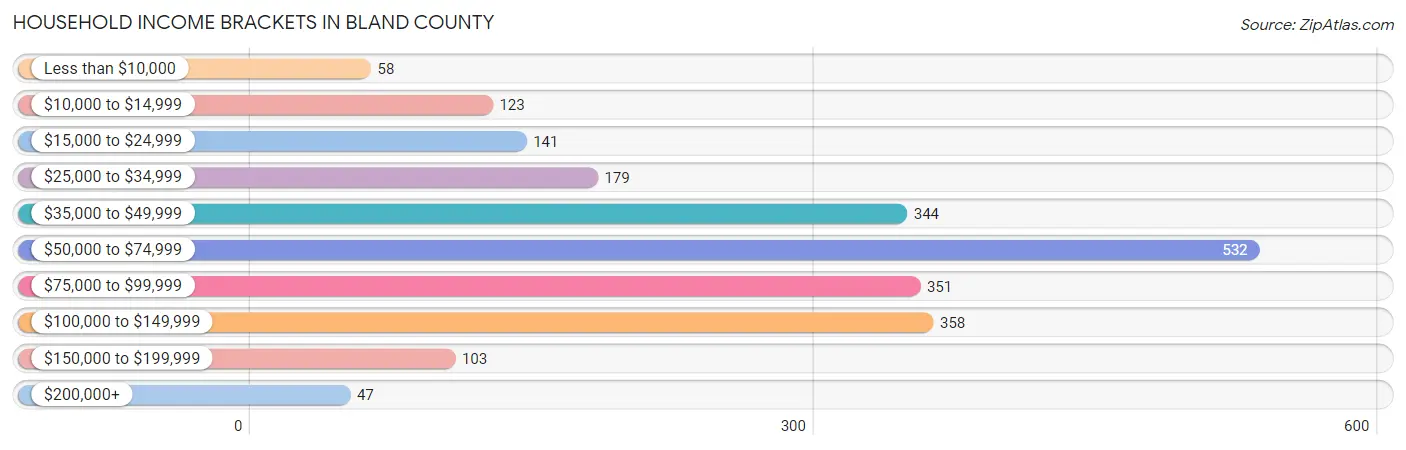
| Income Bracket | # Households | % Households |
| Less than $10,000 | 58 | 2.6% |
| $10,000 to $14,999 | 123 | 5.5% |
| $15,000 to $24,999 | 141 | 6.3% |
| $25,000 to $34,999 | 179 | 8.0% |
| $35,000 to $49,999 | 344 | 15.4% |
| $50,000 to $74,999 | 532 | 23.8% |
| $75,000 to $99,999 | 351 | 15.7% |
| $100,000 to $149,999 | 358 | 16.0% |
| $150,000 to $199,999 | 103 | 4.6% |
| $200,000+ | 47 | 2.1% |
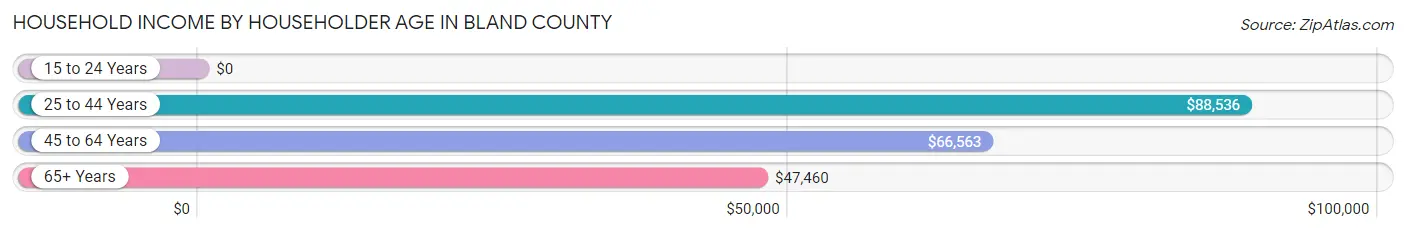
Household Income by Householder Age in Bland County
The median household income in Bland County is $59,901, with the highest median household income of $88,536 found in the 25 to 44 years age bracket for the primary householder. A total of 627 households (28.1%) fall into this category.
| Income Bracket | # Households | Median Income |
| 15 to 24 Years | 0 (0.0%) | $0 |
| 25 to 44 Years | 627 (28.1%) | $88,536 |
| 45 to 64 Years | 680 (30.4%) | $66,563 |
| 65+ Years | 928 (41.5%) | $47,460 |
| Total | 2,235 (100.0%) | $59,901 |
Poverty in Bland County
Income Below Poverty by Sex and Age in Bland County
With 9.9% poverty level for males and 11.6% for females among the residents of Bland County, 15 year old males and 18 to 24 year old females are the most vulnerable to poverty, with 13 males (100.0%) and 57 females (44.2%) in their respective age groups living below the poverty level.
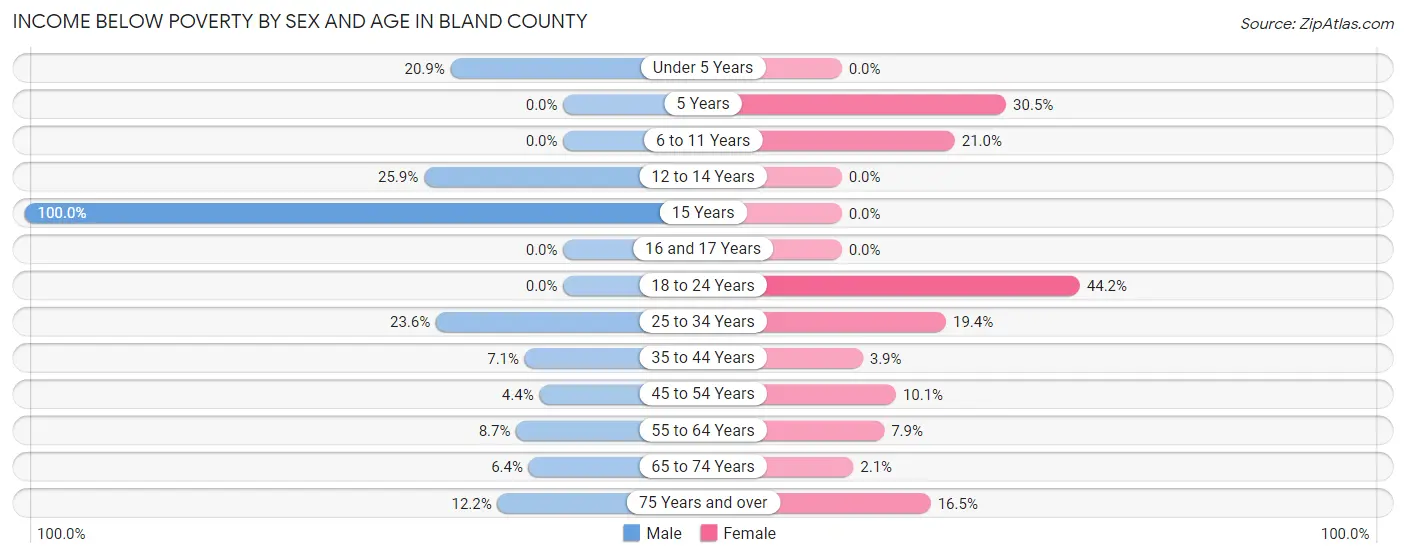
| Age Bracket | Male | Female |
| Under 5 Years | 40 (20.9%) | 0 (0.0%) |
| 5 Years | 0 (0.0%) | 18 (30.5%) |
| 6 to 11 Years | 0 (0.0%) | 30 (21.0%) |
| 12 to 14 Years | 15 (25.9%) | 0 (0.0%) |
| 15 Years | 13 (100.0%) | 0 (0.0%) |
| 16 and 17 Years | 0 (0.0%) | 0 (0.0%) |
| 18 to 24 Years | 0 (0.0%) | 57 (44.2%) |
| 25 to 34 Years | 69 (23.6%) | 65 (19.4%) |
| 35 to 44 Years | 17 (7.1%) | 15 (3.9%) |
| 45 to 54 Years | 19 (4.4%) | 22 (10.1%) |
| 55 to 64 Years | 31 (8.7%) | 35 (7.9%) |
| 65 to 74 Years | 23 (6.4%) | 9 (2.1%) |
| 75 Years and over | 33 (12.2%) | 53 (16.5%) |
| Total | 260 (9.9%) | 304 (11.6%) |
Income Above Poverty by Sex and Age in Bland County
According to the poverty statistics in Bland County, males aged 5 years and females aged under 5 years are the age groups that are most secure financially, with 100.0% of males and 100.0% of females in these age groups living above the poverty line.
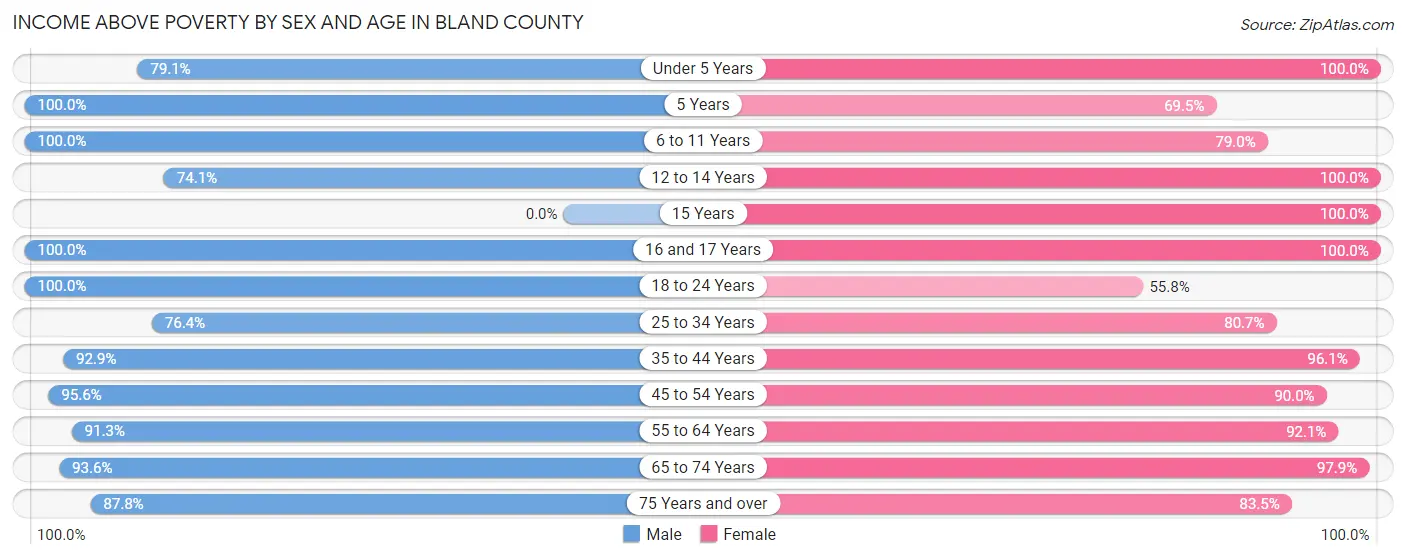
| Age Bracket | Male | Female |
| Under 5 Years | 151 (79.1%) | 26 (100.0%) |
| 5 Years | 81 (100.0%) | 41 (69.5%) |
| 6 to 11 Years | 115 (100.0%) | 113 (79.0%) |
| 12 to 14 Years | 43 (74.1%) | 50 (100.0%) |
| 15 Years | 0 (0.0%) | 30 (100.0%) |
| 16 and 17 Years | 69 (100.0%) | 63 (100.0%) |
| 18 to 24 Years | 152 (100.0%) | 72 (55.8%) |
| 25 to 34 Years | 223 (76.4%) | 271 (80.6%) |
| 35 to 44 Years | 221 (92.9%) | 370 (96.1%) |
| 45 to 54 Years | 410 (95.6%) | 197 (89.9%) |
| 55 to 64 Years | 324 (91.3%) | 410 (92.1%) |
| 65 to 74 Years | 335 (93.6%) | 411 (97.9%) |
| 75 Years and over | 237 (87.8%) | 268 (83.5%) |
| Total | 2,361 (90.1%) | 2,322 (88.4%) |
Income Below Poverty Among Married-Couple Families in Bland County
The poverty statistics for married-couple families in Bland County show that 3.9% or 43 of the total 1,106 families live below the poverty line. Families with 3 or 4 children have the highest poverty rate of 29.8%, comprising of 14 families. On the other hand, families with no children have the lowest poverty rate of 1.0%, which includes 8 families.
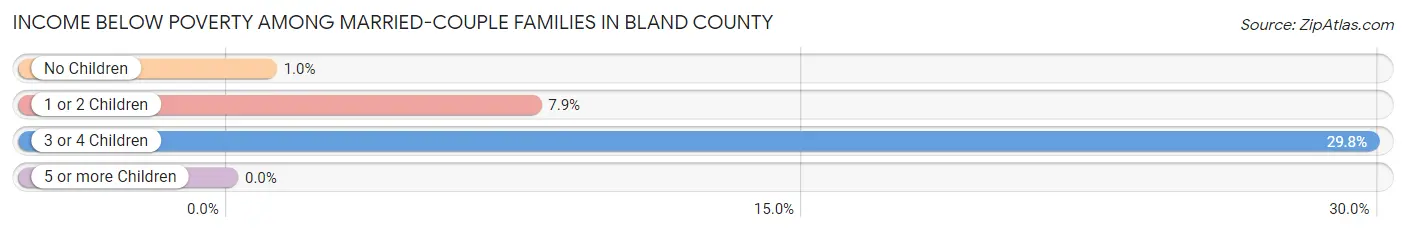
| Children | Above Poverty | Below Poverty |
| No Children | 786 (99.0%) | 8 (1.0%) |
| 1 or 2 Children | 244 (92.1%) | 21 (7.9%) |
| 3 or 4 Children | 33 (70.2%) | 14 (29.8%) |
| 5 or more Children | 0 (0.0%) | 0 (0.0%) |
| Total | 1,063 (96.1%) | 43 (3.9%) |
Income Below Poverty Among Single-Parent Households in Bland County
According to the poverty data in Bland County, 6.6% or 12 single-father households and 18.0% or 22 single-mother households are living below the poverty line. Among single-father households, those with no children have the highest poverty rate, with 12 households (8.0%) experiencing poverty. Likewise, among single-mother households, those with no children have the highest poverty rate, with 22 households (32.8%) falling below the poverty line.
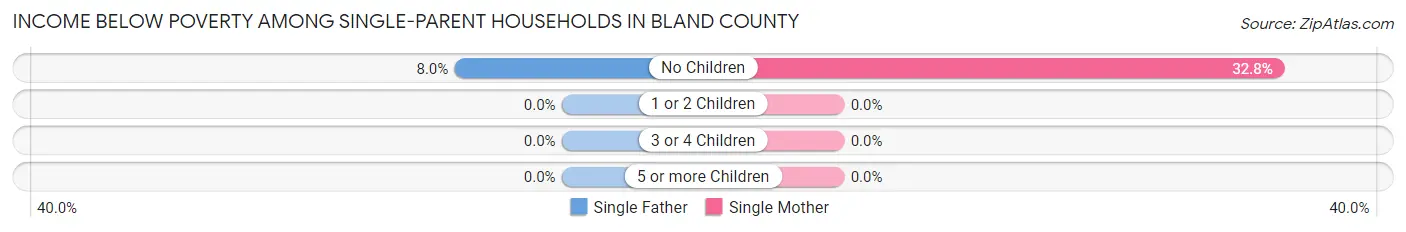
| Children | Single Father | Single Mother |
| No Children | 12 (8.0%) | 22 (32.8%) |
| 1 or 2 Children | 0 (0.0%) | 0 (0.0%) |
| 3 or 4 Children | 0 (0.0%) | 0 (0.0%) |
| 5 or more Children | 0 (0.0%) | 0 (0.0%) |
| Total | 12 (6.6%) | 22 (18.0%) |
Income Below Poverty Among Married-Couple vs Single-Parent Households in Bland County
The poverty data for Bland County shows that 43 of the married-couple family households (3.9%) and 34 of the single-parent households (11.2%) are living below the poverty level. Within the married-couple family households, those with 3 or 4 children have the highest poverty rate, with 14 households (29.8%) falling below the poverty line. Among the single-parent households, those with no children have the highest poverty rate, with 34 household (15.7%) living below poverty.
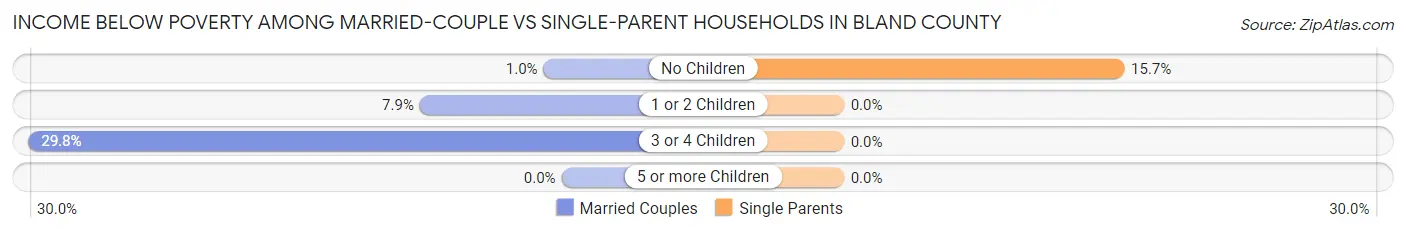
| Children | Married-Couple Families | Single-Parent Households |
| No Children | 8 (1.0%) | 34 (15.7%) |
| 1 or 2 Children | 21 (7.9%) | 0 (0.0%) |
| 3 or 4 Children | 14 (29.8%) | 0 (0.0%) |
| 5 or more Children | 0 (0.0%) | 0 (0.0%) |
| Total | 43 (3.9%) | 34 (11.2%) |
Race in Bland County
The most populous races in Bland County are White / Caucasian (5,831 | 93.4%), Black / African American (251 | 4.0%), and Two or more Races (114 | 1.8%).
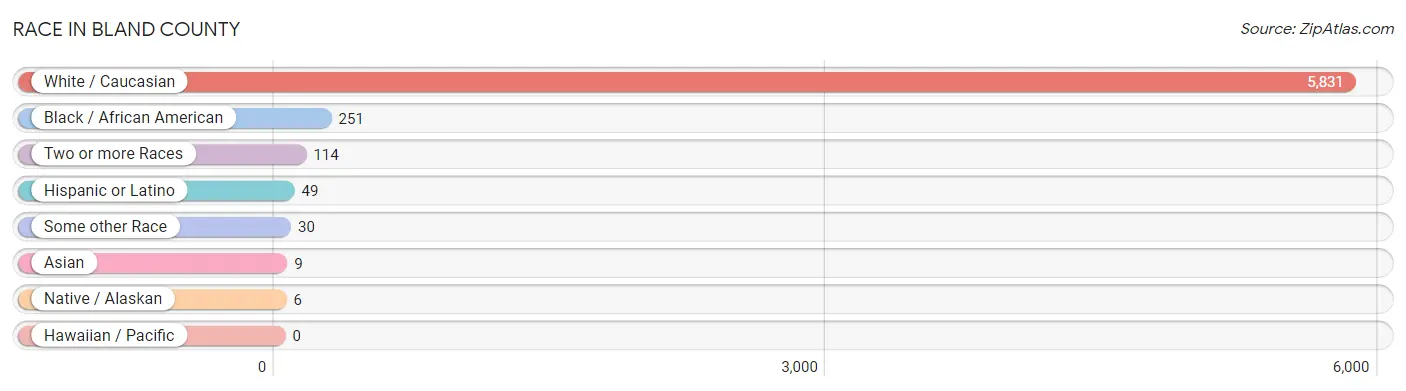
| Race | # Population | % Population |
| Asian | 9 | 0.1% |
| Black / African American | 251 | 4.0% |
| Hawaiian / Pacific | 0 | 0.0% |
| Hispanic or Latino | 49 | 0.8% |
| Native / Alaskan | 6 | 0.1% |
| White / Caucasian | 5,831 | 93.4% |
| Two or more Races | 114 | 1.8% |
| Some other Race | 30 | 0.5% |
| Total | 6,241 | 100.0% |
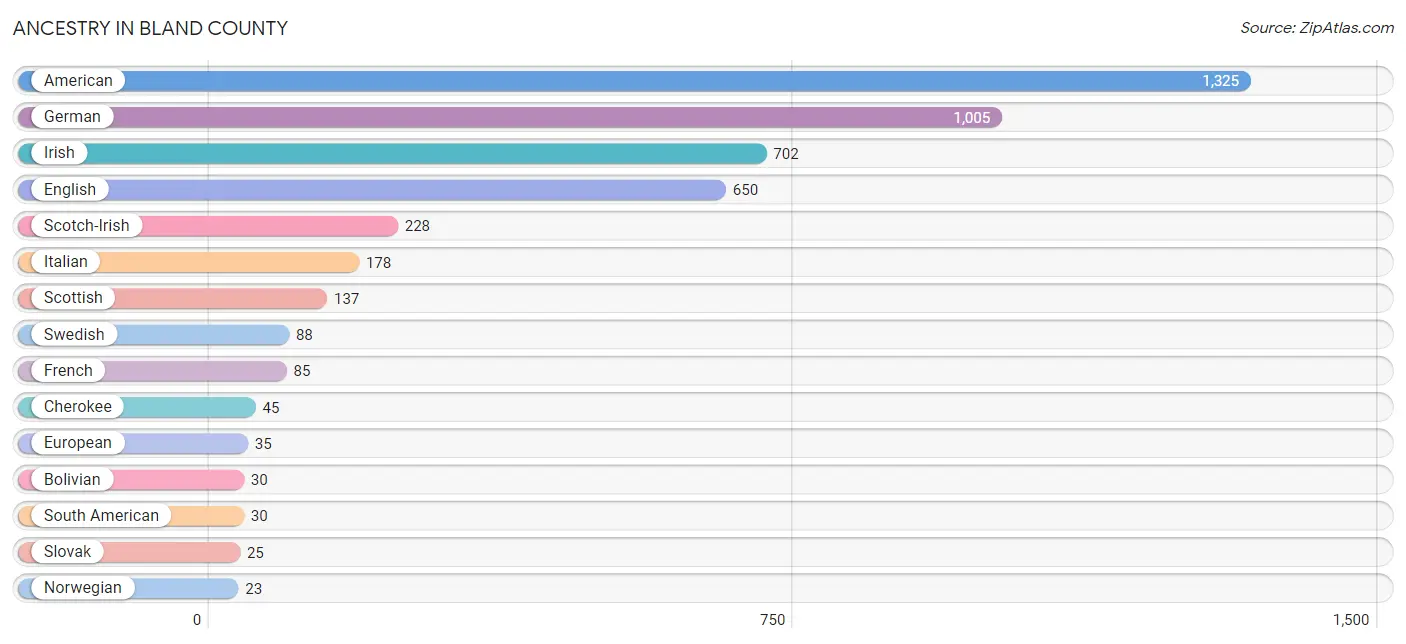
Ancestry in Bland County
The most populous ancestries reported in Bland County are American (1,325 | 21.2%), German (1,005 | 16.1%), Irish (702 | 11.3%), English (650 | 10.4%), and Scotch-Irish (228 | 3.6%), together accounting for 62.6% of all Bland County residents.
| Ancestry | # Population | % Population |
| American | 1,325 | 21.2% |
| Austrian | 9 | 0.1% |
| Bhutanese | 8 | 0.1% |
| Bolivian | 30 | 0.5% |
| British | 14 | 0.2% |
| Central American | 5 | 0.1% |
| Cherokee | 45 | 0.7% |
| Creek | 8 | 0.1% |
| Czech | 4 | 0.1% |
| Dutch | 10 | 0.2% |
| English | 650 | 10.4% |
| European | 35 | 0.6% |
| French | 85 | 1.4% |
| German | 1,005 | 16.1% |
| Irish | 702 | 11.3% |
| Italian | 178 | 2.9% |
| Laotian | 9 | 0.1% |
| Mexican | 2 | 0.0% |
| Norwegian | 23 | 0.4% |
| Panamanian | 5 | 0.1% |
| Polish | 17 | 0.3% |
| Scotch-Irish | 228 | 3.6% |
| Scottish | 137 | 2.2% |
| Slovak | 25 | 0.4% |
| South American | 30 | 0.5% |
| Spaniard | 12 | 0.2% |
| Swedish | 88 | 1.4% |
| Swiss | 6 | 0.1% |
| Thai | 17 | 0.3% |
| Welsh | 19 | 0.3% | View All 30 Rows |
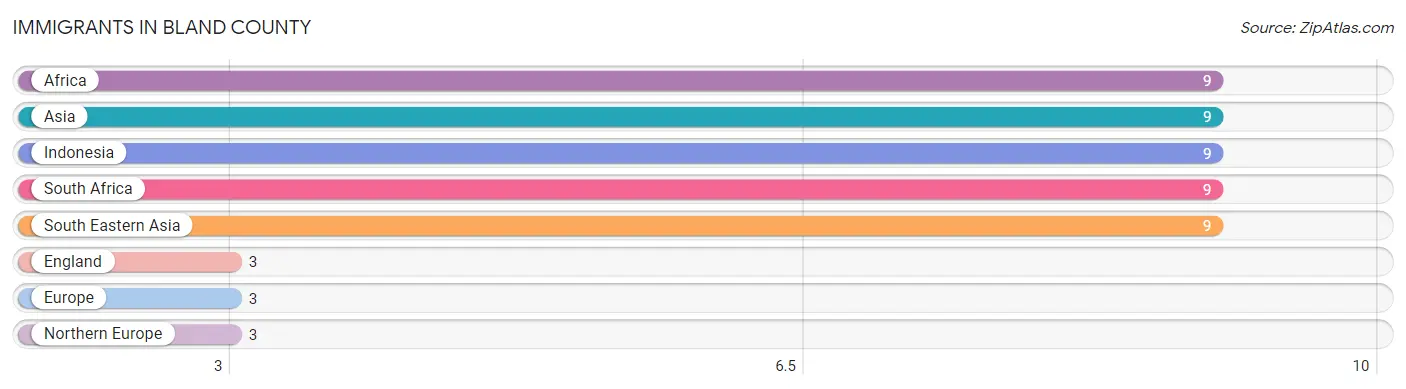
Immigrants in Bland County
The most numerous immigrant groups reported in Bland County came from Africa (9 | 0.1%), Asia (9 | 0.1%), Indonesia (9 | 0.1%), South Africa (9 | 0.1%), and South Eastern Asia (9 | 0.1%), together accounting for 0.7% of all Bland County residents.
| Immigration Origin | # Population | % Population |
| Africa | 9 | 0.1% |
| Asia | 9 | 0.1% |
| England | 3 | 0.1% |
| Europe | 3 | 0.1% |
| Indonesia | 9 | 0.1% |
| Northern Europe | 3 | 0.1% |
| South Africa | 9 | 0.1% |
| South Eastern Asia | 9 | 0.1% | View All 8 Rows |
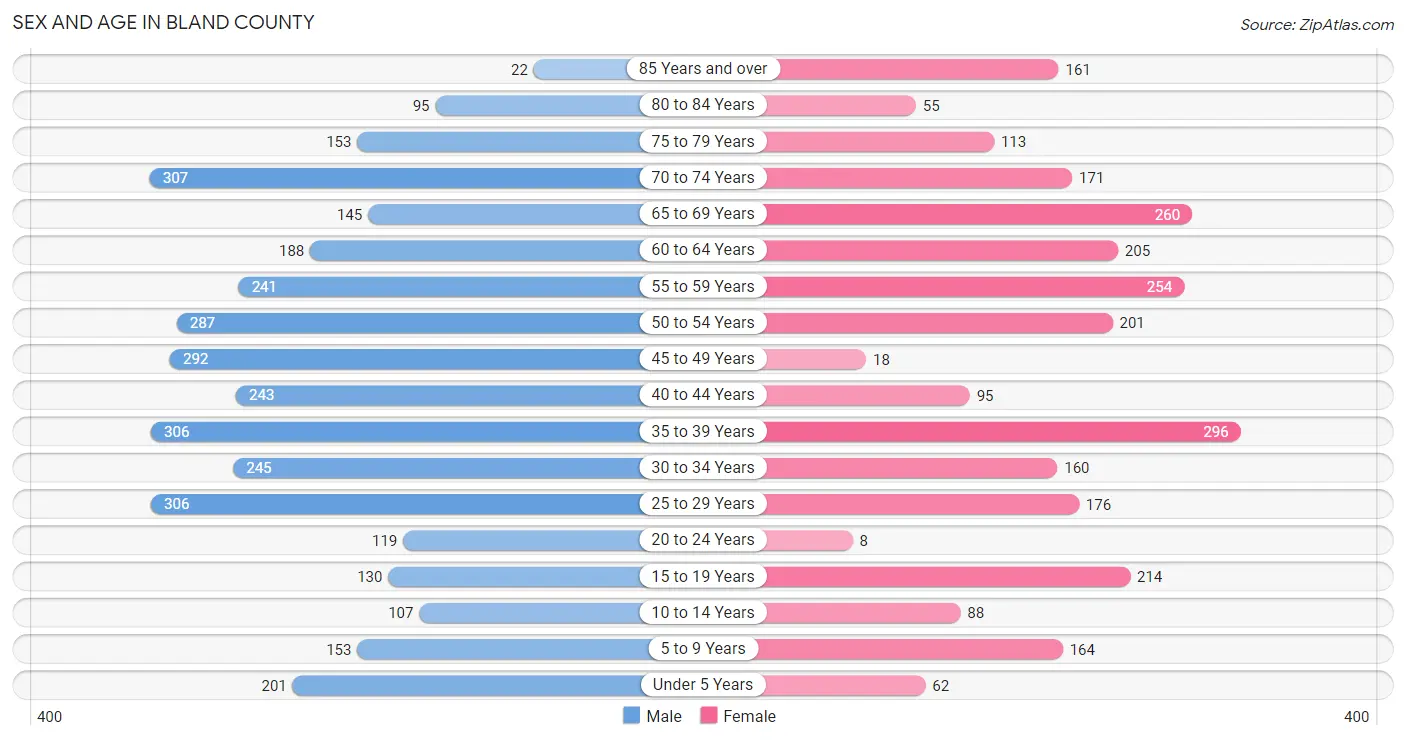
Sex and Age in Bland County
Sex and Age in Bland County
The most populous age groups in Bland County are 70 to 74 Years (307 | 8.7%) for men and 35 to 39 Years (296 | 11.0%) for women.
| Age Bracket | Male | Female |
| Under 5 Years | 201 (5.7%) | 62 (2.3%) |
| 5 to 9 Years | 153 (4.3%) | 164 (6.1%) |
| 10 to 14 Years | 107 (3.0%) | 88 (3.3%) |
| 15 to 19 Years | 130 (3.7%) | 214 (7.9%) |
| 20 to 24 Years | 119 (3.4%) | 8 (0.3%) |
| 25 to 29 Years | 306 (8.6%) | 176 (6.5%) |
| 30 to 34 Years | 245 (6.9%) | 160 (5.9%) |
| 35 to 39 Years | 306 (8.6%) | 296 (11.0%) |
| 40 to 44 Years | 243 (6.9%) | 95 (3.5%) |
| 45 to 49 Years | 292 (8.3%) | 18 (0.7%) |
| 50 to 54 Years | 287 (8.1%) | 201 (7.4%) |
| 55 to 59 Years | 241 (6.8%) | 254 (9.4%) |
| 60 to 64 Years | 188 (5.3%) | 205 (7.6%) |
| 65 to 69 Years | 145 (4.1%) | 260 (9.6%) |
| 70 to 74 Years | 307 (8.7%) | 171 (6.3%) |
| 75 to 79 Years | 153 (4.3%) | 113 (4.2%) |
| 80 to 84 Years | 95 (2.7%) | 55 (2.0%) |
| 85 Years and over | 22 (0.6%) | 161 (6.0%) |
| Total | 3,540 (100.0%) | 2,701 (100.0%) |
Families and Households in Bland County
Median Family Size in Bland County
The median family size in Bland County is 2.99 persons per family, with single female/mother families (122 | 8.7%) accounting for the largest median family size of 3.72 persons per family. On the other hand, single male/father families (181 | 12.9%) represent the smallest median family size with 2.59 persons per family.
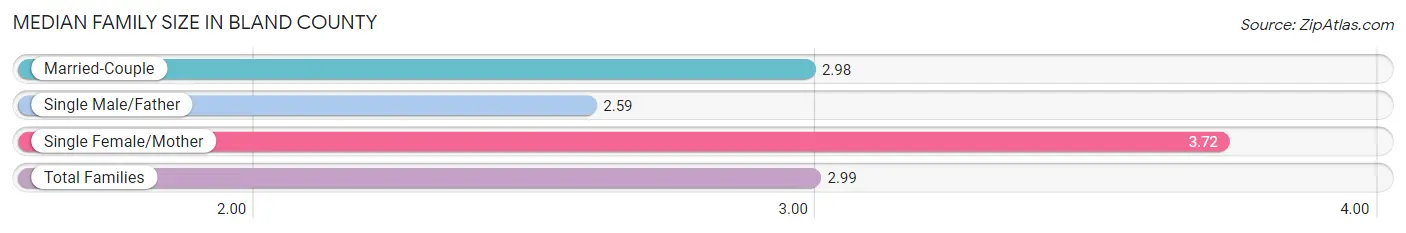
| Family Type | # Families | Family Size |
| Married-Couple | 1,106 (78.5%) | 2.98 |
| Single Male/Father | 181 (12.9%) | 2.59 |
| Single Female/Mother | 122 (8.7%) | 3.72 |
| Total Families | 1,409 (100.0%) | 2.99 |
Median Household Size in Bland County
The median household size in Bland County is 2.37 persons per household, with single female/mother households (122 | 5.5%) accounting for the largest median household size of 4.52 persons per household. non-family households (826 | 37.0%) represent the smallest median household size with 1.07 persons per household.
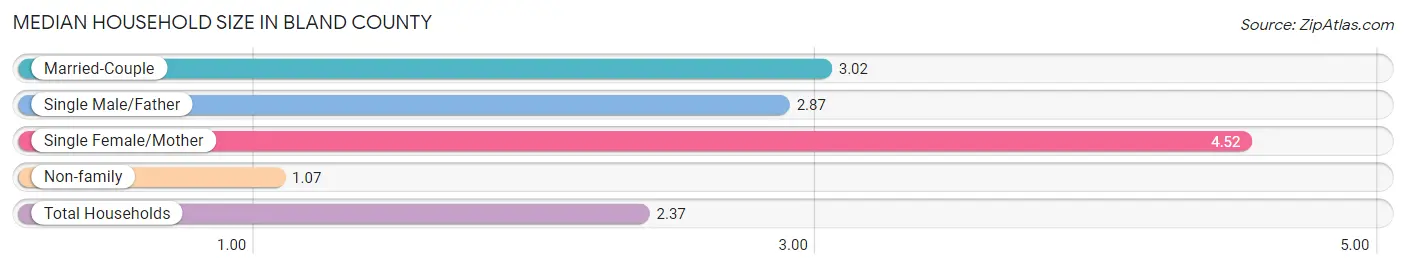
| Household Type | # Households | Household Size |
| Married-Couple | 1,106 (49.5%) | 3.02 |
| Single Male/Father | 181 (8.1%) | 2.87 |
| Single Female/Mother | 122 (5.5%) | 4.52 |
| Non-family | 826 (37.0%) | 1.07 |
| Total Households | 2,235 (100.0%) | 2.37 |
Household Size by Marriage Status in Bland County
Out of a total of 2,235 households in Bland County, 1,409 (63.0%) are family households, while 826 (37.0%) are nonfamily households. The most numerous type of family households are 2-person households, comprising 834, and the most common type of nonfamily households are 1-person households, comprising 796.
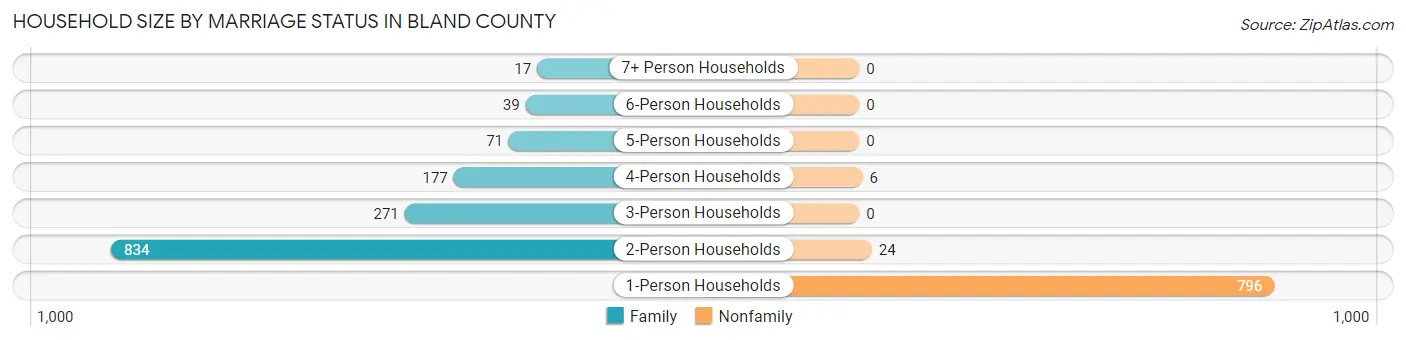
| Household Size | Family Households | Nonfamily Households |
| 1-Person Households | - | 796 (35.6%) |
| 2-Person Households | 834 (37.3%) | 24 (1.1%) |
| 3-Person Households | 271 (12.1%) | 0 (0.0%) |
| 4-Person Households | 177 (7.9%) | 6 (0.3%) |
| 5-Person Households | 71 (3.2%) | 0 (0.0%) |
| 6-Person Households | 39 (1.7%) | 0 (0.0%) |
| 7+ Person Households | 17 (0.8%) | 0 (0.0%) |
| Total | 1,409 (63.0%) | 826 (37.0%) |
Female Fertility in Bland County
Fertility by Age in Bland County
Average fertility rate in Bland County is 40.0 births per 1,000 women. Women in the age bracket of 20 to 34 years have the highest fertility rate with 113.0 births per 1,000 women. Women in the age bracket of 20 to 34 years acount for 100.0% of all women with births.
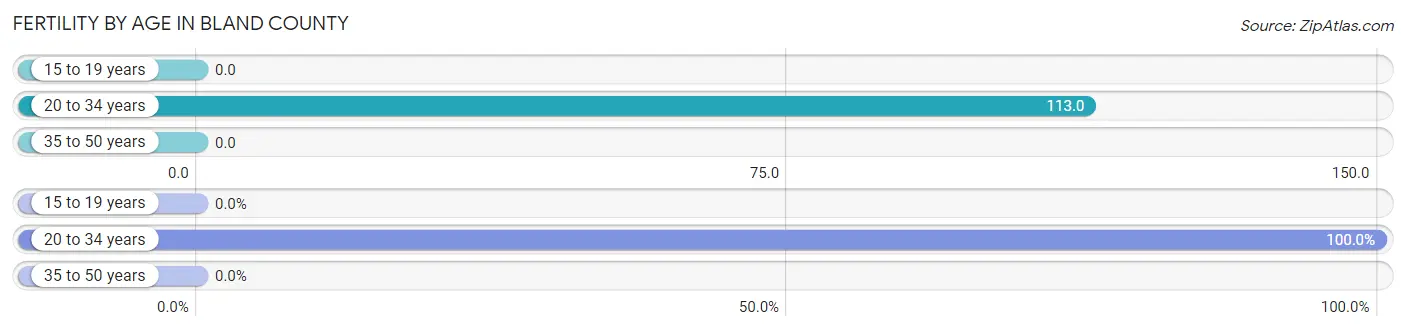
| Age Bracket | Women with Births | Births / 1,000 Women |
| 15 to 19 years | 0 (0.0%) | 0.0 |
| 20 to 34 years | 39 (100.0%) | 113.0 |
| 35 to 50 years | 0 (0.0%) | 0.0 |
| Total | 39 (100.0%) | 40.0 |
Fertility by Age by Marriage Status in Bland County
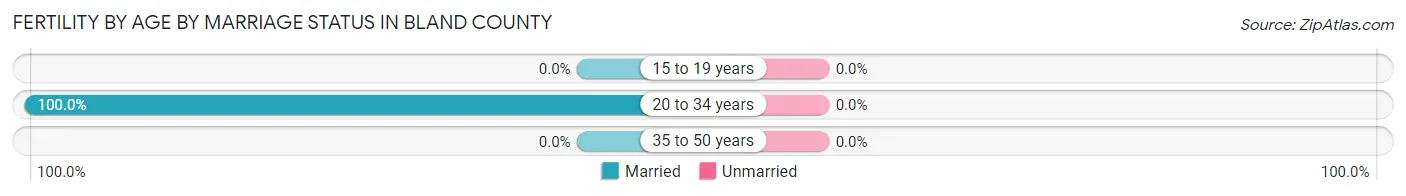
| Age Bracket | Married | Unmarried |
| 15 to 19 years | 0 (0.0%) | 0 (0.0%) |
| 20 to 34 years | 39 (100.0%) | 0 (0.0%) |
| 35 to 50 years | 0 (0.0%) | 0 (0.0%) |
| Total | 39 (100.0%) | 0 (0.0%) |
Fertility by Education in Bland County
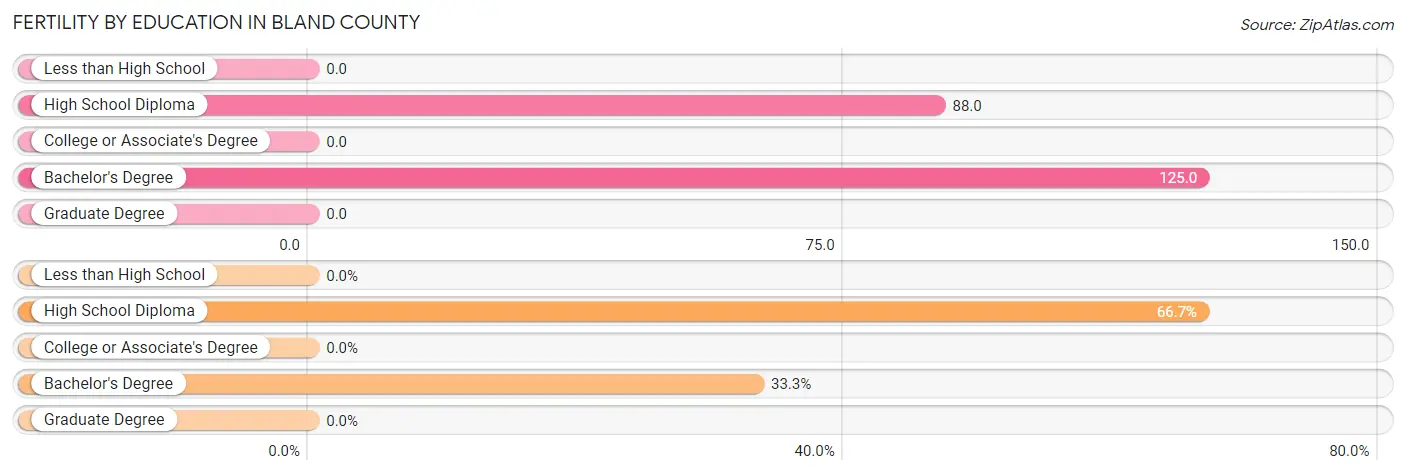
| Educational Attainment | Women with Births | Births / 1,000 Women |
| Less than High School | 0 (0.0%) | 0.0 |
| High School Diploma | 26 (66.7%) | 88.0 |
| College or Associate's Degree | 0 (0.0%) | 0.0 |
| Bachelor's Degree | 13 (33.3%) | 125.0 |
| Graduate Degree | 0 (0.0%) | 0.0 |
| Total | 39 (100.0%) | 40.0 |
Fertility by Education by Marriage Status in Bland County
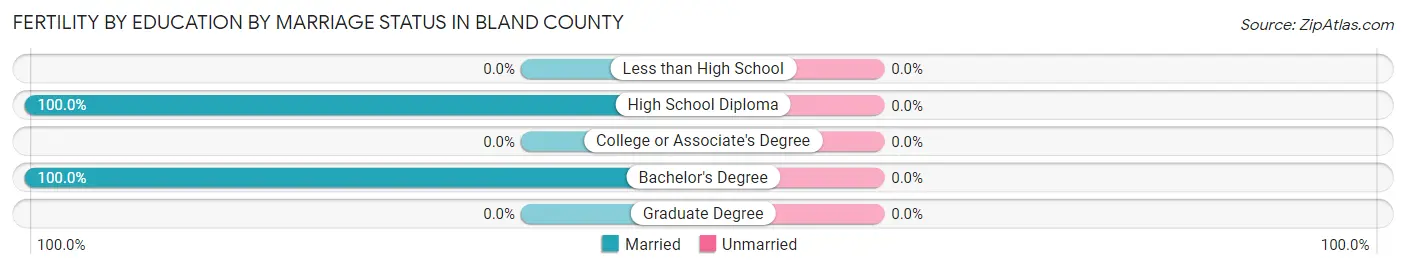
| Educational Attainment | Married | Unmarried |
| Less than High School | 0 (0.0%) | 0 (0.0%) |
| High School Diploma | 26 (100.0%) | 0 (0.0%) |
| College or Associate's Degree | 0 (0.0%) | 0 (0.0%) |
| Bachelor's Degree | 13 (100.0%) | 0 (0.0%) |
| Graduate Degree | 0 (0.0%) | 0 (0.0%) |
| Total | 39 (100.0%) | 0 (0.0%) |
Employment Characteristics in Bland County
Employment by Class of Employer in Bland County
Among the 2,277 employed individuals in Bland County, private company employees (1,611 | 70.8%), self-employed (not incorporated) (187 | 8.2%), and local government employees (181 | 8.0%) make up the most common classes of employment.
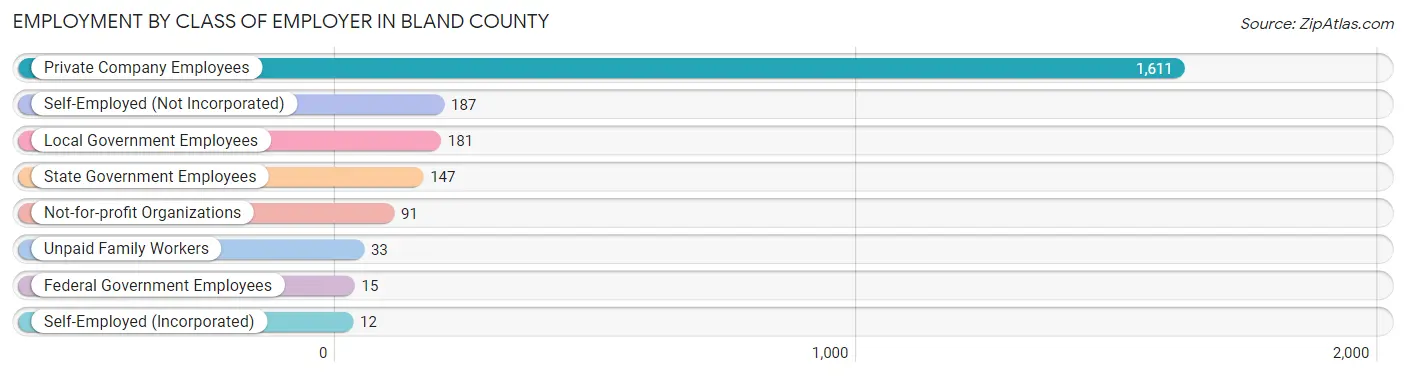
| Employer Class | # Employees | % Employees |
| Private Company Employees | 1,611 | 70.8% |
| Self-Employed (Incorporated) | 12 | 0.5% |
| Self-Employed (Not Incorporated) | 187 | 8.2% |
| Not-for-profit Organizations | 91 | 4.0% |
| Local Government Employees | 181 | 8.0% |
| State Government Employees | 147 | 6.5% |
| Federal Government Employees | 15 | 0.7% |
| Unpaid Family Workers | 33 | 1.5% |
| Total | 2,277 | 100.0% |
Employment Status by Age in Bland County
According to the labor force statistics for Bland County, out of the total population over 16 years of age (5,423), 43.5% or 2,359 individuals are in the labor force, with 3.3% or 78 of them unemployed. The age group with the highest labor force participation rate is 20 to 24 years, with 69.3% or 88 individuals in the labor force. Within the labor force, the 16 to 19 years age range has the highest percentage of unemployed individuals, with 8.9% or 7 of them being unemployed.
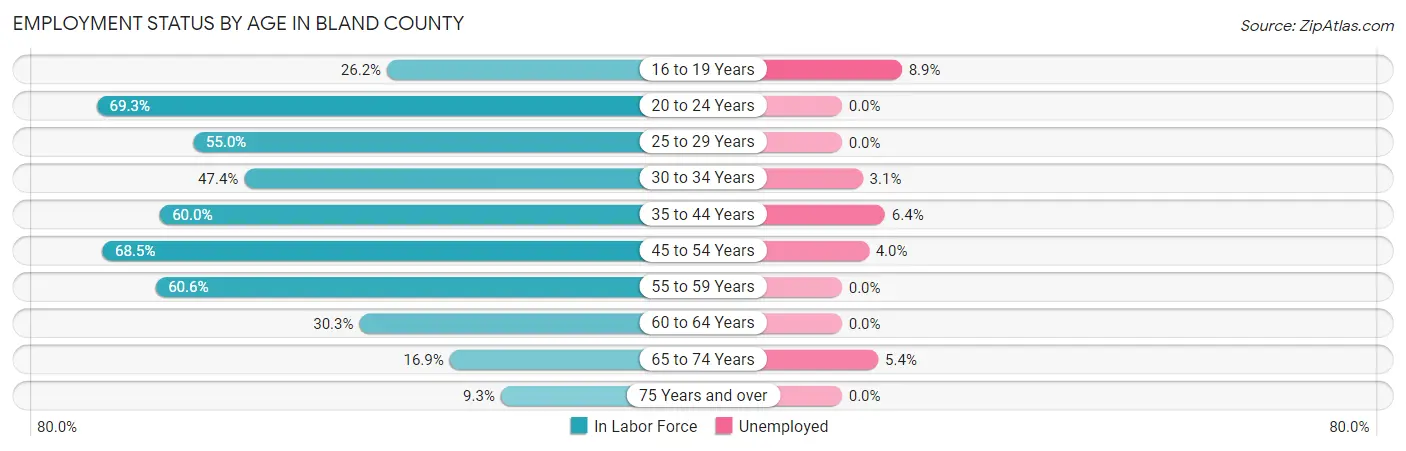
| Age Bracket | In Labor Force | Unemployed |
| 16 to 19 Years | 79 (26.2%) | 7 (8.9%) |
| 20 to 24 Years | 88 (69.3%) | 0 (0.0%) |
| 25 to 29 Years | 265 (55.0%) | 0 (0.0%) |
| 30 to 34 Years | 192 (47.4%) | 6 (3.1%) |
| 35 to 44 Years | 564 (60.0%) | 36 (6.4%) |
| 45 to 54 Years | 547 (68.5%) | 22 (4.0%) |
| 55 to 59 Years | 300 (60.6%) | 0 (0.0%) |
| 60 to 64 Years | 119 (30.3%) | 0 (0.0%) |
| 65 to 74 Years | 149 (16.9%) | 8 (5.4%) |
| 75 Years and over | 56 (9.3%) | 0 (0.0%) |
| Total | 2,359 (43.5%) | 78 (3.3%) |
Employment Status by Educational Attainment in Bland County
According to labor force statistics for Bland County, 56.6% of individuals (1,988) out of the total population between 25 and 64 years of age (3,513) are in the labor force, with 3.2% or 64 of them being unemployed. The group with the highest labor force participation rate are those with the educational attainment of bachelor's degree or higher, with 79.8% or 494 individuals in the labor force. Within the labor force, individuals with less than high school education have the highest percentage of unemployment, with 14.0% or 6 of them being unemployed.
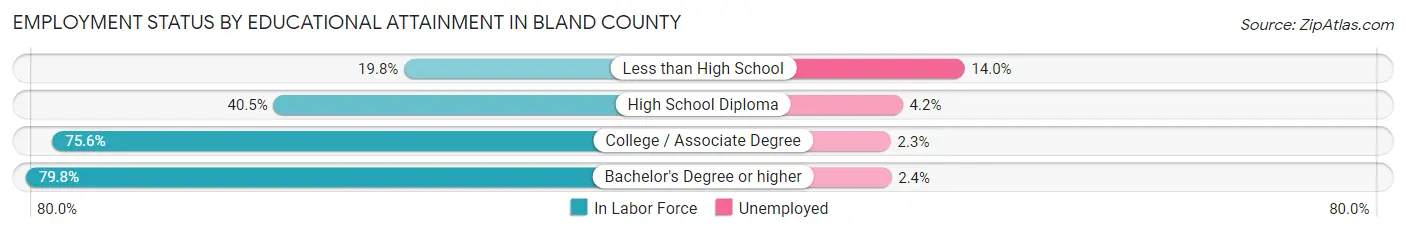
| Educational Attainment | In Labor Force | Unemployed |
| Less than High School | 43 (19.8%) | 30 (14.0%) |
| High School Diploma | 662 (40.5%) | 69 (4.2%) |
| College / Associate Degree | 789 (75.6%) | 24 (2.3%) |
| Bachelor's Degree or higher | 494 (79.8%) | 15 (2.4%) |
| Total | 1,988 (56.6%) | 112 (3.2%) |
Employment Occupations by Sex in Bland County
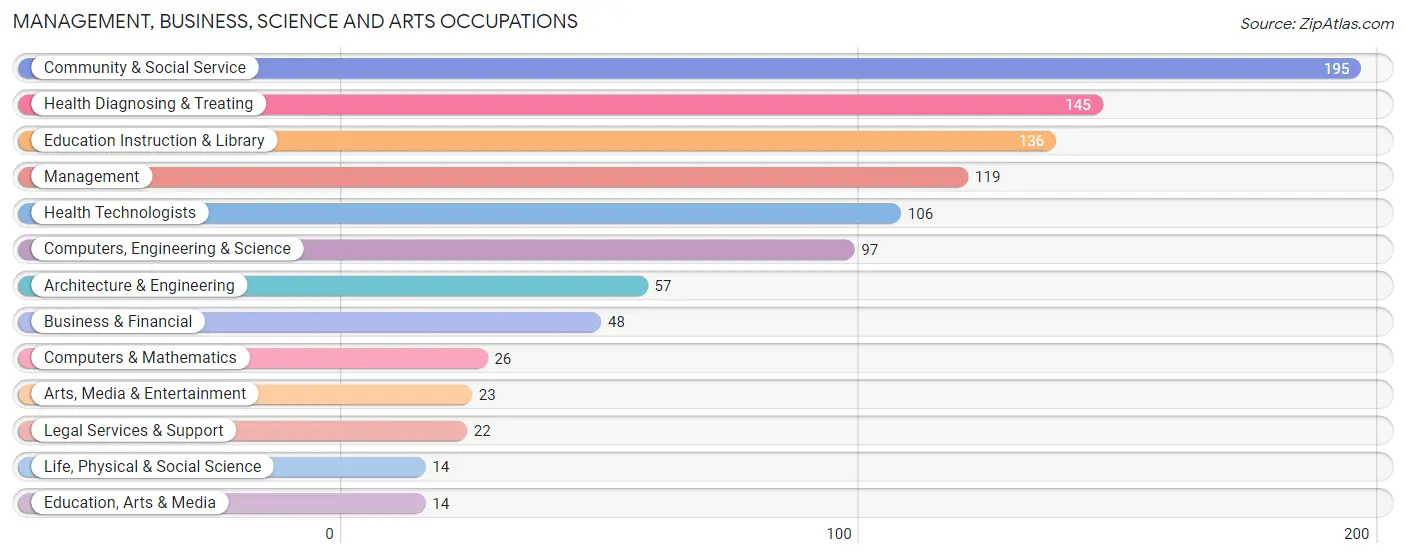
Management, Business, Science and Arts Occupations
The most common Management, Business, Science and Arts occupations in Bland County are Community & Social Service (195 | 8.6%), Health Diagnosing & Treating (145 | 6.4%), Education Instruction & Library (136 | 6.0%), Management (119 | 5.2%), and Health Technologists (106 | 4.6%).
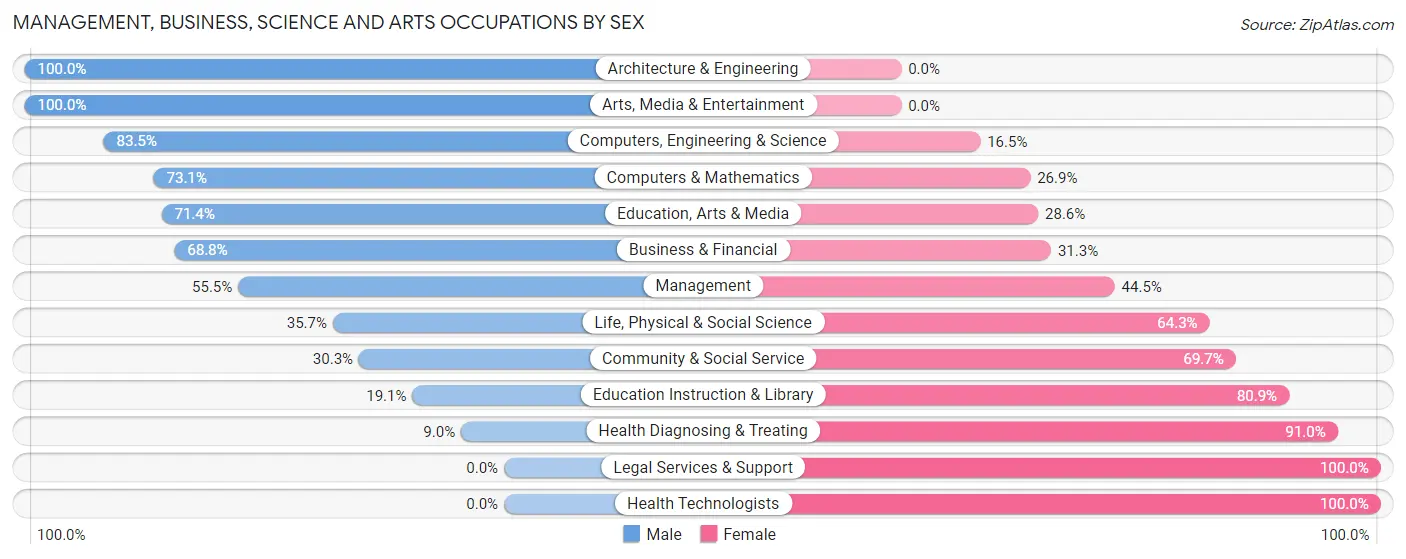
Management, Business, Science and Arts Occupations by Sex
Within the Management, Business, Science and Arts occupations in Bland County, the most male-oriented occupations are Architecture & Engineering (100.0%), Arts, Media & Entertainment (100.0%), and Computers, Engineering & Science (83.5%), while the most female-oriented occupations are Legal Services & Support (100.0%), Health Technologists (100.0%), and Health Diagnosing & Treating (91.0%).
| Occupation | Male | Female |
| Management | 66 (55.5%) | 53 (44.5%) |
| Business & Financial | 33 (68.8%) | 15 (31.2%) |
| Computers, Engineering & Science | 81 (83.5%) | 16 (16.5%) |
| Computers & Mathematics | 19 (73.1%) | 7 (26.9%) |
| Architecture & Engineering | 57 (100.0%) | 0 (0.0%) |
| Life, Physical & Social Science | 5 (35.7%) | 9 (64.3%) |
| Community & Social Service | 59 (30.3%) | 136 (69.7%) |
| Education, Arts & Media | 10 (71.4%) | 4 (28.6%) |
| Legal Services & Support | 0 (0.0%) | 22 (100.0%) |
| Education Instruction & Library | 26 (19.1%) | 110 (80.9%) |
| Arts, Media & Entertainment | 23 (100.0%) | 0 (0.0%) |
| Health Diagnosing & Treating | 13 (9.0%) | 132 (91.0%) |
| Health Technologists | 0 (0.0%) | 106 (100.0%) |
| Total (Category) | 252 (41.7%) | 352 (58.3%) |
| Total (Overall) | 1,238 (54.3%) | 1,042 (45.7%) |
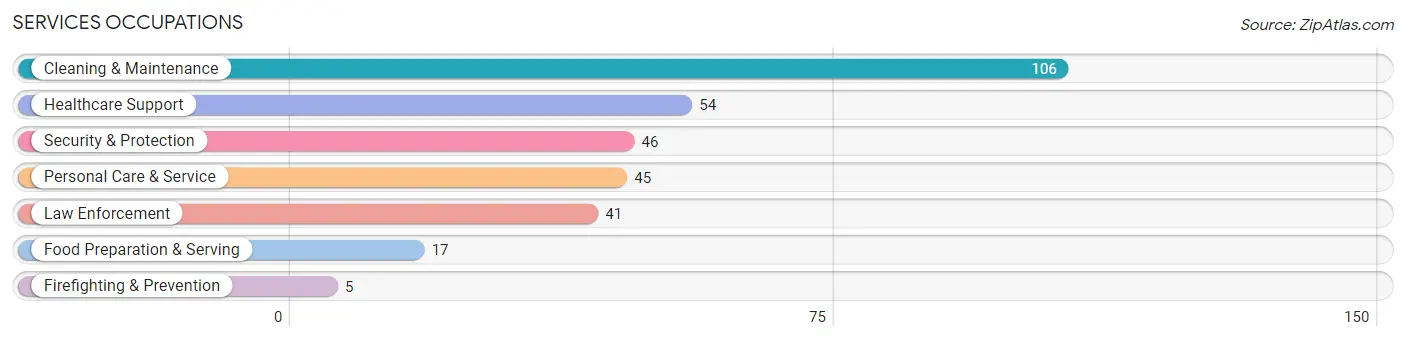
Services Occupations
The most common Services occupations in Bland County are Cleaning & Maintenance (106 | 4.6%), Healthcare Support (54 | 2.4%), Security & Protection (46 | 2.0%), Personal Care & Service (45 | 2.0%), and Law Enforcement (41 | 1.8%).
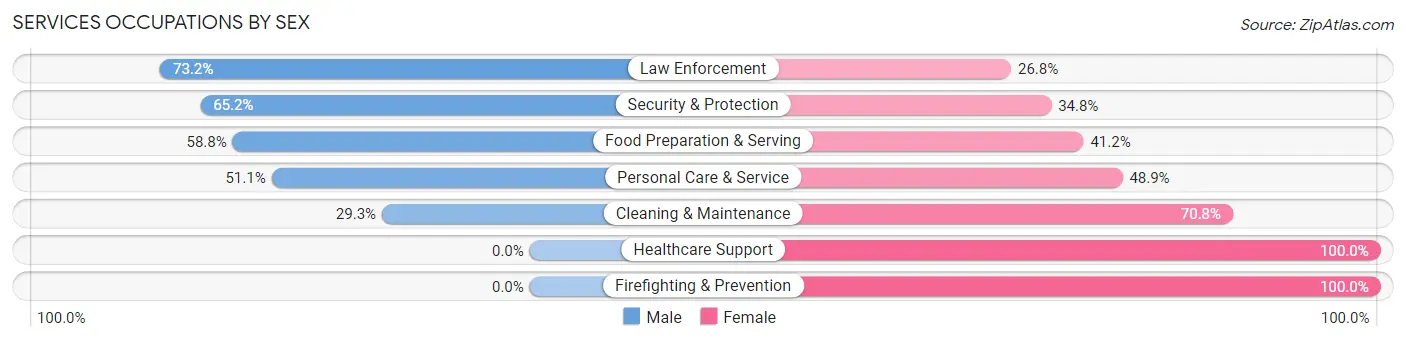
Services Occupations by Sex
Within the Services occupations in Bland County, the most male-oriented occupations are Law Enforcement (73.2%), Security & Protection (65.2%), and Food Preparation & Serving (58.8%), while the most female-oriented occupations are Healthcare Support (100.0%), Firefighting & Prevention (100.0%), and Cleaning & Maintenance (70.8%).
| Occupation | Male | Female |
| Healthcare Support | 0 (0.0%) | 54 (100.0%) |
| Security & Protection | 30 (65.2%) | 16 (34.8%) |
| Firefighting & Prevention | 0 (0.0%) | 5 (100.0%) |
| Law Enforcement | 30 (73.2%) | 11 (26.8%) |
| Food Preparation & Serving | 10 (58.8%) | 7 (41.2%) |
| Cleaning & Maintenance | 31 (29.2%) | 75 (70.8%) |
| Personal Care & Service | 23 (51.1%) | 22 (48.9%) |
| Total (Category) | 94 (35.1%) | 174 (64.9%) |
| Total (Overall) | 1,238 (54.3%) | 1,042 (45.7%) |
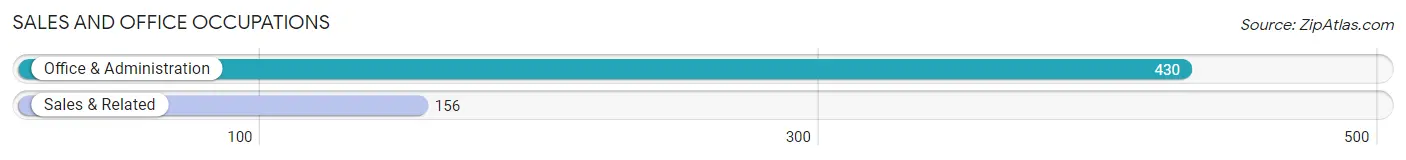
Sales and Office Occupations
The most common Sales and Office occupations in Bland County are Office & Administration (430 | 18.9%), and Sales & Related (156 | 6.8%).
Sales and Office Occupations by Sex
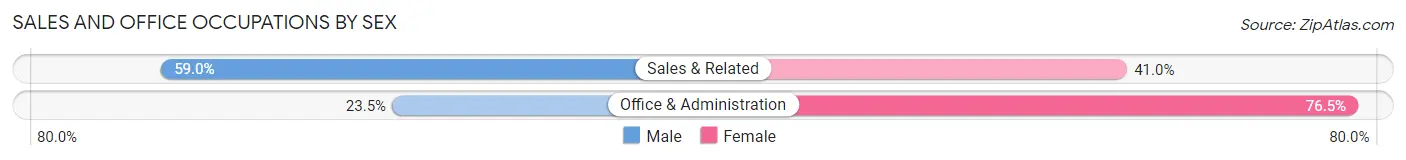
| Occupation | Male | Female |
| Sales & Related | 92 (59.0%) | 64 (41.0%) |
| Office & Administration | 101 (23.5%) | 329 (76.5%) |
| Total (Category) | 193 (32.9%) | 393 (67.1%) |
| Total (Overall) | 1,238 (54.3%) | 1,042 (45.7%) |
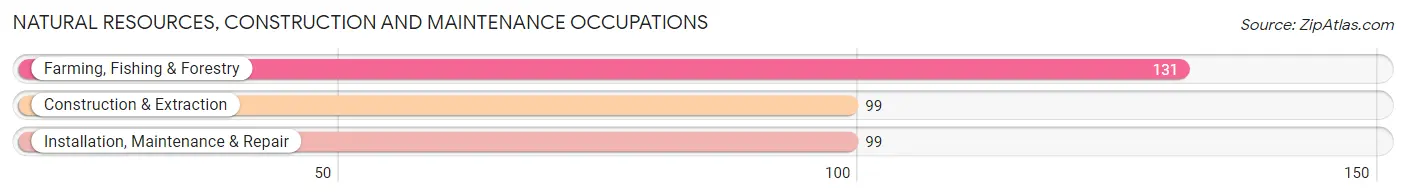
Natural Resources, Construction and Maintenance Occupations
The most common Natural Resources, Construction and Maintenance occupations in Bland County are Farming, Fishing & Forestry (131 | 5.8%), Construction & Extraction (99 | 4.3%), and Installation, Maintenance & Repair (99 | 4.3%).
Natural Resources, Construction and Maintenance Occupations by Sex
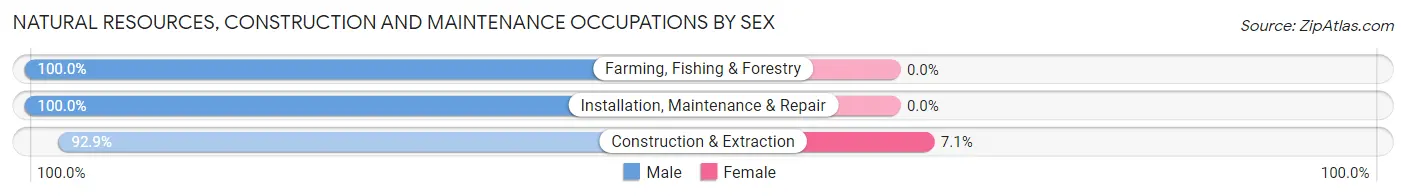
| Occupation | Male | Female |
| Farming, Fishing & Forestry | 131 (100.0%) | 0 (0.0%) |
| Construction & Extraction | 92 (92.9%) | 7 (7.1%) |
| Installation, Maintenance & Repair | 99 (100.0%) | 0 (0.0%) |
| Total (Category) | 322 (97.9%) | 7 (2.1%) |
| Total (Overall) | 1,238 (54.3%) | 1,042 (45.7%) |
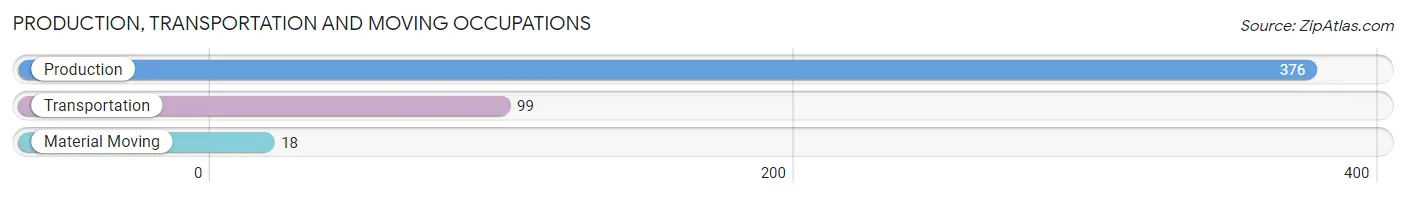
Production, Transportation and Moving Occupations
The most common Production, Transportation and Moving occupations in Bland County are Production (376 | 16.5%), Transportation (99 | 4.3%), and Material Moving (18 | 0.8%).
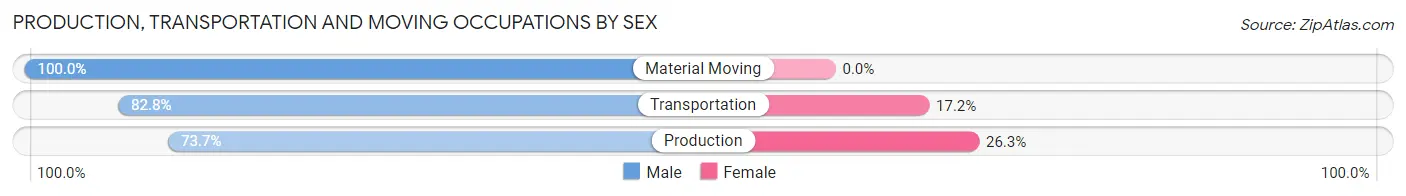
Production, Transportation and Moving Occupations by Sex
| Occupation | Male | Female |
| Production | 277 (73.7%) | 99 (26.3%) |
| Transportation | 82 (82.8%) | 17 (17.2%) |
| Material Moving | 18 (100.0%) | 0 (0.0%) |
| Total (Category) | 377 (76.5%) | 116 (23.5%) |
| Total (Overall) | 1,238 (54.3%) | 1,042 (45.7%) |
Employment Industries by Sex in Bland County
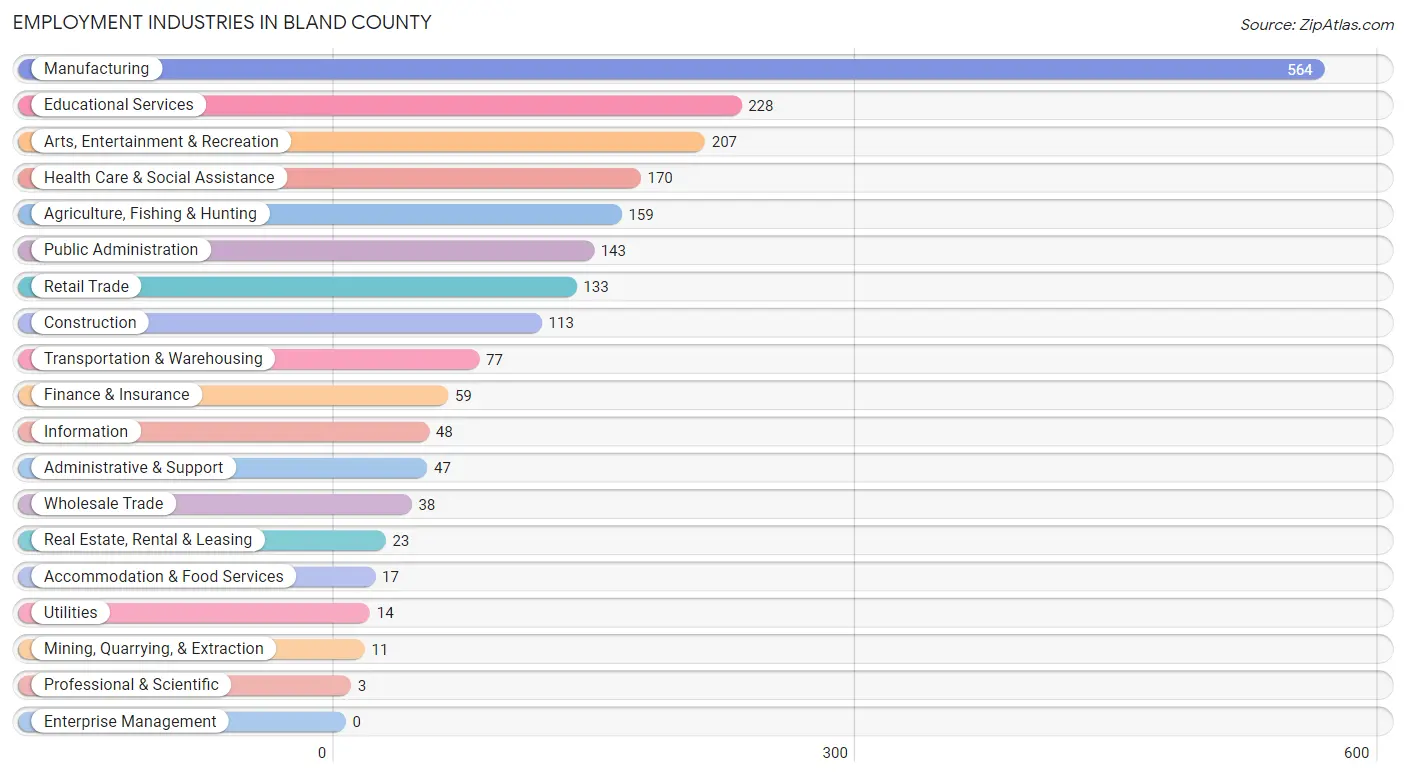
Employment Industries in Bland County
The major employment industries in Bland County include Manufacturing (564 | 24.7%), Educational Services (228 | 10.0%), Arts, Entertainment & Recreation (207 | 9.1%), Health Care & Social Assistance (170 | 7.5%), and Agriculture, Fishing & Hunting (159 | 7.0%).
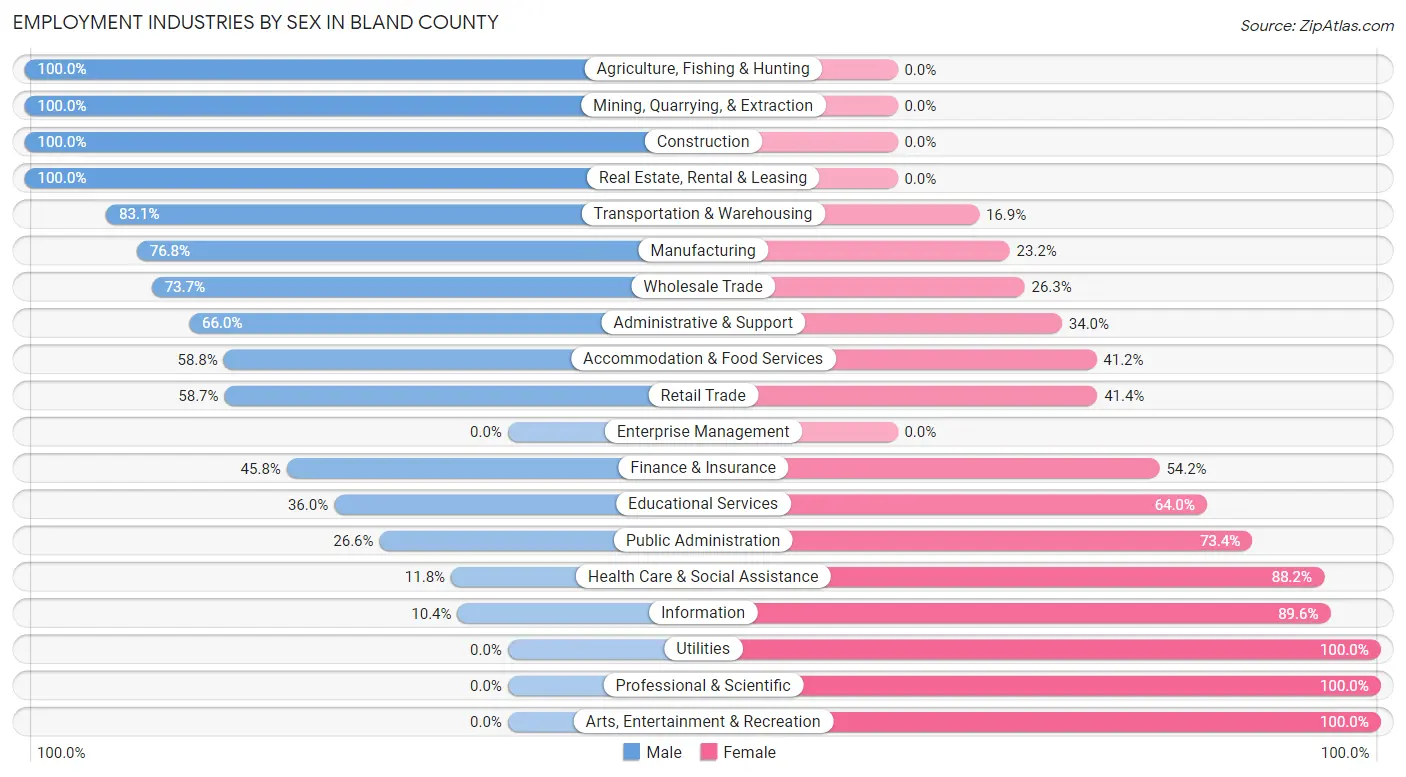
Employment Industries by Sex in Bland County
The Bland County industries that see more men than women are Agriculture, Fishing & Hunting (100.0%), Mining, Quarrying, & Extraction (100.0%), and Construction (100.0%), whereas the industries that tend to have a higher number of women are Utilities (100.0%), Professional & Scientific (100.0%), and Arts, Entertainment & Recreation (100.0%).
| Industry | Male | Female |
| Agriculture, Fishing & Hunting | 159 (100.0%) | 0 (0.0%) |
| Mining, Quarrying, & Extraction | 11 (100.0%) | 0 (0.0%) |
| Construction | 113 (100.0%) | 0 (0.0%) |
| Manufacturing | 433 (76.8%) | 131 (23.2%) |
| Wholesale Trade | 28 (73.7%) | 10 (26.3%) |
| Retail Trade | 78 (58.7%) | 55 (41.3%) |
| Transportation & Warehousing | 64 (83.1%) | 13 (16.9%) |
| Utilities | 0 (0.0%) | 14 (100.0%) |
| Information | 5 (10.4%) | 43 (89.6%) |
| Finance & Insurance | 27 (45.8%) | 32 (54.2%) |
| Real Estate, Rental & Leasing | 23 (100.0%) | 0 (0.0%) |
| Professional & Scientific | 0 (0.0%) | 3 (100.0%) |
| Enterprise Management | 0 (0.0%) | 0 (0.0%) |
| Administrative & Support | 31 (66.0%) | 16 (34.0%) |
| Educational Services | 82 (36.0%) | 146 (64.0%) |
| Health Care & Social Assistance | 20 (11.8%) | 150 (88.2%) |
| Arts, Entertainment & Recreation | 0 (0.0%) | 207 (100.0%) |
| Accommodation & Food Services | 10 (58.8%) | 7 (41.2%) |
| Public Administration | 38 (26.6%) | 105 (73.4%) |
| Total | 1,238 (54.3%) | 1,042 (45.7%) |
Education in Bland County
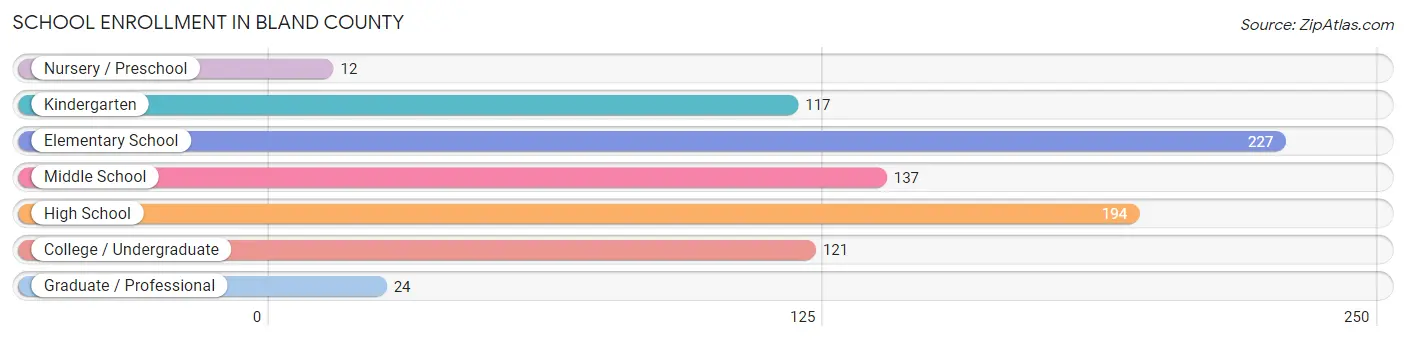
School Enrollment in Bland County
The most common levels of schooling among the 832 students in Bland County are elementary school (227 | 27.3%), high school (194 | 23.3%), and middle school (137 | 16.5%).
| School Level | # Students | % Students |
| Nursery / Preschool | 12 | 1.4% |
| Kindergarten | 117 | 14.1% |
| Elementary School | 227 | 27.3% |
| Middle School | 137 | 16.5% |
| High School | 194 | 23.3% |
| College / Undergraduate | 121 | 14.5% |
| Graduate / Professional | 24 | 2.9% |
| Total | 832 | 100.0% |
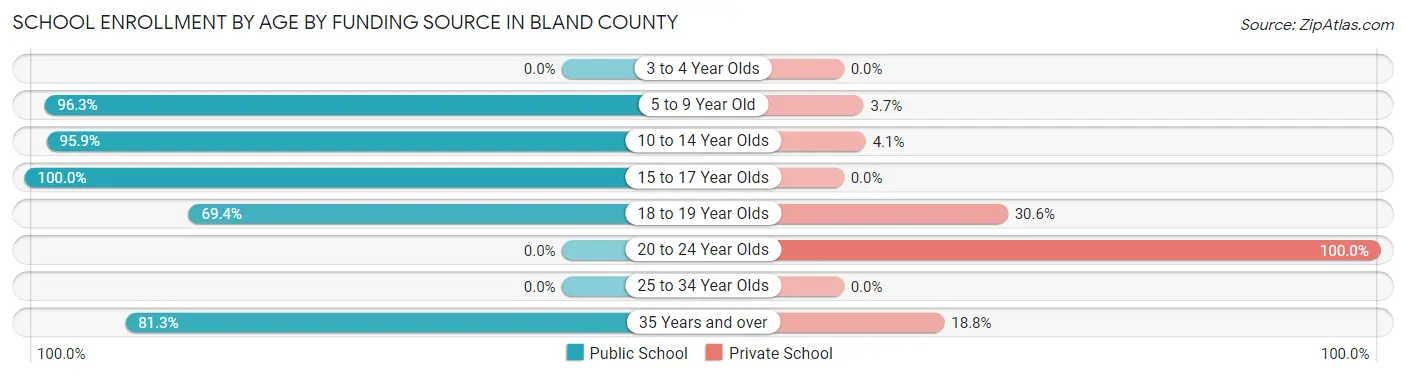
School Enrollment by Age by Funding Source in Bland County
Out of a total of 832 students who are enrolled in schools in Bland County, 78 (9.4%) attend a private institution, while the remaining 754 (90.6%) are enrolled in public schools. The age group of 20 to 24 year olds has the highest likelihood of being enrolled in private schools, with 11 (100.0% in the age bracket) enrolled. Conversely, the age group of 15 to 17 year olds has the lowest likelihood of being enrolled in a private school, with 140 (100.0% in the age bracket) attending a public institution.
| Age Bracket | Public School | Private School |
| 3 to 4 Year Olds | 0 (0.0%) | 0 (0.0%) |
| 5 to 9 Year Old | 287 (96.3%) | 11 (3.7%) |
| 10 to 14 Year Olds | 187 (95.9%) | 8 (4.1%) |
| 15 to 17 Year Olds | 140 (100.0%) | 0 (0.0%) |
| 18 to 19 Year Olds | 75 (69.4%) | 33 (30.6%) |
| 20 to 24 Year Olds | 0 (0.0%) | 11 (100.0%) |
| 25 to 34 Year Olds | 0 (0.0%) | 0 (0.0%) |
| 35 Years and over | 65 (81.2%) | 15 (18.8%) |
| Total | 754 (90.6%) | 78 (9.4%) |
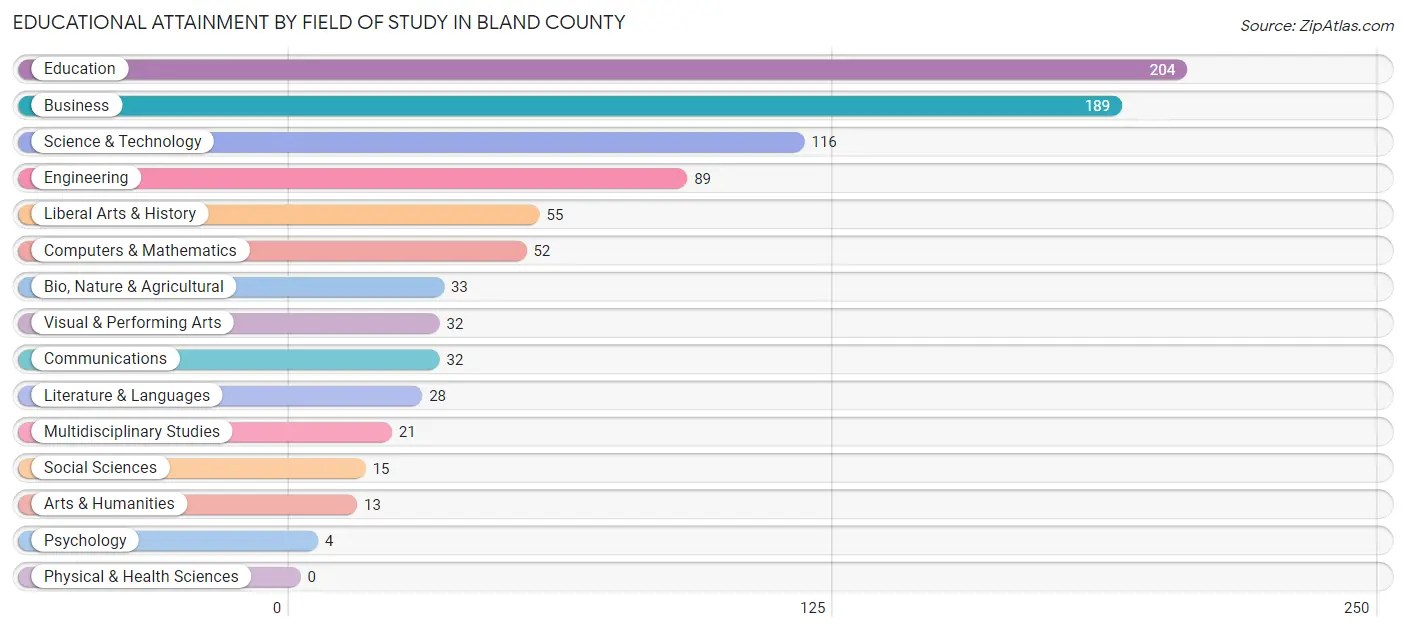
Educational Attainment by Field of Study in Bland County
Education (204 | 23.1%), business (189 | 21.4%), science & technology (116 | 13.1%), engineering (89 | 10.1%), and liberal arts & history (55 | 6.2%) are the most common fields of study among 883 individuals in Bland County who have obtained a bachelor's degree or higher.
| Field of Study | # Graduates | % Graduates |
| Computers & Mathematics | 52 | 5.9% |
| Bio, Nature & Agricultural | 33 | 3.7% |
| Physical & Health Sciences | 0 | 0.0% |
| Psychology | 4 | 0.4% |
| Social Sciences | 15 | 1.7% |
| Engineering | 89 | 10.1% |
| Multidisciplinary Studies | 21 | 2.4% |
| Science & Technology | 116 | 13.1% |
| Business | 189 | 21.4% |
| Education | 204 | 23.1% |
| Literature & Languages | 28 | 3.2% |
| Liberal Arts & History | 55 | 6.2% |
| Visual & Performing Arts | 32 | 3.6% |
| Communications | 32 | 3.6% |
| Arts & Humanities | 13 | 1.5% |
| Total | 883 | 100.0% |
Transportation & Commute in Bland County
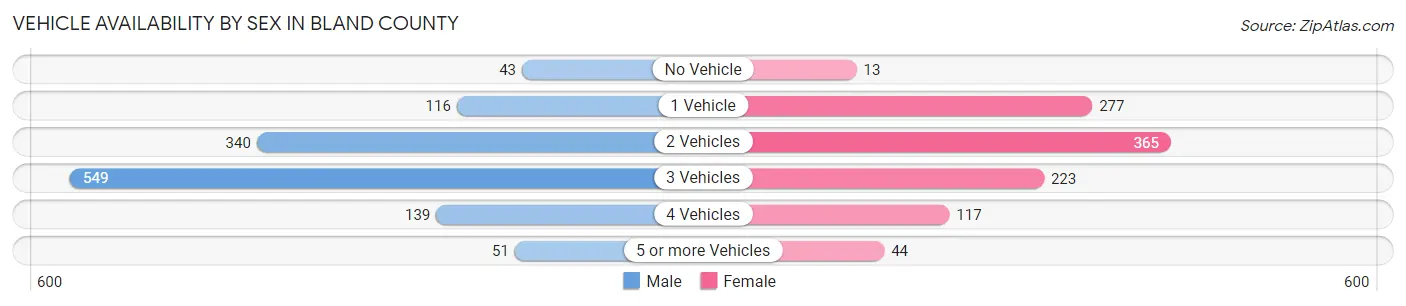
Vehicle Availability by Sex in Bland County
The most prevalent vehicle ownership categories in Bland County are males with 3 vehicles (549, accounting for 44.4%) and females with 3 vehicles (223, making up 52.8%).
| Vehicles Available | Male | Female |
| No Vehicle | 43 (3.5%) | 13 (1.3%) |
| 1 Vehicle | 116 (9.4%) | 277 (26.7%) |
| 2 Vehicles | 340 (27.5%) | 365 (35.1%) |
| 3 Vehicles | 549 (44.4%) | 223 (21.5%) |
| 4 Vehicles | 139 (11.2%) | 117 (11.3%) |
| 5 or more Vehicles | 51 (4.1%) | 44 (4.2%) |
| Total | 1,238 (100.0%) | 1,039 (100.0%) |
Commute Time in Bland County
The most frequently occuring commute durations in Bland County are 5 to 9 minutes (424 commuters, 19.2%), 10 to 14 minutes (361 commuters, 16.3%), and 45 to 59 minutes (256 commuters, 11.6%).
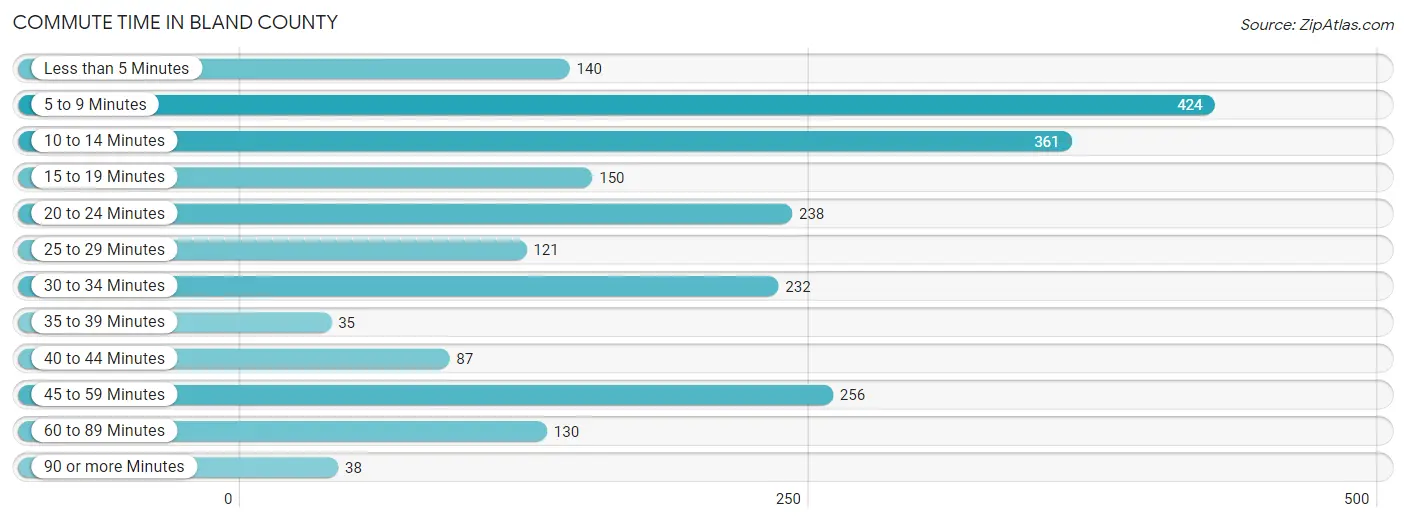
| Commute Time | # Commuters | % Commuters |
| Less than 5 Minutes | 140 | 6.3% |
| 5 to 9 Minutes | 424 | 19.2% |
| 10 to 14 Minutes | 361 | 16.3% |
| 15 to 19 Minutes | 150 | 6.8% |
| 20 to 24 Minutes | 238 | 10.8% |
| 25 to 29 Minutes | 121 | 5.5% |
| 30 to 34 Minutes | 232 | 10.5% |
| 35 to 39 Minutes | 35 | 1.6% |
| 40 to 44 Minutes | 87 | 3.9% |
| 45 to 59 Minutes | 256 | 11.6% |
| 60 to 89 Minutes | 130 | 5.9% |
| 90 or more Minutes | 38 | 1.7% |
Commute Time by Sex in Bland County
The most common commute times in Bland County are 5 to 9 minutes (306 commuters, 25.5%) for males and 10 to 14 minutes (259 commuters, 25.6%) for females.
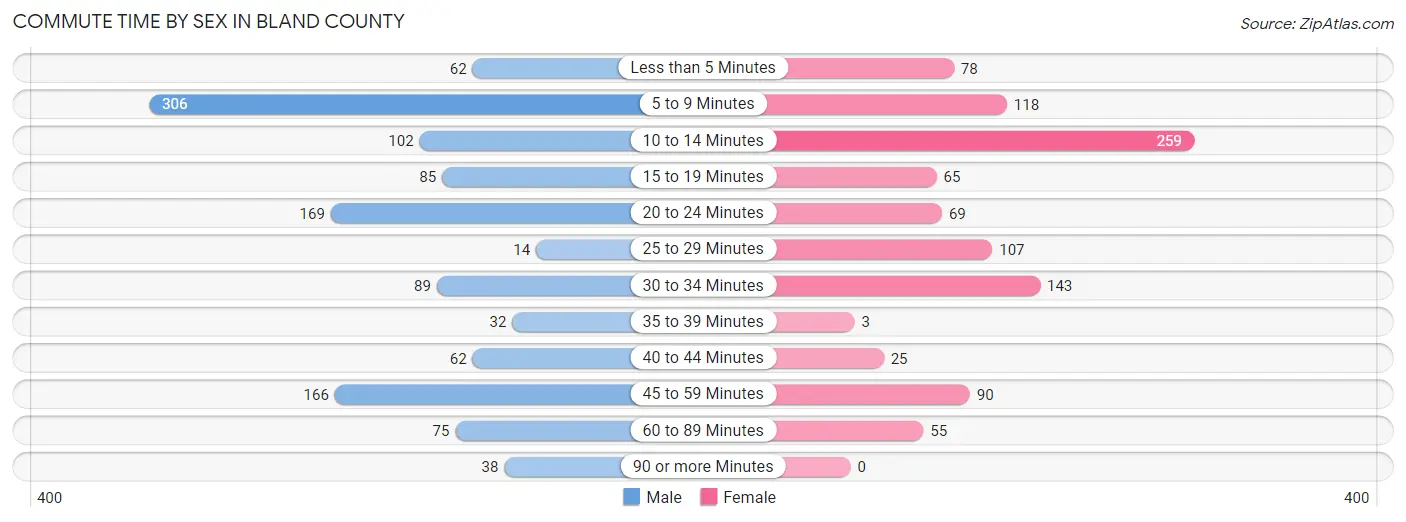
| Commute Time | Male | Female |
| Less than 5 Minutes | 62 (5.2%) | 78 (7.7%) |
| 5 to 9 Minutes | 306 (25.5%) | 118 (11.7%) |
| 10 to 14 Minutes | 102 (8.5%) | 259 (25.6%) |
| 15 to 19 Minutes | 85 (7.1%) | 65 (6.4%) |
| 20 to 24 Minutes | 169 (14.1%) | 69 (6.8%) |
| 25 to 29 Minutes | 14 (1.2%) | 107 (10.6%) |
| 30 to 34 Minutes | 89 (7.4%) | 143 (14.1%) |
| 35 to 39 Minutes | 32 (2.7%) | 3 (0.3%) |
| 40 to 44 Minutes | 62 (5.2%) | 25 (2.5%) |
| 45 to 59 Minutes | 166 (13.8%) | 90 (8.9%) |
| 60 to 89 Minutes | 75 (6.2%) | 55 (5.4%) |
| 90 or more Minutes | 38 (3.2%) | 0 (0.0%) |
Time of Departure to Work by Sex in Bland County
The most frequent times of departure to work in Bland County are 7:30 AM to 7:59 AM (263, 21.9%) for males and 7:30 AM to 7:59 AM (305, 30.1%) for females.
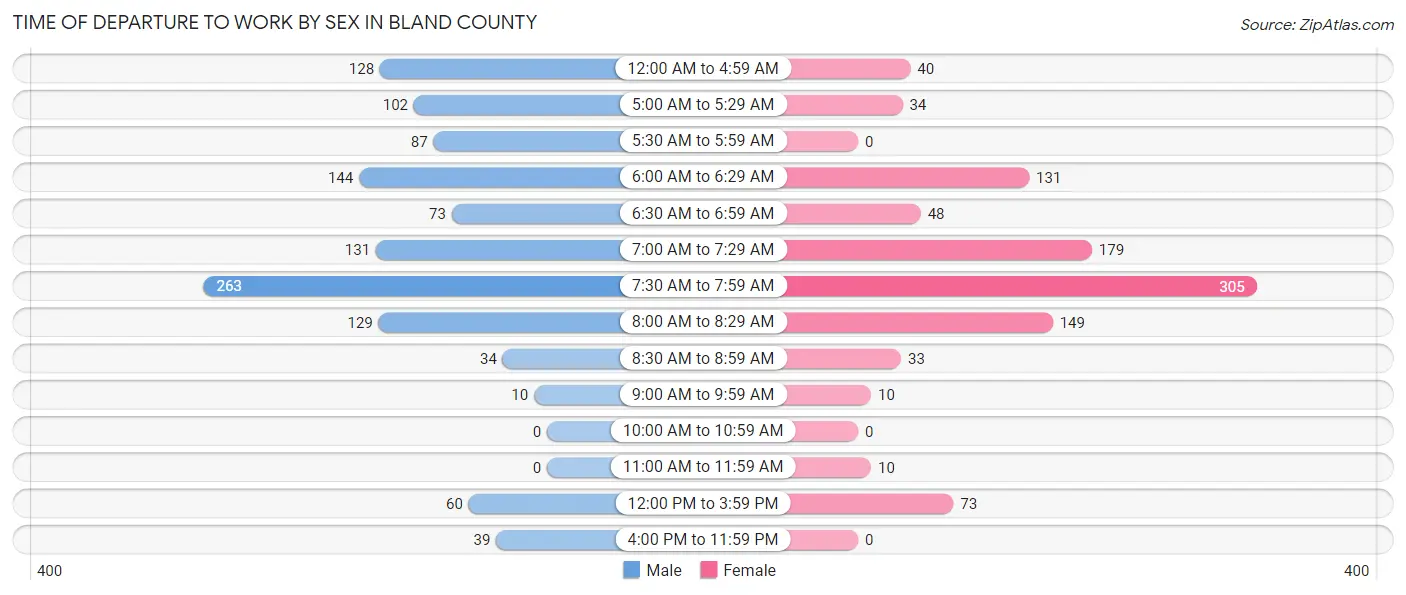
| Time of Departure | Male | Female |
| 12:00 AM to 4:59 AM | 128 (10.7%) | 40 (4.0%) |
| 5:00 AM to 5:29 AM | 102 (8.5%) | 34 (3.4%) |
| 5:30 AM to 5:59 AM | 87 (7.2%) | 0 (0.0%) |
| 6:00 AM to 6:29 AM | 144 (12.0%) | 131 (12.9%) |
| 6:30 AM to 6:59 AM | 73 (6.1%) | 48 (4.7%) |
| 7:00 AM to 7:29 AM | 131 (10.9%) | 179 (17.7%) |
| 7:30 AM to 7:59 AM | 263 (21.9%) | 305 (30.1%) |
| 8:00 AM to 8:29 AM | 129 (10.7%) | 149 (14.7%) |
| 8:30 AM to 8:59 AM | 34 (2.8%) | 33 (3.3%) |
| 9:00 AM to 9:59 AM | 10 (0.8%) | 10 (1.0%) |
| 10:00 AM to 10:59 AM | 0 (0.0%) | 0 (0.0%) |
| 11:00 AM to 11:59 AM | 0 (0.0%) | 10 (1.0%) |
| 12:00 PM to 3:59 PM | 60 (5.0%) | 73 (7.2%) |
| 4:00 PM to 11:59 PM | 39 (3.3%) | 0 (0.0%) |
| Total | 1,200 (100.0%) | 1,012 (100.0%) |
Housing Occupancy in Bland County
Occupancy by Ownership in Bland County
Of the total 2,235 dwellings in Bland County, owner-occupied units account for 1,904 (85.2%), while renter-occupied units make up 331 (14.8%).
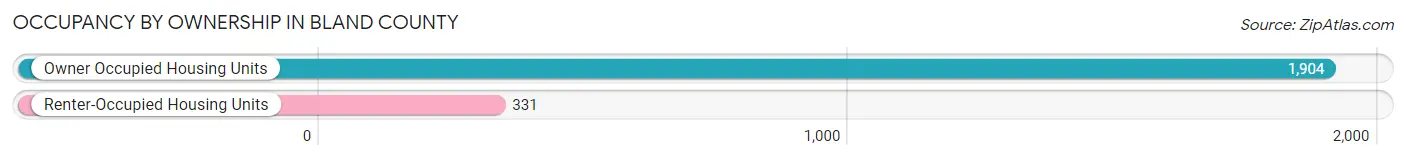
| Occupancy | # Housing Units | % Housing Units |
| Owner Occupied Housing Units | 1,904 | 85.2% |
| Renter-Occupied Housing Units | 331 | 14.8% |
| Total Occupied Housing Units | 2,235 | 100.0% |
Occupancy by Household Size in Bland County
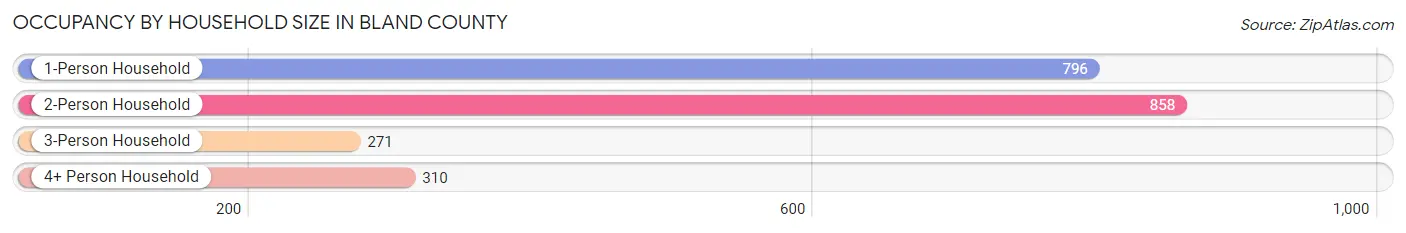
| Household Size | # Housing Units | % Housing Units |
| 1-Person Household | 796 | 35.6% |
| 2-Person Household | 858 | 38.4% |
| 3-Person Household | 271 | 12.1% |
| 4+ Person Household | 310 | 13.9% |
| Total Housing Units | 2,235 | 100.0% |
Occupancy by Ownership by Household Size in Bland County
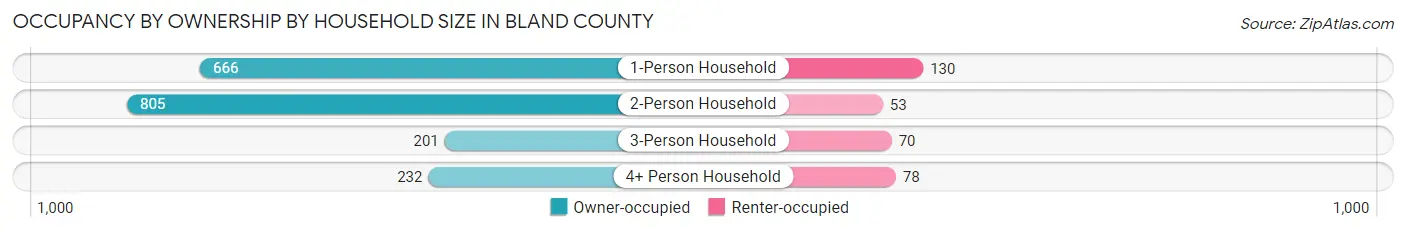
| Household Size | Owner-occupied | Renter-occupied |
| 1-Person Household | 666 (83.7%) | 130 (16.3%) |
| 2-Person Household | 805 (93.8%) | 53 (6.2%) |
| 3-Person Household | 201 (74.2%) | 70 (25.8%) |
| 4+ Person Household | 232 (74.8%) | 78 (25.2%) |
| Total Housing Units | 1,904 (85.2%) | 331 (14.8%) |
Occupancy by Educational Attainment in Bland County
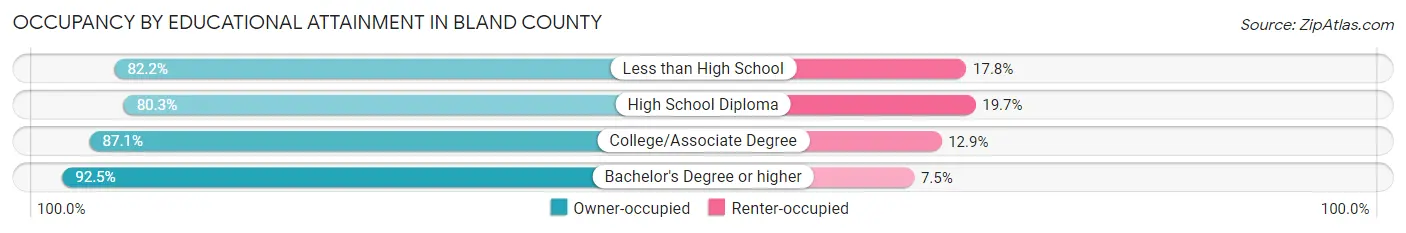
| Household Size | Owner-occupied | Renter-occupied |
| Less than High School | 106 (82.2%) | 23 (17.8%) |
| High School Diploma | 699 (80.3%) | 171 (19.7%) |
| College/Associate Degree | 716 (87.1%) | 106 (12.9%) |
| Bachelor's Degree or higher | 383 (92.5%) | 31 (7.5%) |
Occupancy by Age of Householder in Bland County
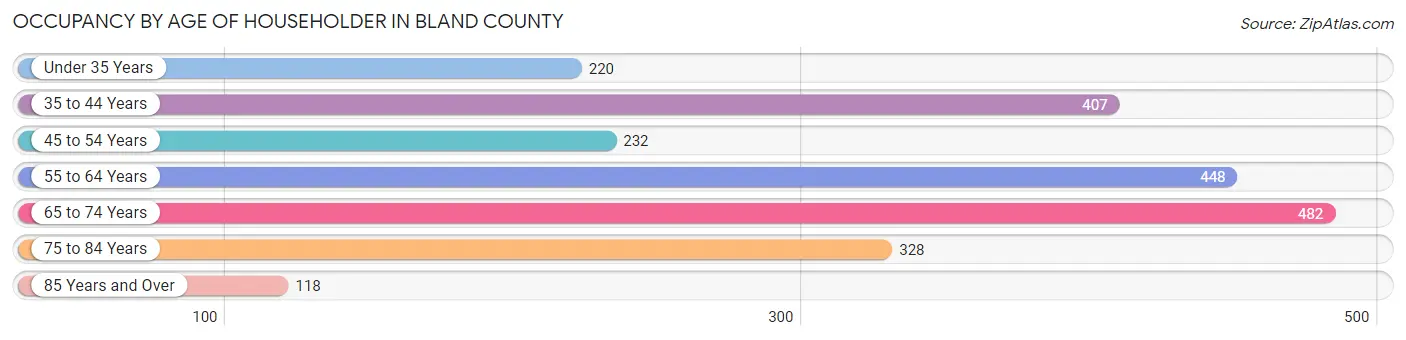
| Age Bracket | # Households | % Households |
| Under 35 Years | 220 | 9.8% |
| 35 to 44 Years | 407 | 18.2% |
| 45 to 54 Years | 232 | 10.4% |
| 55 to 64 Years | 448 | 20.0% |
| 65 to 74 Years | 482 | 21.6% |
| 75 to 84 Years | 328 | 14.7% |
| 85 Years and Over | 118 | 5.3% |
| Total | 2,235 | 100.0% |
Housing Finances in Bland County
Median Income by Occupancy in Bland County
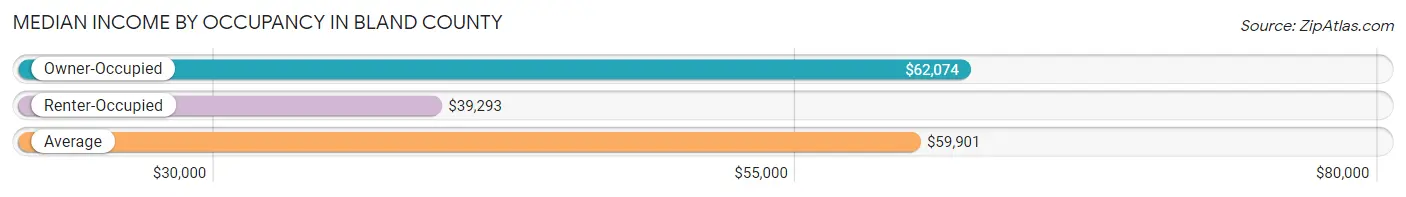
| Occupancy Type | # Households | Median Income |
| Owner-Occupied | 1,904 (85.2%) | $62,074 |
| Renter-Occupied | 331 (14.8%) | $39,293 |
| Average | 2,235 (100.0%) | $59,901 |
Occupancy by Householder Income Bracket in Bland County
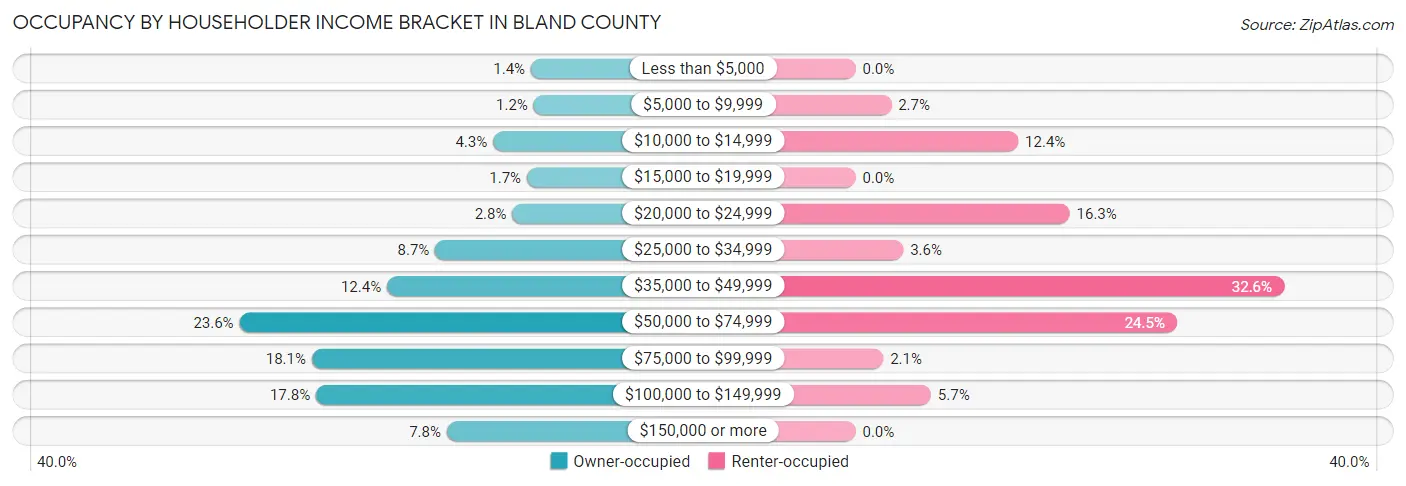
| Income Bracket | Owner-occupied | Renter-occupied |
| Less than $5,000 | 27 (1.4%) | 0 (0.0%) |
| $5,000 to $9,999 | 23 (1.2%) | 9 (2.7%) |
| $10,000 to $14,999 | 82 (4.3%) | 41 (12.4%) |
| $15,000 to $19,999 | 33 (1.7%) | 0 (0.0%) |
| $20,000 to $24,999 | 54 (2.8%) | 54 (16.3%) |
| $25,000 to $34,999 | 166 (8.7%) | 12 (3.6%) |
| $35,000 to $49,999 | 236 (12.4%) | 108 (32.6%) |
| $50,000 to $74,999 | 450 (23.6%) | 81 (24.5%) |
| $75,000 to $99,999 | 345 (18.1%) | 7 (2.1%) |
| $100,000 to $149,999 | 339 (17.8%) | 19 (5.7%) |
| $150,000 or more | 149 (7.8%) | 0 (0.0%) |
| Total | 1,904 (100.0%) | 331 (100.0%) |
Monthly Housing Cost Tiers in Bland County
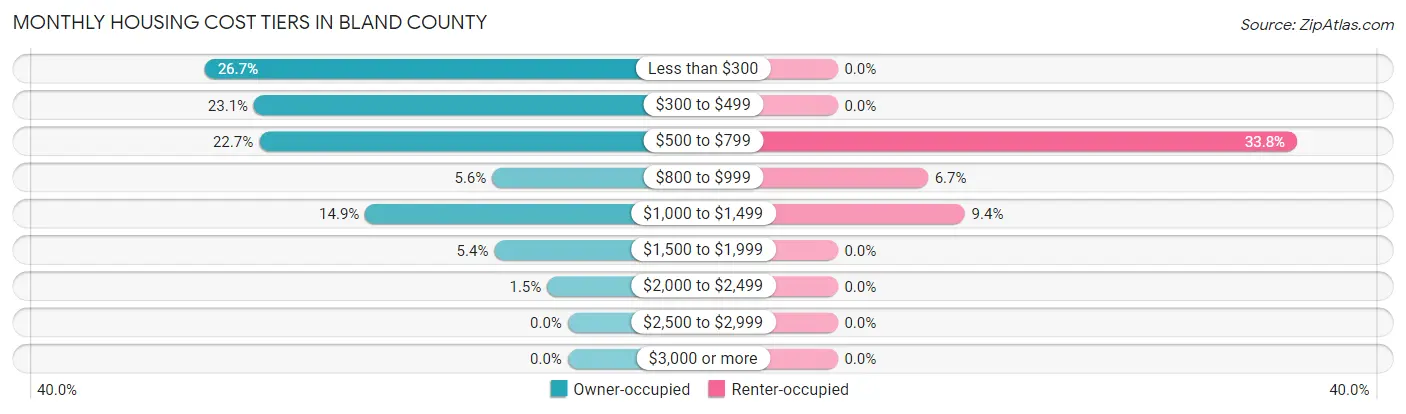
| Monthly Cost | Owner-occupied | Renter-occupied |
| Less than $300 | 509 (26.7%) | 0 (0.0%) |
| $300 to $499 | 440 (23.1%) | 0 (0.0%) |
| $500 to $799 | 433 (22.7%) | 112 (33.8%) |
| $800 to $999 | 106 (5.6%) | 22 (6.7%) |
| $1,000 to $1,499 | 284 (14.9%) | 31 (9.4%) |
| $1,500 to $1,999 | 103 (5.4%) | 0 (0.0%) |
| $2,000 to $2,499 | 29 (1.5%) | 0 (0.0%) |
| $2,500 to $2,999 | 0 (0.0%) | 0 (0.0%) |
| $3,000 or more | 0 (0.0%) | 0 (0.0%) |
| Total | 1,904 (100.0%) | 331 (100.0%) |
Physical Housing Characteristics in Bland County
Housing Structures in Bland County
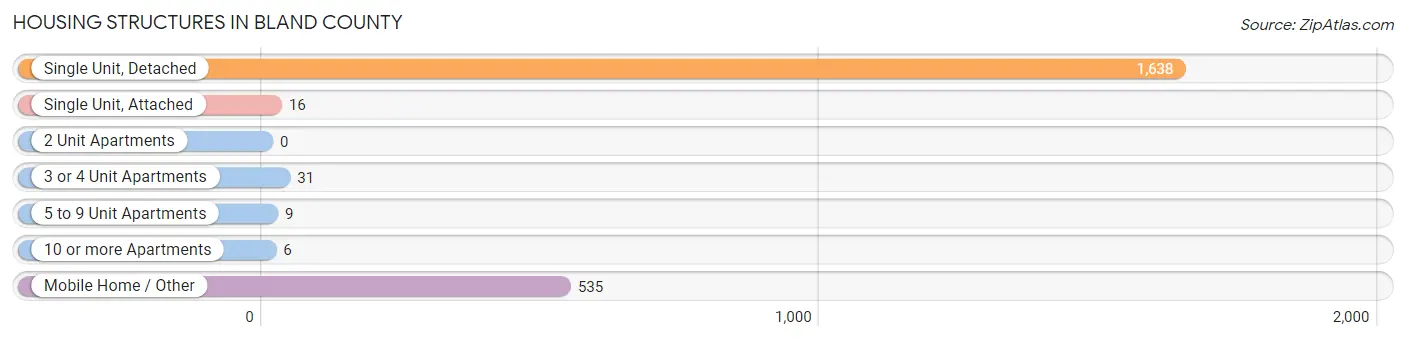
| Structure Type | # Housing Units | % Housing Units |
| Single Unit, Detached | 1,638 | 73.3% |
| Single Unit, Attached | 16 | 0.7% |
| 2 Unit Apartments | 0 | 0.0% |
| 3 or 4 Unit Apartments | 31 | 1.4% |
| 5 to 9 Unit Apartments | 9 | 0.4% |
| 10 or more Apartments | 6 | 0.3% |
| Mobile Home / Other | 535 | 23.9% |
| Total | 2,235 | 100.0% |
Housing Structures by Occupancy in Bland County
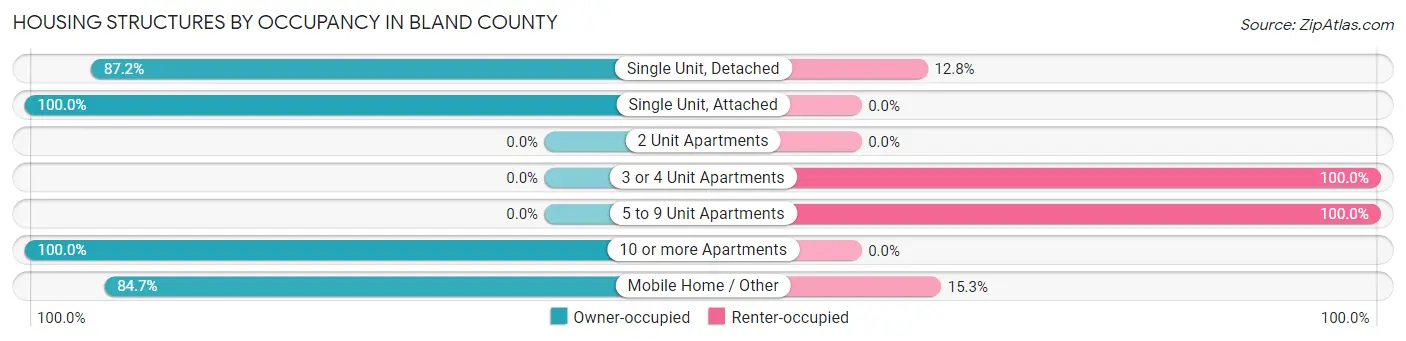
| Structure Type | Owner-occupied | Renter-occupied |
| Single Unit, Detached | 1,429 (87.2%) | 209 (12.8%) |
| Single Unit, Attached | 16 (100.0%) | 0 (0.0%) |
| 2 Unit Apartments | 0 (0.0%) | 0 (0.0%) |
| 3 or 4 Unit Apartments | 0 (0.0%) | 31 (100.0%) |
| 5 to 9 Unit Apartments | 0 (0.0%) | 9 (100.0%) |
| 10 or more Apartments | 6 (100.0%) | 0 (0.0%) |
| Mobile Home / Other | 453 (84.7%) | 82 (15.3%) |
| Total | 1,904 (85.2%) | 331 (14.8%) |
Housing Structures by Number of Rooms in Bland County
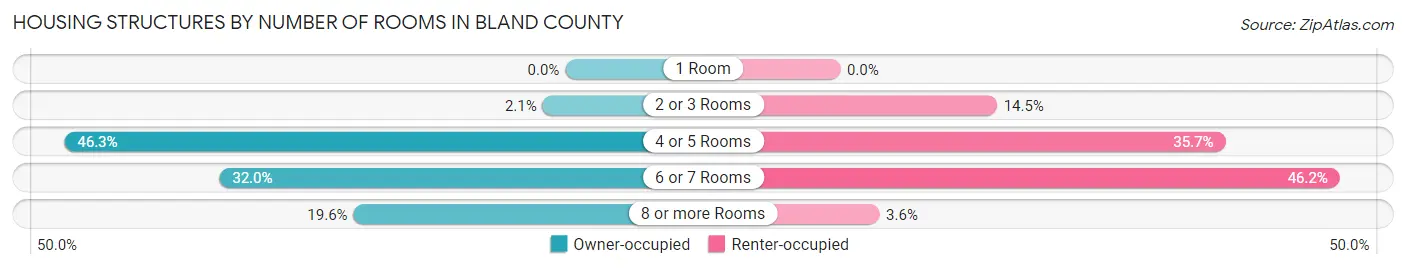
| Number of Rooms | Owner-occupied | Renter-occupied |
| 1 Room | 0 (0.0%) | 0 (0.0%) |
| 2 or 3 Rooms | 40 (2.1%) | 48 (14.5%) |
| 4 or 5 Rooms | 882 (46.3%) | 118 (35.6%) |
| 6 or 7 Rooms | 609 (32.0%) | 153 (46.2%) |
| 8 or more Rooms | 373 (19.6%) | 12 (3.6%) |
| Total | 1,904 (100.0%) | 331 (100.0%) |
Housing Structure by Heating Type in Bland County
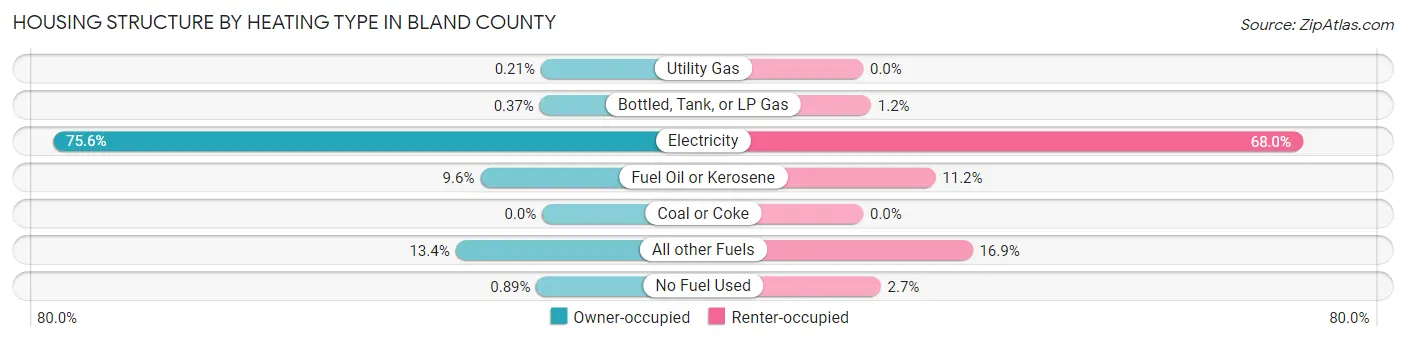
| Heating Type | Owner-occupied | Renter-occupied |
| Utility Gas | 4 (0.2%) | 0 (0.0%) |
| Bottled, Tank, or LP Gas | 7 (0.4%) | 4 (1.2%) |
| Electricity | 1,439 (75.6%) | 225 (68.0%) |
| Fuel Oil or Kerosene | 182 (9.6%) | 37 (11.2%) |
| Coal or Coke | 0 (0.0%) | 0 (0.0%) |
| All other Fuels | 255 (13.4%) | 56 (16.9%) |
| No Fuel Used | 17 (0.9%) | 9 (2.7%) |
| Total | 1,904 (100.0%) | 331 (100.0%) |
Household Vehicle Usage in Bland County
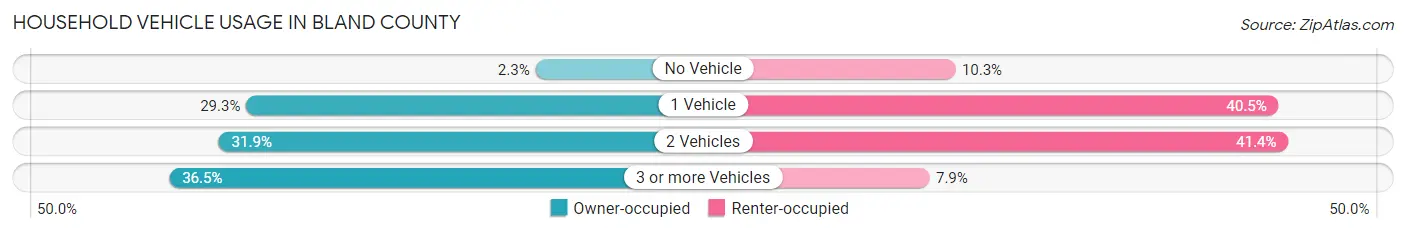
| Vehicles per Household | Owner-occupied | Renter-occupied |
| No Vehicle | 44 (2.3%) | 34 (10.3%) |
| 1 Vehicle | 558 (29.3%) | 134 (40.5%) |
| 2 Vehicles | 607 (31.9%) | 137 (41.4%) |
| 3 or more Vehicles | 695 (36.5%) | 26 (7.9%) |
| Total | 1,904 (100.0%) | 331 (100.0%) |
Real Estate & Mortgages in Bland County
Real Estate and Mortgage Overview in Bland County
| Characteristic | Without Mortgage | With Mortgage |
| Housing Units | 1,299 | 605 |
| Median Property Value | $120,500 | $155,900 |
| Median Household Income | $61,497 | $79 |
| Monthly Housing Costs | $338 | $0 |
| Real Estate Taxes | $1,023 | $6 |
Property Value by Mortgage Status in Bland County
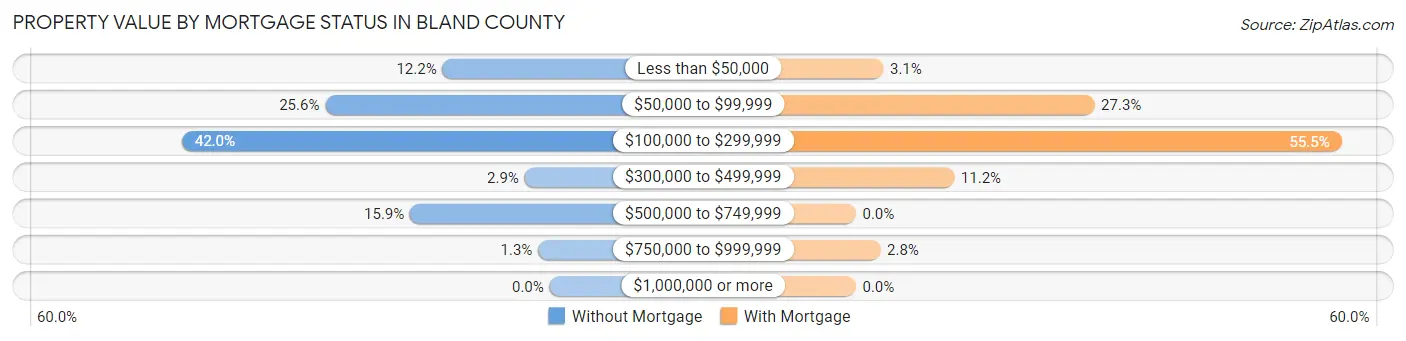
| Property Value | Without Mortgage | With Mortgage |
| Less than $50,000 | 159 (12.2%) | 19 (3.1%) |
| $50,000 to $99,999 | 333 (25.6%) | 165 (27.3%) |
| $100,000 to $299,999 | 546 (42.0%) | 336 (55.5%) |
| $300,000 to $499,999 | 37 (2.9%) | 68 (11.2%) |
| $500,000 to $749,999 | 207 (15.9%) | 0 (0.0%) |
| $750,000 to $999,999 | 17 (1.3%) | 17 (2.8%) |
| $1,000,000 or more | 0 (0.0%) | 0 (0.0%) |
| Total | 1,299 (100.0%) | 605 (100.0%) |
Household Income by Mortgage Status in Bland County
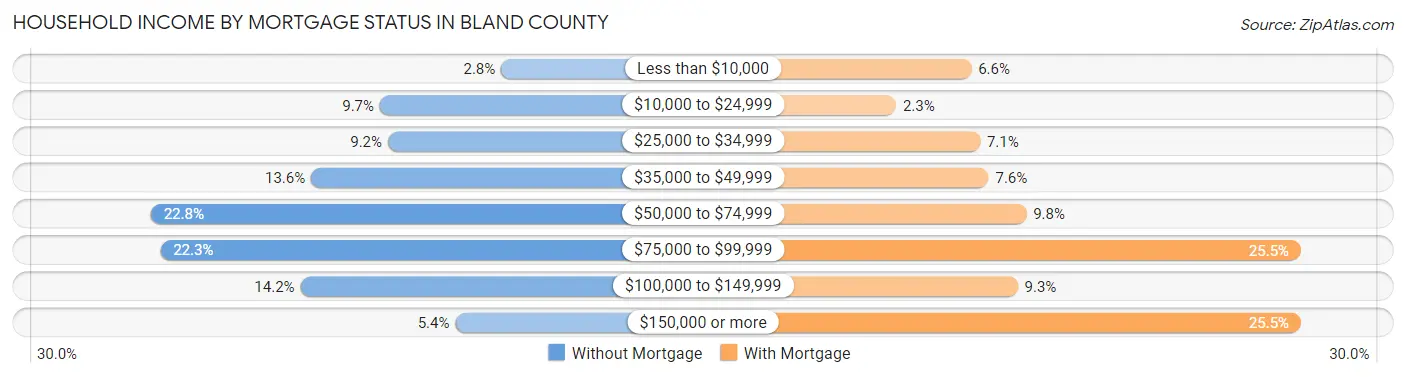
| Household Income | Without Mortgage | With Mortgage |
| Less than $10,000 | 36 (2.8%) | 40 (6.6%) |
| $10,000 to $24,999 | 126 (9.7%) | 14 (2.3%) |
| $25,000 to $34,999 | 120 (9.2%) | 43 (7.1%) |
| $35,000 to $49,999 | 177 (13.6%) | 46 (7.6%) |
| $50,000 to $74,999 | 296 (22.8%) | 59 (9.8%) |
| $75,000 to $99,999 | 289 (22.3%) | 154 (25.5%) |
| $100,000 to $149,999 | 185 (14.2%) | 56 (9.3%) |
| $150,000 or more | 70 (5.4%) | 154 (25.5%) |
| Total | 1,299 (100.0%) | 605 (100.0%) |
Property Value to Household Income Ratio in Bland County
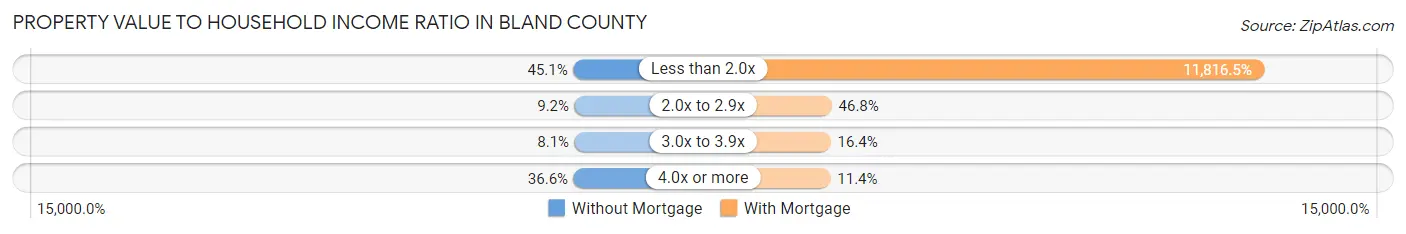
| Value-to-Income Ratio | Without Mortgage | With Mortgage |
| Less than 2.0x | 586 (45.1%) | 71,490 (11,816.5%) |
| 2.0x to 2.9x | 120 (9.2%) | 283 (46.8%) |
| 3.0x to 3.9x | 105 (8.1%) | 99 (16.4%) |
| 4.0x or more | 476 (36.6%) | 69 (11.4%) |
| Total | 1,299 (100.0%) | 605 (100.0%) |
Real Estate Taxes by Mortgage Status in Bland County
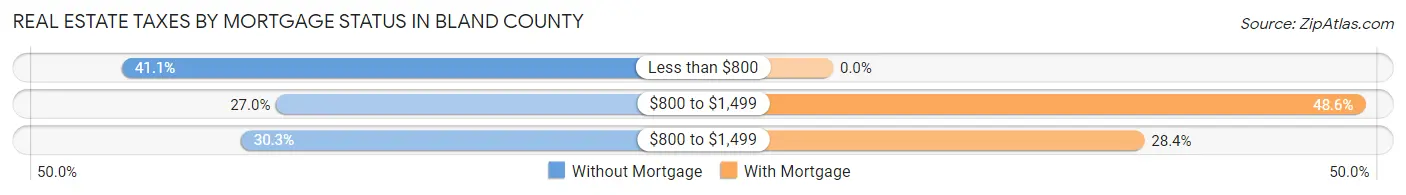
| Property Taxes | Without Mortgage | With Mortgage |
| Less than $800 | 534 (41.1%) | 0 (0.0%) |
| $800 to $1,499 | 351 (27.0%) | 294 (48.6%) |
| $800 to $1,499 | 393 (30.2%) | 172 (28.4%) |
| Total | 1,299 (100.0%) | 605 (100.0%) |
Health & Disability in Bland County
Health Insurance Coverage by Age in Bland County
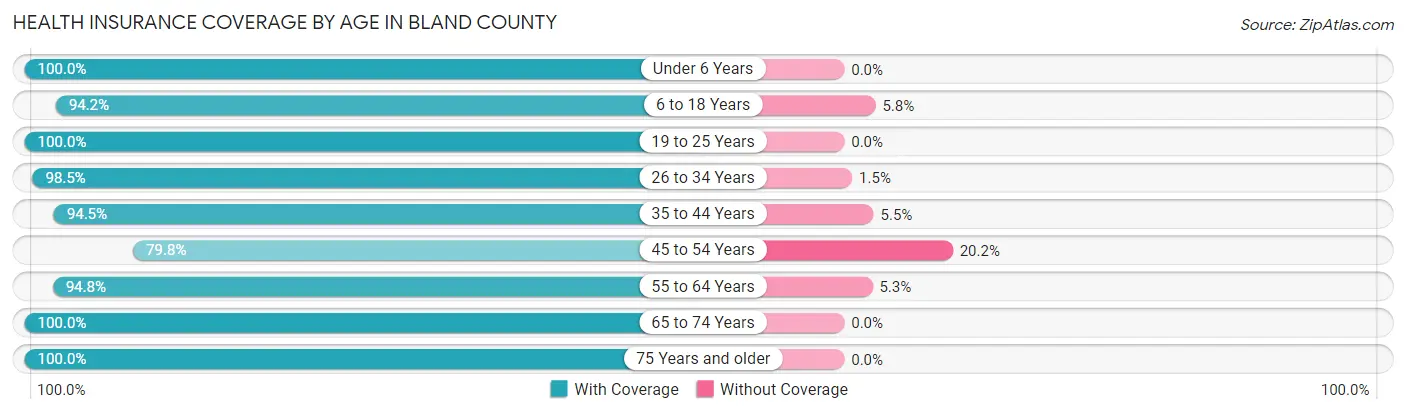
| Age Bracket | With Coverage | Without Coverage |
| Under 6 Years | 409 (100.0%) | 0 (0.0%) |
| 6 to 18 Years | 631 (94.2%) | 39 (5.8%) |
| 19 to 25 Years | 234 (100.0%) | 0 (0.0%) |
| 26 to 34 Years | 538 (98.5%) | 8 (1.5%) |
| 35 to 44 Years | 589 (94.5%) | 34 (5.5%) |
| 45 to 54 Years | 517 (79.8%) | 131 (20.2%) |
| 55 to 64 Years | 758 (94.8%) | 42 (5.2%) |
| 65 to 74 Years | 778 (100.0%) | 0 (0.0%) |
| 75 Years and older | 591 (100.0%) | 0 (0.0%) |
| Total | 5,045 (95.2%) | 254 (4.8%) |
Health Insurance Coverage by Citizenship Status in Bland County
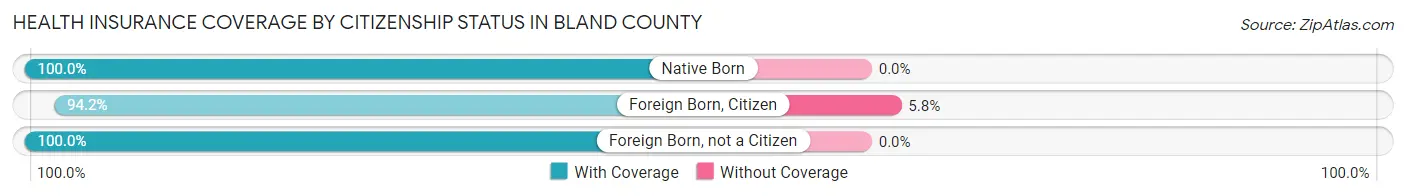
| Citizenship Status | With Coverage | Without Coverage |
| Native Born | 409 (100.0%) | 0 (0.0%) |
| Foreign Born, Citizen | 631 (94.2%) | 39 (5.8%) |
| Foreign Born, not a Citizen | 234 (100.0%) | 0 (0.0%) |
Health Insurance Coverage by Household Income in Bland County
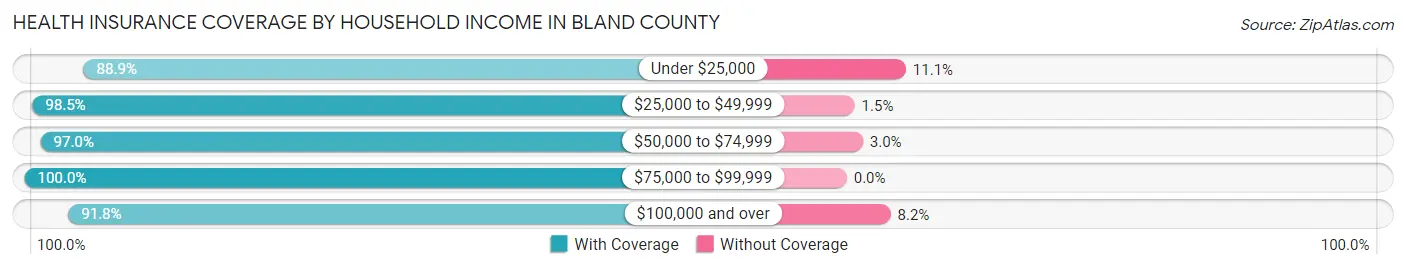
| Household Income | With Coverage | Without Coverage |
| Under $25,000 | 458 (88.9%) | 57 (11.1%) |
| $25,000 to $49,999 | 1,004 (98.5%) | 15 (1.5%) |
| $50,000 to $74,999 | 1,451 (97.0%) | 45 (3.0%) |
| $75,000 to $99,999 | 600 (100.0%) | 0 (0.0%) |
| $100,000 and over | 1,532 (91.8%) | 137 (8.2%) |
Public vs Private Health Insurance Coverage by Age in Bland County
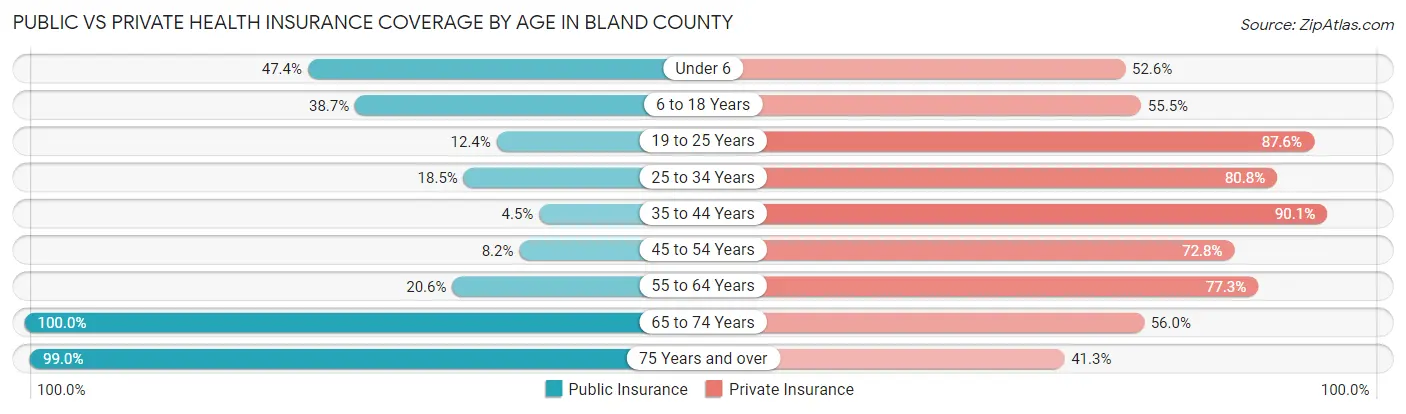
| Age Bracket | Public Insurance | Private Insurance |
| Under 6 | 194 (47.4%) | 215 (52.6%) |
| 6 to 18 Years | 259 (38.7%) | 372 (55.5%) |
| 19 to 25 Years | 29 (12.4%) | 205 (87.6%) |
| 25 to 34 Years | 101 (18.5%) | 441 (80.8%) |
| 35 to 44 Years | 28 (4.5%) | 561 (90.0%) |
| 45 to 54 Years | 53 (8.2%) | 472 (72.8%) |
| 55 to 64 Years | 165 (20.6%) | 618 (77.2%) |
| 65 to 74 Years | 778 (100.0%) | 436 (56.0%) |
| 75 Years and over | 585 (99.0%) | 244 (41.3%) |
| Total | 2,192 (41.4%) | 3,564 (67.3%) |
Disability Status by Sex by Age in Bland County
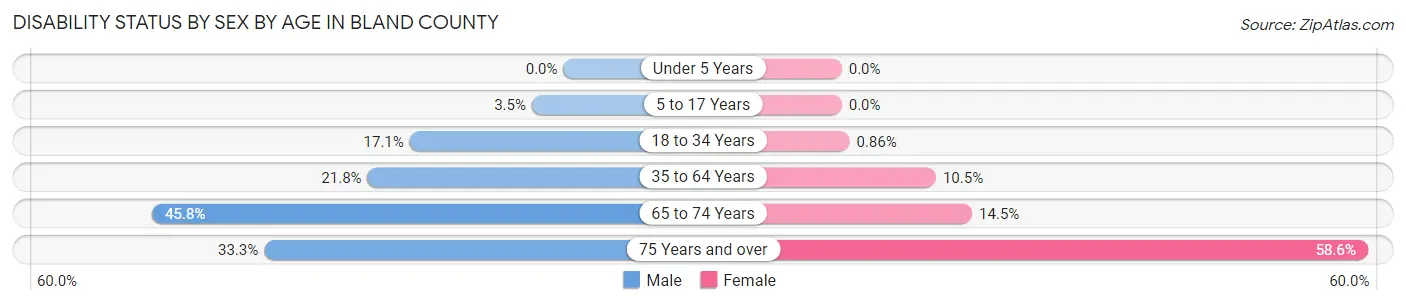
| Age Bracket | Male | Female |
| Under 5 Years | 0 (0.0%) | 0 (0.0%) |
| 5 to 17 Years | 12 (3.5%) | 0 (0.0%) |
| 18 to 34 Years | 76 (17.1%) | 4 (0.9%) |
| 35 to 64 Years | 223 (21.8%) | 110 (10.5%) |
| 65 to 74 Years | 164 (45.8%) | 61 (14.5%) |
| 75 Years and over | 90 (33.3%) | 188 (58.6%) |
Disability Class by Sex by Age in Bland County
Disability Class: Hearing Difficulty
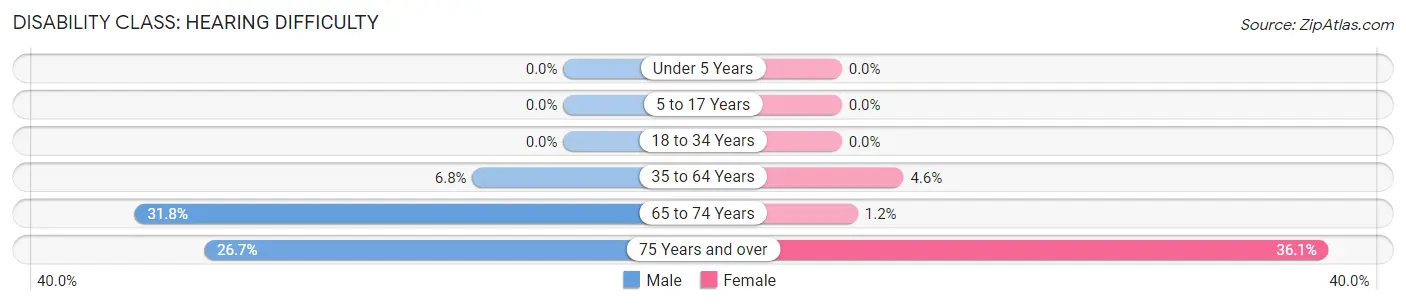
| Age Bracket | Male | Female |
| Under 5 Years | 0 (0.0%) | 0 (0.0%) |
| 5 to 17 Years | 0 (0.0%) | 0 (0.0%) |
| 18 to 34 Years | 0 (0.0%) | 0 (0.0%) |
| 35 to 64 Years | 69 (6.8%) | 48 (4.6%) |
| 65 to 74 Years | 114 (31.8%) | 5 (1.2%) |
| 75 Years and over | 72 (26.7%) | 116 (36.1%) |
Disability Class: Vision Difficulty
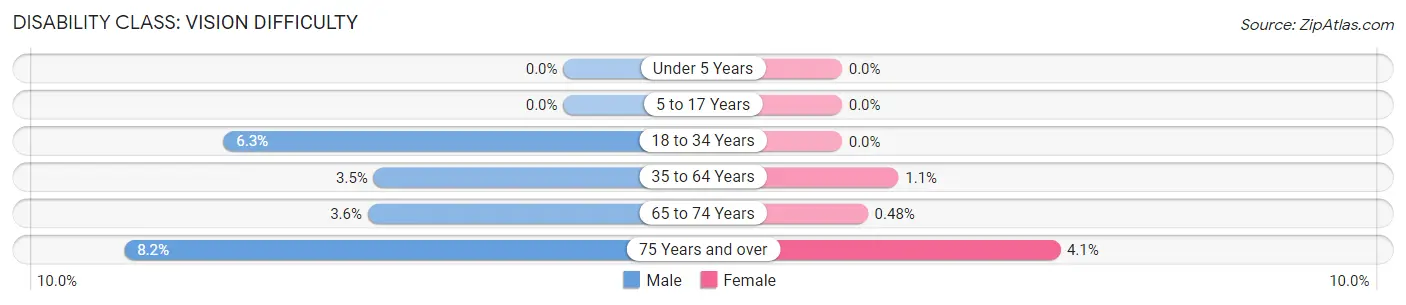
| Age Bracket | Male | Female |
| Under 5 Years | 0 (0.0%) | 0 (0.0%) |
| 5 to 17 Years | 0 (0.0%) | 0 (0.0%) |
| 18 to 34 Years | 28 (6.3%) | 0 (0.0%) |
| 35 to 64 Years | 36 (3.5%) | 11 (1.1%) |
| 65 to 74 Years | 13 (3.6%) | 2 (0.5%) |
| 75 Years and over | 22 (8.2%) | 13 (4.1%) |
Disability Class: Cognitive Difficulty
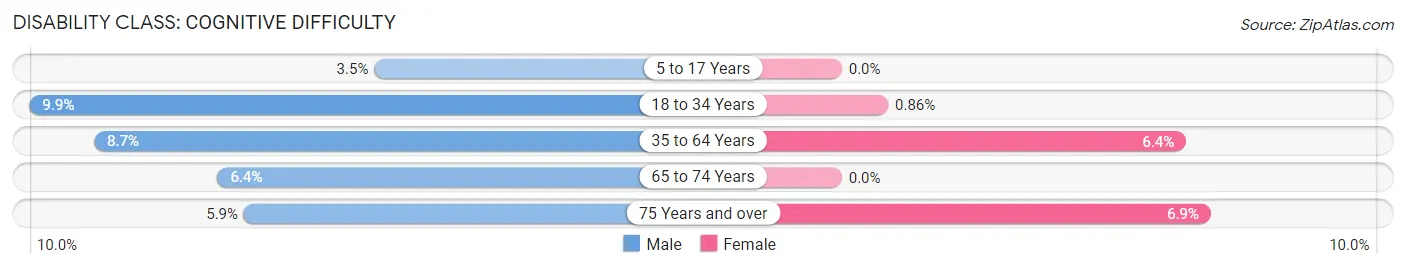
| Age Bracket | Male | Female |
| 5 to 17 Years | 12 (3.5%) | 0 (0.0%) |
| 18 to 34 Years | 44 (9.9%) | 4 (0.9%) |
| 35 to 64 Years | 89 (8.7%) | 67 (6.4%) |
| 65 to 74 Years | 23 (6.4%) | 0 (0.0%) |
| 75 Years and over | 16 (5.9%) | 22 (6.9%) |
Disability Class: Ambulatory Difficulty
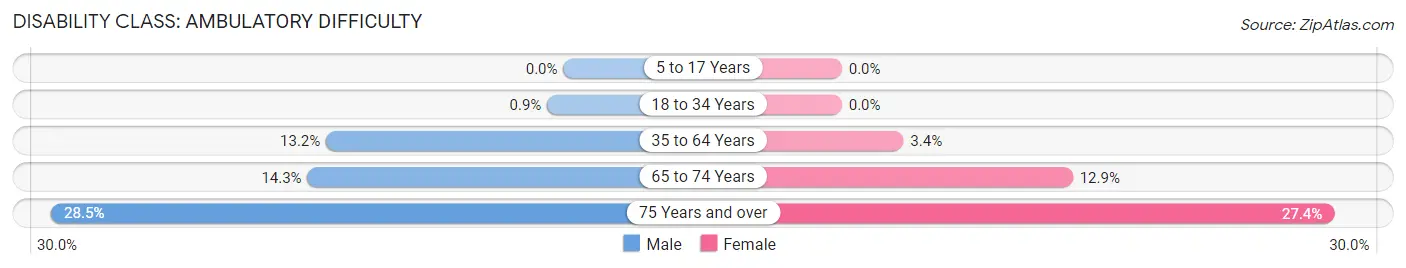
| Age Bracket | Male | Female |
| 5 to 17 Years | 0 (0.0%) | 0 (0.0%) |
| 18 to 34 Years | 4 (0.9%) | 0 (0.0%) |
| 35 to 64 Years | 135 (13.2%) | 36 (3.4%) |
| 65 to 74 Years | 51 (14.2%) | 54 (12.9%) |
| 75 Years and over | 77 (28.5%) | 88 (27.4%) |
Disability Class: Self-Care Difficulty
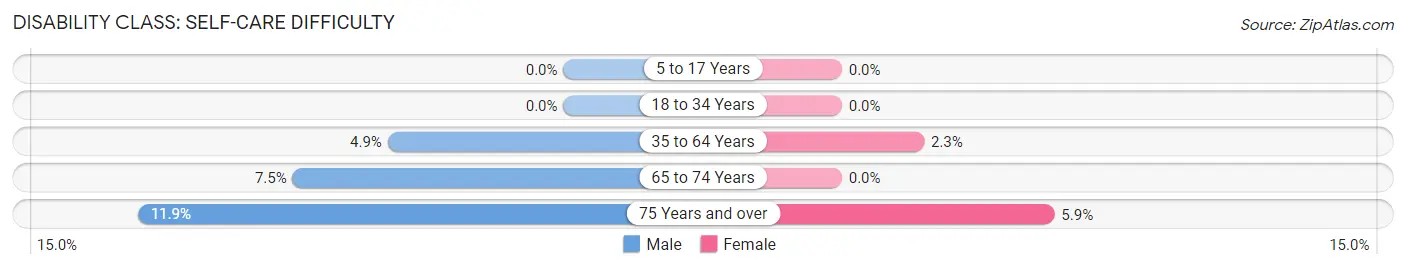
| Age Bracket | Male | Female |
| 5 to 17 Years | 0 (0.0%) | 0 (0.0%) |
| 18 to 34 Years | 0 (0.0%) | 0 (0.0%) |
| 35 to 64 Years | 50 (4.9%) | 24 (2.3%) |
| 65 to 74 Years | 27 (7.5%) | 0 (0.0%) |
| 75 Years and over | 32 (11.8%) | 19 (5.9%) |
Technology Access in Bland County
Computing Device Access in Bland County
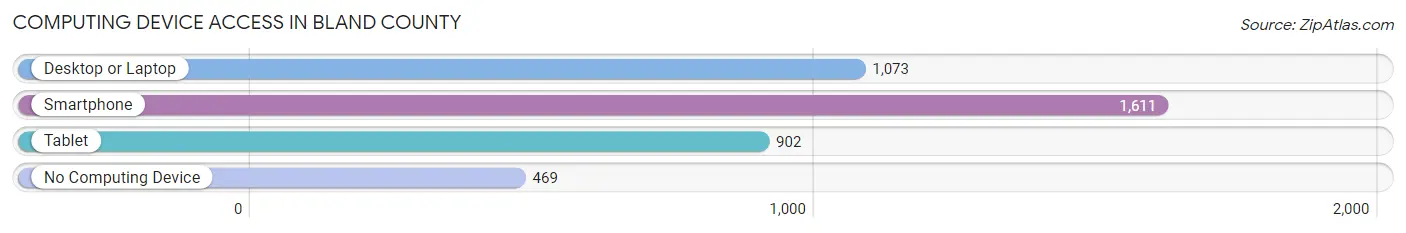
| Device Type | # Households | % Households |
| Desktop or Laptop | 1,073 | 48.0% |
| Smartphone | 1,611 | 72.1% |
| Tablet | 902 | 40.4% |
| No Computing Device | 469 | 21.0% |
| Total | 2,235 | 100.0% |
Internet Access in Bland County
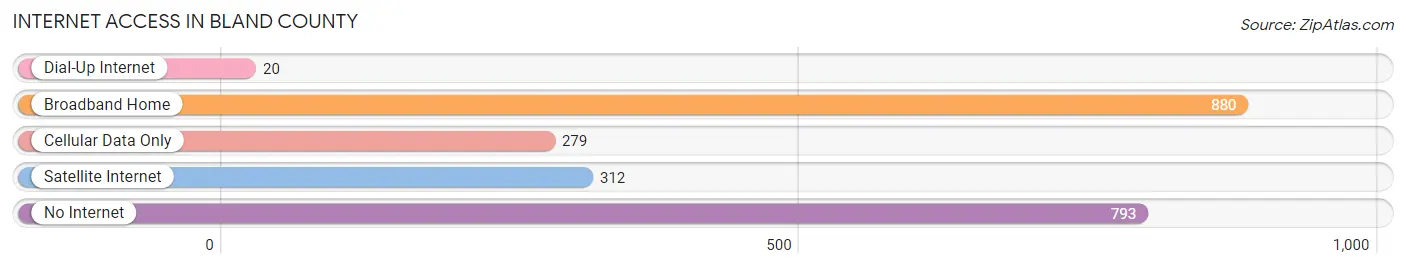
| Internet Type | # Households | % Households |
| Dial-Up Internet | 20 | 0.9% |
| Broadband Home | 880 | 39.4% |
| Cellular Data Only | 279 | 12.5% |
| Satellite Internet | 312 | 14.0% |
| No Internet | 793 | 35.5% |
| Total | 2,235 | 100.0% |
Bland County Summary
Bland County is located in the southwestern part of Virginia, in the Appalachian Mountains. It is bordered by Wythe County to the north, Tazewell County to the east, Giles County to the south, and Pulaski County to the west. Bland County was formed in 1861 from parts of Wythe and Tazewell counties. The county was named for Richard Bland, a Virginia statesman and signer of the Declaration of Independence.
Geography
Bland County covers an area of approximately 437 square miles. The terrain is mostly mountainous, with elevations ranging from 1,000 to 3,000 feet. The county is drained by the New River, which forms the northern boundary of the county. The county is also home to several small streams, including Wolf Creek, Little Wolf Creek, and Big Reed Island Creek.
The county is home to several state parks, including Wolf Creek State Park, Little Wolf Creek State Park, and Big Reed Island State Park. The county also contains several historic sites, including the Bland County Courthouse, the Bland County Jail, and the Bland County Courthouse Museum.
Demographics
As of the 2010 census, Bland County had a population of 6,824. The racial makeup of the county was 95.3% White, 2.3% African American, 0.3% Native American, 0.2% Asian, 0.1% Pacific Islander, 0.7% from other races, and 0.9% from two or more races. Hispanic or Latino of any race were 1.7% of the population.
The median income for a household in the county was $30,938, and the median income for a family was $37,917. The per capita income for the county was $16,845. About 17.2% of families and 21.2% of the population were below the poverty line, including 28.2% of those under age 18 and 16.2% of those age 65 or over.
Economy
Bland County’s economy is largely based on agriculture and tourism. The county is home to several farms, which produce a variety of crops, including corn, soybeans, hay, and tobacco. The county is also home to several wineries, which produce a variety of wines.
Tourism is an important part of the county’s economy. The county is home to several state parks, which attract visitors from all over the region. The county is also home to several historic sites, which attract visitors interested in the county’s history.
Conclusion
Bland County is a rural county located in the southwestern part of Virginia. The county is home to several state parks, historic sites, and wineries, which attract visitors from all over the region. The county’s economy is largely based on agriculture and tourism. The county has a population of 6,824, and the median income for a household is $30,938.
Common Questions
What is Per Capita Income in Bland County?
Per Capita income in Bland County is $27,904.
What is the Median Family Income in Bland County?
Median Family Income in Bland County is $67,350.
What is the Median Household income in Bland County?
Median Household Income in Bland County is $59,901.
What is Income or Wage Gap in Bland County?
Income or Wage Gap in Bland County is 10.3%.
Women in Bland County earn 89.7 cents for every dollar earned by a man.
What is Inequality or Gini Index in Bland County?
Inequality or Gini Index in Bland County is 0.38.
What is the Total Population of Bland County?
Total Population of Bland County is 6,241.
What is the Total Male Population of Bland County?
Total Male Population of Bland County is 3,540.
What is the Total Female Population of Bland County?
Total Female Population of Bland County is 2,701.
What is the Ratio of Males per 100 Females in Bland County?
There are 131.06 Males per 100 Females in Bland County.
What is the Ratio of Females per 100 Males in Bland County?
There are 76.30 Females per 100 Males in Bland County.
What is the Median Population Age in Bland County?
Median Population Age in Bland County is 46.4 Years.
What is the Average Family Size in Bland County
Average Family Size in Bland County is 3.0 People.
What is the Average Household Size in Bland County
Average Household Size in Bland County is 2.4 People.
How Large is the Labor Force in Bland County?
There are 2,359 People in the Labor Forcein in Bland County.
What is the Percentage of People in the Labor Force in Bland County?
43.5% of People are in the Labor Force in Bland County.
What is the Unemployment Rate in Bland County?
Unemployment Rate in Bland County is 3.3%.