Bath County, VA Map & Demographics
Bath County Map
Bath County Overview
$33,856
PER CAPITA INCOME
$75,346
AVG FAMILY INCOME
$55,699
AVG HOUSEHOLD INCOME
6.2%
WAGE / INCOME GAP [ % ]
93.8¢/ $1
WAGE / INCOME GAP [ $ ]
$3,878
FAMILY INCOME DEFICIT
0.47
INEQUALITY / GINI INDEX
4,177
TOTAL POPULATION
2,073
MALE POPULATION
2,104
FEMALE POPULATION
98.53
MALES / 100 FEMALES
101.50
FEMALES / 100 MALES
51.8
MEDIAN AGE
2.7
AVG FAMILY SIZE
2.1
AVG HOUSEHOLD SIZE
1,806
LABOR FORCE [ PEOPLE ]
51.1%
PERCENT IN LABOR FORCE
2.0%
UNEMPLOYMENT RATE
Bath County Area Codes
Income in Bath County
Income Overview in Bath County
Per Capita Income in Bath County is $33,856, while median incomes of families and households are $75,346 and $55,699 respectively.
| Characteristic | Number | Measure |
| Per Capita Income | 4,177 | $33,856 |
| Median Family Income | 1,072 | $75,346 |
| Mean Family Income | 1,072 | $96,172 |
| Median Household Income | 1,905 | $55,699 |
| Mean Household Income | 1,905 | $74,381 |
| Income Deficit | 1,072 | $3,878 |
| Wage / Income Gap (%) | 4,177 | 6.24% |
| Wage / Income Gap ($) | 4,177 | 93.76¢ per $1 |
| Gini / Inequality Index | 4,177 | 0.47 |
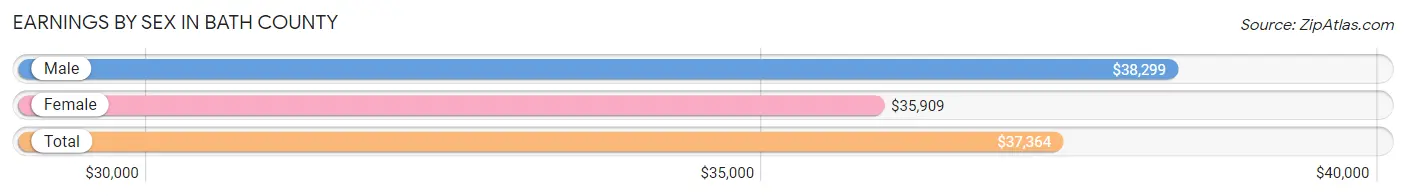
Earnings by Sex in Bath County
Average Earnings in Bath County are $37,364, $38,299 for men and $35,909 for women, a difference of 6.2%.
| Sex | Number | Average Earnings |
| Male | 991 (53.4%) | $38,299 |
| Female | 866 (46.6%) | $35,909 |
| Total | 1,857 (100.0%) | $37,364 |
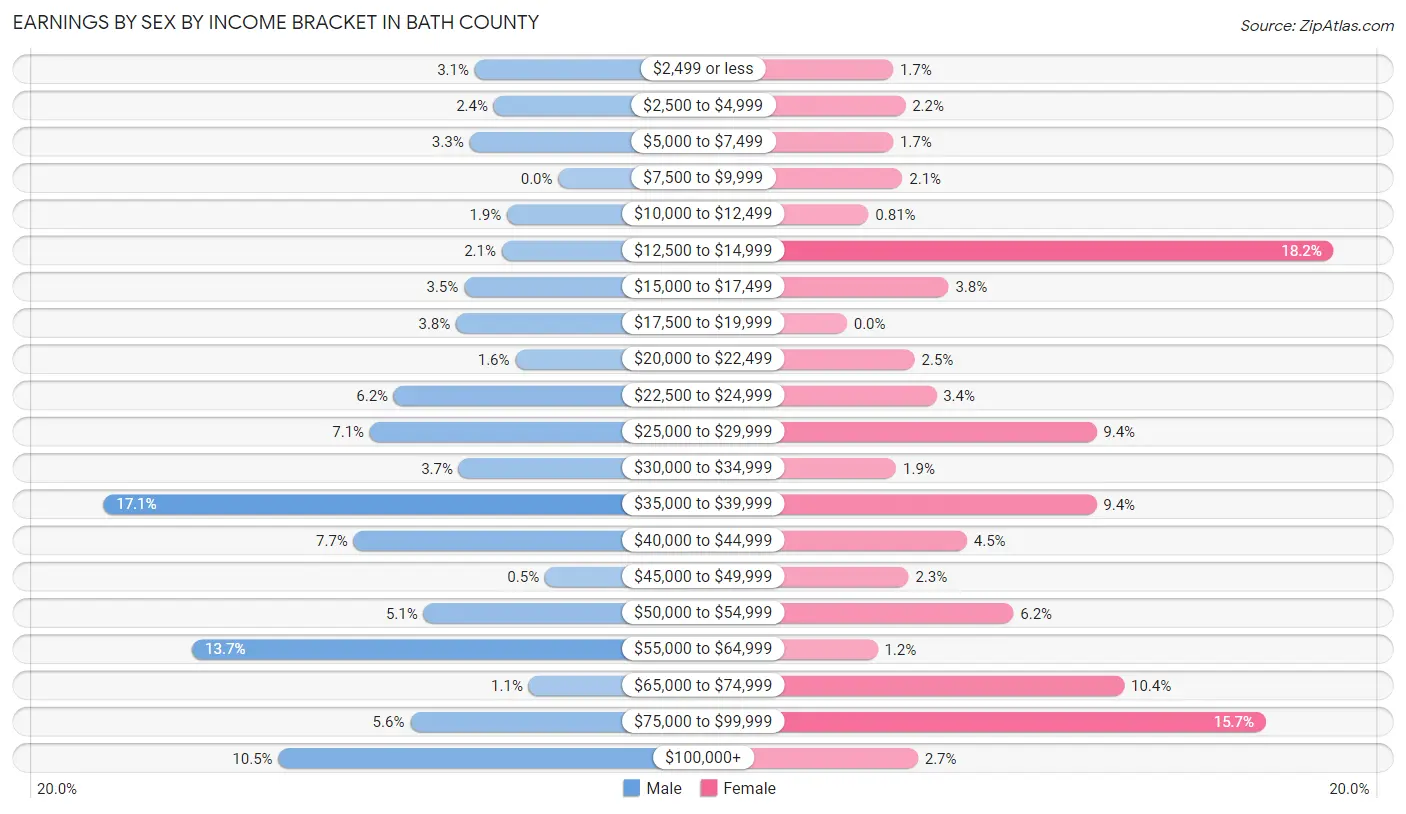
Earnings by Sex by Income Bracket in Bath County
The most common earnings brackets in Bath County are $35,000 to $39,999 for men (169 | 17.1%) and $12,500 to $14,999 for women (158 | 18.2%).
| Income | Male | Female |
| $2,499 or less | 31 (3.1%) | 15 (1.7%) |
| $2,500 to $4,999 | 24 (2.4%) | 19 (2.2%) |
| $5,000 to $7,499 | 33 (3.3%) | 15 (1.7%) |
| $7,500 to $9,999 | 0 (0.0%) | 18 (2.1%) |
| $10,000 to $12,499 | 19 (1.9%) | 7 (0.8%) |
| $12,500 to $14,999 | 21 (2.1%) | 158 (18.2%) |
| $15,000 to $17,499 | 35 (3.5%) | 33 (3.8%) |
| $17,500 to $19,999 | 38 (3.8%) | 0 (0.0%) |
| $20,000 to $22,499 | 16 (1.6%) | 22 (2.5%) |
| $22,500 to $24,999 | 61 (6.2%) | 29 (3.4%) |
| $25,000 to $29,999 | 70 (7.1%) | 81 (9.3%) |
| $30,000 to $34,999 | 37 (3.7%) | 16 (1.8%) |
| $35,000 to $39,999 | 169 (17.1%) | 81 (9.3%) |
| $40,000 to $44,999 | 76 (7.7%) | 39 (4.5%) |
| $45,000 to $49,999 | 5 (0.5%) | 20 (2.3%) |
| $50,000 to $54,999 | 50 (5.1%) | 54 (6.2%) |
| $55,000 to $64,999 | 136 (13.7%) | 10 (1.1%) |
| $65,000 to $74,999 | 11 (1.1%) | 90 (10.4%) |
| $75,000 to $99,999 | 55 (5.6%) | 136 (15.7%) |
| $100,000+ | 104 (10.5%) | 23 (2.7%) |
| Total | 991 (100.0%) | 866 (100.0%) |
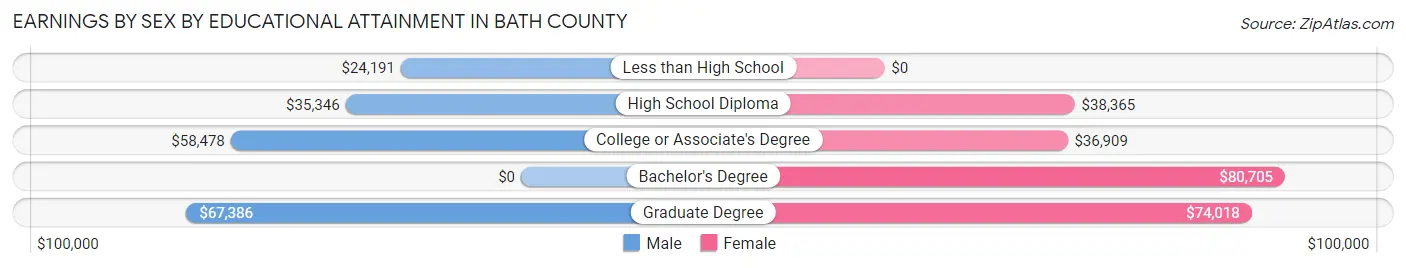
Earnings by Sex by Educational Attainment in Bath County
Average earnings in Bath County are $39,084 for men and $42,212 for women, a difference of 7.4%. Men with an educational attainment of graduate degree enjoy the highest average annual earnings of $67,386, while those with less than high school education earn the least with $24,191. Women with an educational attainment of bachelor's degree earn the most with the average annual earnings of $80,705, while those with college or associate's degree education have the smallest earnings of $36,909.
| Educational Attainment | Male Income | Female Income |
| Less than High School | $24,191 | $0 |
| High School Diploma | $35,346 | $38,365 |
| College or Associate's Degree | $58,478 | $36,909 |
| Bachelor's Degree | - | - |
| Graduate Degree | $67,386 | $74,018 |
| Total | $39,084 | $42,212 |
Family Income in Bath County
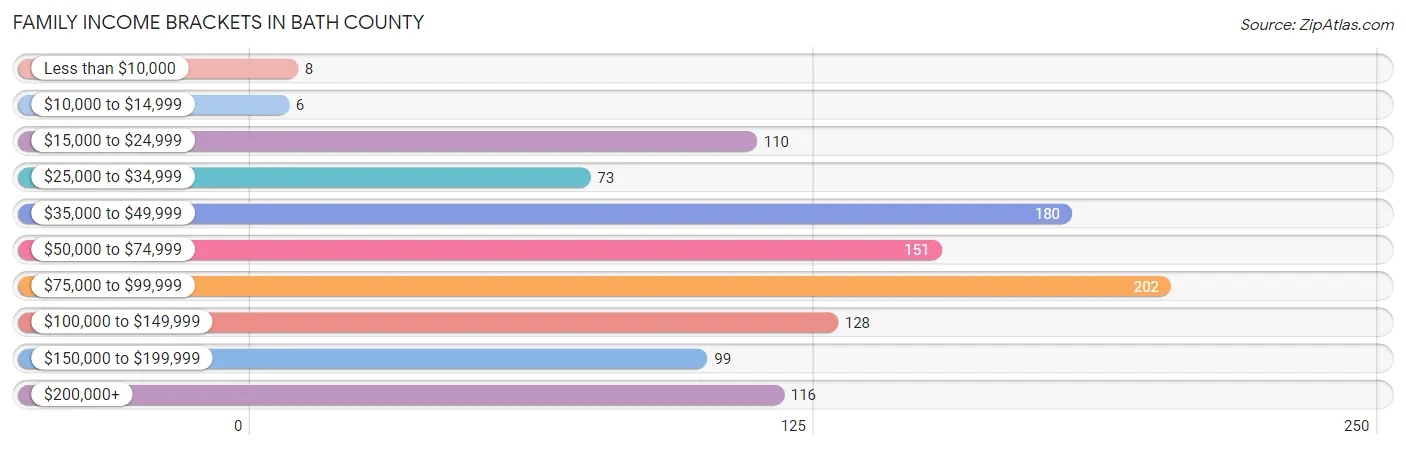
Family Income Brackets in Bath County
According to the Bath County family income data, there are 202 families falling into the $75,000 to $99,999 income range, which is the most common income bracket and makes up 18.8% of all families. Conversely, the $10,000 to $14,999 income bracket is the least frequent group with only 6 families (0.6%) belonging to this category.
| Income Bracket | # Families | % Families |
| Less than $10,000 | 8 | 0.7% |
| $10,000 to $14,999 | 6 | 0.6% |
| $15,000 to $24,999 | 110 | 10.3% |
| $25,000 to $34,999 | 73 | 6.8% |
| $35,000 to $49,999 | 180 | 16.8% |
| $50,000 to $74,999 | 151 | 14.1% |
| $75,000 to $99,999 | 202 | 18.8% |
| $100,000 to $149,999 | 128 | 11.9% |
| $150,000 to $199,999 | 99 | 9.2% |
| $200,000+ | 116 | 10.8% |
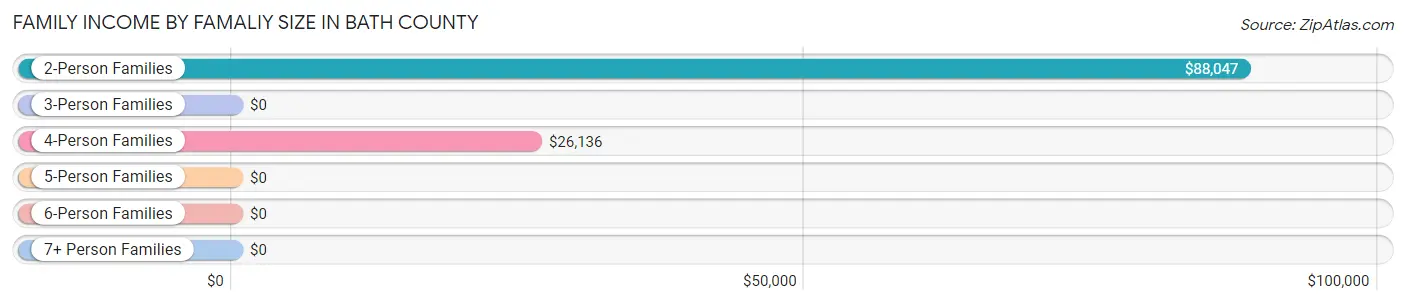
Family Income by Famaliy Size in Bath County
2-person families (670 | 62.5%) account for the highest median family income in Bath County with $88,047 per family, while 2-person families (670 | 62.5%) have the highest median income of $44,024 per family member.
| Income Bracket | # Families | Median Income |
| 2-Person Families | 670 (62.5%) | $88,047 |
| 3-Person Families | 282 (26.3%) | $0 |
| 4-Person Families | 42 (3.9%) | $26,136 |
| 5-Person Families | 27 (2.5%) | $0 |
| 6-Person Families | 51 (4.8%) | $0 |
| 7+ Person Families | 0 (0.0%) | $0 |
| Total | 1,072 (100.0%) | $75,346 |
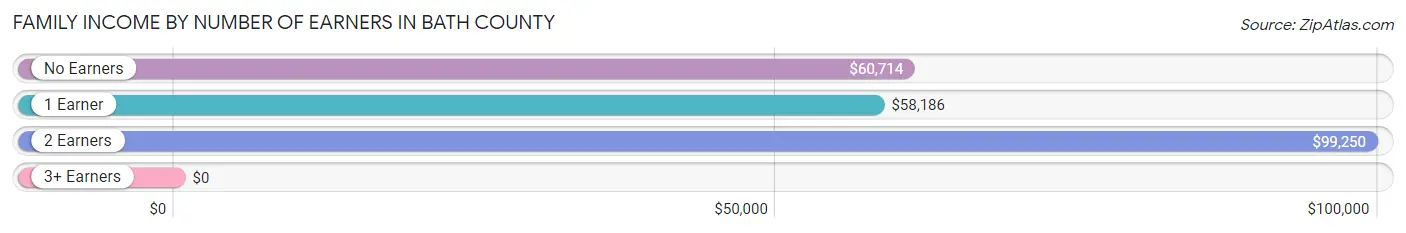
Family Income by Number of Earners in Bath County
| Number of Earners | # Families | Median Income |
| No Earners | 312 (29.1%) | $60,714 |
| 1 Earner | 350 (32.7%) | $58,186 |
| 2 Earners | 386 (36.0%) | $99,250 |
| 3+ Earners | 24 (2.2%) | $0 |
| Total | 1,072 (100.0%) | $75,346 |
Household Income in Bath County
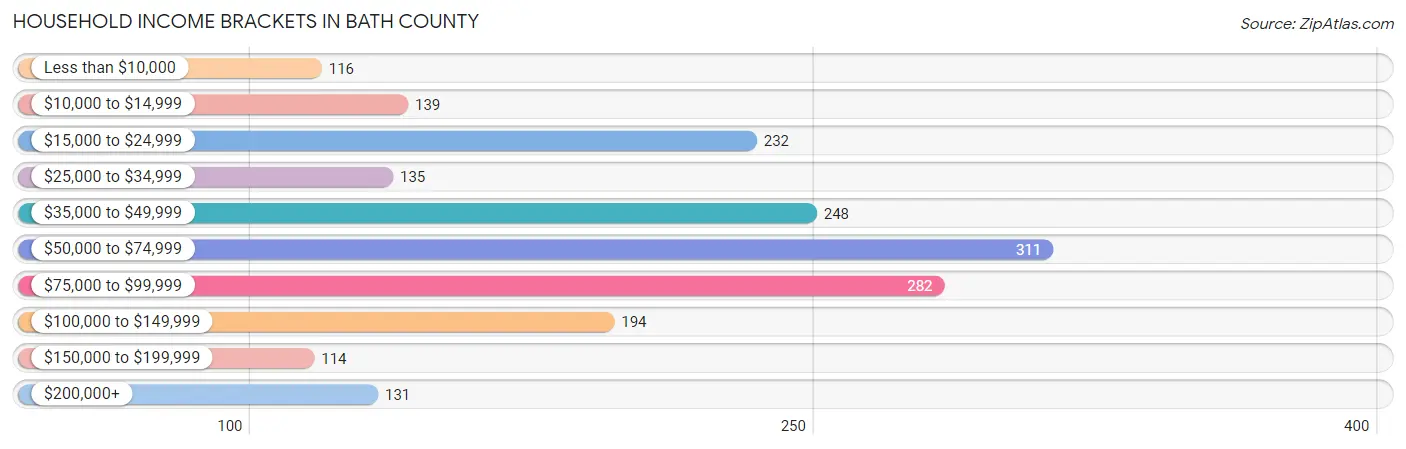
Household Income Brackets in Bath County
With 311 households falling in the category, the $50,000 to $74,999 income range is the most frequent in Bath County, accounting for 16.3% of all households. In contrast, only 114 households (6.0%) fall into the $150,000 to $199,999 income bracket, making it the least populous group.
| Income Bracket | # Households | % Households |
| Less than $10,000 | 116 | 6.1% |
| $10,000 to $14,999 | 139 | 7.3% |
| $15,000 to $24,999 | 232 | 12.2% |
| $25,000 to $34,999 | 135 | 7.1% |
| $35,000 to $49,999 | 248 | 13.0% |
| $50,000 to $74,999 | 311 | 16.3% |
| $75,000 to $99,999 | 282 | 14.8% |
| $100,000 to $149,999 | 194 | 10.2% |
| $150,000 to $199,999 | 114 | 6.0% |
| $200,000+ | 131 | 6.9% |
Household Income by Householder Age in Bath County
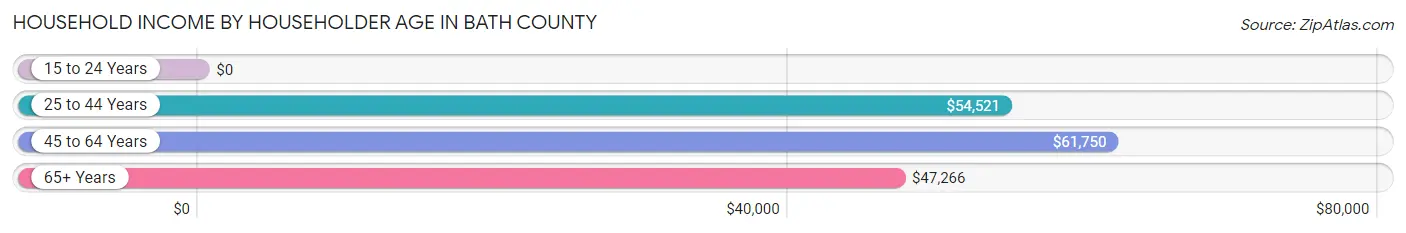
The median household income in Bath County is $55,699, with the highest median household income of $61,750 found in the 45 to 64 years age bracket for the primary householder. A total of 669 households (35.1%) fall into this category. Meanwhile, the 15 to 24 years age bracket for the primary householder has the lowest median household income of $0, with 11 households (0.6%) in this group.
| Income Bracket | # Households | Median Income |
| 15 to 24 Years | 11 (0.6%) | $0 |
| 25 to 44 Years | 534 (28.0%) | $54,521 |
| 45 to 64 Years | 669 (35.1%) | $61,750 |
| 65+ Years | 691 (36.3%) | $47,266 |
| Total | 1,905 (100.0%) | $55,699 |
Poverty in Bath County
Income Below Poverty by Sex and Age in Bath County
With 30.0% poverty level for males and 17.2% for females among the residents of Bath County, 6 to 11 year old males and 12 to 14 year old females are the most vulnerable to poverty, with 128 males (70.7%) and 20 females (32.3%) in their respective age groups living below the poverty level.
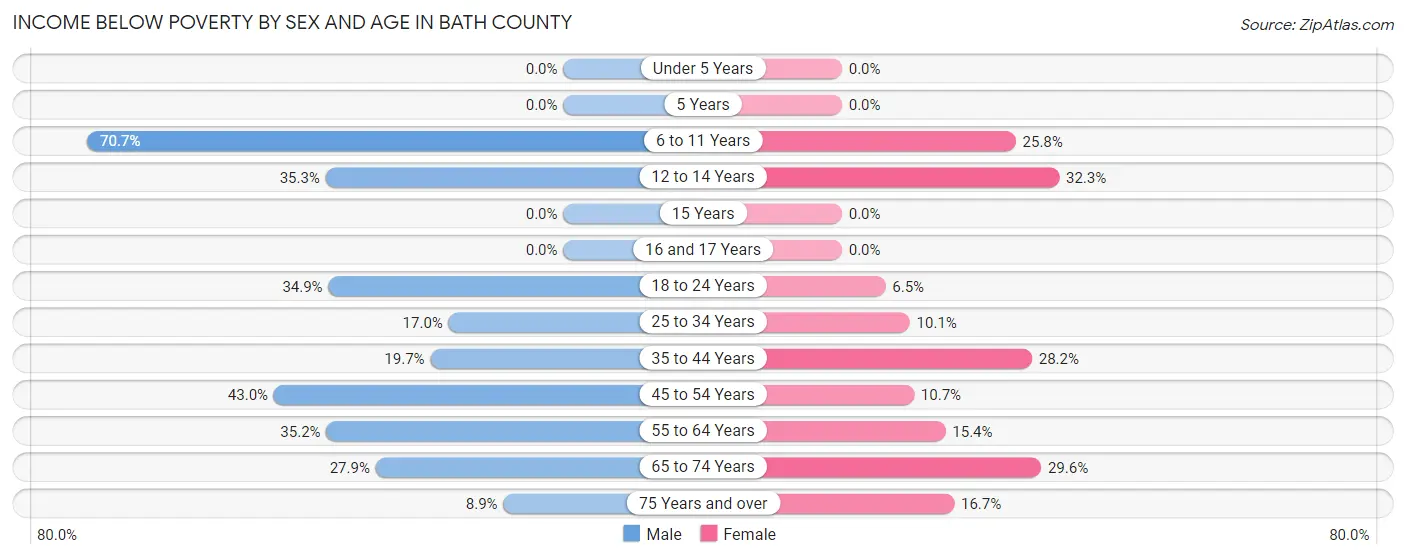
| Age Bracket | Male | Female |
| Under 5 Years | 0 (0.0%) | 0 (0.0%) |
| 5 Years | 0 (0.0%) | 0 (0.0%) |
| 6 to 11 Years | 128 (70.7%) | 16 (25.8%) |
| 12 to 14 Years | 12 (35.3%) | 20 (32.3%) |
| 15 Years | 0 (0.0%) | 0 (0.0%) |
| 16 and 17 Years | 0 (0.0%) | 0 (0.0%) |
| 18 to 24 Years | 30 (34.9%) | 15 (6.5%) |
| 25 to 34 Years | 31 (17.0%) | 26 (10.1%) |
| 35 to 44 Years | 45 (19.7%) | 66 (28.2%) |
| 45 to 54 Years | 98 (43.0%) | 21 (10.7%) |
| 55 to 64 Years | 159 (35.2%) | 34 (15.4%) |
| 65 to 74 Years | 90 (27.9%) | 105 (29.6%) |
| 75 Years and over | 17 (8.9%) | 43 (16.7%) |
| Total | 610 (30.0%) | 346 (17.2%) |
Income Above Poverty by Sex and Age in Bath County
According to the poverty statistics in Bath County, males aged under 5 years and females aged under 5 years are the age groups that are most secure financially, with 100.0% of males and 100.0% of females in these age groups living above the poverty line.
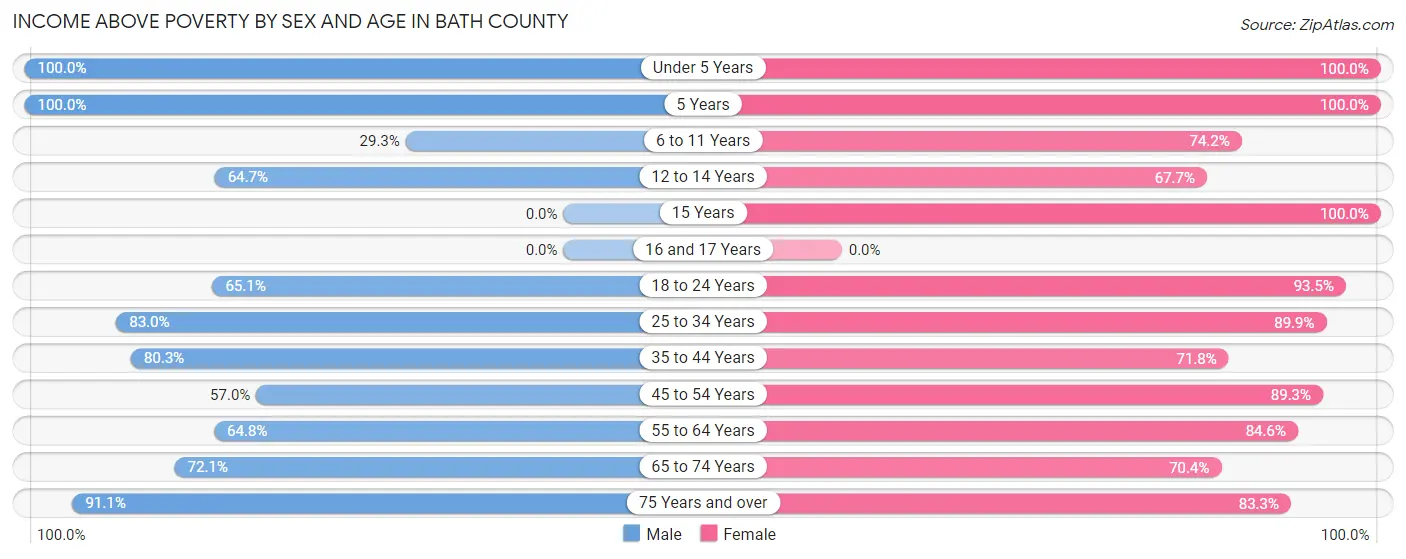
| Age Bracket | Male | Female |
| Under 5 Years | 108 (100.0%) | 92 (100.0%) |
| 5 Years | 18 (100.0%) | 9 (100.0%) |
| 6 to 11 Years | 53 (29.3%) | 46 (74.2%) |
| 12 to 14 Years | 22 (64.7%) | 42 (67.7%) |
| 15 Years | 0 (0.0%) | 30 (100.0%) |
| 16 and 17 Years | 0 (0.0%) | 0 (0.0%) |
| 18 to 24 Years | 56 (65.1%) | 217 (93.5%) |
| 25 to 34 Years | 151 (83.0%) | 232 (89.9%) |
| 35 to 44 Years | 183 (80.3%) | 168 (71.8%) |
| 45 to 54 Years | 130 (57.0%) | 175 (89.3%) |
| 55 to 64 Years | 293 (64.8%) | 187 (84.6%) |
| 65 to 74 Years | 233 (72.1%) | 250 (70.4%) |
| 75 Years and over | 174 (91.1%) | 215 (83.3%) |
| Total | 1,421 (70.0%) | 1,663 (82.8%) |
Income Below Poverty Among Married-Couple Families in Bath County
The poverty statistics for married-couple families in Bath County show that 12.4% or 110 of the total 886 families live below the poverty line. Families with 1 or 2 children have the highest poverty rate of 37.7%, comprising of 81 families. On the other hand, families with no children have the lowest poverty rate of 2.9%, which includes 17 families.
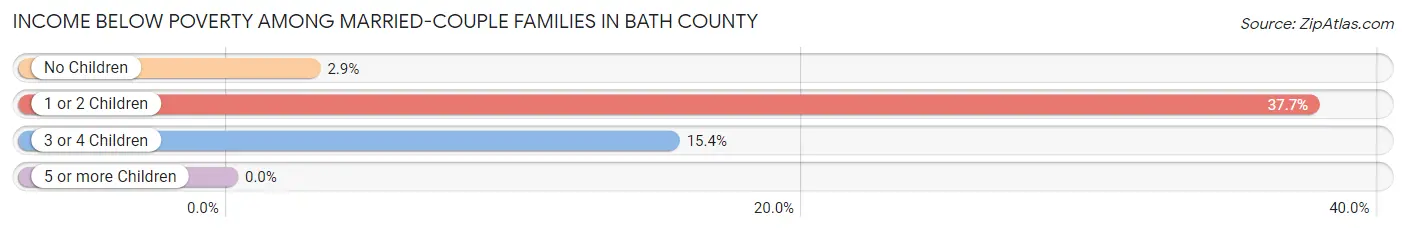
| Children | Above Poverty | Below Poverty |
| No Children | 576 (97.1%) | 17 (2.9%) |
| 1 or 2 Children | 134 (62.3%) | 81 (37.7%) |
| 3 or 4 Children | 66 (84.6%) | 12 (15.4%) |
| 5 or more Children | 0 (0.0%) | 0 (0.0%) |
| Total | 776 (87.6%) | 110 (12.4%) |
Income Below Poverty Among Single-Parent Households in Bath County
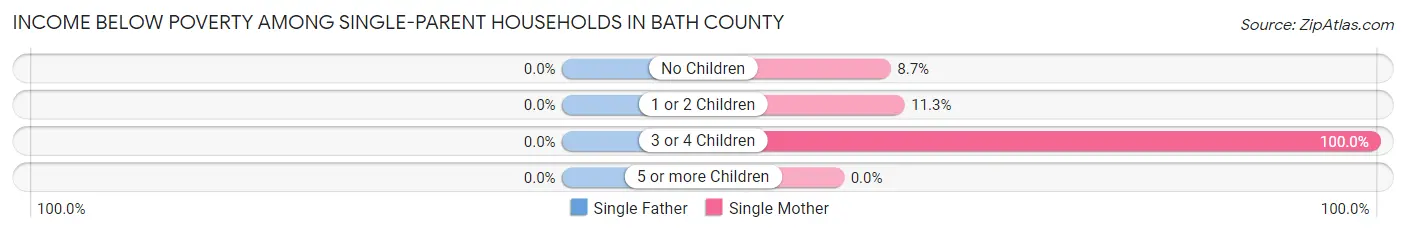
| Children | Single Father | Single Mother |
| No Children | 0 (0.0%) | 6 (8.7%) |
| 1 or 2 Children | 0 (0.0%) | 7 (11.3%) |
| 3 or 4 Children | 0 (0.0%) | 11 (100.0%) |
| 5 or more Children | 0 (0.0%) | 0 (0.0%) |
| Total | 0 (0.0%) | 24 (16.9%) |
Income Below Poverty Among Married-Couple vs Single-Parent Households in Bath County
The poverty data for Bath County shows that 110 of the married-couple family households (12.4%) and 24 of the single-parent households (12.9%) are living below the poverty level. Within the married-couple family households, those with 1 or 2 children have the highest poverty rate, with 81 households (37.7%) falling below the poverty line. Among the single-parent households, those with 3 or 4 children have the highest poverty rate, with 11 household (100.0%) living below poverty.
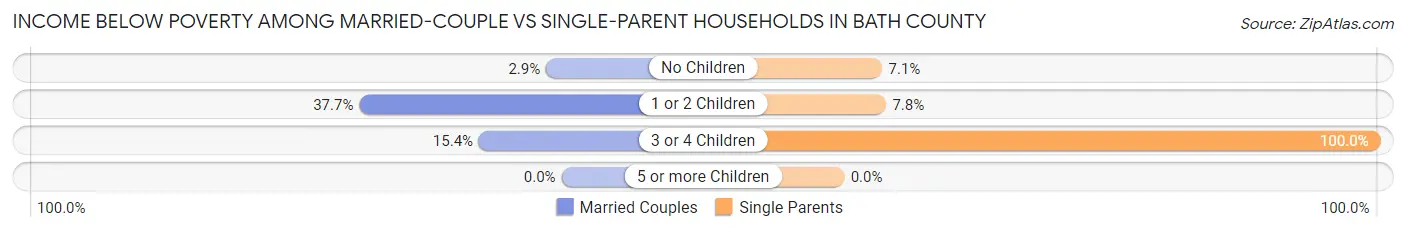
| Children | Married-Couple Families | Single-Parent Households |
| No Children | 17 (2.9%) | 6 (7.1%) |
| 1 or 2 Children | 81 (37.7%) | 7 (7.8%) |
| 3 or 4 Children | 12 (15.4%) | 11 (100.0%) |
| 5 or more Children | 0 (0.0%) | 0 (0.0%) |
| Total | 110 (12.4%) | 24 (12.9%) |
Race in Bath County
The most populous races in Bath County are White / Caucasian (3,909 | 93.6%), Black / African American (202 | 4.8%), and Some other Race (48 | 1.1%).
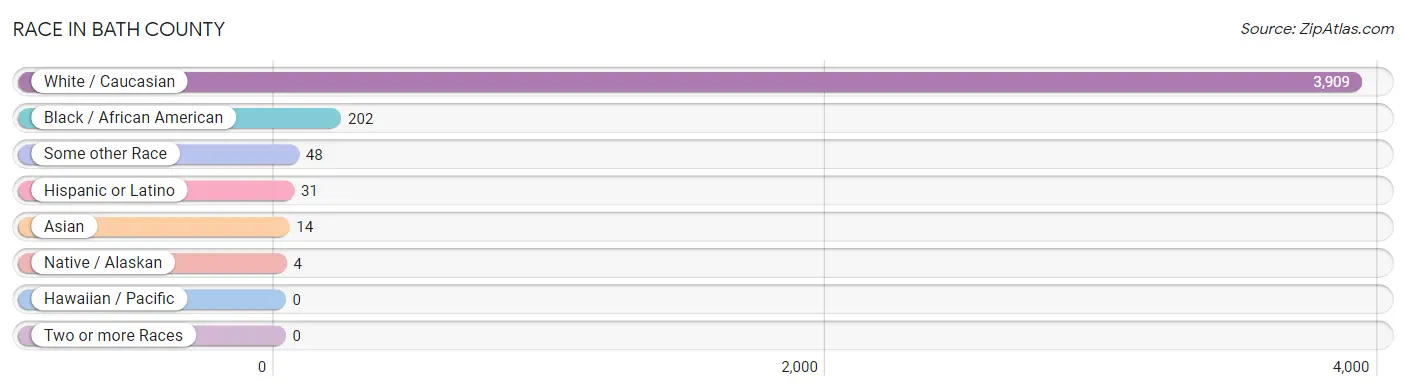
| Race | # Population | % Population |
| Asian | 14 | 0.3% |
| Black / African American | 202 | 4.8% |
| Hawaiian / Pacific | 0 | 0.0% |
| Hispanic or Latino | 31 | 0.7% |
| Native / Alaskan | 4 | 0.1% |
| White / Caucasian | 3,909 | 93.6% |
| Two or more Races | 0 | 0.0% |
| Some other Race | 48 | 1.1% |
| Total | 4,177 | 100.0% |
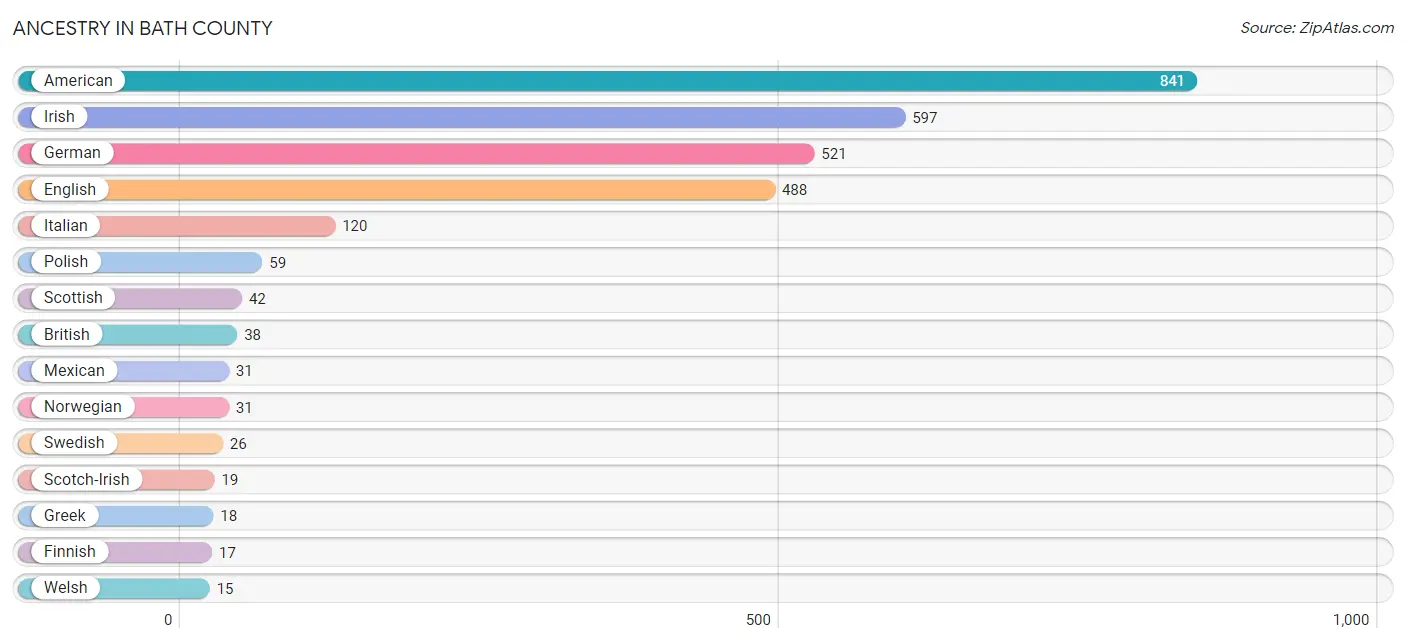
Ancestry in Bath County
The most populous ancestries reported in Bath County are American (841 | 20.1%), Irish (597 | 14.3%), German (521 | 12.5%), English (488 | 11.7%), and Italian (120 | 2.9%), together accounting for 61.4% of all Bath County residents.
| Ancestry | # Population | % Population |
| African | 4 | 0.1% |
| American | 841 | 20.1% |
| British | 38 | 0.9% |
| Cherokee | 4 | 0.1% |
| Eastern European | 7 | 0.2% |
| English | 488 | 11.7% |
| European | 9 | 0.2% |
| Finnish | 17 | 0.4% |
| French Canadian | 6 | 0.1% |
| German | 521 | 12.5% |
| Greek | 18 | 0.4% |
| Hungarian | 11 | 0.3% |
| Irish | 597 | 14.3% |
| Italian | 120 | 2.9% |
| Korean | 14 | 0.3% |
| Lithuanian | 5 | 0.1% |
| Mexican | 31 | 0.7% |
| Norwegian | 31 | 0.7% |
| Polish | 59 | 1.4% |
| Portuguese | 5 | 0.1% |
| Scotch-Irish | 19 | 0.4% |
| Scottish | 42 | 1.0% |
| Subsaharan African | 4 | 0.1% |
| Swedish | 26 | 0.6% |
| Welsh | 15 | 0.4% | View All 25 Rows |
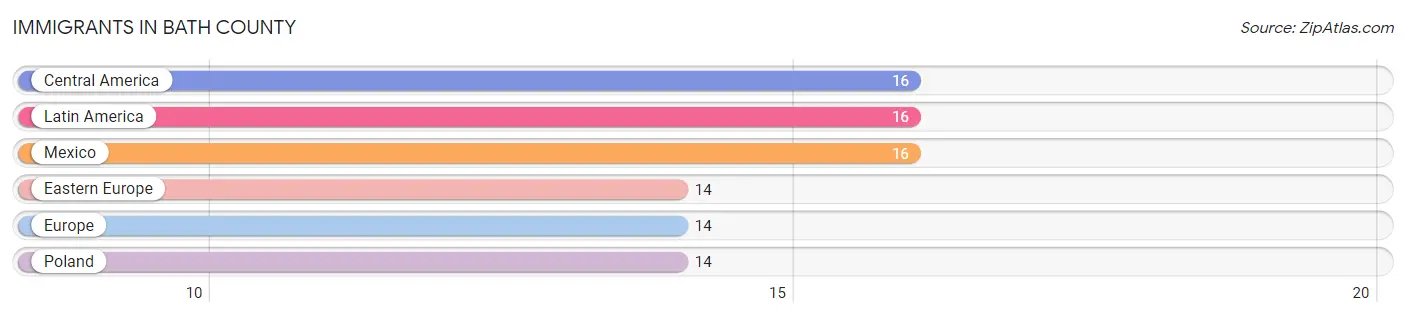
Immigrants in Bath County
The most numerous immigrant groups reported in Bath County came from Central America (16 | 0.4%), Latin America (16 | 0.4%), Mexico (16 | 0.4%), Eastern Europe (14 | 0.3%), and Europe (14 | 0.3%), together accounting for 1.8% of all Bath County residents.
| Immigration Origin | # Population | % Population |
| Central America | 16 | 0.4% |
| Eastern Europe | 14 | 0.3% |
| Europe | 14 | 0.3% |
| Latin America | 16 | 0.4% |
| Mexico | 16 | 0.4% |
| Poland | 14 | 0.3% | View All 6 Rows |
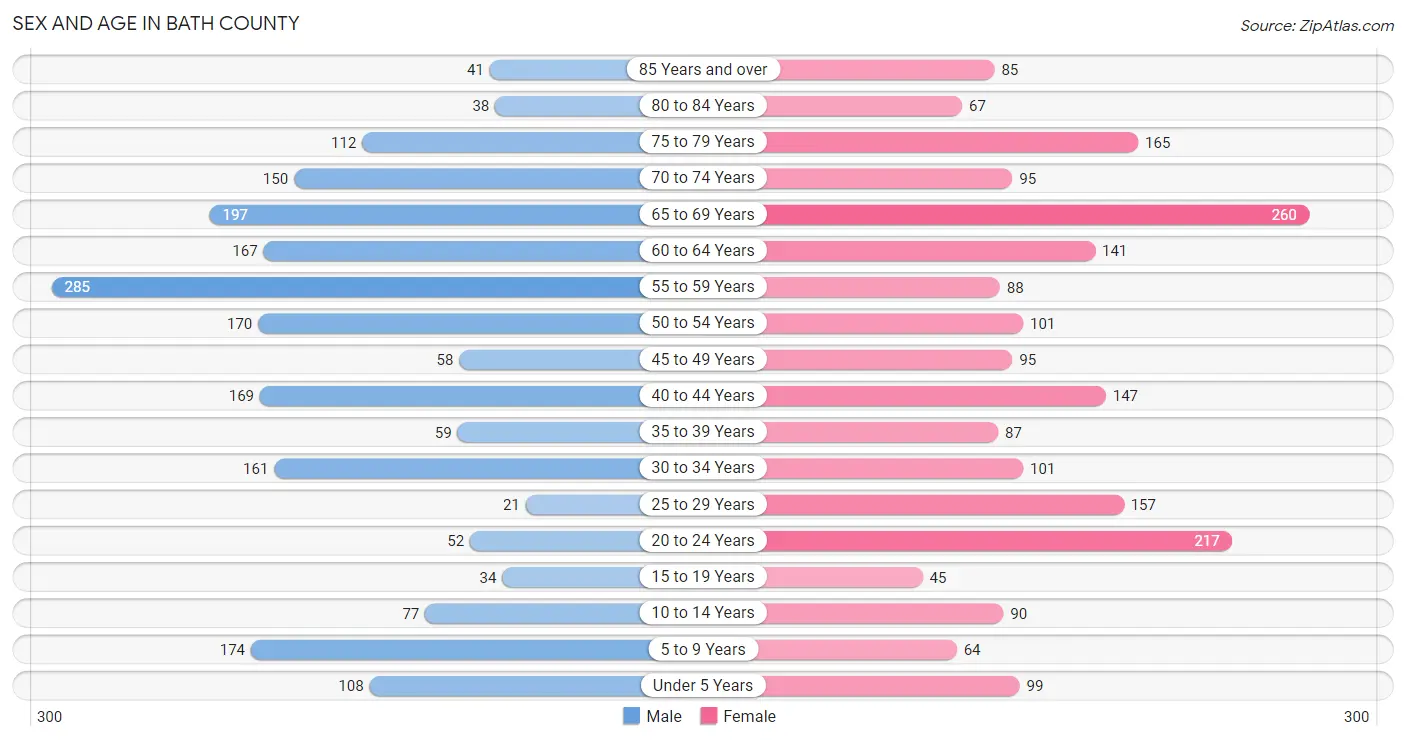
Sex and Age in Bath County
Sex and Age in Bath County
The most populous age groups in Bath County are 55 to 59 Years (285 | 13.8%) for men and 65 to 69 Years (260 | 12.4%) for women.
| Age Bracket | Male | Female |
| Under 5 Years | 108 (5.2%) | 99 (4.7%) |
| 5 to 9 Years | 174 (8.4%) | 64 (3.0%) |
| 10 to 14 Years | 77 (3.7%) | 90 (4.3%) |
| 15 to 19 Years | 34 (1.6%) | 45 (2.1%) |
| 20 to 24 Years | 52 (2.5%) | 217 (10.3%) |
| 25 to 29 Years | 21 (1.0%) | 157 (7.5%) |
| 30 to 34 Years | 161 (7.8%) | 101 (4.8%) |
| 35 to 39 Years | 59 (2.9%) | 87 (4.1%) |
| 40 to 44 Years | 169 (8.2%) | 147 (7.0%) |
| 45 to 49 Years | 58 (2.8%) | 95 (4.5%) |
| 50 to 54 Years | 170 (8.2%) | 101 (4.8%) |
| 55 to 59 Years | 285 (13.8%) | 88 (4.2%) |
| 60 to 64 Years | 167 (8.1%) | 141 (6.7%) |
| 65 to 69 Years | 197 (9.5%) | 260 (12.4%) |
| 70 to 74 Years | 150 (7.2%) | 95 (4.5%) |
| 75 to 79 Years | 112 (5.4%) | 165 (7.8%) |
| 80 to 84 Years | 38 (1.8%) | 67 (3.2%) |
| 85 Years and over | 41 (2.0%) | 85 (4.0%) |
| Total | 2,073 (100.0%) | 2,104 (100.0%) |
Families and Households in Bath County
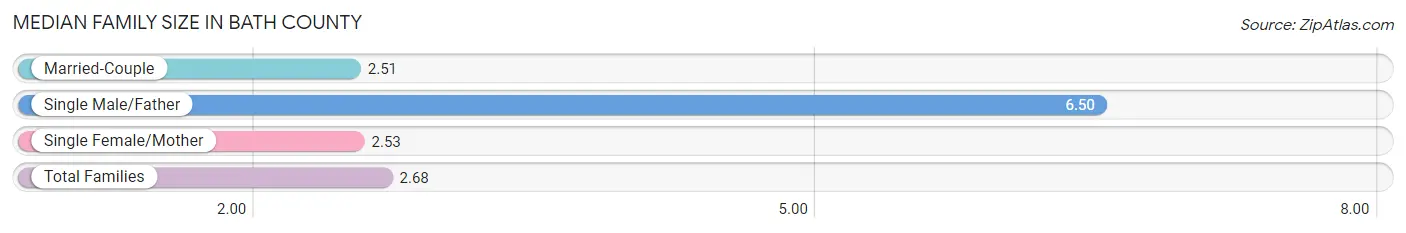
Median Family Size in Bath County
The median family size in Bath County is 2.68 persons per family, with single male/father families (44 | 4.1%) accounting for the largest median family size of 6.5 persons per family. On the other hand, married-couple families (886 | 82.7%) represent the smallest median family size with 2.51 persons per family.
| Family Type | # Families | Family Size |
| Married-Couple | 886 (82.7%) | 2.51 |
| Single Male/Father | 44 (4.1%) | 6.50 |
| Single Female/Mother | 142 (13.3%) | 2.53 |
| Total Families | 1,072 (100.0%) | 2.68 |
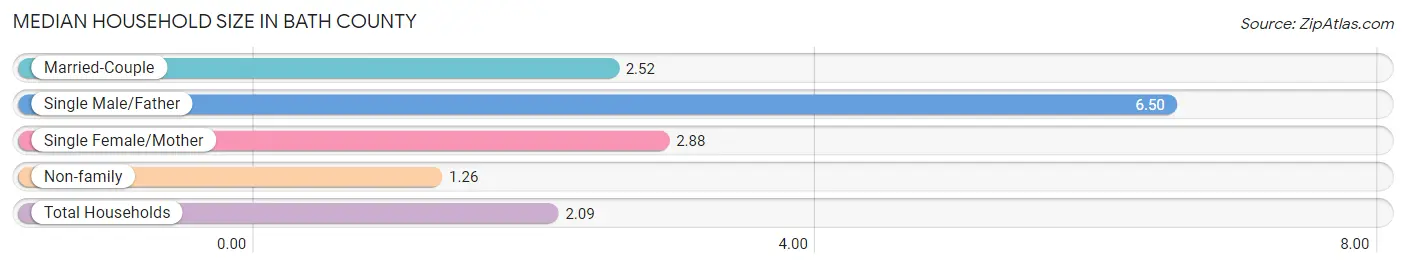
Median Household Size in Bath County
The median household size in Bath County is 2.09 persons per household, with single male/father households (44 | 2.3%) accounting for the largest median household size of 6.5 persons per household. non-family households (833 | 43.7%) represent the smallest median household size with 1.26 persons per household.
| Household Type | # Households | Household Size |
| Married-Couple | 886 (46.5%) | 2.52 |
| Single Male/Father | 44 (2.3%) | 6.50 |
| Single Female/Mother | 142 (7.4%) | 2.88 |
| Non-family | 833 (43.7%) | 1.26 |
| Total Households | 1,905 (100.0%) | 2.09 |
Household Size by Marriage Status in Bath County
Out of a total of 1,905 households in Bath County, 1,072 (56.3%) are family households, while 833 (43.7%) are nonfamily households. The most numerous type of family households are 2-person households, comprising 637, and the most common type of nonfamily households are 1-person households, comprising 662.
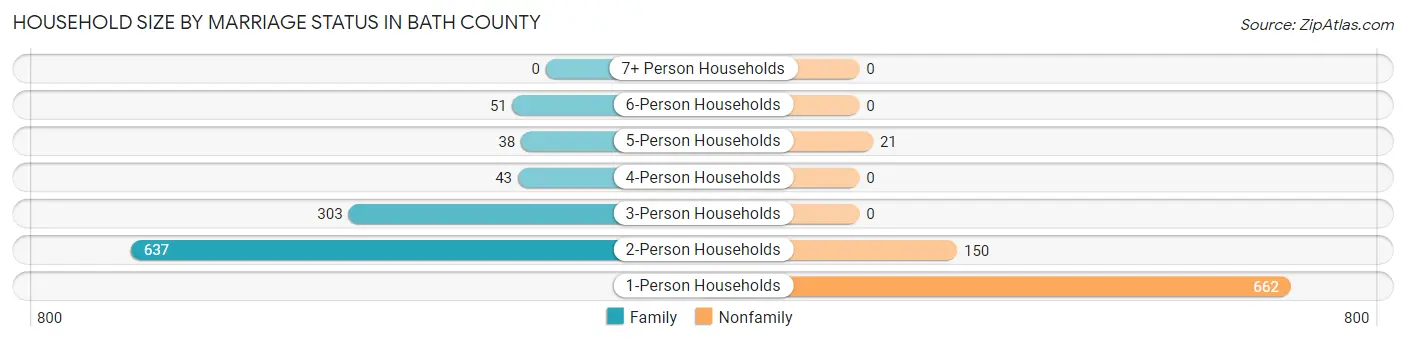
| Household Size | Family Households | Nonfamily Households |
| 1-Person Households | - | 662 (34.7%) |
| 2-Person Households | 637 (33.4%) | 150 (7.9%) |
| 3-Person Households | 303 (15.9%) | 0 (0.0%) |
| 4-Person Households | 43 (2.3%) | 0 (0.0%) |
| 5-Person Households | 38 (2.0%) | 21 (1.1%) |
| 6-Person Households | 51 (2.7%) | 0 (0.0%) |
| 7+ Person Households | 0 (0.0%) | 0 (0.0%) |
| Total | 1,072 (56.3%) | 833 (43.7%) |
Female Fertility in Bath County
Fertility by Age in Bath County
| Age Bracket | Women with Births | Births / 1,000 Women |
| 15 to 19 years | 0 (0.0%) | 0.0 |
| 20 to 34 years | 0 (0.0%) | 0.0 |
| 35 to 50 years | 0 (0.0%) | 0.0 |
| Total | 0 (0.0%) | 0.0 |
Fertility by Age by Marriage Status in Bath County
| Age Bracket | Married | Unmarried |
| 15 to 19 years | 0 (0.0%) | 0 (0.0%) |
| 20 to 34 years | 0 (0.0%) | 0 (0.0%) |
| 35 to 50 years | 0 (0.0%) | 0 (0.0%) |
| Total | 0 (0.0%) | 0 (0.0%) |
Fertility by Education in Bath County
| Educational Attainment | Women with Births | Births / 1,000 Women |
| Less than High School | 0 (0.0%) | 0.0 |
| High School Diploma | 0 (0.0%) | 0.0 |
| College or Associate's Degree | 0 (0.0%) | 0.0 |
| Bachelor's Degree | 0 (0.0%) | 0.0 |
| Graduate Degree | 0 (0.0%) | 0.0 |
| Total | 0 (0.0%) | 0.0 |
Fertility by Education by Marriage Status in Bath County
| Educational Attainment | Married | Unmarried |
| Less than High School | 0 (0.0%) | 0 (0.0%) |
| High School Diploma | 0 (0.0%) | 0 (0.0%) |
| College or Associate's Degree | 0 (0.0%) | 0 (0.0%) |
| Bachelor's Degree | 0 (0.0%) | 0 (0.0%) |
| Graduate Degree | 0 (0.0%) | 0 (0.0%) |
| Total | 0 (0.0%) | 0 (0.0%) |
Employment Characteristics in Bath County
Employment by Class of Employer in Bath County
Among the 1,722 employed individuals in Bath County, private company employees (1,046 | 60.7%), self-employed (incorporated) (155 | 9.0%), and local government employees (137 | 8.0%) make up the most common classes of employment.
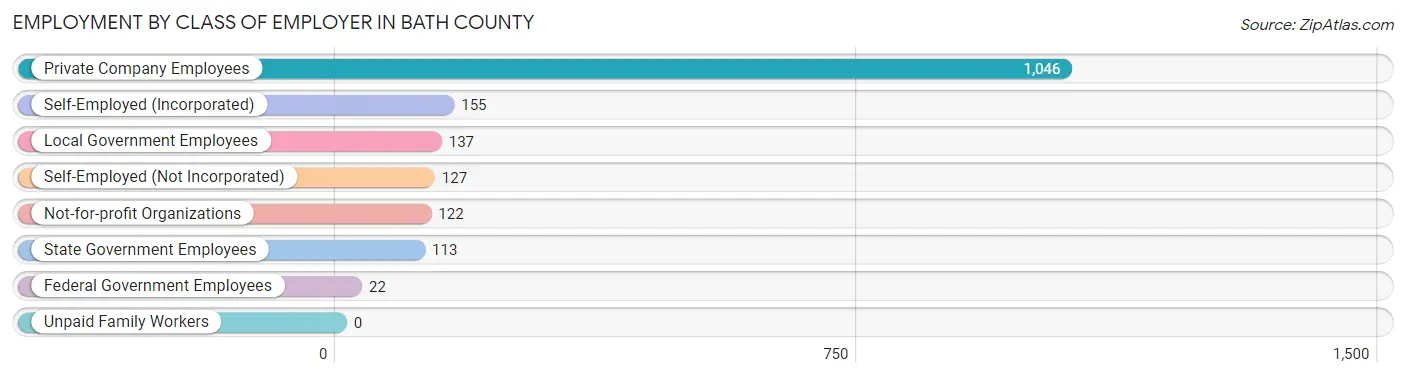
| Employer Class | # Employees | % Employees |
| Private Company Employees | 1,046 | 60.7% |
| Self-Employed (Incorporated) | 155 | 9.0% |
| Self-Employed (Not Incorporated) | 127 | 7.4% |
| Not-for-profit Organizations | 122 | 7.1% |
| Local Government Employees | 137 | 8.0% |
| State Government Employees | 113 | 6.6% |
| Federal Government Employees | 22 | 1.3% |
| Unpaid Family Workers | 0 | 0.0% |
| Total | 1,722 | 100.0% |
Employment Status by Age in Bath County
According to the labor force statistics for Bath County, out of the total population over 16 years of age (3,535), 51.1% or 1,806 individuals are in the labor force, with 2.0% or 36 of them unemployed. The age group with the highest labor force participation rate is 30 to 34 years, with 84.4% or 221 individuals in the labor force. Within the labor force, the 25 to 29 years age range has the highest percentage of unemployed individuals, with 12.9% or 17 of them being unemployed.
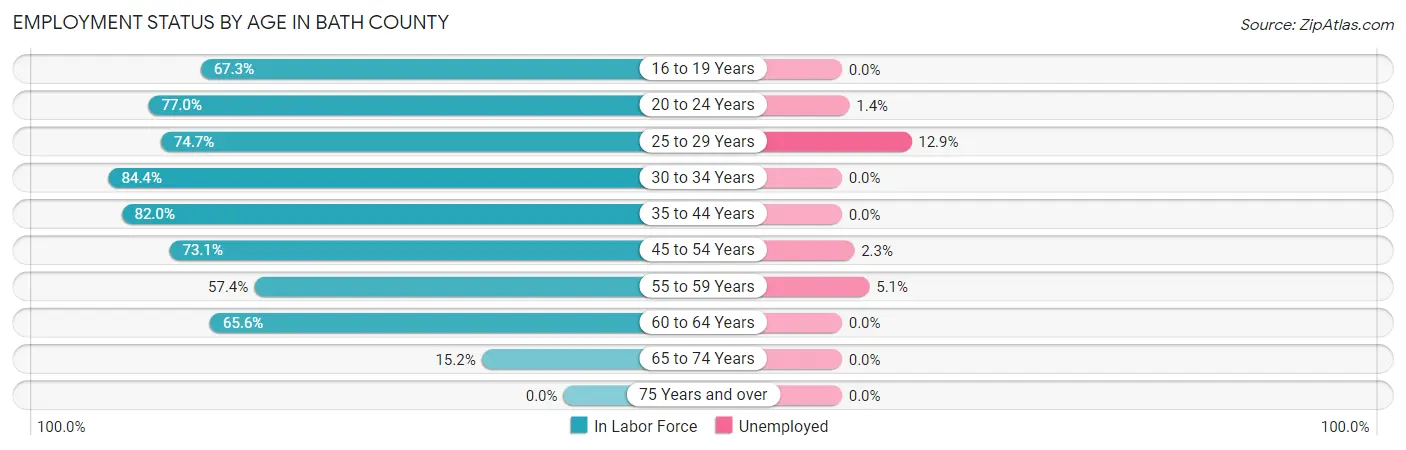
| Age Bracket | In Labor Force | Unemployed |
| 16 to 19 Years | 33 (67.3%) | 0 (0.0%) |
| 20 to 24 Years | 207 (77.0%) | 3 (1.4%) |
| 25 to 29 Years | 133 (74.7%) | 17 (12.9%) |
| 30 to 34 Years | 221 (84.4%) | 0 (0.0%) |
| 35 to 44 Years | 379 (82.0%) | 0 (0.0%) |
| 45 to 54 Years | 310 (73.1%) | 7 (2.3%) |
| 55 to 59 Years | 214 (57.4%) | 11 (5.1%) |
| 60 to 64 Years | 202 (65.6%) | 0 (0.0%) |
| 65 to 74 Years | 107 (15.2%) | 0 (0.0%) |
| 75 Years and over | 0 (0.0%) | 0 (0.0%) |
| Total | 1,806 (51.1%) | 36 (2.0%) |
Employment Status by Educational Attainment in Bath County
According to labor force statistics for Bath County, 72.7% of individuals (1,459) out of the total population between 25 and 64 years of age (2,007) are in the labor force, with 2.3% or 34 of them being unemployed. The group with the highest labor force participation rate are those with the educational attainment of bachelor's degree or higher, with 85.2% or 316 individuals in the labor force. Within the labor force, individuals with high school diploma education have the highest percentage of unemployment, with 3.5% or 22 of them being unemployed.
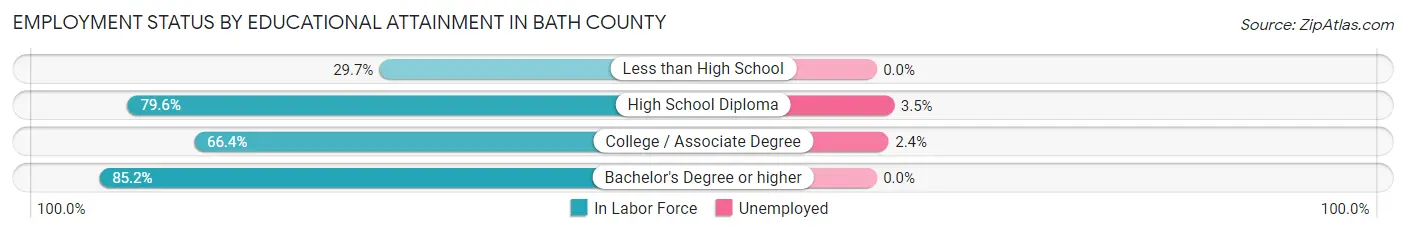
| Educational Attainment | In Labor Force | Unemployed |
| Less than High School | 38 (29.7%) | 0 (0.0%) |
| High School Diploma | 625 (79.6%) | 27 (3.5%) |
| College / Associate Degree | 480 (66.4%) | 17 (2.4%) |
| Bachelor's Degree or higher | 316 (85.2%) | 0 (0.0%) |
| Total | 1,459 (72.7%) | 46 (2.3%) |
Employment Occupations by Sex in Bath County
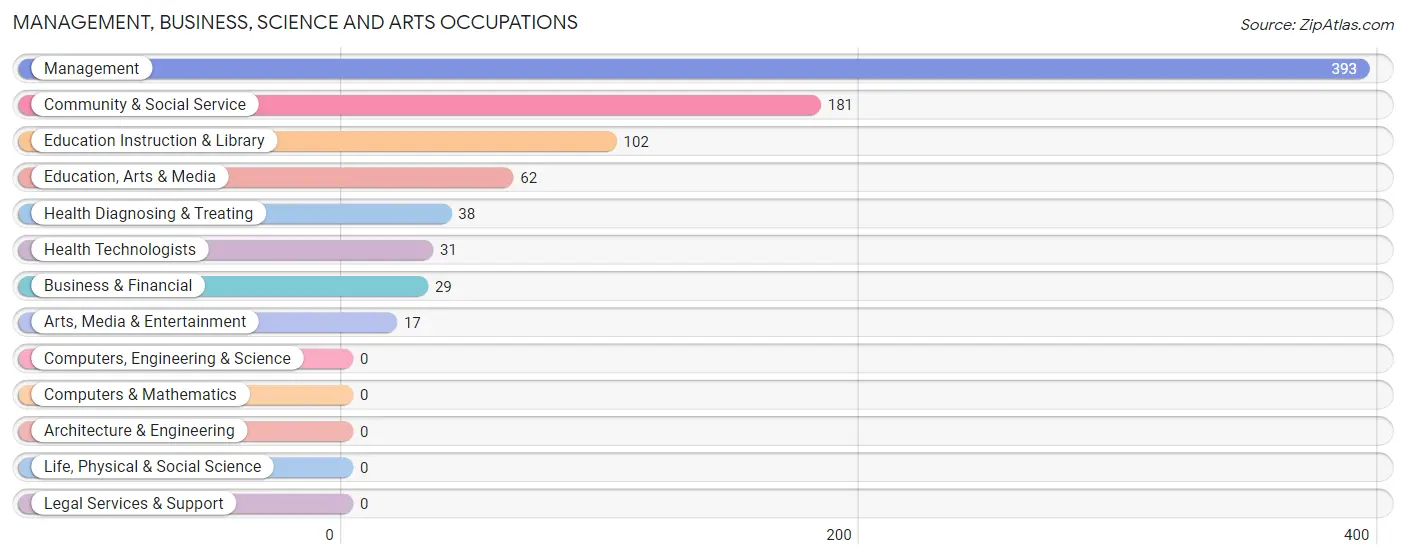
Management, Business, Science and Arts Occupations
The most common Management, Business, Science and Arts occupations in Bath County are Management (393 | 22.4%), Community & Social Service (181 | 10.3%), Education Instruction & Library (102 | 5.8%), Education, Arts & Media (62 | 3.5%), and Health Diagnosing & Treating (38 | 2.2%).
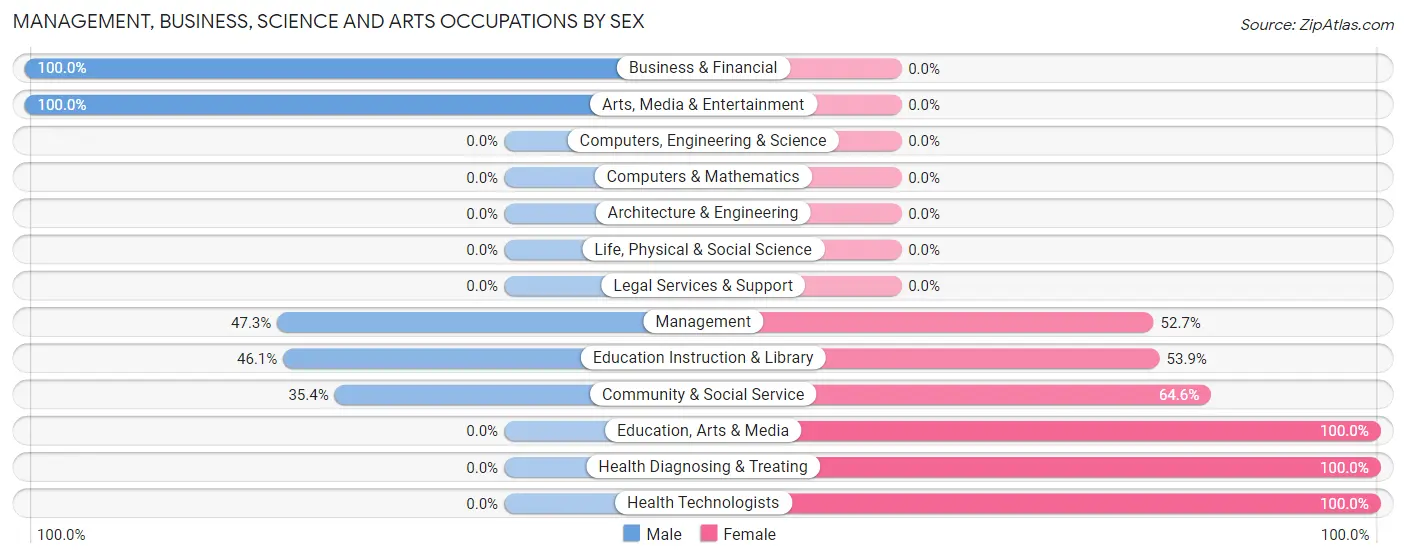
Management, Business, Science and Arts Occupations by Sex
Within the Management, Business, Science and Arts occupations in Bath County, the most male-oriented occupations are Business & Financial (100.0%), Arts, Media & Entertainment (100.0%), and Management (47.3%), while the most female-oriented occupations are Education, Arts & Media (100.0%), Health Diagnosing & Treating (100.0%), and Health Technologists (100.0%).
| Occupation | Male | Female |
| Management | 186 (47.3%) | 207 (52.7%) |
| Business & Financial | 29 (100.0%) | 0 (0.0%) |
| Computers, Engineering & Science | 0 (0.0%) | 0 (0.0%) |
| Computers & Mathematics | 0 (0.0%) | 0 (0.0%) |
| Architecture & Engineering | 0 (0.0%) | 0 (0.0%) |
| Life, Physical & Social Science | 0 (0.0%) | 0 (0.0%) |
| Community & Social Service | 64 (35.4%) | 117 (64.6%) |
| Education, Arts & Media | 0 (0.0%) | 62 (100.0%) |
| Legal Services & Support | 0 (0.0%) | 0 (0.0%) |
| Education Instruction & Library | 47 (46.1%) | 55 (53.9%) |
| Arts, Media & Entertainment | 17 (100.0%) | 0 (0.0%) |
| Health Diagnosing & Treating | 0 (0.0%) | 38 (100.0%) |
| Health Technologists | 0 (0.0%) | 31 (100.0%) |
| Total (Category) | 279 (43.5%) | 362 (56.5%) |
| Total (Overall) | 936 (53.4%) | 817 (46.6%) |
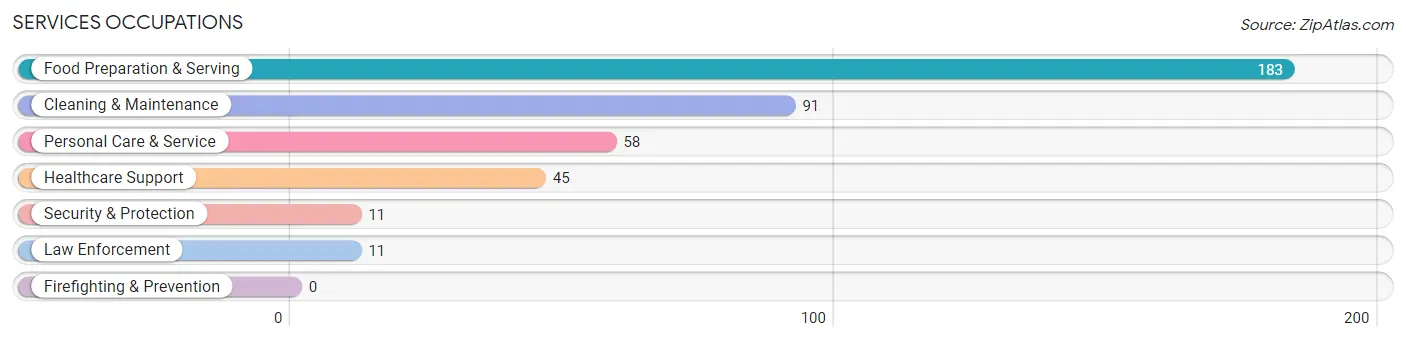
Services Occupations
The most common Services occupations in Bath County are Food Preparation & Serving (183 | 10.4%), Cleaning & Maintenance (91 | 5.2%), Personal Care & Service (58 | 3.3%), Healthcare Support (45 | 2.6%), and Security & Protection (11 | 0.6%).
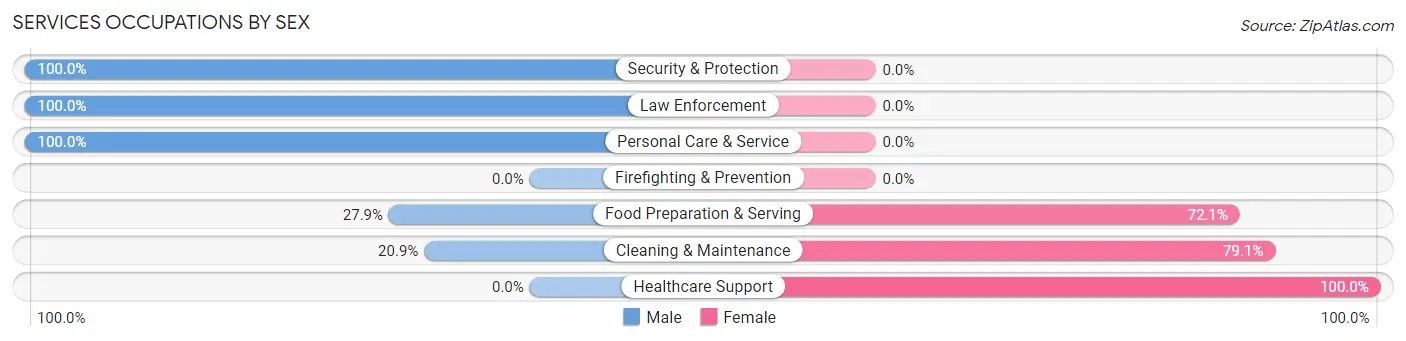
Services Occupations by Sex
Within the Services occupations in Bath County, the most male-oriented occupations are Security & Protection (100.0%), Law Enforcement (100.0%), and Personal Care & Service (100.0%), while the most female-oriented occupations are Healthcare Support (100.0%), Cleaning & Maintenance (79.1%), and Food Preparation & Serving (72.1%).
| Occupation | Male | Female |
| Healthcare Support | 0 (0.0%) | 45 (100.0%) |
| Security & Protection | 11 (100.0%) | 0 (0.0%) |
| Firefighting & Prevention | 0 (0.0%) | 0 (0.0%) |
| Law Enforcement | 11 (100.0%) | 0 (0.0%) |
| Food Preparation & Serving | 51 (27.9%) | 132 (72.1%) |
| Cleaning & Maintenance | 19 (20.9%) | 72 (79.1%) |
| Personal Care & Service | 58 (100.0%) | 0 (0.0%) |
| Total (Category) | 139 (35.8%) | 249 (64.2%) |
| Total (Overall) | 936 (53.4%) | 817 (46.6%) |
Sales and Office Occupations
The most common Sales and Office occupations in Bath County are Office & Administration (152 | 8.7%), and Sales & Related (119 | 6.8%).
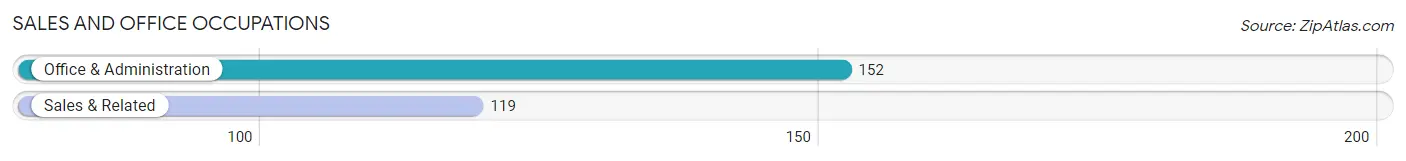
Sales and Office Occupations by Sex
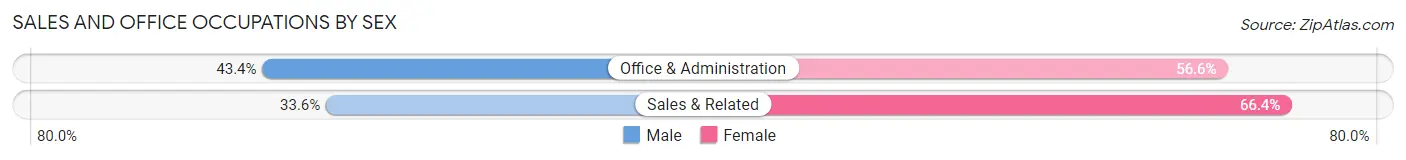
| Occupation | Male | Female |
| Sales & Related | 40 (33.6%) | 79 (66.4%) |
| Office & Administration | 66 (43.4%) | 86 (56.6%) |
| Total (Category) | 106 (39.1%) | 165 (60.9%) |
| Total (Overall) | 936 (53.4%) | 817 (46.6%) |
Natural Resources, Construction and Maintenance Occupations
The most common Natural Resources, Construction and Maintenance occupations in Bath County are Construction & Extraction (202 | 11.5%), Farming, Fishing & Forestry (55 | 3.1%), and Installation, Maintenance & Repair (55 | 3.1%).
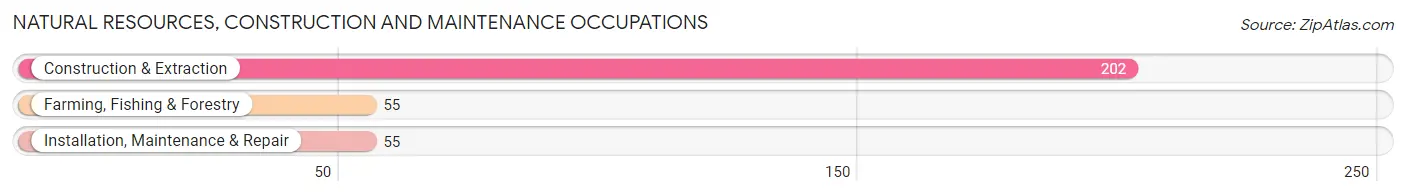
Natural Resources, Construction and Maintenance Occupations by Sex
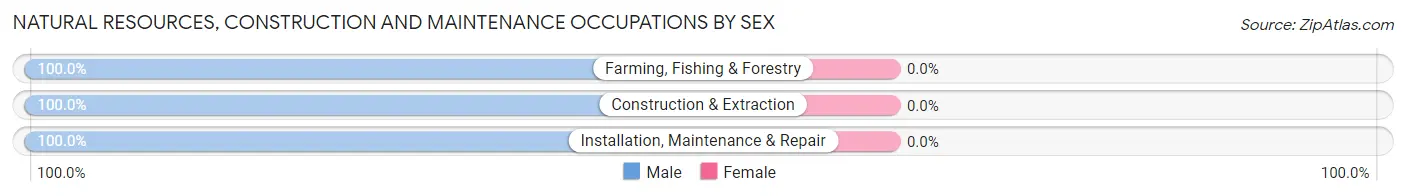
| Occupation | Male | Female |
| Farming, Fishing & Forestry | 55 (100.0%) | 0 (0.0%) |
| Construction & Extraction | 202 (100.0%) | 0 (0.0%) |
| Installation, Maintenance & Repair | 55 (100.0%) | 0 (0.0%) |
| Total (Category) | 312 (100.0%) | 0 (0.0%) |
| Total (Overall) | 936 (53.4%) | 817 (46.6%) |
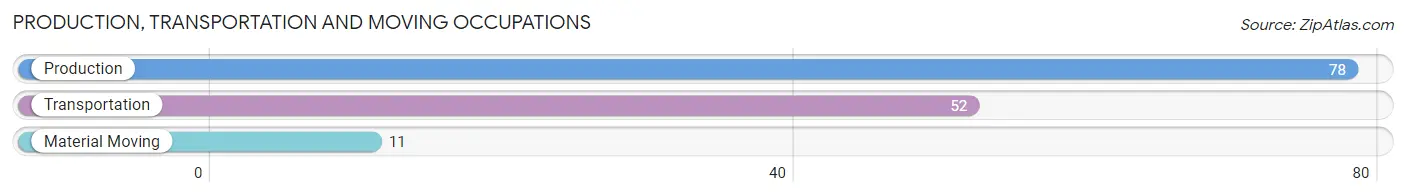
Production, Transportation and Moving Occupations
The most common Production, Transportation and Moving occupations in Bath County are Production (78 | 4.4%), Transportation (52 | 3.0%), and Material Moving (11 | 0.6%).
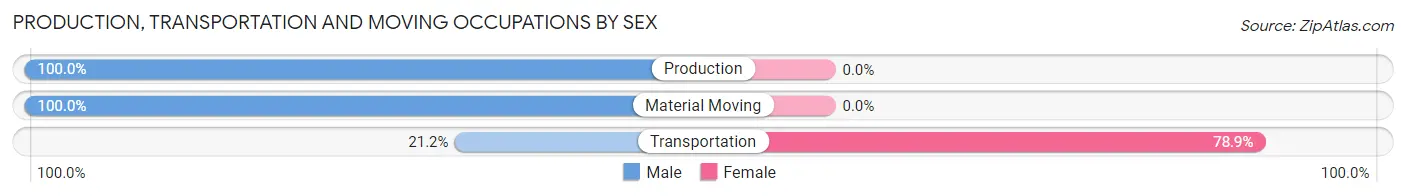
Production, Transportation and Moving Occupations by Sex
| Occupation | Male | Female |
| Production | 78 (100.0%) | 0 (0.0%) |
| Transportation | 11 (21.1%) | 41 (78.8%) |
| Material Moving | 11 (100.0%) | 0 (0.0%) |
| Total (Category) | 100 (70.9%) | 41 (29.1%) |
| Total (Overall) | 936 (53.4%) | 817 (46.6%) |
Employment Industries by Sex in Bath County
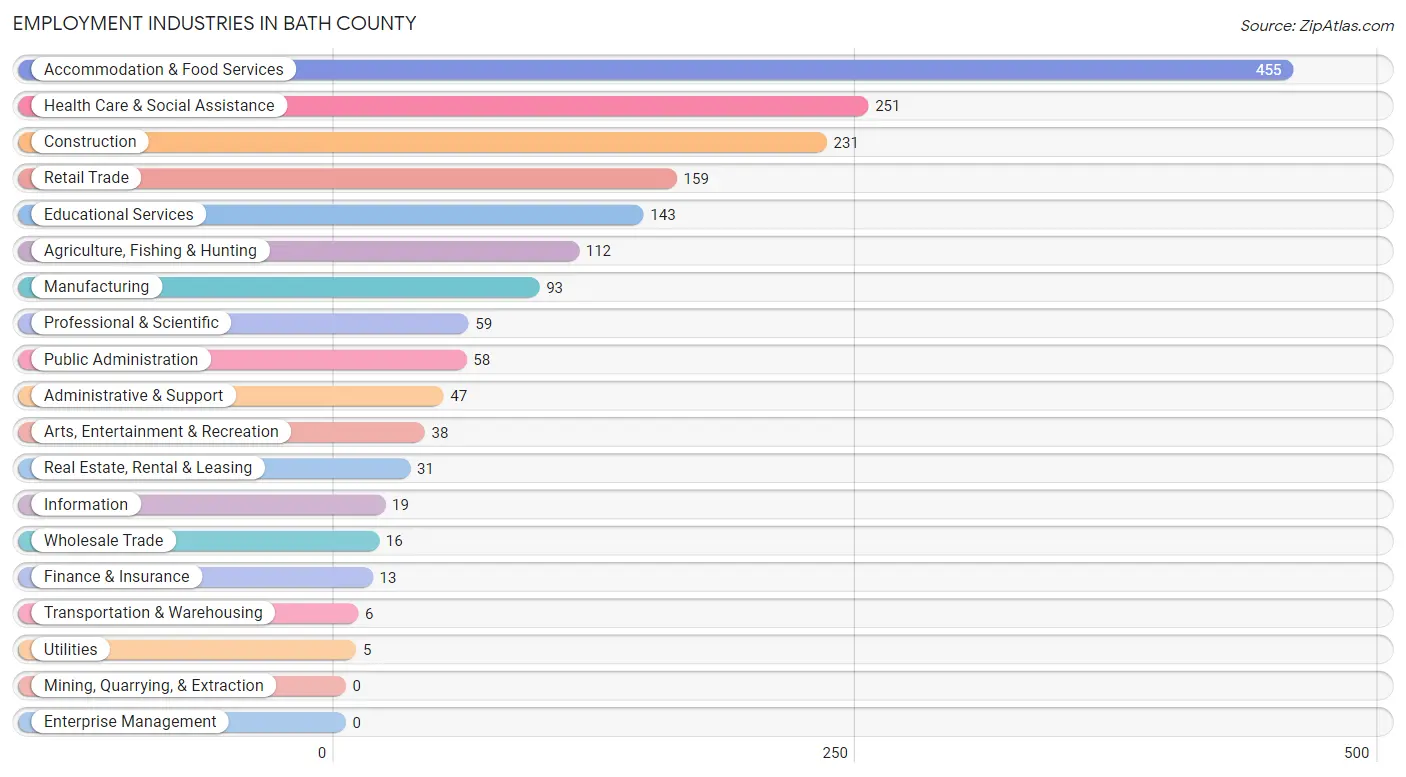
Employment Industries in Bath County
The major employment industries in Bath County include Accommodation & Food Services (455 | 26.0%), Health Care & Social Assistance (251 | 14.3%), Construction (231 | 13.2%), Retail Trade (159 | 9.1%), and Educational Services (143 | 8.2%).
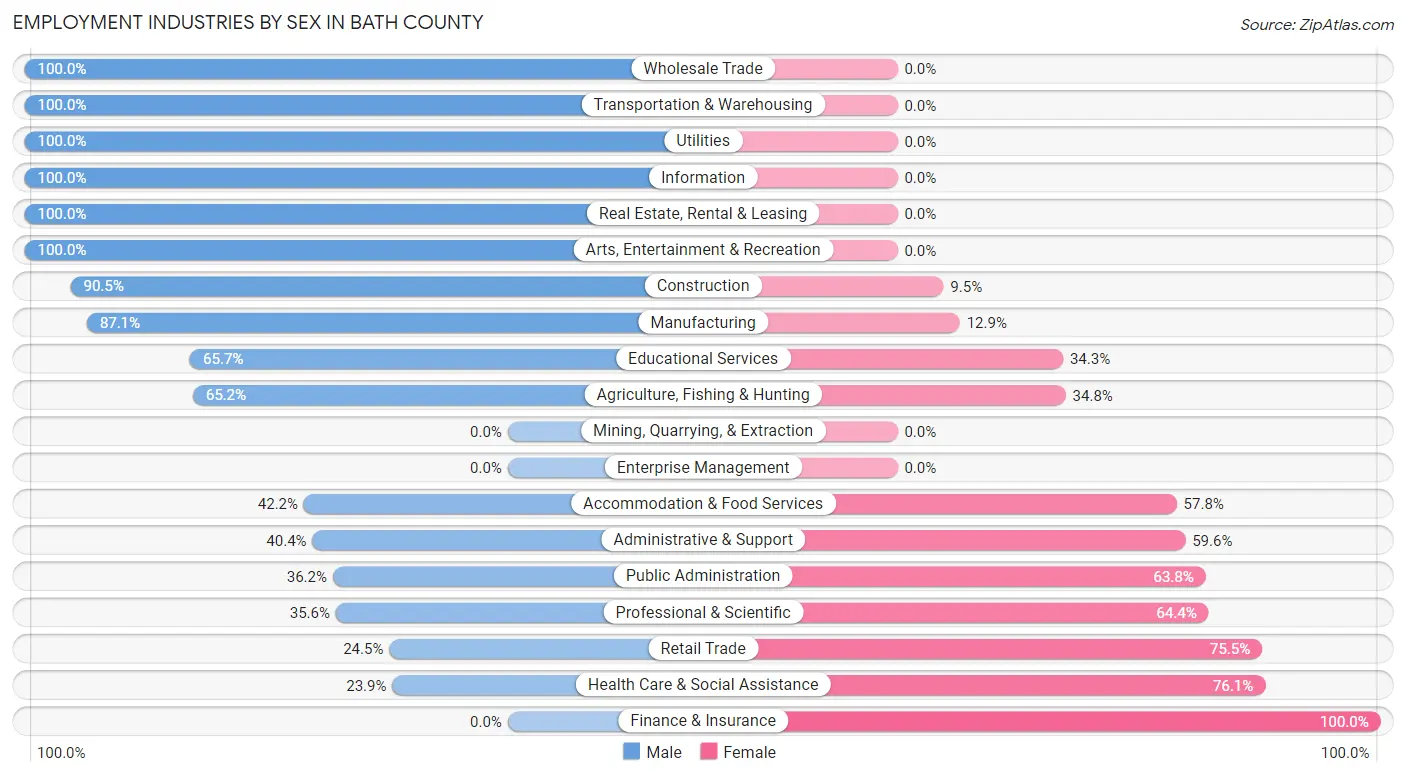
Employment Industries by Sex in Bath County
The Bath County industries that see more men than women are Wholesale Trade (100.0%), Transportation & Warehousing (100.0%), and Utilities (100.0%), whereas the industries that tend to have a higher number of women are Finance & Insurance (100.0%), Health Care & Social Assistance (76.1%), and Retail Trade (75.5%).
| Industry | Male | Female |
| Agriculture, Fishing & Hunting | 73 (65.2%) | 39 (34.8%) |
| Mining, Quarrying, & Extraction | 0 (0.0%) | 0 (0.0%) |
| Construction | 209 (90.5%) | 22 (9.5%) |
| Manufacturing | 81 (87.1%) | 12 (12.9%) |
| Wholesale Trade | 16 (100.0%) | 0 (0.0%) |
| Retail Trade | 39 (24.5%) | 120 (75.5%) |
| Transportation & Warehousing | 6 (100.0%) | 0 (0.0%) |
| Utilities | 5 (100.0%) | 0 (0.0%) |
| Information | 19 (100.0%) | 0 (0.0%) |
| Finance & Insurance | 0 (0.0%) | 13 (100.0%) |
| Real Estate, Rental & Leasing | 31 (100.0%) | 0 (0.0%) |
| Professional & Scientific | 21 (35.6%) | 38 (64.4%) |
| Enterprise Management | 0 (0.0%) | 0 (0.0%) |
| Administrative & Support | 19 (40.4%) | 28 (59.6%) |
| Educational Services | 94 (65.7%) | 49 (34.3%) |
| Health Care & Social Assistance | 60 (23.9%) | 191 (76.1%) |
| Arts, Entertainment & Recreation | 38 (100.0%) | 0 (0.0%) |
| Accommodation & Food Services | 192 (42.2%) | 263 (57.8%) |
| Public Administration | 21 (36.2%) | 37 (63.8%) |
| Total | 936 (53.4%) | 817 (46.6%) |
Education in Bath County
School Enrollment in Bath County
The most common levels of schooling among the 548 students in Bath County are elementary school (211 | 38.5%), middle school (128 | 23.4%), and college / undergraduate (113 | 20.6%).
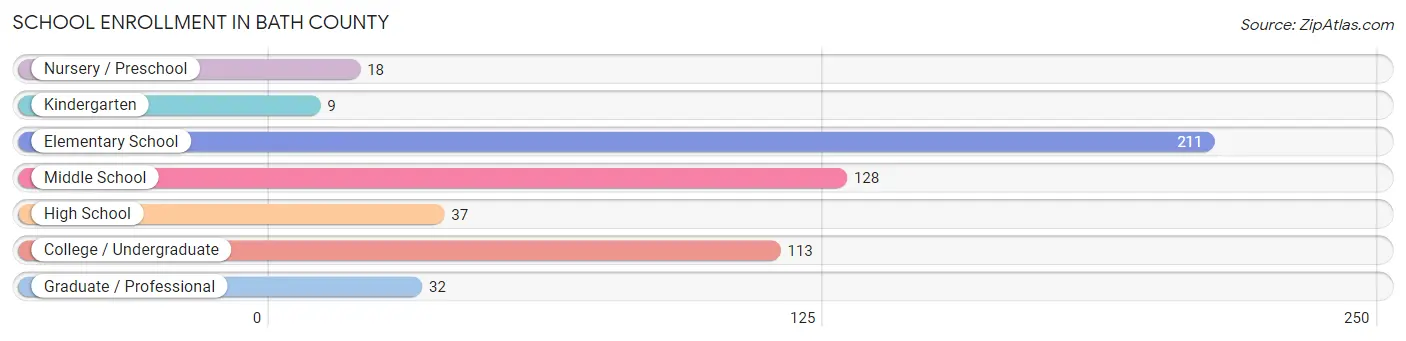
| School Level | # Students | % Students |
| Nursery / Preschool | 18 | 3.3% |
| Kindergarten | 9 | 1.6% |
| Elementary School | 211 | 38.5% |
| Middle School | 128 | 23.4% |
| High School | 37 | 6.8% |
| College / Undergraduate | 113 | 20.6% |
| Graduate / Professional | 32 | 5.8% |
| Total | 548 | 100.0% |
School Enrollment by Age by Funding Source in Bath County
Out of a total of 548 students who are enrolled in schools in Bath County, 97 (17.7%) attend a private institution, while the remaining 451 (82.3%) are enrolled in public schools. The age group of 35 years and over has the highest likelihood of being enrolled in private schools, with 20 (62.5% in the age bracket) enrolled. Conversely, the age group of 15 to 17 year olds has the lowest likelihood of being enrolled in a private school, with 30 (100.0% in the age bracket) attending a public institution.
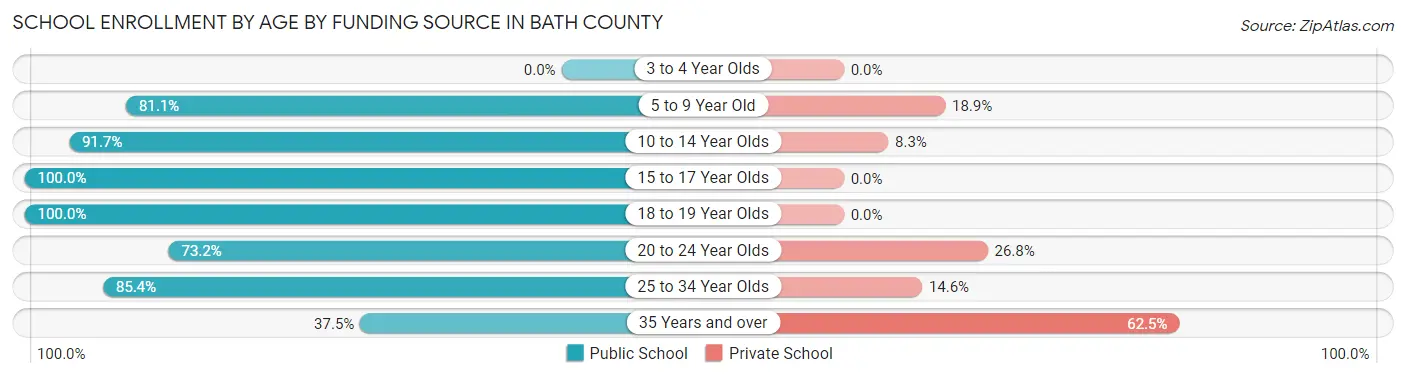
| Age Bracket | Public School | Private School |
| 3 to 4 Year Olds | 0 (0.0%) | 0 (0.0%) |
| 5 to 9 Year Old | 189 (81.1%) | 44 (18.9%) |
| 10 to 14 Year Olds | 122 (91.7%) | 11 (8.3%) |
| 15 to 17 Year Olds | 30 (100.0%) | 0 (0.0%) |
| 18 to 19 Year Olds | 16 (100.0%) | 0 (0.0%) |
| 20 to 24 Year Olds | 41 (73.2%) | 15 (26.8%) |
| 25 to 34 Year Olds | 41 (85.4%) | 7 (14.6%) |
| 35 Years and over | 12 (37.5%) | 20 (62.5%) |
| Total | 451 (82.3%) | 97 (17.7%) |
Educational Attainment by Field of Study in Bath County
Science & technology (186 | 29.5%), education (129 | 20.5%), business (97 | 15.4%), bio, nature & agricultural (54 | 8.6%), and engineering (45 | 7.1%) are the most common fields of study among 630 individuals in Bath County who have obtained a bachelor's degree or higher.
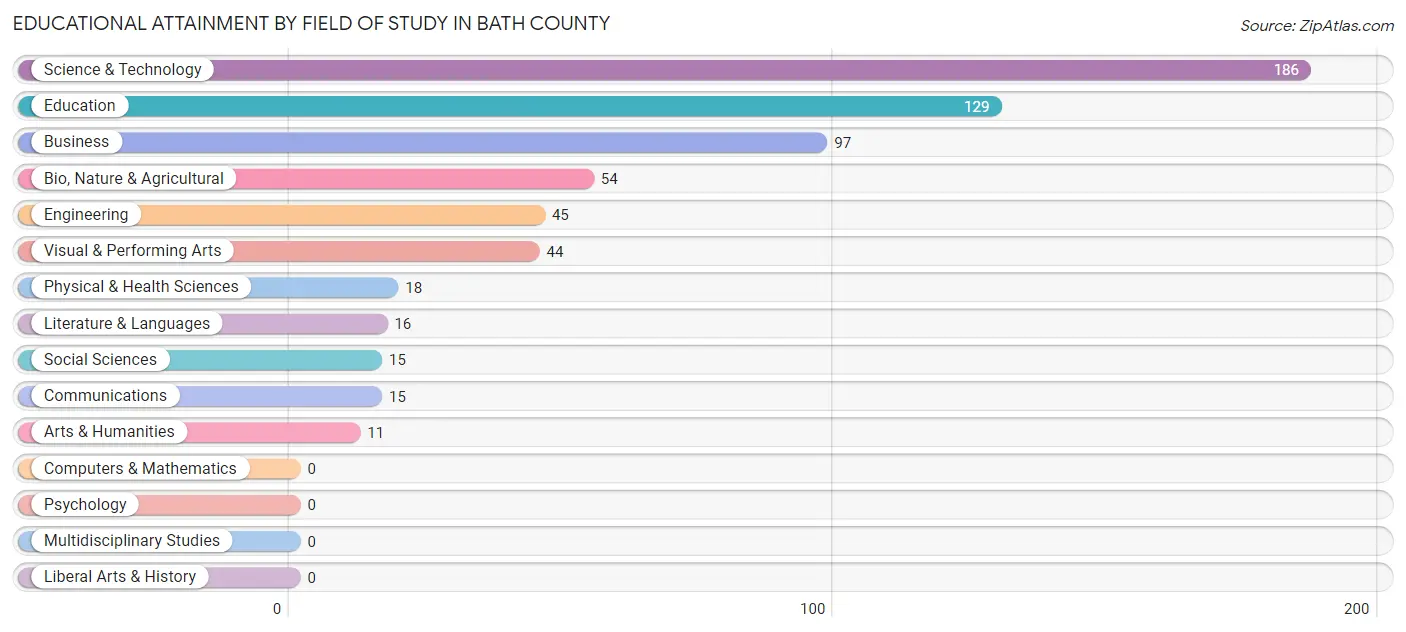
| Field of Study | # Graduates | % Graduates |
| Computers & Mathematics | 0 | 0.0% |
| Bio, Nature & Agricultural | 54 | 8.6% |
| Physical & Health Sciences | 18 | 2.9% |
| Psychology | 0 | 0.0% |
| Social Sciences | 15 | 2.4% |
| Engineering | 45 | 7.1% |
| Multidisciplinary Studies | 0 | 0.0% |
| Science & Technology | 186 | 29.5% |
| Business | 97 | 15.4% |
| Education | 129 | 20.5% |
| Literature & Languages | 16 | 2.5% |
| Liberal Arts & History | 0 | 0.0% |
| Visual & Performing Arts | 44 | 7.0% |
| Communications | 15 | 2.4% |
| Arts & Humanities | 11 | 1.8% |
| Total | 630 | 100.0% |
Transportation & Commute in Bath County
Vehicle Availability by Sex in Bath County
The most prevalent vehicle ownership categories in Bath County are males with 2 vehicles (368, accounting for 42.1%) and females with 2 vehicles (377, making up 45.4%).
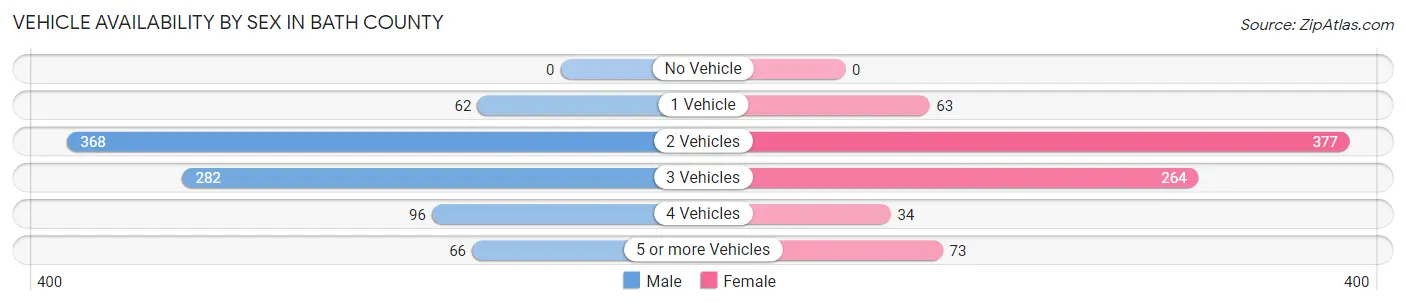
| Vehicles Available | Male | Female |
| No Vehicle | 0 (0.0%) | 0 (0.0%) |
| 1 Vehicle | 62 (7.1%) | 63 (7.8%) |
| 2 Vehicles | 368 (42.1%) | 377 (46.5%) |
| 3 Vehicles | 282 (32.3%) | 264 (32.6%) |
| 4 Vehicles | 96 (11.0%) | 34 (4.2%) |
| 5 or more Vehicles | 66 (7.5%) | 73 (9.0%) |
| Total | 874 (100.0%) | 811 (100.0%) |
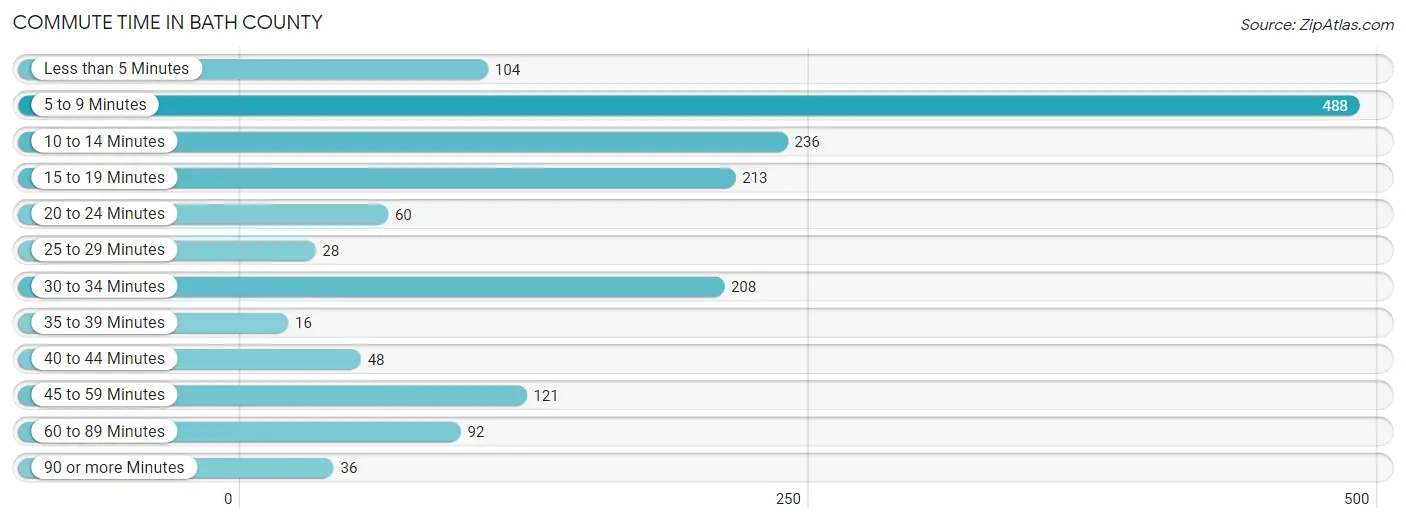
Commute Time in Bath County
The most frequently occuring commute durations in Bath County are 5 to 9 minutes (488 commuters, 29.6%), 10 to 14 minutes (236 commuters, 14.3%), and 15 to 19 minutes (213 commuters, 12.9%).
| Commute Time | # Commuters | % Commuters |
| Less than 5 Minutes | 104 | 6.3% |
| 5 to 9 Minutes | 488 | 29.6% |
| 10 to 14 Minutes | 236 | 14.3% |
| 15 to 19 Minutes | 213 | 12.9% |
| 20 to 24 Minutes | 60 | 3.6% |
| 25 to 29 Minutes | 28 | 1.7% |
| 30 to 34 Minutes | 208 | 12.6% |
| 35 to 39 Minutes | 16 | 1.0% |
| 40 to 44 Minutes | 48 | 2.9% |
| 45 to 59 Minutes | 121 | 7.3% |
| 60 to 89 Minutes | 92 | 5.6% |
| 90 or more Minutes | 36 | 2.2% |
Commute Time by Sex in Bath County
The most common commute times in Bath County are 5 to 9 minutes (190 commuters, 22.3%) for males and 5 to 9 minutes (298 commuters, 37.4%) for females.
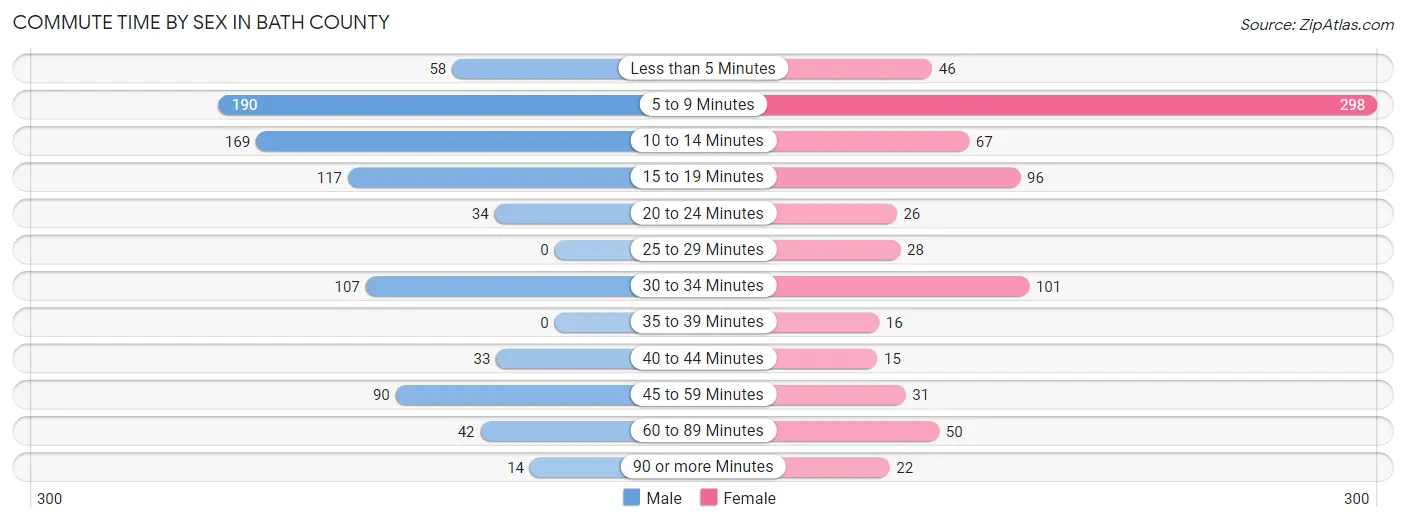
| Commute Time | Male | Female |
| Less than 5 Minutes | 58 (6.8%) | 46 (5.8%) |
| 5 to 9 Minutes | 190 (22.3%) | 298 (37.4%) |
| 10 to 14 Minutes | 169 (19.8%) | 67 (8.4%) |
| 15 to 19 Minutes | 117 (13.7%) | 96 (12.1%) |
| 20 to 24 Minutes | 34 (4.0%) | 26 (3.3%) |
| 25 to 29 Minutes | 0 (0.0%) | 28 (3.5%) |
| 30 to 34 Minutes | 107 (12.5%) | 101 (12.7%) |
| 35 to 39 Minutes | 0 (0.0%) | 16 (2.0%) |
| 40 to 44 Minutes | 33 (3.9%) | 15 (1.9%) |
| 45 to 59 Minutes | 90 (10.5%) | 31 (3.9%) |
| 60 to 89 Minutes | 42 (4.9%) | 50 (6.3%) |
| 90 or more Minutes | 14 (1.6%) | 22 (2.8%) |
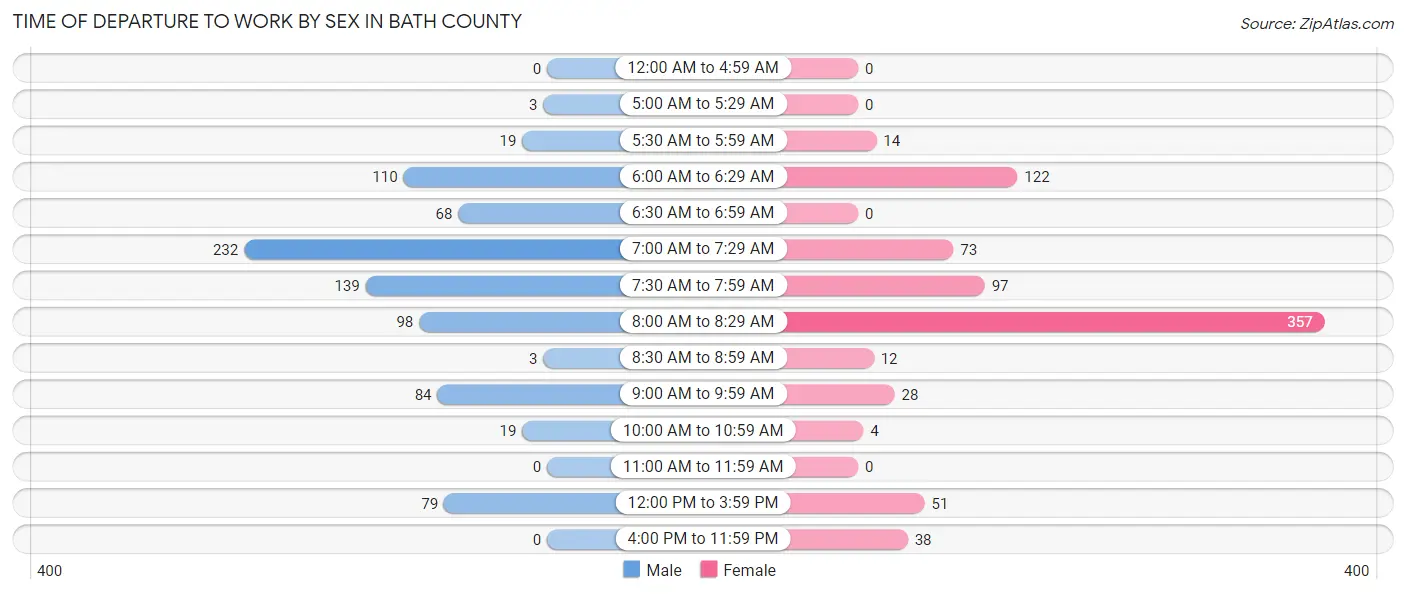
Time of Departure to Work by Sex in Bath County
The most frequent times of departure to work in Bath County are 7:00 AM to 7:29 AM (232, 27.2%) for males and 8:00 AM to 8:29 AM (357, 44.9%) for females.
| Time of Departure | Male | Female |
| 12:00 AM to 4:59 AM | 0 (0.0%) | 0 (0.0%) |
| 5:00 AM to 5:29 AM | 3 (0.4%) | 0 (0.0%) |
| 5:30 AM to 5:59 AM | 19 (2.2%) | 14 (1.8%) |
| 6:00 AM to 6:29 AM | 110 (12.9%) | 122 (15.3%) |
| 6:30 AM to 6:59 AM | 68 (8.0%) | 0 (0.0%) |
| 7:00 AM to 7:29 AM | 232 (27.2%) | 73 (9.2%) |
| 7:30 AM to 7:59 AM | 139 (16.3%) | 97 (12.2%) |
| 8:00 AM to 8:29 AM | 98 (11.5%) | 357 (44.9%) |
| 8:30 AM to 8:59 AM | 3 (0.4%) | 12 (1.5%) |
| 9:00 AM to 9:59 AM | 84 (9.8%) | 28 (3.5%) |
| 10:00 AM to 10:59 AM | 19 (2.2%) | 4 (0.5%) |
| 11:00 AM to 11:59 AM | 0 (0.0%) | 0 (0.0%) |
| 12:00 PM to 3:59 PM | 79 (9.2%) | 51 (6.4%) |
| 4:00 PM to 11:59 PM | 0 (0.0%) | 38 (4.8%) |
| Total | 854 (100.0%) | 796 (100.0%) |
Housing Occupancy in Bath County
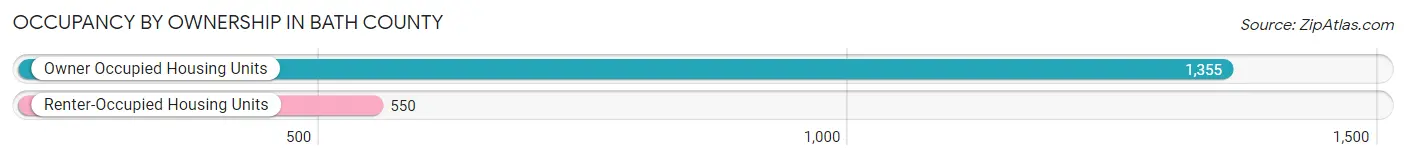
Occupancy by Ownership in Bath County
Of the total 1,905 dwellings in Bath County, owner-occupied units account for 1,355 (71.1%), while renter-occupied units make up 550 (28.9%).
| Occupancy | # Housing Units | % Housing Units |
| Owner Occupied Housing Units | 1,355 | 71.1% |
| Renter-Occupied Housing Units | 550 | 28.9% |
| Total Occupied Housing Units | 1,905 | 100.0% |
Occupancy by Household Size in Bath County
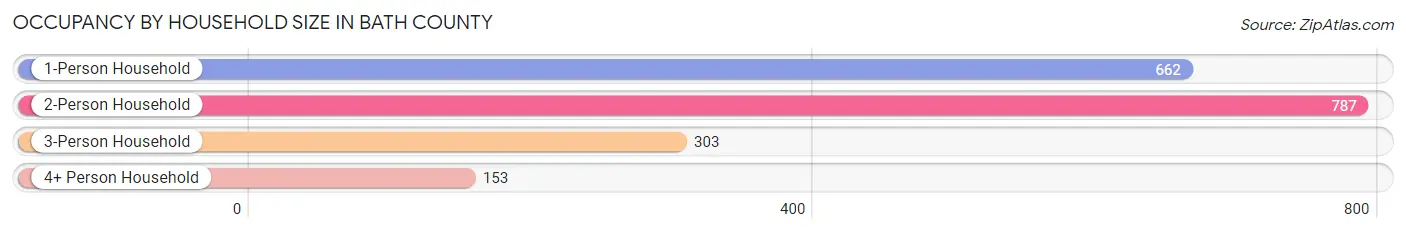
| Household Size | # Housing Units | % Housing Units |
| 1-Person Household | 662 | 34.7% |
| 2-Person Household | 787 | 41.3% |
| 3-Person Household | 303 | 15.9% |
| 4+ Person Household | 153 | 8.0% |
| Total Housing Units | 1,905 | 100.0% |
Occupancy by Ownership by Household Size in Bath County
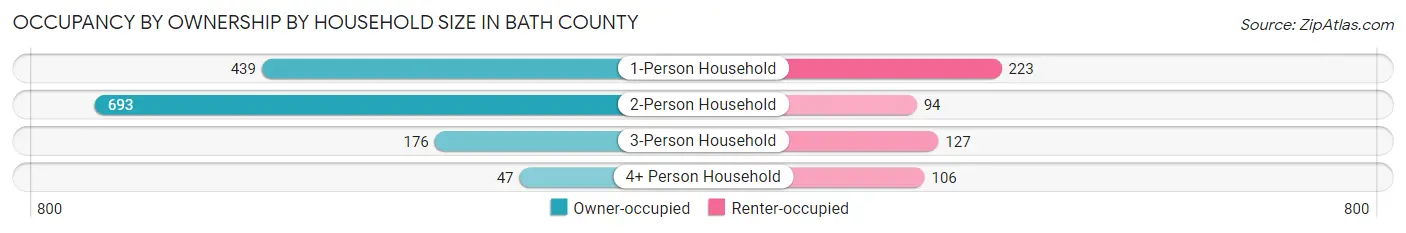
| Household Size | Owner-occupied | Renter-occupied |
| 1-Person Household | 439 (66.3%) | 223 (33.7%) |
| 2-Person Household | 693 (88.1%) | 94 (11.9%) |
| 3-Person Household | 176 (58.1%) | 127 (41.9%) |
| 4+ Person Household | 47 (30.7%) | 106 (69.3%) |
| Total Housing Units | 1,355 (71.1%) | 550 (28.9%) |
Occupancy by Educational Attainment in Bath County
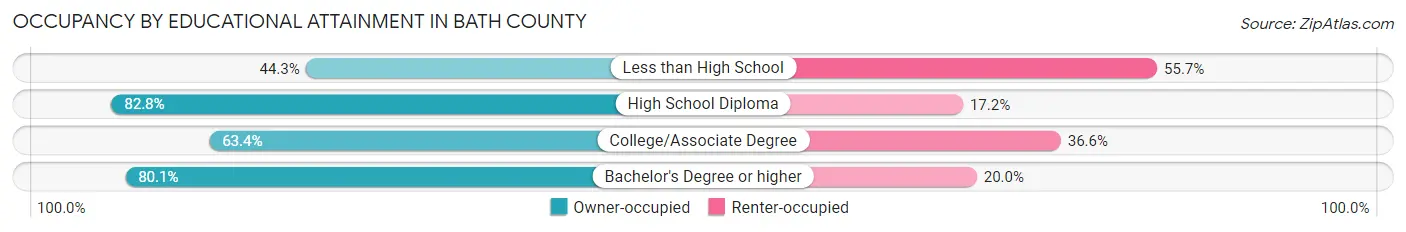
| Household Size | Owner-occupied | Renter-occupied |
| Less than High School | 101 (44.3%) | 127 (55.7%) |
| High School Diploma | 505 (82.8%) | 105 (17.2%) |
| College/Associate Degree | 400 (63.4%) | 231 (36.6%) |
| Bachelor's Degree or higher | 349 (80.0%) | 87 (20.0%) |
Occupancy by Age of Householder in Bath County
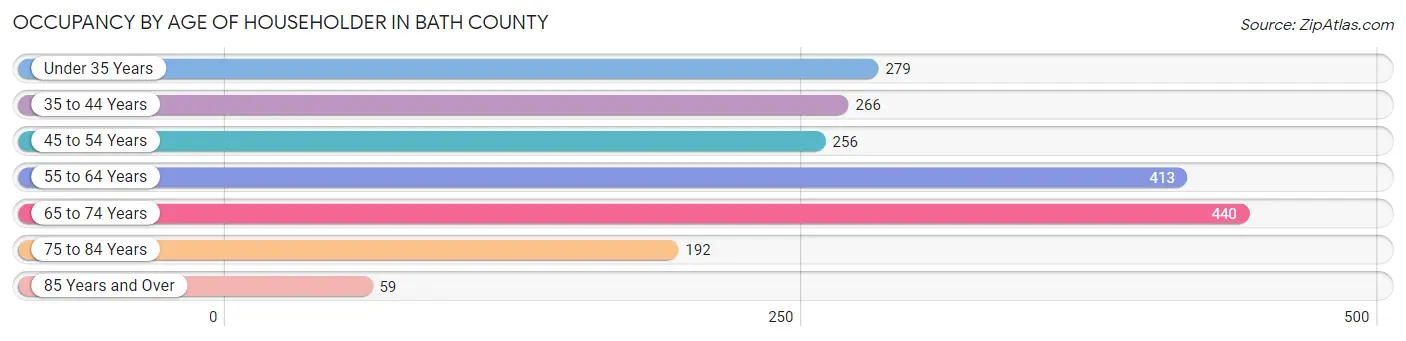
| Age Bracket | # Households | % Households |
| Under 35 Years | 279 | 14.6% |
| 35 to 44 Years | 266 | 14.0% |
| 45 to 54 Years | 256 | 13.4% |
| 55 to 64 Years | 413 | 21.7% |
| 65 to 74 Years | 440 | 23.1% |
| 75 to 84 Years | 192 | 10.1% |
| 85 Years and Over | 59 | 3.1% |
| Total | 1,905 | 100.0% |
Housing Finances in Bath County
Median Income by Occupancy in Bath County
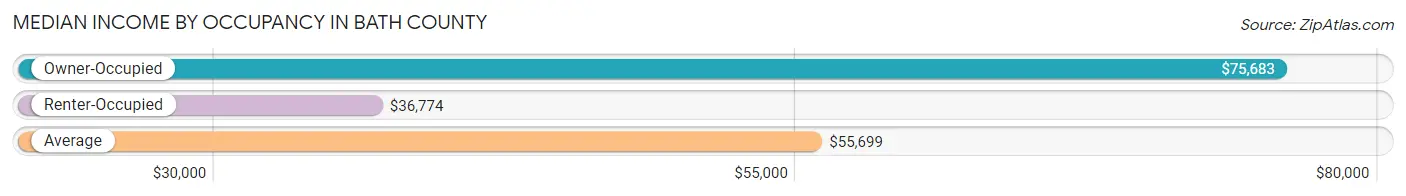
| Occupancy Type | # Households | Median Income |
| Owner-Occupied | 1,355 (71.1%) | $75,683 |
| Renter-Occupied | 550 (28.9%) | $36,774 |
| Average | 1,905 (100.0%) | $55,699 |
Occupancy by Householder Income Bracket in Bath County
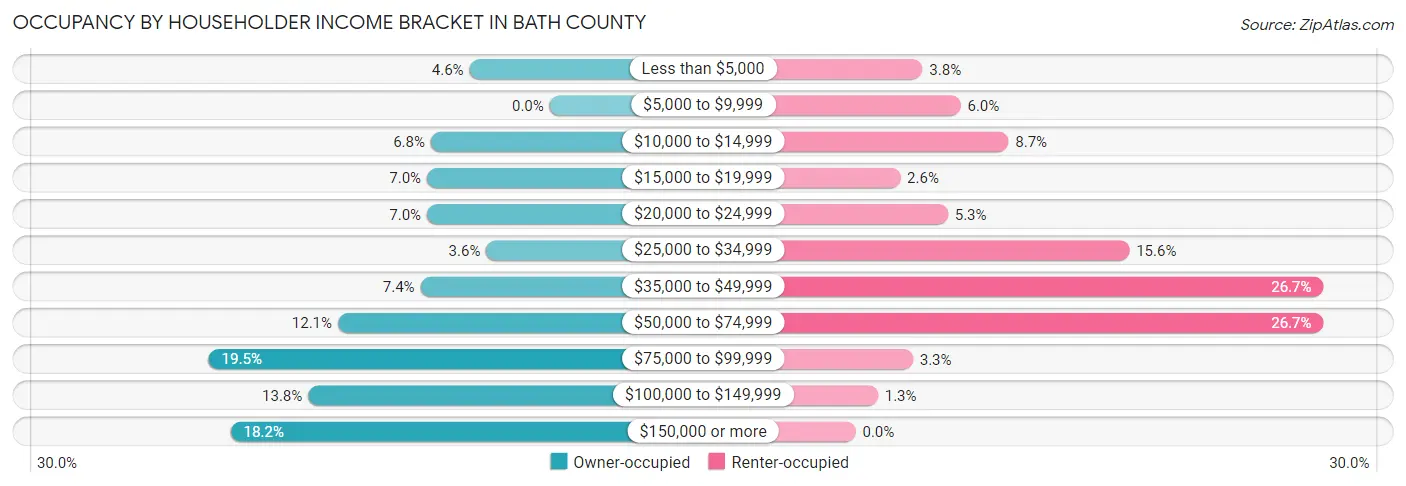
| Income Bracket | Owner-occupied | Renter-occupied |
| Less than $5,000 | 62 (4.6%) | 21 (3.8%) |
| $5,000 to $9,999 | 0 (0.0%) | 33 (6.0%) |
| $10,000 to $14,999 | 92 (6.8%) | 48 (8.7%) |
| $15,000 to $19,999 | 95 (7.0%) | 14 (2.5%) |
| $20,000 to $24,999 | 95 (7.0%) | 29 (5.3%) |
| $25,000 to $34,999 | 49 (3.6%) | 86 (15.6%) |
| $35,000 to $49,999 | 100 (7.4%) | 147 (26.7%) |
| $50,000 to $74,999 | 164 (12.1%) | 147 (26.7%) |
| $75,000 to $99,999 | 264 (19.5%) | 18 (3.3%) |
| $100,000 to $149,999 | 187 (13.8%) | 7 (1.3%) |
| $150,000 or more | 247 (18.2%) | 0 (0.0%) |
| Total | 1,355 (100.0%) | 550 (100.0%) |
Monthly Housing Cost Tiers in Bath County
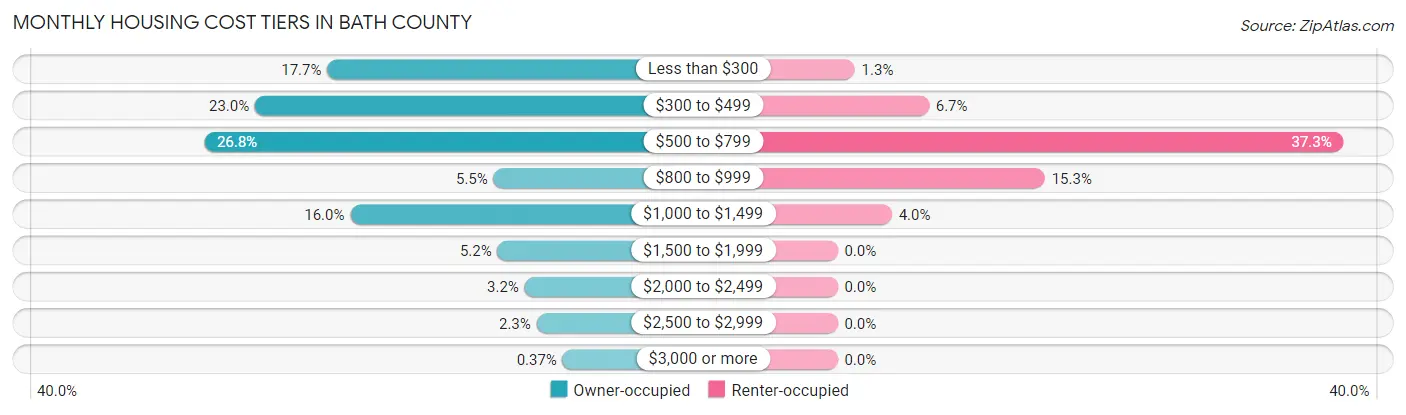
| Monthly Cost | Owner-occupied | Renter-occupied |
| Less than $300 | 240 (17.7%) | 7 (1.3%) |
| $300 to $499 | 312 (23.0%) | 37 (6.7%) |
| $500 to $799 | 363 (26.8%) | 205 (37.3%) |
| $800 to $999 | 74 (5.5%) | 84 (15.3%) |
| $1,000 to $1,499 | 217 (16.0%) | 22 (4.0%) |
| $1,500 to $1,999 | 70 (5.2%) | 0 (0.0%) |
| $2,000 to $2,499 | 43 (3.2%) | 0 (0.0%) |
| $2,500 to $2,999 | 31 (2.3%) | 0 (0.0%) |
| $3,000 or more | 5 (0.4%) | 0 (0.0%) |
| Total | 1,355 (100.0%) | 550 (100.0%) |
Physical Housing Characteristics in Bath County
Housing Structures in Bath County
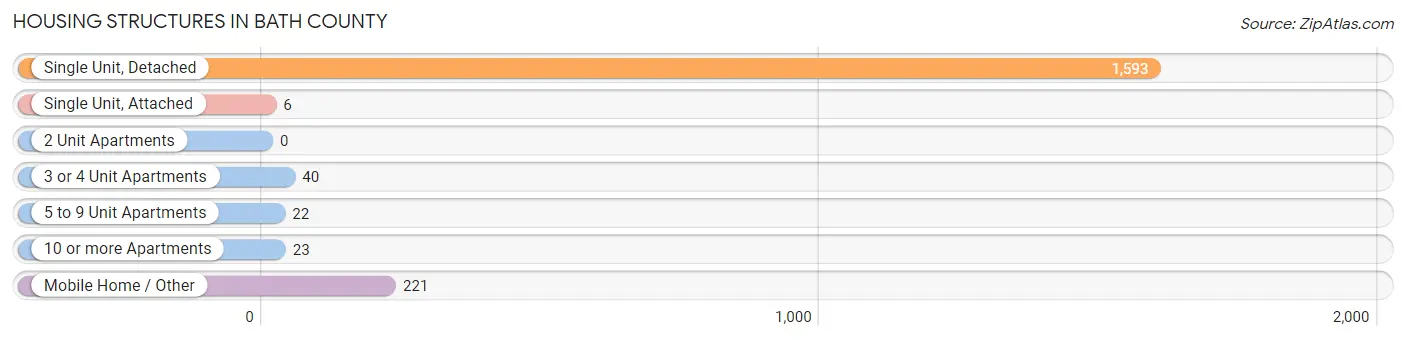
| Structure Type | # Housing Units | % Housing Units |
| Single Unit, Detached | 1,593 | 83.6% |
| Single Unit, Attached | 6 | 0.3% |
| 2 Unit Apartments | 0 | 0.0% |
| 3 or 4 Unit Apartments | 40 | 2.1% |
| 5 to 9 Unit Apartments | 22 | 1.1% |
| 10 or more Apartments | 23 | 1.2% |
| Mobile Home / Other | 221 | 11.6% |
| Total | 1,905 | 100.0% |
Housing Structures by Occupancy in Bath County
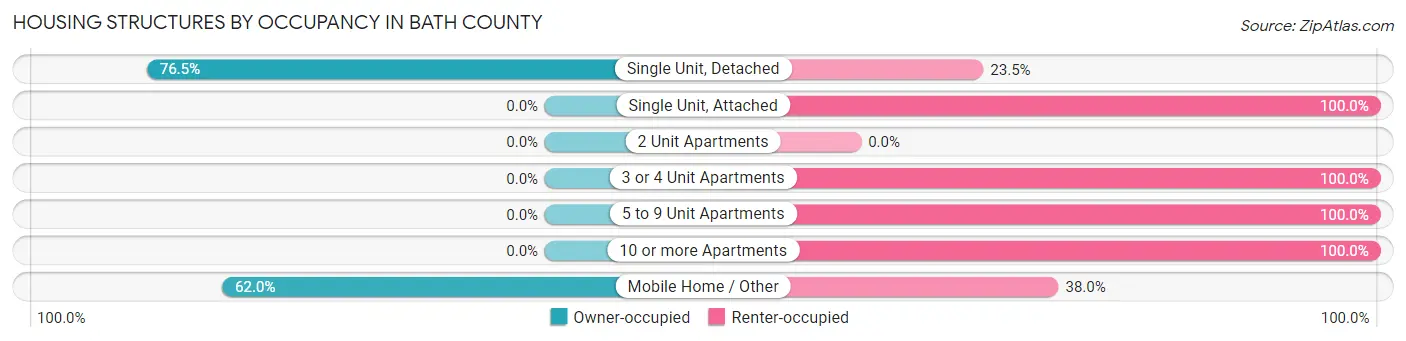
| Structure Type | Owner-occupied | Renter-occupied |
| Single Unit, Detached | 1,218 (76.5%) | 375 (23.5%) |
| Single Unit, Attached | 0 (0.0%) | 6 (100.0%) |
| 2 Unit Apartments | 0 (0.0%) | 0 (0.0%) |
| 3 or 4 Unit Apartments | 0 (0.0%) | 40 (100.0%) |
| 5 to 9 Unit Apartments | 0 (0.0%) | 22 (100.0%) |
| 10 or more Apartments | 0 (0.0%) | 23 (100.0%) |
| Mobile Home / Other | 137 (62.0%) | 84 (38.0%) |
| Total | 1,355 (71.1%) | 550 (28.9%) |
Housing Structures by Number of Rooms in Bath County
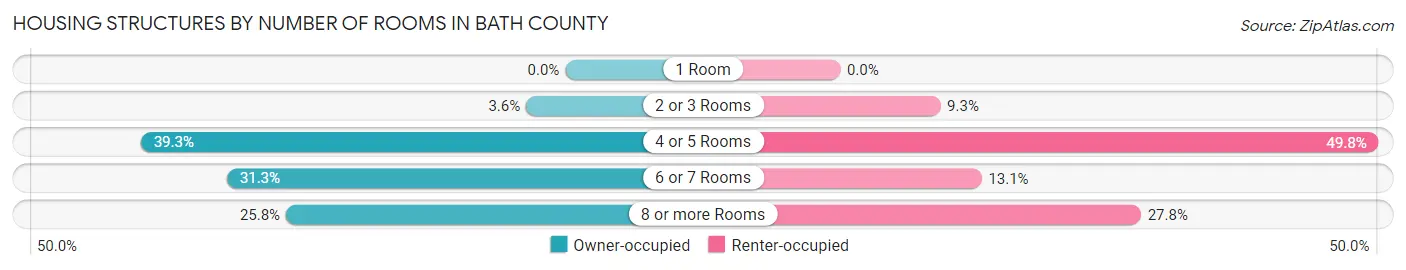
| Number of Rooms | Owner-occupied | Renter-occupied |
| 1 Room | 0 (0.0%) | 0 (0.0%) |
| 2 or 3 Rooms | 49 (3.6%) | 51 (9.3%) |
| 4 or 5 Rooms | 532 (39.3%) | 274 (49.8%) |
| 6 or 7 Rooms | 424 (31.3%) | 72 (13.1%) |
| 8 or more Rooms | 350 (25.8%) | 153 (27.8%) |
| Total | 1,355 (100.0%) | 550 (100.0%) |
Housing Structure by Heating Type in Bath County
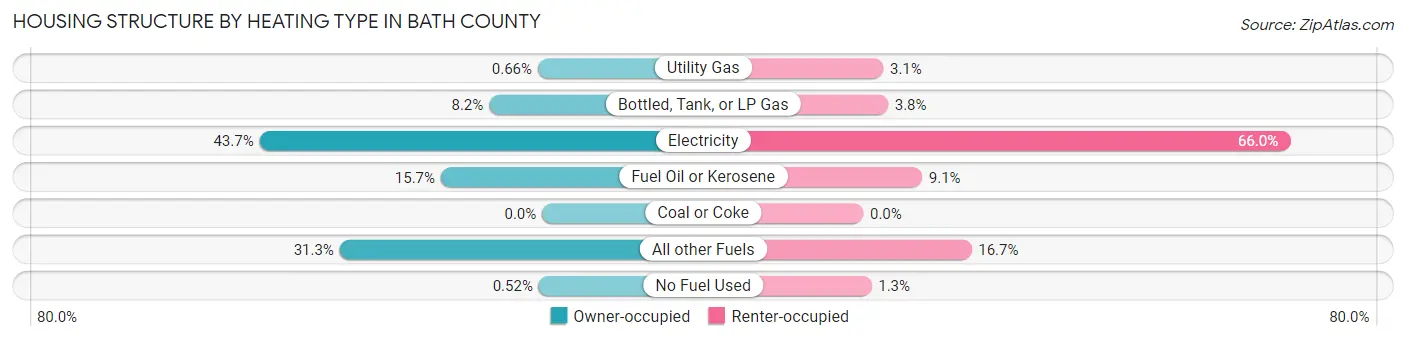
| Heating Type | Owner-occupied | Renter-occupied |
| Utility Gas | 9 (0.7%) | 17 (3.1%) |
| Bottled, Tank, or LP Gas | 111 (8.2%) | 21 (3.8%) |
| Electricity | 592 (43.7%) | 363 (66.0%) |
| Fuel Oil or Kerosene | 212 (15.7%) | 50 (9.1%) |
| Coal or Coke | 0 (0.0%) | 0 (0.0%) |
| All other Fuels | 424 (31.3%) | 92 (16.7%) |
| No Fuel Used | 7 (0.5%) | 7 (1.3%) |
| Total | 1,355 (100.0%) | 550 (100.0%) |
Household Vehicle Usage in Bath County
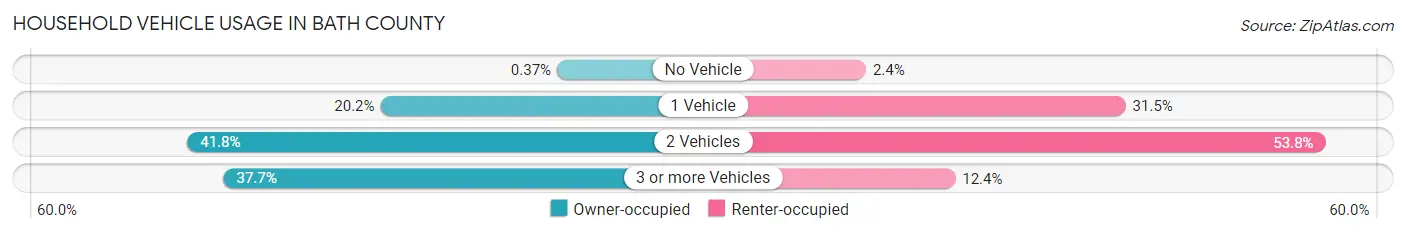
| Vehicles per Household | Owner-occupied | Renter-occupied |
| No Vehicle | 5 (0.4%) | 13 (2.4%) |
| 1 Vehicle | 273 (20.2%) | 173 (31.5%) |
| 2 Vehicles | 566 (41.8%) | 296 (53.8%) |
| 3 or more Vehicles | 511 (37.7%) | 68 (12.4%) |
| Total | 1,355 (100.0%) | 550 (100.0%) |
Real Estate & Mortgages in Bath County
Real Estate and Mortgage Overview in Bath County
| Characteristic | Without Mortgage | With Mortgage |
| Housing Units | 800 | 555 |
| Median Property Value | $188,100 | $176,500 |
| Median Household Income | $59,643 | $108 |
| Monthly Housing Costs | $402 | $5 |
| Real Estate Taxes | $708 | $25 |
Property Value by Mortgage Status in Bath County
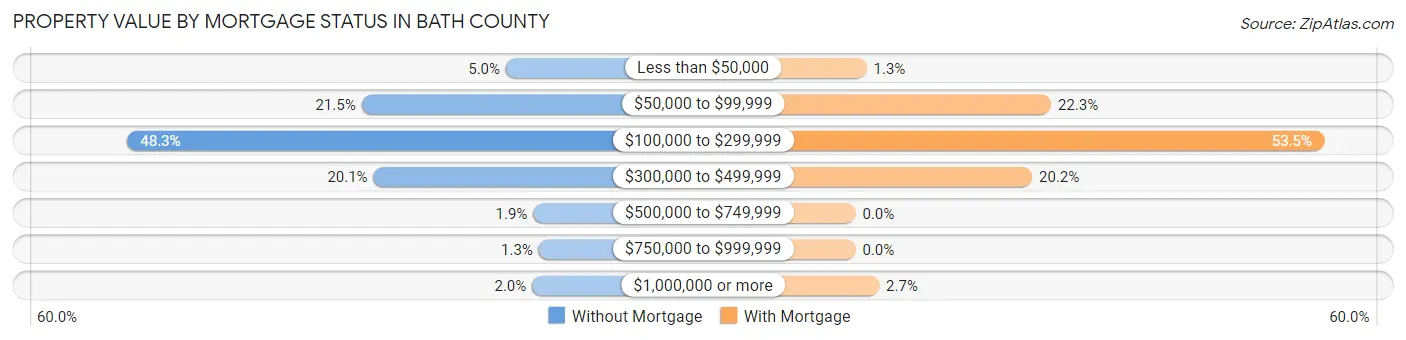
| Property Value | Without Mortgage | With Mortgage |
| Less than $50,000 | 40 (5.0%) | 7 (1.3%) |
| $50,000 to $99,999 | 172 (21.5%) | 124 (22.3%) |
| $100,000 to $299,999 | 386 (48.2%) | 297 (53.5%) |
| $300,000 to $499,999 | 161 (20.1%) | 112 (20.2%) |
| $500,000 to $749,999 | 15 (1.9%) | 0 (0.0%) |
| $750,000 to $999,999 | 10 (1.3%) | 0 (0.0%) |
| $1,000,000 or more | 16 (2.0%) | 15 (2.7%) |
| Total | 800 (100.0%) | 555 (100.0%) |
Household Income by Mortgage Status in Bath County
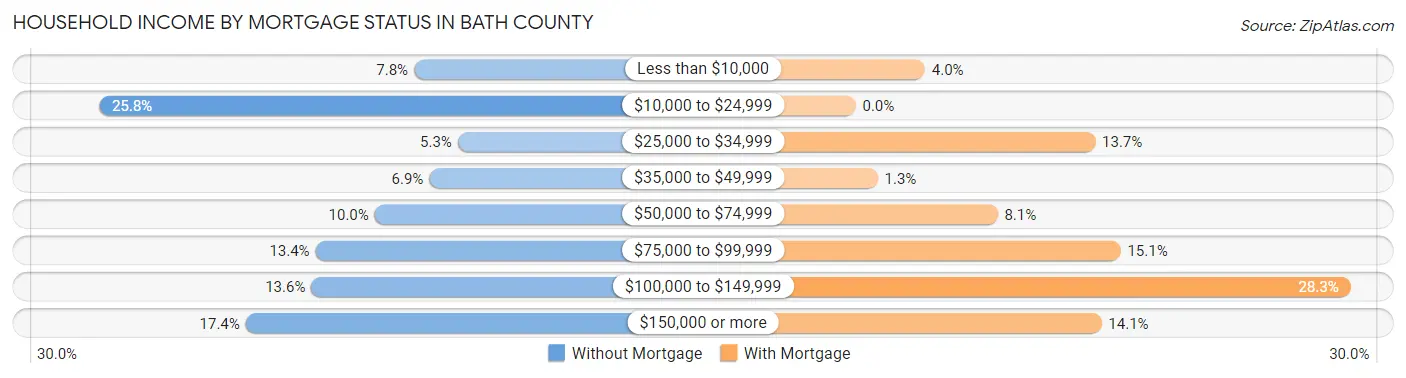
| Household Income | Without Mortgage | With Mortgage |
| Less than $10,000 | 62 (7.7%) | 22 (4.0%) |
| $10,000 to $24,999 | 206 (25.8%) | 0 (0.0%) |
| $25,000 to $34,999 | 42 (5.2%) | 76 (13.7%) |
| $35,000 to $49,999 | 55 (6.9%) | 7 (1.3%) |
| $50,000 to $74,999 | 80 (10.0%) | 45 (8.1%) |
| $75,000 to $99,999 | 107 (13.4%) | 84 (15.1%) |
| $100,000 to $149,999 | 109 (13.6%) | 157 (28.3%) |
| $150,000 or more | 139 (17.4%) | 78 (14.1%) |
| Total | 800 (100.0%) | 555 (100.0%) |
Property Value to Household Income Ratio in Bath County
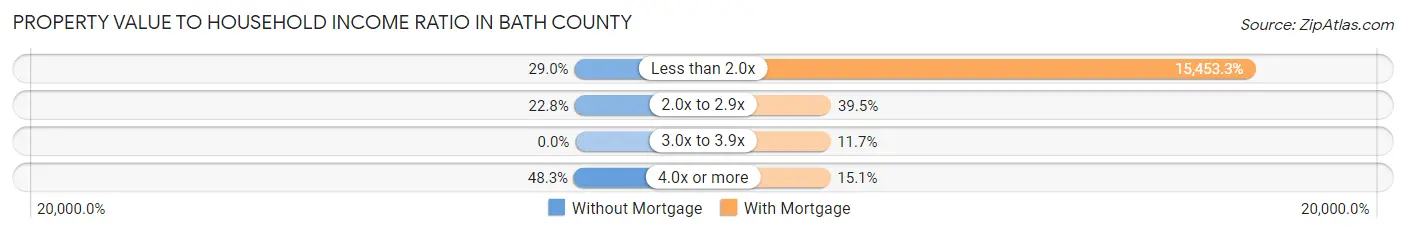
| Value-to-Income Ratio | Without Mortgage | With Mortgage |
| Less than 2.0x | 232 (29.0%) | 85,766 (15,453.3%) |
| 2.0x to 2.9x | 182 (22.8%) | 219 (39.5%) |
| 3.0x to 3.9x | 0 (0.0%) | 65 (11.7%) |
| 4.0x or more | 386 (48.2%) | 84 (15.1%) |
| Total | 800 (100.0%) | 555 (100.0%) |
Real Estate Taxes by Mortgage Status in Bath County
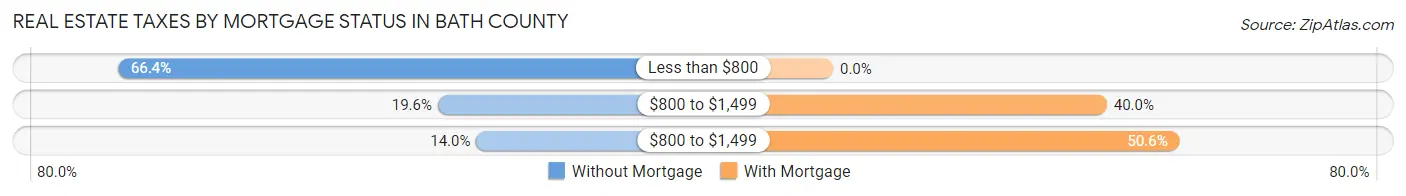
| Property Taxes | Without Mortgage | With Mortgage |
| Less than $800 | 531 (66.4%) | 0 (0.0%) |
| $800 to $1,499 | 157 (19.6%) | 222 (40.0%) |
| $800 to $1,499 | 112 (14.0%) | 281 (50.6%) |
| Total | 800 (100.0%) | 555 (100.0%) |
Health & Disability in Bath County
Health Insurance Coverage by Age in Bath County
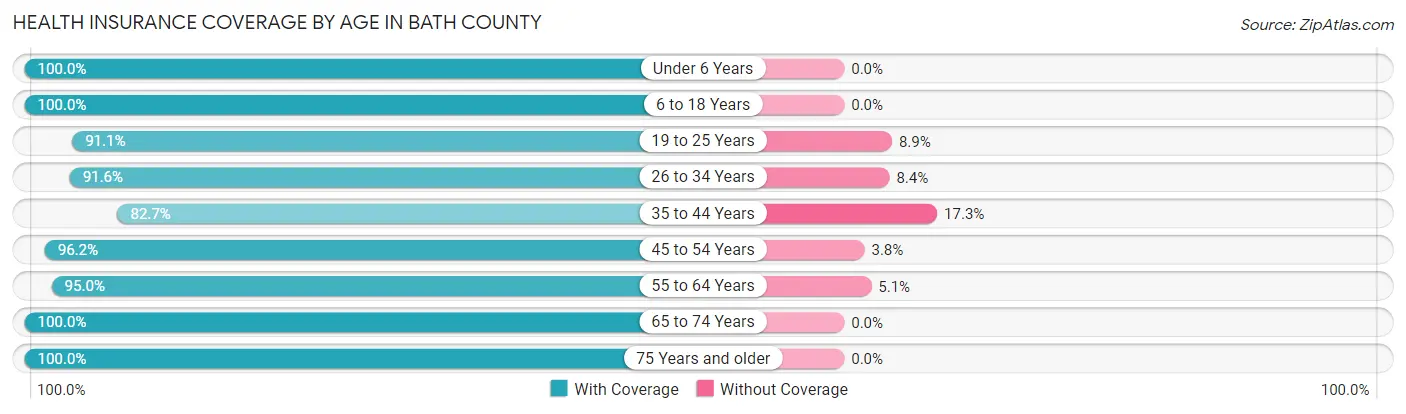
| Age Bracket | With Coverage | Without Coverage |
| Under 6 Years | 234 (100.0%) | 0 (0.0%) |
| 6 to 18 Years | 442 (100.0%) | 0 (0.0%) |
| 19 to 25 Years | 287 (91.1%) | 28 (8.9%) |
| 26 to 34 Years | 359 (91.6%) | 33 (8.4%) |
| 35 to 44 Years | 382 (82.7%) | 80 (17.3%) |
| 45 to 54 Years | 408 (96.2%) | 16 (3.8%) |
| 55 to 64 Years | 639 (95.0%) | 34 (5.1%) |
| 65 to 74 Years | 678 (100.0%) | 0 (0.0%) |
| 75 Years and older | 449 (100.0%) | 0 (0.0%) |
| Total | 3,878 (95.3%) | 191 (4.7%) |
Health Insurance Coverage by Citizenship Status in Bath County
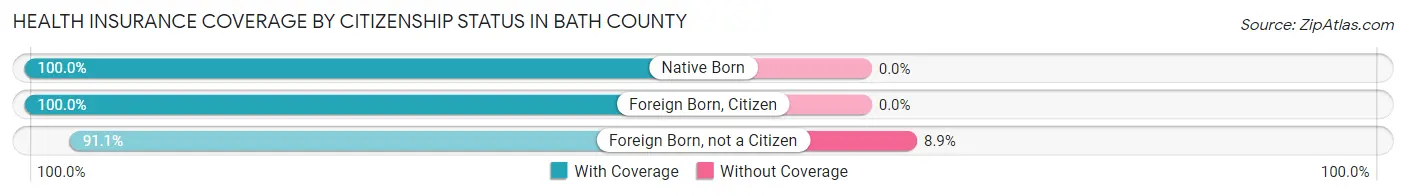
| Citizenship Status | With Coverage | Without Coverage |
| Native Born | 234 (100.0%) | 0 (0.0%) |
| Foreign Born, Citizen | 442 (100.0%) | 0 (0.0%) |
| Foreign Born, not a Citizen | 287 (91.1%) | 28 (8.9%) |
Health Insurance Coverage by Household Income in Bath County
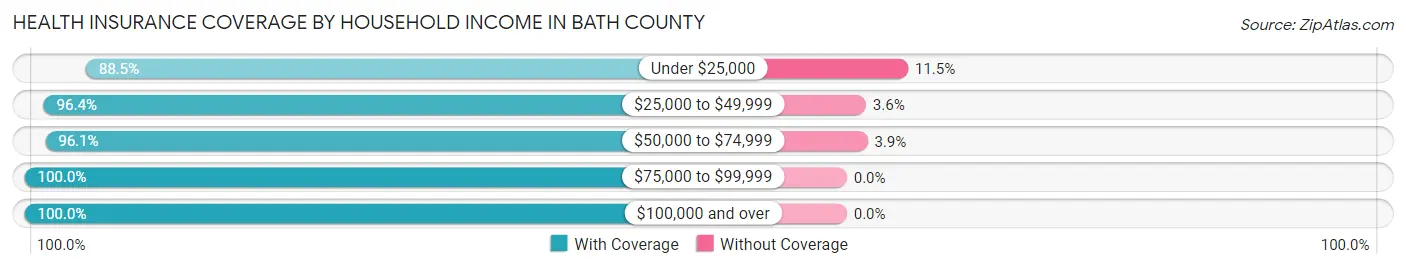
| Household Income | With Coverage | Without Coverage |
| Under $25,000 | 733 (88.5%) | 95 (11.5%) |
| $25,000 to $49,999 | 862 (96.4%) | 32 (3.6%) |
| $50,000 to $74,999 | 669 (96.1%) | 27 (3.9%) |
| $75,000 to $99,999 | 544 (100.0%) | 0 (0.0%) |
| $100,000 and over | 996 (100.0%) | 0 (0.0%) |
Public vs Private Health Insurance Coverage by Age in Bath County
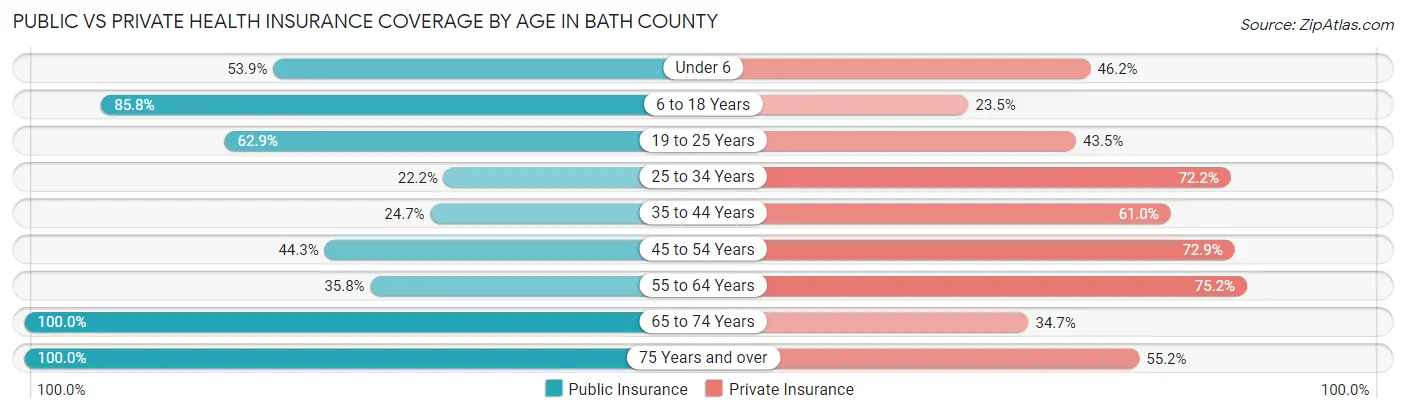
| Age Bracket | Public Insurance | Private Insurance |
| Under 6 | 126 (53.8%) | 108 (46.2%) |
| 6 to 18 Years | 379 (85.8%) | 104 (23.5%) |
| 19 to 25 Years | 198 (62.9%) | 137 (43.5%) |
| 25 to 34 Years | 87 (22.2%) | 283 (72.2%) |
| 35 to 44 Years | 114 (24.7%) | 282 (61.0%) |
| 45 to 54 Years | 188 (44.3%) | 309 (72.9%) |
| 55 to 64 Years | 241 (35.8%) | 506 (75.2%) |
| 65 to 74 Years | 678 (100.0%) | 235 (34.7%) |
| 75 Years and over | 449 (100.0%) | 248 (55.2%) |
| Total | 2,460 (60.5%) | 2,212 (54.4%) |
Disability Status by Sex by Age in Bath County
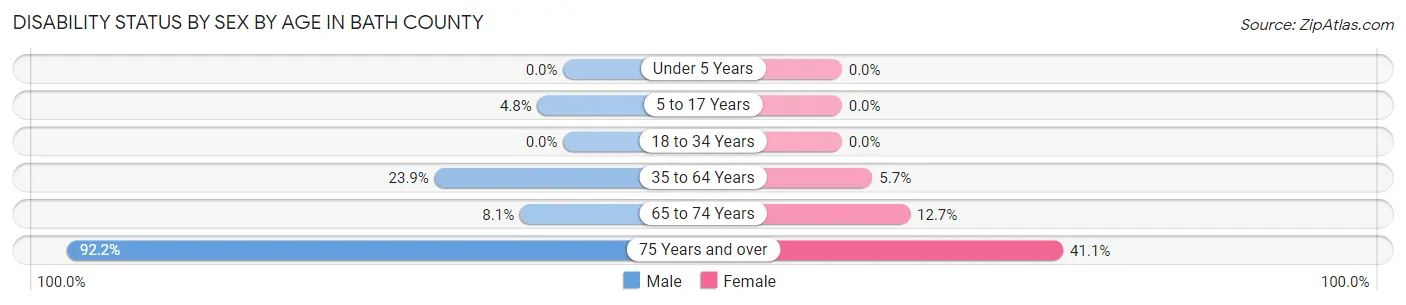
| Age Bracket | Male | Female |
| Under 5 Years | 0 (0.0%) | 0 (0.0%) |
| 5 to 17 Years | 12 (4.8%) | 0 (0.0%) |
| 18 to 34 Years | 0 (0.0%) | 0 (0.0%) |
| 35 to 64 Years | 217 (23.9%) | 37 (5.7%) |
| 65 to 74 Years | 26 (8.1%) | 45 (12.7%) |
| 75 Years and over | 176 (92.1%) | 106 (41.1%) |
Disability Class by Sex by Age in Bath County
Disability Class: Hearing Difficulty
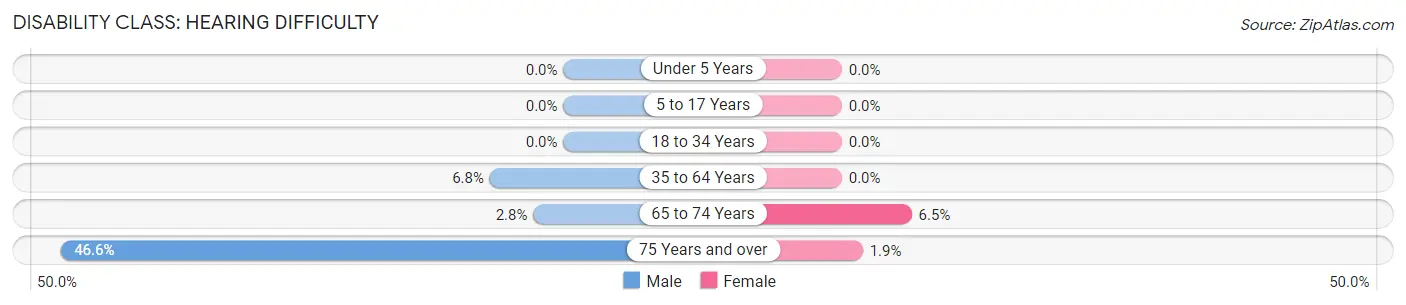
| Age Bracket | Male | Female |
| Under 5 Years | 0 (0.0%) | 0 (0.0%) |
| 5 to 17 Years | 0 (0.0%) | 0 (0.0%) |
| 18 to 34 Years | 0 (0.0%) | 0 (0.0%) |
| 35 to 64 Years | 62 (6.8%) | 0 (0.0%) |
| 65 to 74 Years | 9 (2.8%) | 23 (6.5%) |
| 75 Years and over | 89 (46.6%) | 5 (1.9%) |
Disability Class: Vision Difficulty
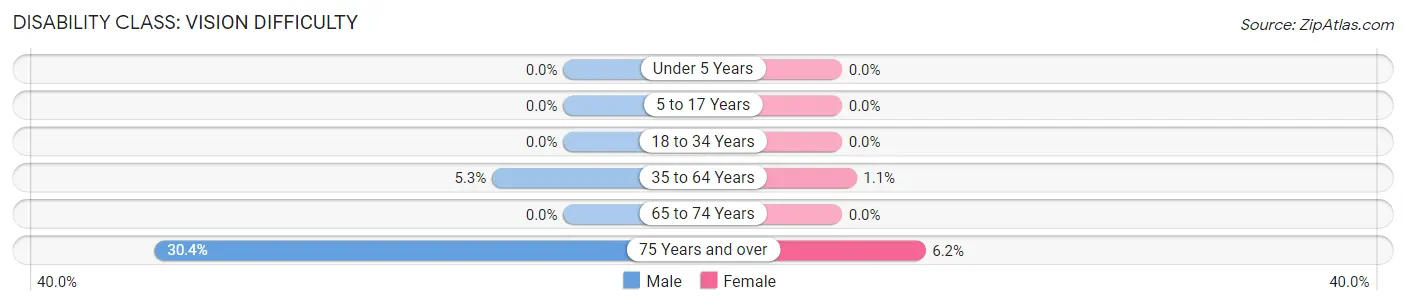
| Age Bracket | Male | Female |
| Under 5 Years | 0 (0.0%) | 0 (0.0%) |
| 5 to 17 Years | 0 (0.0%) | 0 (0.0%) |
| 18 to 34 Years | 0 (0.0%) | 0 (0.0%) |
| 35 to 64 Years | 48 (5.3%) | 7 (1.1%) |
| 65 to 74 Years | 0 (0.0%) | 0 (0.0%) |
| 75 Years and over | 58 (30.4%) | 16 (6.2%) |
Disability Class: Cognitive Difficulty
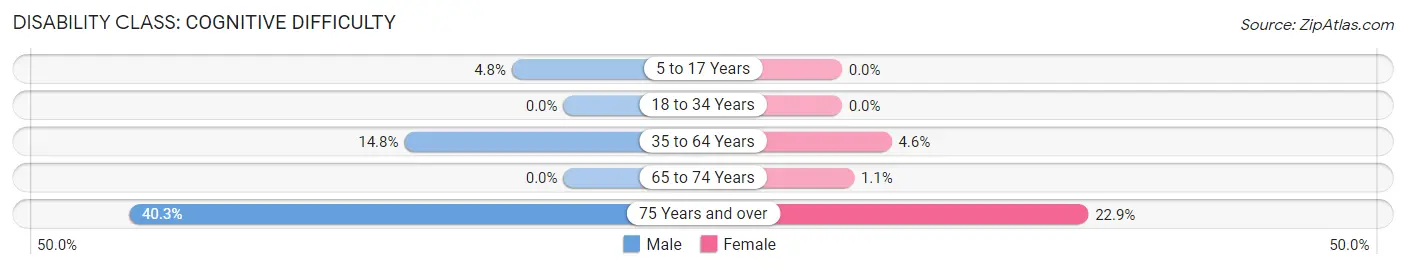
| Age Bracket | Male | Female |
| 5 to 17 Years | 12 (4.8%) | 0 (0.0%) |
| 18 to 34 Years | 0 (0.0%) | 0 (0.0%) |
| 35 to 64 Years | 134 (14.8%) | 30 (4.6%) |
| 65 to 74 Years | 0 (0.0%) | 4 (1.1%) |
| 75 Years and over | 77 (40.3%) | 59 (22.9%) |
Disability Class: Ambulatory Difficulty
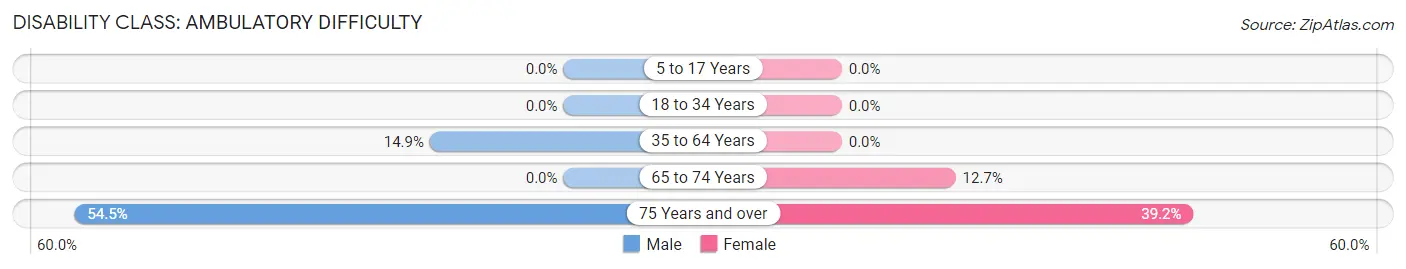
| Age Bracket | Male | Female |
| 5 to 17 Years | 0 (0.0%) | 0 (0.0%) |
| 18 to 34 Years | 0 (0.0%) | 0 (0.0%) |
| 35 to 64 Years | 135 (14.9%) | 0 (0.0%) |
| 65 to 74 Years | 0 (0.0%) | 45 (12.7%) |
| 75 Years and over | 104 (54.4%) | 101 (39.2%) |
Disability Class: Self-Care Difficulty
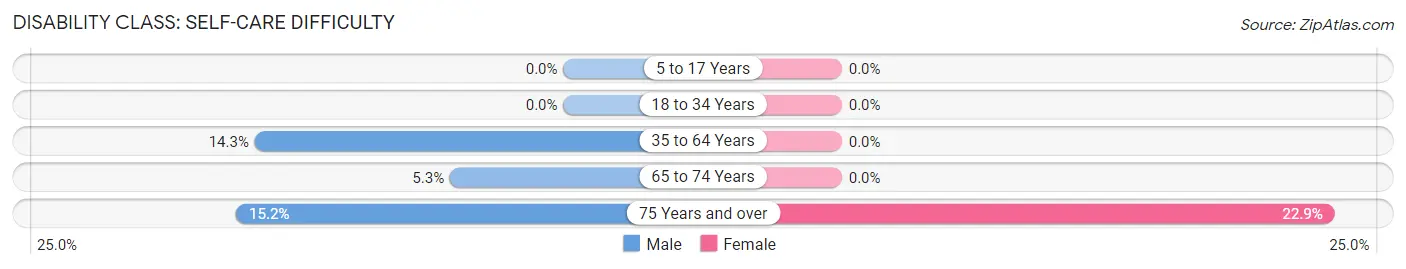
| Age Bracket | Male | Female |
| 5 to 17 Years | 0 (0.0%) | 0 (0.0%) |
| 18 to 34 Years | 0 (0.0%) | 0 (0.0%) |
| 35 to 64 Years | 130 (14.3%) | 0 (0.0%) |
| 65 to 74 Years | 17 (5.3%) | 0 (0.0%) |
| 75 Years and over | 29 (15.2%) | 59 (22.9%) |
Technology Access in Bath County
Computing Device Access in Bath County
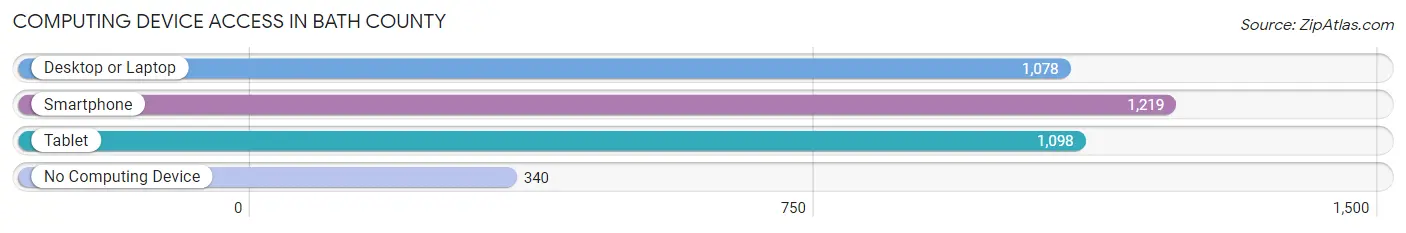
| Device Type | # Households | % Households |
| Desktop or Laptop | 1,078 | 56.6% |
| Smartphone | 1,219 | 64.0% |
| Tablet | 1,098 | 57.6% |
| No Computing Device | 340 | 17.8% |
| Total | 1,905 | 100.0% |
Internet Access in Bath County
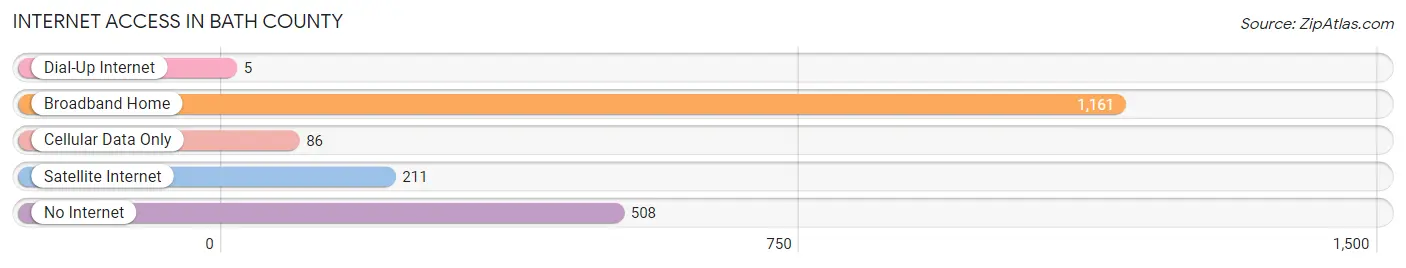
| Internet Type | # Households | % Households |
| Dial-Up Internet | 5 | 0.3% |
| Broadband Home | 1,161 | 60.9% |
| Cellular Data Only | 86 | 4.5% |
| Satellite Internet | 211 | 11.1% |
| No Internet | 508 | 26.7% |
| Total | 1,905 | 100.0% |
Bath County Summary
Bath County, Virginia is located in the western part of the state, in the Appalachian Mountains. It is bordered by Alleghany County to the north, Rockbridge County to the east, Augusta County to the south, and Highland County to the west. The county seat is Warm Springs, and the county is home to the George Washington National Forest.
History
Bath County was formed in 1790 from Augusta County. It was named after the English spa town of Bath, Somerset. The county was home to several Native American tribes, including the Monacan, Shawnee, and Cherokee. The first European settlers arrived in the area in the 1730s.
The county was home to several prominent figures in American history, including Thomas Jefferson, who owned a plantation in the county. The county was also home to the first president of the United States, George Washington, who owned a plantation in the county.
Geography
Bath County is located in the Appalachian Mountains of western Virginia. It is bordered by Alleghany County to the north, Rockbridge County to the east, Augusta County to the south, and Highland County to the west. The county is home to the George Washington National Forest, which covers over 1,000 square miles.
The county is home to several mountain ranges, including the Allegheny Mountains, the Blue Ridge Mountains, and the Shenandoah Valley. The county is also home to several rivers, including the Cowpasture River, the Jackson River, and the James River.
The county has a total area of 517 square miles, of which 514 square miles is land and 3 square miles is water. The county has a humid subtropical climate, with hot, humid summers and cold, wet winters.
Economy
Bath County has a diverse economy, with a mix of agriculture, manufacturing, and tourism. The county is home to several large employers, including the Bath County Public Schools, the Bath County Sheriff's Office, and the Bath County Health Department.
Agriculture is an important part of the county's economy, with the county producing a variety of crops, including corn, soybeans, hay, and wheat. The county is also home to several livestock farms, including beef cattle, dairy cattle, and sheep.
Manufacturing is also an important part of the county's economy, with the county home to several factories, including a paper mill, a furniture factory, and a plastics factory.
Tourism is also an important part of the county's economy, with the county home to several popular attractions, including the Homestead Resort, the Hot Springs Resort, and the George Washington National Forest.
Demographics
As of the 2010 census, Bath County had a population of 4,731. The racial makeup of the county was 95.3% White, 2.2% Black or African American, 0.3% Native American, 0.2% Asian, 0.1% Pacific Islander, 0.7% from other races, and 1.3% from two or more races. Hispanic or Latino of any race were 1.7% of the population.
The median income for a household in the county was $37,917, and the median income for a family was $45,938. The per capita income for the county was $20,945. About 11.2% of families and 14.2% of the population were below the poverty line, including 19.2% of those under age 18 and 11.2% of those age 65 or over.
Common Questions
What is Per Capita Income in Bath County?
Per Capita income in Bath County is $33,856.
What is the Median Family Income in Bath County?
Median Family Income in Bath County is $75,346.
What is the Median Household income in Bath County?
Median Household Income in Bath County is $55,699.
What is Income or Wage Gap in Bath County?
Income or Wage Gap in Bath County is 6.2%.
Women in Bath County earn 93.8 cents for every dollar earned by a man.
What is Family Income Deficit in Bath County?
Family Income Deficit in Bath County is $3,878.
Families that are below poverty line in Bath County earn $3,878 less on average than the poverty threshold level.
What is Inequality or Gini Index in Bath County?
Inequality or Gini Index in Bath County is 0.47.
What is the Total Population of Bath County?
Total Population of Bath County is 4,177.
What is the Total Male Population of Bath County?
Total Male Population of Bath County is 2,073.
What is the Total Female Population of Bath County?
Total Female Population of Bath County is 2,104.
What is the Ratio of Males per 100 Females in Bath County?
There are 98.53 Males per 100 Females in Bath County.
What is the Ratio of Females per 100 Males in Bath County?
There are 101.50 Females per 100 Males in Bath County.
What is the Median Population Age in Bath County?
Median Population Age in Bath County is 51.8 Years.
What is the Average Family Size in Bath County
Average Family Size in Bath County is 2.7 People.
What is the Average Household Size in Bath County
Average Household Size in Bath County is 2.1 People.
How Large is the Labor Force in Bath County?
There are 1,806 People in the Labor Forcein in Bath County.
What is the Percentage of People in the Labor Force in Bath County?
51.1% of People are in the Labor Force in Bath County.
What is the Unemployment Rate in Bath County?
Unemployment Rate in Bath County is 2.0%.