Augusta County, VA Map & Demographics
Augusta County Map
Augusta County Overview
$35,582
PER CAPITA INCOME
$90,083
AVG FAMILY INCOME
$76,124
AVG HOUSEHOLD INCOME
24.4%
WAGE / INCOME GAP [ % ]
75.6¢/ $1
WAGE / INCOME GAP [ $ ]
$10,321
FAMILY INCOME DEFICIT
0.40
INEQUALITY / GINI INDEX
77,433
TOTAL POPULATION
39,547
MALE POPULATION
37,886
FEMALE POPULATION
104.38
MALES / 100 FEMALES
95.80
FEMALES / 100 MALES
44.8
MEDIAN AGE
2.9
AVG FAMILY SIZE
2.5
AVG HOUSEHOLD SIZE
38,882
LABOR FORCE [ PEOPLE ]
60.1%
PERCENT IN LABOR FORCE
3.0%
UNEMPLOYMENT RATE
Augusta County Area Codes
Income in Augusta County
Income Overview in Augusta County
Per Capita Income in Augusta County is $35,582, while median incomes of families and households are $90,083 and $76,124 respectively.
| Characteristic | Number | Measure |
| Per Capita Income | 77,433 | $35,582 |
| Median Family Income | 20,735 | $90,083 |
| Mean Family Income | 20,735 | $103,030 |
| Median Household Income | 30,056 | $76,124 |
| Mean Household Income | 30,056 | $89,194 |
| Income Deficit | 20,735 | $10,321 |
| Wage / Income Gap (%) | 77,433 | 24.42% |
| Wage / Income Gap ($) | 77,433 | 75.58¢ per $1 |
| Gini / Inequality Index | 77,433 | 0.40 |
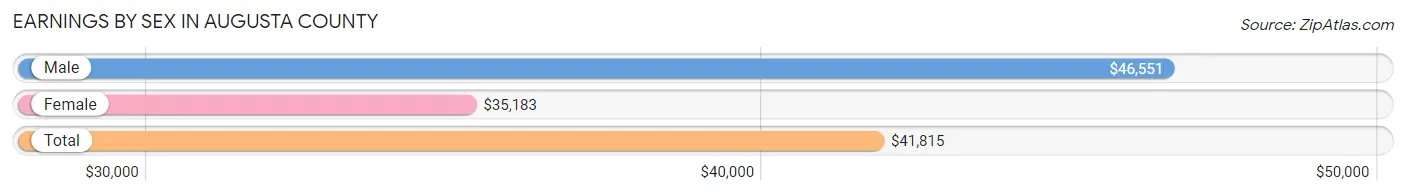
Earnings by Sex in Augusta County
Average Earnings in Augusta County are $41,815, $46,551 for men and $35,183 for women, a difference of 24.4%.
| Sex | Number | Average Earnings |
| Male | 22,356 (53.6%) | $46,551 |
| Female | 19,323 (46.4%) | $35,183 |
| Total | 41,679 (100.0%) | $41,815 |
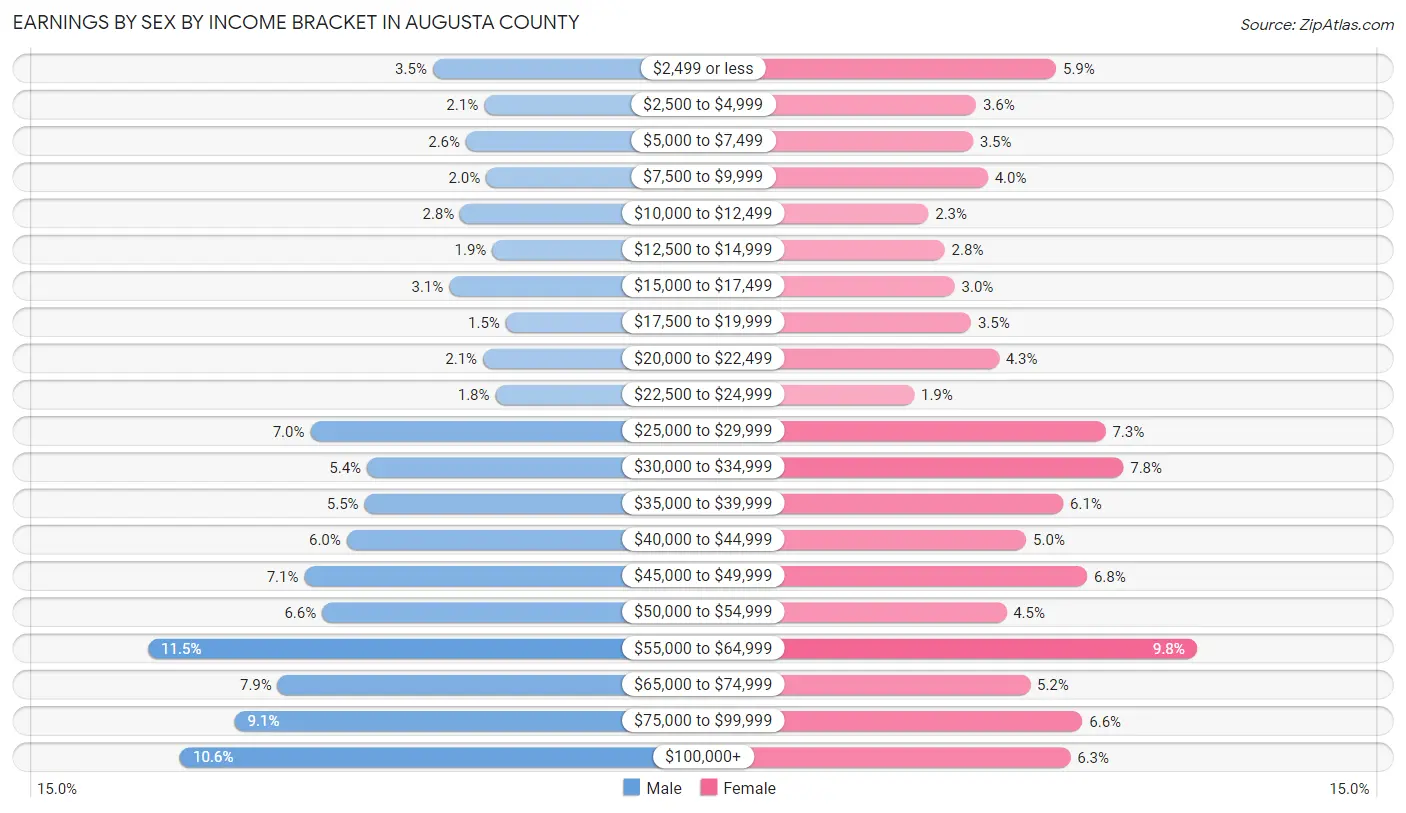
Earnings by Sex by Income Bracket in Augusta County
The most common earnings brackets in Augusta County are $55,000 to $64,999 for men (2,578 | 11.5%) and $55,000 to $64,999 for women (1,899 | 9.8%).
| Income | Male | Female |
| $2,499 or less | 790 (3.5%) | 1,136 (5.9%) |
| $2,500 to $4,999 | 468 (2.1%) | 701 (3.6%) |
| $5,000 to $7,499 | 581 (2.6%) | 684 (3.5%) |
| $7,500 to $9,999 | 454 (2.0%) | 766 (4.0%) |
| $10,000 to $12,499 | 618 (2.8%) | 442 (2.3%) |
| $12,500 to $14,999 | 415 (1.9%) | 532 (2.8%) |
| $15,000 to $17,499 | 686 (3.1%) | 586 (3.0%) |
| $17,500 to $19,999 | 331 (1.5%) | 674 (3.5%) |
| $20,000 to $22,499 | 474 (2.1%) | 826 (4.3%) |
| $22,500 to $24,999 | 396 (1.8%) | 365 (1.9%) |
| $25,000 to $29,999 | 1,558 (7.0%) | 1,405 (7.3%) |
| $30,000 to $34,999 | 1,203 (5.4%) | 1,502 (7.8%) |
| $35,000 to $39,999 | 1,219 (5.4%) | 1,175 (6.1%) |
| $40,000 to $44,999 | 1,330 (5.9%) | 973 (5.0%) |
| $45,000 to $49,999 | 1,596 (7.1%) | 1,304 (6.8%) |
| $50,000 to $54,999 | 1,485 (6.6%) | 865 (4.5%) |
| $55,000 to $64,999 | 2,578 (11.5%) | 1,899 (9.8%) |
| $65,000 to $74,999 | 1,764 (7.9%) | 995 (5.1%) |
| $75,000 to $99,999 | 2,034 (9.1%) | 1,279 (6.6%) |
| $100,000+ | 2,376 (10.6%) | 1,214 (6.3%) |
| Total | 22,356 (100.0%) | 19,323 (100.0%) |
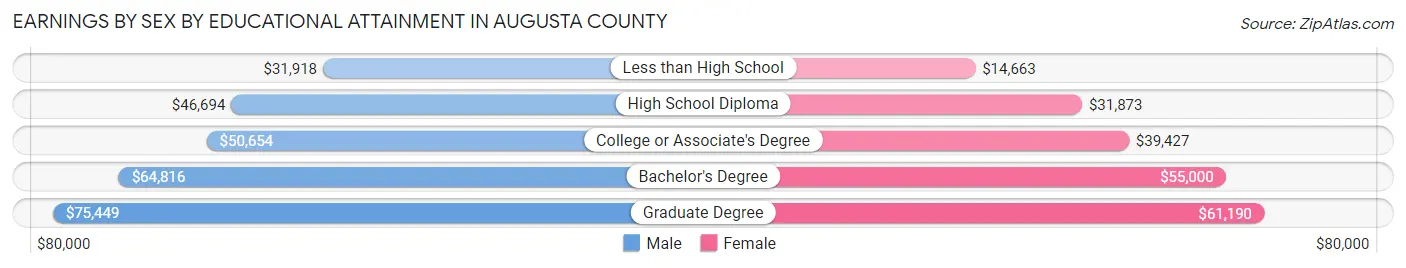
Earnings by Sex by Educational Attainment in Augusta County
Average earnings in Augusta County are $50,926 for men and $39,763 for women, a difference of 21.9%. Men with an educational attainment of graduate degree enjoy the highest average annual earnings of $75,449, while those with less than high school education earn the least with $31,918. Women with an educational attainment of graduate degree earn the most with the average annual earnings of $61,190, while those with less than high school education have the smallest earnings of $14,663.
| Educational Attainment | Male Income | Female Income |
| Less than High School | $31,918 | $14,663 |
| High School Diploma | $46,694 | $31,873 |
| College or Associate's Degree | $50,654 | $39,427 |
| Bachelor's Degree | $64,816 | $55,000 |
| Graduate Degree | $75,449 | $61,190 |
| Total | $50,926 | $39,763 |
Family Income in Augusta County
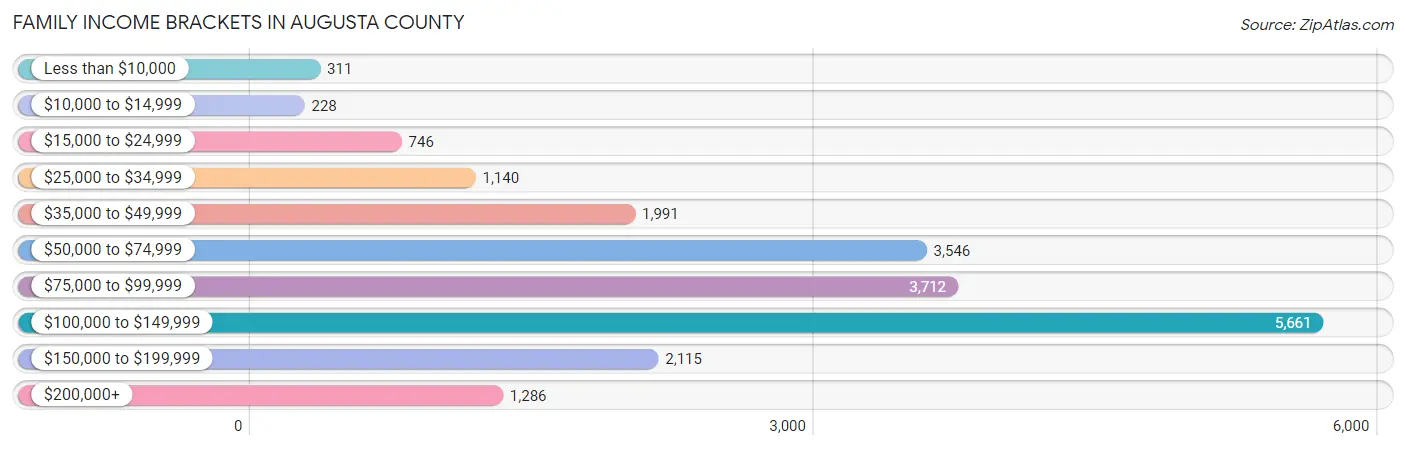
Family Income Brackets in Augusta County
According to the Augusta County family income data, there are 5,661 families falling into the $100,000 to $149,999 income range, which is the most common income bracket and makes up 27.3% of all families. Conversely, the $10,000 to $14,999 income bracket is the least frequent group with only 228 families (1.1%) belonging to this category.
| Income Bracket | # Families | % Families |
| Less than $10,000 | 311 | 1.5% |
| $10,000 to $14,999 | 228 | 1.1% |
| $15,000 to $24,999 | 746 | 3.6% |
| $25,000 to $34,999 | 1,140 | 5.5% |
| $35,000 to $49,999 | 1,991 | 9.6% |
| $50,000 to $74,999 | 3,546 | 17.1% |
| $75,000 to $99,999 | 3,712 | 17.9% |
| $100,000 to $149,999 | 5,661 | 27.3% |
| $150,000 to $199,999 | 2,115 | 10.2% |
| $200,000+ | 1,286 | 6.2% |
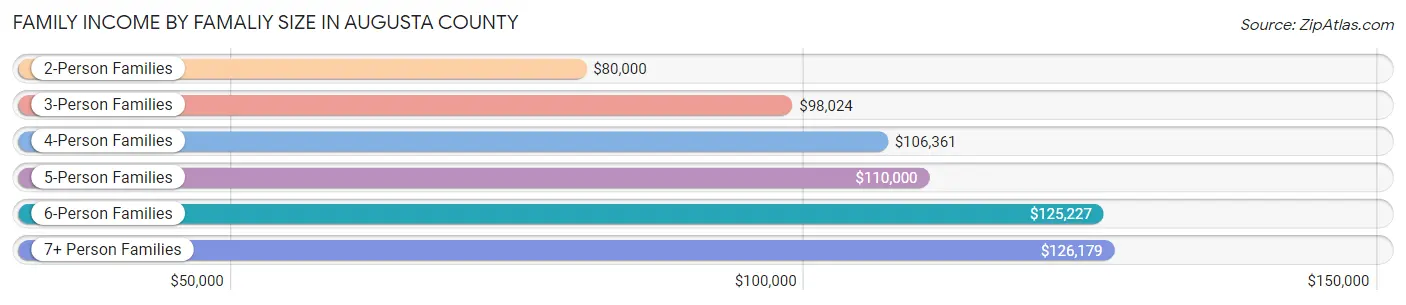
Family Income by Famaliy Size in Augusta County
7+ person families (287 | 1.4%) account for the highest median family income in Augusta County with $126,179 per family, while 2-person families (10,722 | 51.7%) have the highest median income of $40,000 per family member.
| Income Bracket | # Families | Median Income |
| 2-Person Families | 10,722 (51.7%) | $80,000 |
| 3-Person Families | 4,968 (24.0%) | $98,024 |
| 4-Person Families | 2,816 (13.6%) | $106,361 |
| 5-Person Families | 1,286 (6.2%) | $110,000 |
| 6-Person Families | 656 (3.2%) | $125,227 |
| 7+ Person Families | 287 (1.4%) | $126,179 |
| Total | 20,735 (100.0%) | $90,083 |
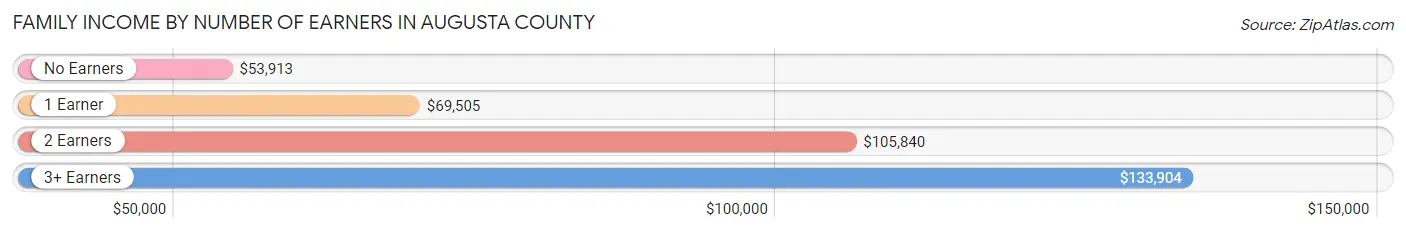
Family Income by Number of Earners in Augusta County
The median family income in Augusta County is $90,083, with families comprising 3+ earners (2,450) having the highest median family income of $133,904, while families with no earners (3,647) have the lowest median family income of $53,913, accounting for 11.8% and 17.6% of families, respectively.
| Number of Earners | # Families | Median Income |
| No Earners | 3,647 (17.6%) | $53,913 |
| 1 Earner | 5,852 (28.2%) | $69,505 |
| 2 Earners | 8,786 (42.4%) | $105,840 |
| 3+ Earners | 2,450 (11.8%) | $133,904 |
| Total | 20,735 (100.0%) | $90,083 |
Household Income in Augusta County
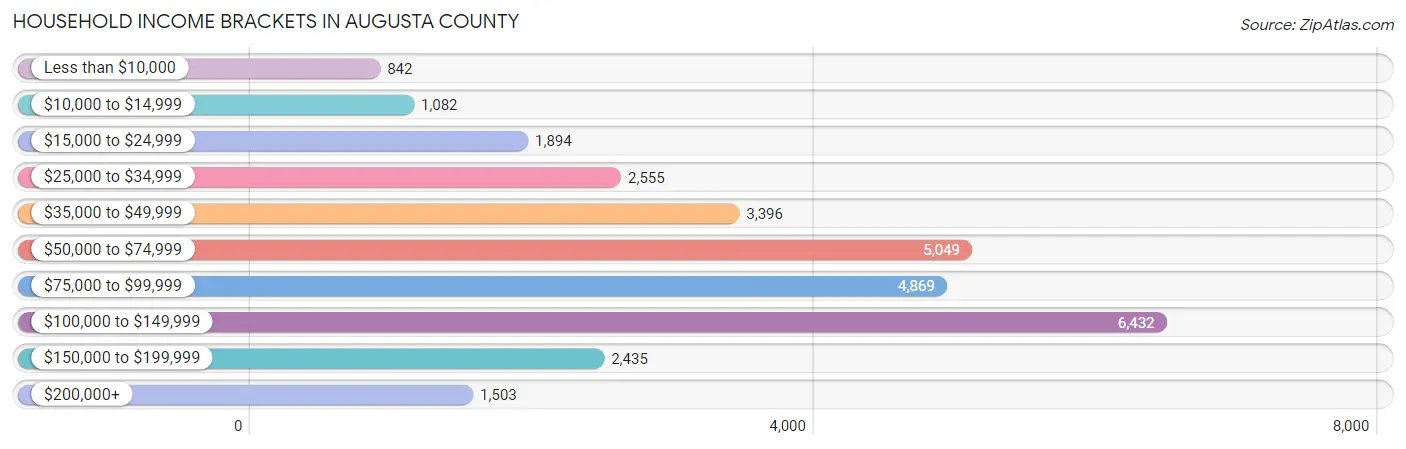
Household Income Brackets in Augusta County
With 6,432 households falling in the category, the $100,000 to $149,999 income range is the most frequent in Augusta County, accounting for 21.4% of all households. In contrast, only 842 households (2.8%) fall into the less than $10,000 income bracket, making it the least populous group.
| Income Bracket | # Households | % Households |
| Less than $10,000 | 842 | 2.8% |
| $10,000 to $14,999 | 1,082 | 3.6% |
| $15,000 to $24,999 | 1,894 | 6.3% |
| $25,000 to $34,999 | 2,555 | 8.5% |
| $35,000 to $49,999 | 3,396 | 11.3% |
| $50,000 to $74,999 | 5,049 | 16.8% |
| $75,000 to $99,999 | 4,869 | 16.2% |
| $100,000 to $149,999 | 6,432 | 21.4% |
| $150,000 to $199,999 | 2,435 | 8.1% |
| $200,000+ | 1,503 | 5.0% |
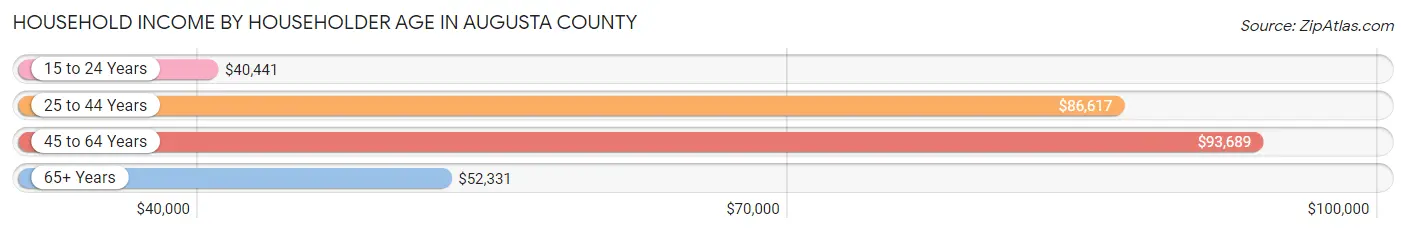
Household Income by Householder Age in Augusta County
The median household income in Augusta County is $76,124, with the highest median household income of $93,689 found in the 45 to 64 years age bracket for the primary householder. A total of 11,197 households (37.2%) fall into this category. Meanwhile, the 15 to 24 years age bracket for the primary householder has the lowest median household income of $40,441, with 710 households (2.4%) in this group.
| Income Bracket | # Households | Median Income |
| 15 to 24 Years | 710 (2.4%) | $40,441 |
| 25 to 44 Years | 7,582 (25.2%) | $86,617 |
| 45 to 64 Years | 11,197 (37.2%) | $93,689 |
| 65+ Years | 10,567 (35.2%) | $52,331 |
| Total | 30,056 (100.0%) | $76,124 |
Poverty in Augusta County
Income Below Poverty by Sex and Age in Augusta County
With 6.4% poverty level for males and 9.8% for females among the residents of Augusta County, 5 year old males and under 5 year old females are the most vulnerable to poverty, with 188 males (29.4%) and 356 females (21.1%) in their respective age groups living below the poverty level.
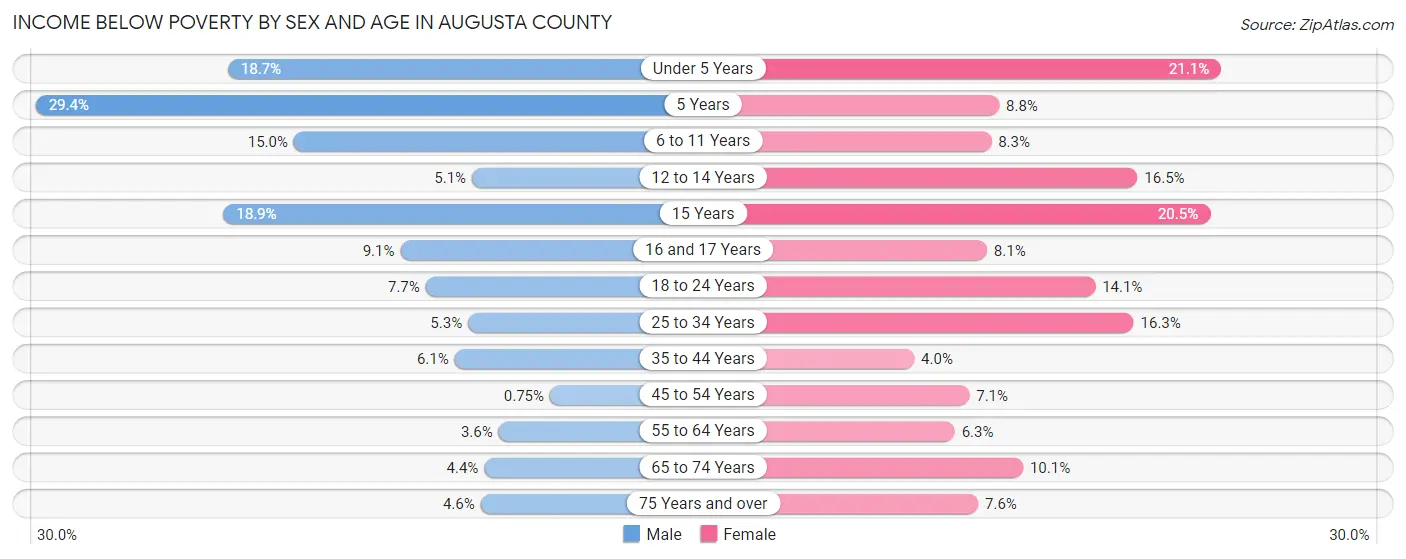
| Age Bracket | Male | Female |
| Under 5 Years | 322 (18.7%) | 356 (21.1%) |
| 5 Years | 188 (29.4%) | 36 (8.8%) |
| 6 to 11 Years | 306 (15.0%) | 216 (8.3%) |
| 12 to 14 Years | 79 (5.1%) | 176 (16.5%) |
| 15 Years | 74 (18.9%) | 106 (20.5%) |
| 16 and 17 Years | 93 (9.1%) | 61 (8.1%) |
| 18 to 24 Years | 222 (7.7%) | 353 (14.1%) |
| 25 to 34 Years | 215 (5.3%) | 672 (16.3%) |
| 35 to 44 Years | 252 (6.1%) | 175 (4.0%) |
| 45 to 54 Years | 35 (0.7%) | 341 (7.1%) |
| 55 to 64 Years | 200 (3.6%) | 365 (6.3%) |
| 65 to 74 Years | 201 (4.4%) | 502 (10.1%) |
| 75 Years and over | 145 (4.6%) | 290 (7.6%) |
| Total | 2,332 (6.4%) | 3,649 (9.8%) |
Income Above Poverty by Sex and Age in Augusta County
According to the poverty statistics in Augusta County, males aged 45 to 54 years and females aged 35 to 44 years are the age groups that are most secure financially, with 99.3% of males and 96.0% of females in these age groups living above the poverty line.
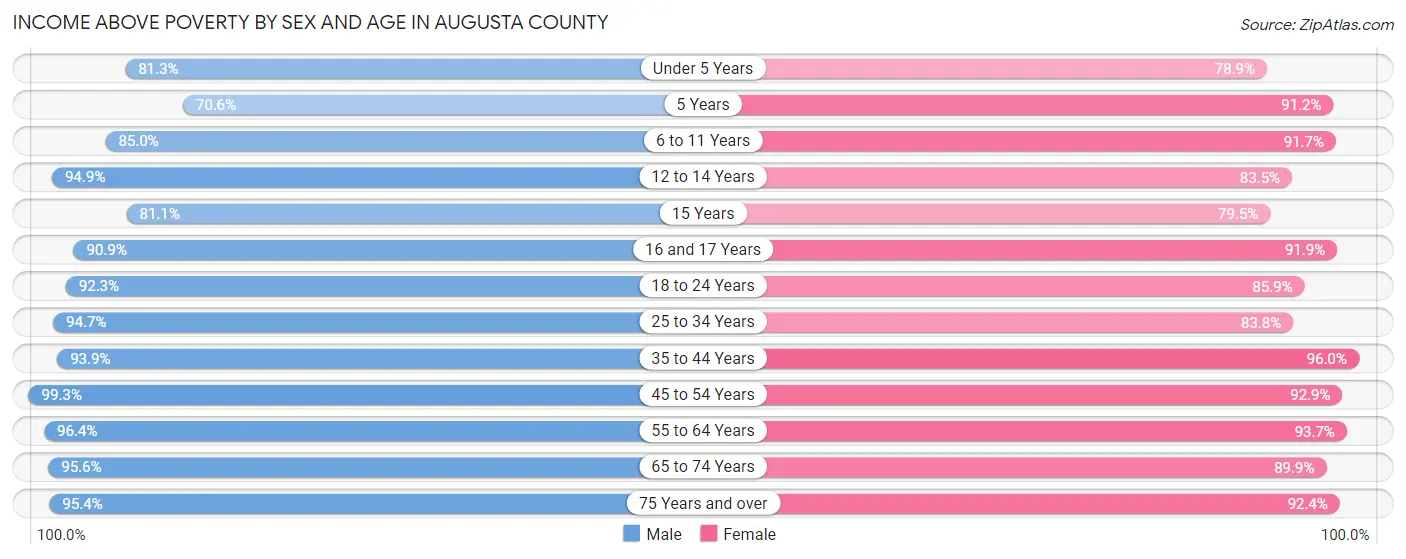
| Age Bracket | Male | Female |
| Under 5 Years | 1,402 (81.3%) | 1,330 (78.9%) |
| 5 Years | 452 (70.6%) | 375 (91.2%) |
| 6 to 11 Years | 1,732 (85.0%) | 2,380 (91.7%) |
| 12 to 14 Years | 1,474 (94.9%) | 893 (83.5%) |
| 15 Years | 317 (81.1%) | 411 (79.5%) |
| 16 and 17 Years | 931 (90.9%) | 694 (91.9%) |
| 18 to 24 Years | 2,674 (92.3%) | 2,149 (85.9%) |
| 25 to 34 Years | 3,831 (94.7%) | 3,463 (83.8%) |
| 35 to 44 Years | 3,906 (93.9%) | 4,163 (96.0%) |
| 45 to 54 Years | 4,604 (99.3%) | 4,461 (92.9%) |
| 55 to 64 Years | 5,340 (96.4%) | 5,440 (93.7%) |
| 65 to 74 Years | 4,355 (95.6%) | 4,474 (89.9%) |
| 75 Years and over | 3,000 (95.4%) | 3,532 (92.4%) |
| Total | 34,018 (93.6%) | 33,765 (90.2%) |
Income Below Poverty Among Married-Couple Families in Augusta County
The poverty statistics for married-couple families in Augusta County show that 2.5% or 406 of the total 16,418 families live below the poverty line. Families with 3 or 4 children have the highest poverty rate of 7.7%, comprising of 87 families. On the other hand, families with 5 or more children have the lowest poverty rate of 0.0%, which includes 0 families.
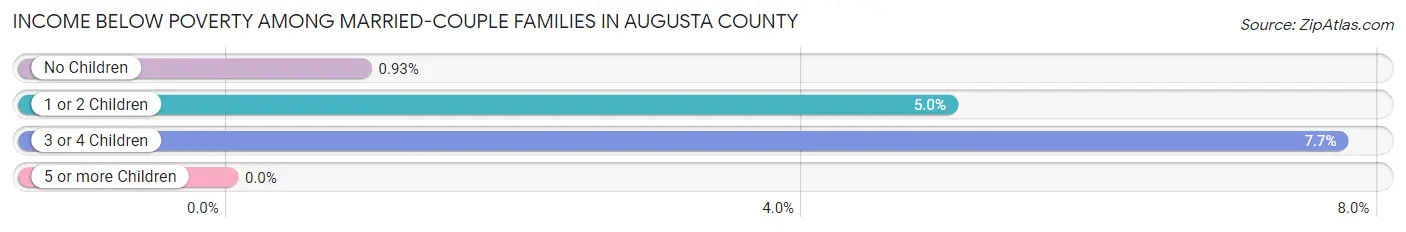
| Children | Above Poverty | Below Poverty |
| No Children | 10,592 (99.1%) | 99 (0.9%) |
| 1 or 2 Children | 4,171 (95.0%) | 220 (5.0%) |
| 3 or 4 Children | 1,039 (92.3%) | 87 (7.7%) |
| 5 or more Children | 210 (100.0%) | 0 (0.0%) |
| Total | 16,012 (97.5%) | 406 (2.5%) |
Income Below Poverty Among Single-Parent Households in Augusta County
According to the poverty data in Augusta County, 5.3% or 69 single-father households and 20.4% or 618 single-mother households are living below the poverty line. Among single-father households, those with 1 or 2 children have the highest poverty rate, with 69 households (11.2%) experiencing poverty. Likewise, among single-mother households, those with 3 or 4 children have the highest poverty rate, with 190 households (81.9%) falling below the poverty line.
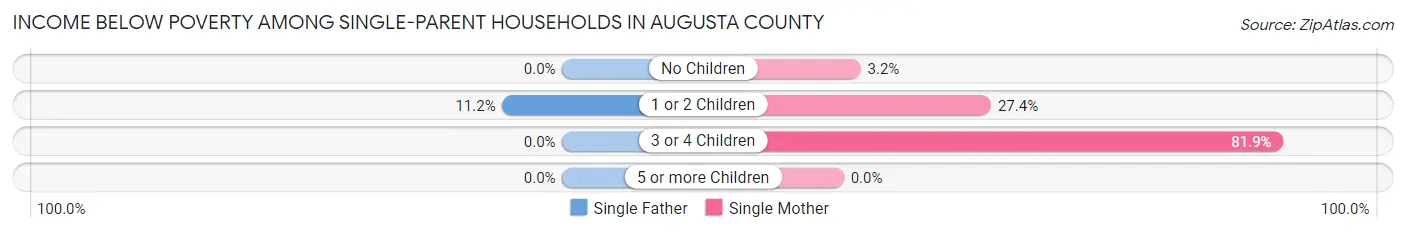
| Children | Single Father | Single Mother |
| No Children | 0 (0.0%) | 43 (3.2%) |
| 1 or 2 Children | 69 (11.2%) | 385 (27.4%) |
| 3 or 4 Children | 0 (0.0%) | 190 (81.9%) |
| 5 or more Children | 0 (0.0%) | 0 (0.0%) |
| Total | 69 (5.3%) | 618 (20.4%) |
Income Below Poverty Among Married-Couple vs Single-Parent Households in Augusta County
The poverty data for Augusta County shows that 406 of the married-couple family households (2.5%) and 687 of the single-parent households (15.9%) are living below the poverty level. Within the married-couple family households, those with 3 or 4 children have the highest poverty rate, with 87 households (7.7%) falling below the poverty line. Among the single-parent households, those with 3 or 4 children have the highest poverty rate, with 190 household (73.6%) living below poverty.
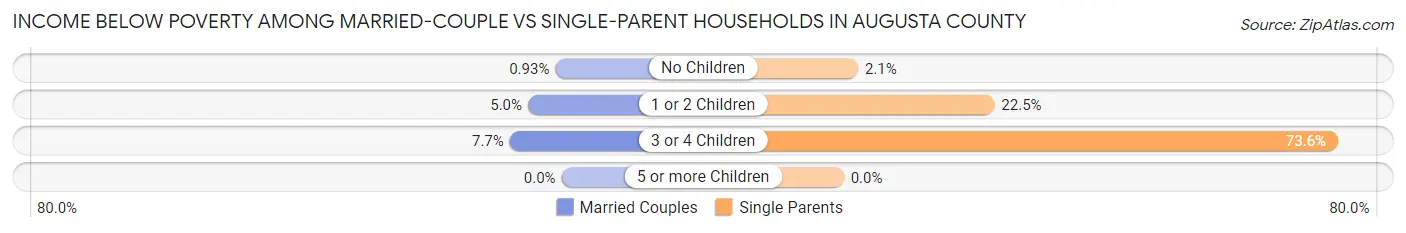
| Children | Married-Couple Families | Single-Parent Households |
| No Children | 99 (0.9%) | 43 (2.1%) |
| 1 or 2 Children | 220 (5.0%) | 454 (22.5%) |
| 3 or 4 Children | 87 (7.7%) | 190 (73.6%) |
| 5 or more Children | 0 (0.0%) | 0 (0.0%) |
| Total | 406 (2.5%) | 687 (15.9%) |
Race in Augusta County
The most populous races in Augusta County are White / Caucasian (70,321 | 90.8%), Black / African American (3,407 | 4.4%), and Hispanic or Latino (2,655 | 3.4%).
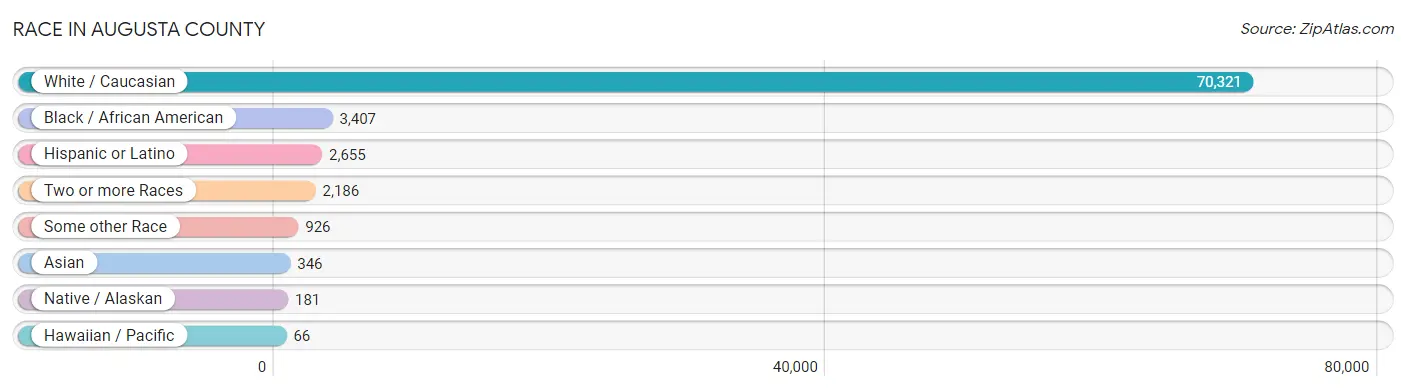
| Race | # Population | % Population |
| Asian | 346 | 0.4% |
| Black / African American | 3,407 | 4.4% |
| Hawaiian / Pacific | 66 | 0.1% |
| Hispanic or Latino | 2,655 | 3.4% |
| Native / Alaskan | 181 | 0.2% |
| White / Caucasian | 70,321 | 90.8% |
| Two or more Races | 2,186 | 2.8% |
| Some other Race | 926 | 1.2% |
| Total | 77,433 | 100.0% |
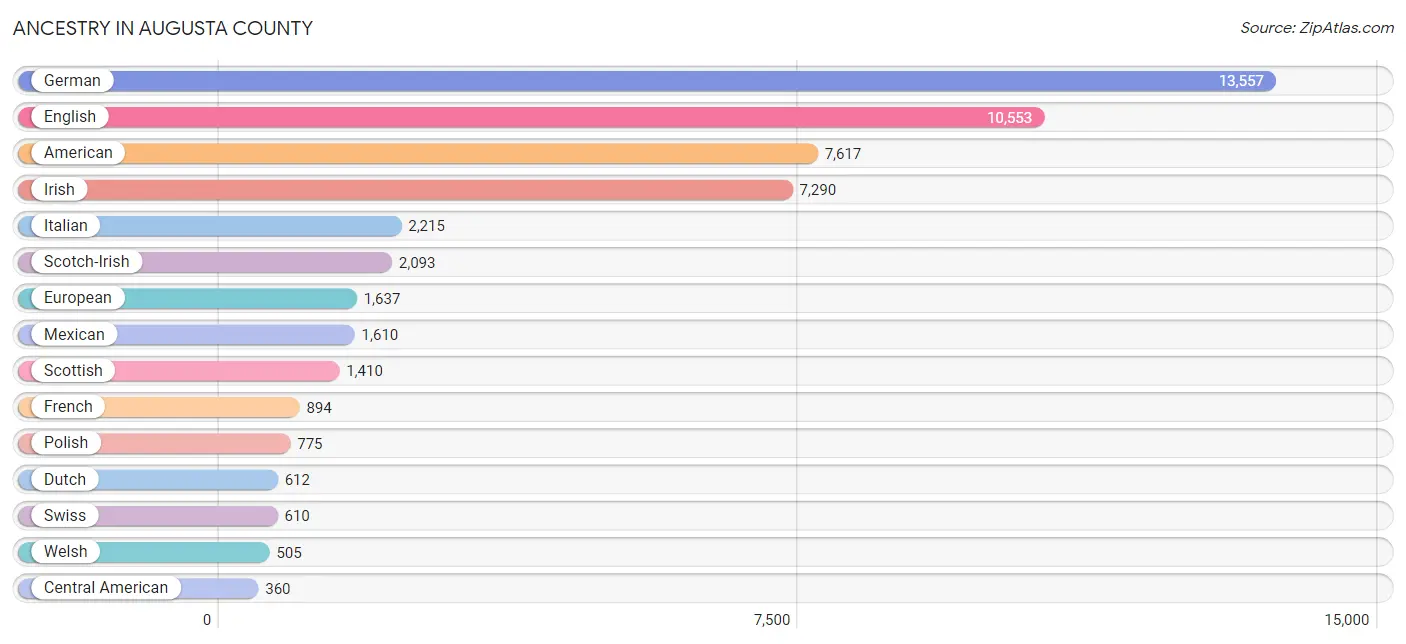
Ancestry in Augusta County
The most populous ancestries reported in Augusta County are German (13,557 | 17.5%), English (10,553 | 13.6%), American (7,617 | 9.8%), Irish (7,290 | 9.4%), and Italian (2,215 | 2.9%), together accounting for 53.2% of all Augusta County residents.
| Ancestry | # Population | % Population |
| African | 251 | 0.3% |
| American | 7,617 | 9.8% |
| Arab | 103 | 0.1% |
| Argentinean | 6 | 0.0% |
| Armenian | 15 | 0.0% |
| Austrian | 70 | 0.1% |
| Bhutanese | 90 | 0.1% |
| Blackfeet | 27 | 0.0% |
| British | 317 | 0.4% |
| Bulgarian | 11 | 0.0% |
| Burmese | 14 | 0.0% |
| Canadian | 65 | 0.1% |
| Celtic | 28 | 0.0% |
| Central American | 360 | 0.5% |
| Central American Indian | 22 | 0.0% |
| Cherokee | 250 | 0.3% |
| Chippewa | 8 | 0.0% |
| Choctaw | 7 | 0.0% |
| Colombian | 48 | 0.1% |
| Croatian | 16 | 0.0% |
| Cuban | 119 | 0.2% |
| Czech | 181 | 0.2% |
| Czechoslovakian | 76 | 0.1% |
| Danish | 81 | 0.1% |
| Dominican | 56 | 0.1% |
| Dutch | 612 | 0.8% |
| Eastern European | 122 | 0.2% |
| English | 10,553 | 13.6% |
| Estonian | 16 | 0.0% |
| European | 1,637 | 2.1% |
| Finnish | 8 | 0.0% |
| French | 894 | 1.1% |
| French Canadian | 227 | 0.3% |
| German | 13,557 | 17.5% |
| Greek | 77 | 0.1% |
| Guamanian / Chamorro | 28 | 0.0% |
| Guatemalan | 39 | 0.1% |
| Haitian | 23 | 0.0% |
| Honduran | 220 | 0.3% |
| Hungarian | 148 | 0.2% |
| Indian (Asian) | 303 | 0.4% |
| Irish | 7,290 | 9.4% |
| Iroquois | 17 | 0.0% |
| Italian | 2,215 | 2.9% |
| Jamaican | 115 | 0.2% |
| Korean | 93 | 0.1% |
| Latvian | 90 | 0.1% |
| Lebanese | 22 | 0.0% |
| Lithuanian | 32 | 0.0% |
| Malaysian | 9 | 0.0% |
| Mexican | 1,610 | 2.1% |
| Moroccan | 11 | 0.0% |
| Native Hawaiian | 41 | 0.1% |
| Nicaraguan | 26 | 0.0% |
| Nigerian | 26 | 0.0% |
| Northern European | 65 | 0.1% |
| Norwegian | 314 | 0.4% |
| Pakistani | 50 | 0.1% |
| Palestinian | 65 | 0.1% |
| Panamanian | 6 | 0.0% |
| Pennsylvania German | 39 | 0.1% |
| Peruvian | 37 | 0.1% |
| Polish | 775 | 1.0% |
| Portuguese | 108 | 0.1% |
| Puerto Rican | 239 | 0.3% |
| Russian | 212 | 0.3% |
| Salvadoran | 69 | 0.1% |
| Scandinavian | 321 | 0.4% |
| Scotch-Irish | 2,093 | 2.7% |
| Scottish | 1,410 | 1.8% |
| Seminole | 4 | 0.0% |
| Serbian | 7 | 0.0% |
| Sioux | 6 | 0.0% |
| Slavic | 25 | 0.0% |
| Slovak | 113 | 0.2% |
| Slovene | 13 | 0.0% |
| South African | 21 | 0.0% |
| South American | 99 | 0.1% |
| South American Indian | 34 | 0.0% |
| Spaniard | 58 | 0.1% |
| Spanish | 68 | 0.1% |
| Sri Lankan | 30 | 0.0% |
| Subsaharan African | 298 | 0.4% |
| Swedish | 324 | 0.4% |
| Swiss | 610 | 0.8% |
| Thai | 133 | 0.2% |
| Turkish | 13 | 0.0% |
| Ukrainian | 241 | 0.3% |
| Venezuelan | 8 | 0.0% |
| Welsh | 505 | 0.6% | View All 90 Rows |
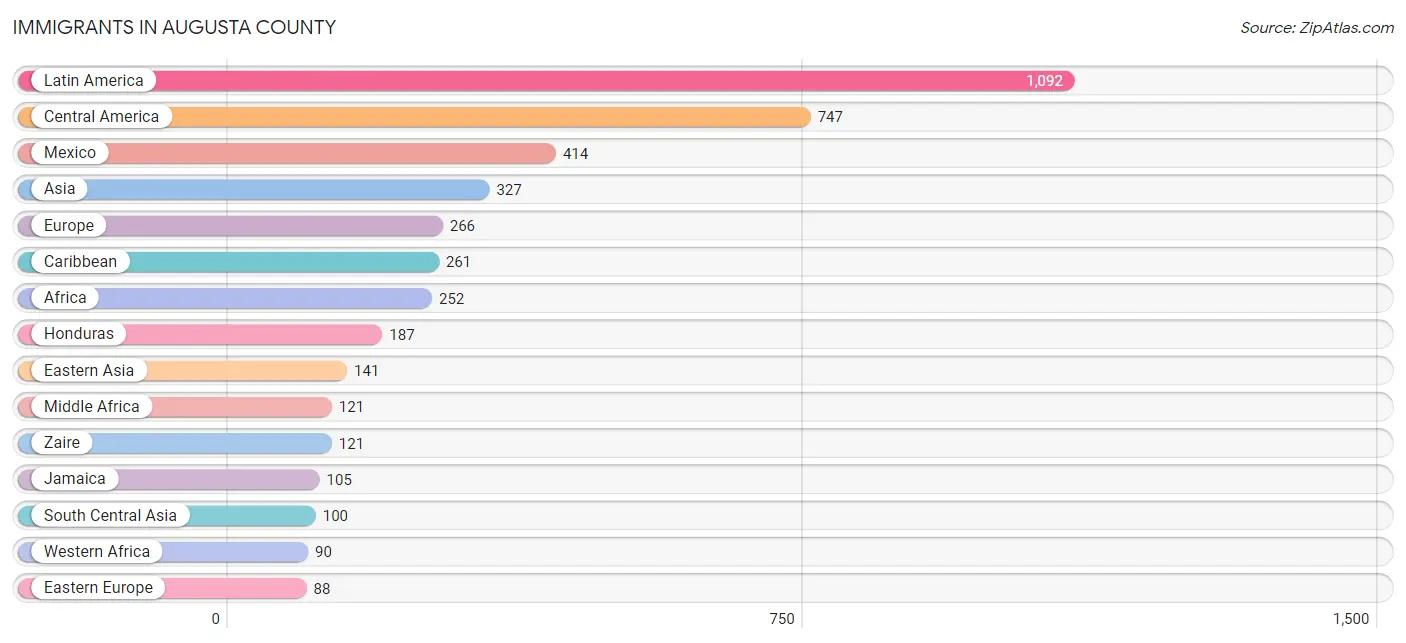
Immigrants in Augusta County
The most numerous immigrant groups reported in Augusta County came from Latin America (1,092 | 1.4%), Central America (747 | 1.0%), Mexico (414 | 0.5%), Asia (327 | 0.4%), and Europe (266 | 0.3%), together accounting for 3.7% of all Augusta County residents.
| Immigration Origin | # Population | % Population |
| Africa | 252 | 0.3% |
| Asia | 327 | 0.4% |
| Austria | 33 | 0.0% |
| Bangladesh | 51 | 0.1% |
| Belize | 30 | 0.0% |
| Canada | 20 | 0.0% |
| Caribbean | 261 | 0.3% |
| Central America | 747 | 1.0% |
| China | 79 | 0.1% |
| Colombia | 39 | 0.1% |
| Cuba | 86 | 0.1% |
| Dominican Republic | 47 | 0.1% |
| Eastern Africa | 13 | 0.0% |
| Eastern Asia | 141 | 0.2% |
| Eastern Europe | 88 | 0.1% |
| El Salvador | 61 | 0.1% |
| England | 31 | 0.0% |
| Ethiopia | 13 | 0.0% |
| Europe | 266 | 0.3% |
| France | 18 | 0.0% |
| Germany | 22 | 0.0% |
| Guatemala | 17 | 0.0% |
| Haiti | 23 | 0.0% |
| Honduras | 187 | 0.2% |
| Hungary | 15 | 0.0% |
| India | 28 | 0.0% |
| Iraq | 10 | 0.0% |
| Ireland | 14 | 0.0% |
| Italy | 30 | 0.0% |
| Jamaica | 105 | 0.1% |
| Japan | 48 | 0.1% |
| Kazakhstan | 21 | 0.0% |
| Korea | 14 | 0.0% |
| Laos | 9 | 0.0% |
| Latin America | 1,092 | 1.4% |
| Latvia | 12 | 0.0% |
| Lebanon | 10 | 0.0% |
| Mexico | 414 | 0.5% |
| Middle Africa | 121 | 0.2% |
| Nicaragua | 38 | 0.1% |
| Northern Europe | 75 | 0.1% |
| Peru | 37 | 0.1% |
| Philippines | 39 | 0.1% |
| Sierra Leone | 2 | 0.0% |
| South Africa | 28 | 0.0% |
| South America | 84 | 0.1% |
| South Central Asia | 100 | 0.1% |
| South Eastern Asia | 66 | 0.1% |
| Southern Europe | 30 | 0.0% |
| Thailand | 18 | 0.0% |
| Ukraine | 61 | 0.1% |
| Venezuela | 8 | 0.0% |
| Western Africa | 90 | 0.1% |
| Western Asia | 20 | 0.0% |
| Western Europe | 73 | 0.1% |
| Zaire | 121 | 0.2% | View All 56 Rows |
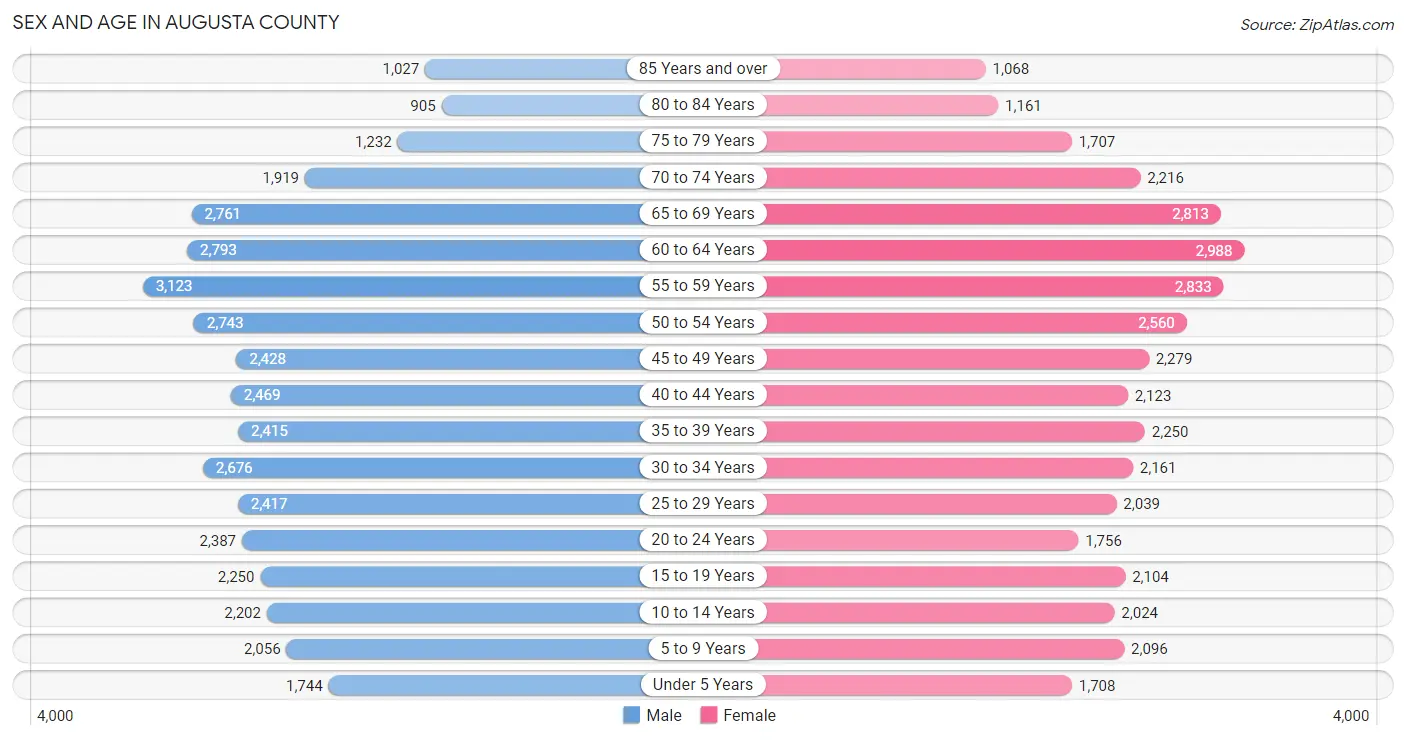
Sex and Age in Augusta County
Sex and Age in Augusta County
The most populous age groups in Augusta County are 55 to 59 Years (3,123 | 7.9%) for men and 60 to 64 Years (2,988 | 7.9%) for women.
| Age Bracket | Male | Female |
| Under 5 Years | 1,744 (4.4%) | 1,708 (4.5%) |
| 5 to 9 Years | 2,056 (5.2%) | 2,096 (5.5%) |
| 10 to 14 Years | 2,202 (5.6%) | 2,024 (5.3%) |
| 15 to 19 Years | 2,250 (5.7%) | 2,104 (5.6%) |
| 20 to 24 Years | 2,387 (6.0%) | 1,756 (4.6%) |
| 25 to 29 Years | 2,417 (6.1%) | 2,039 (5.4%) |
| 30 to 34 Years | 2,676 (6.8%) | 2,161 (5.7%) |
| 35 to 39 Years | 2,415 (6.1%) | 2,250 (5.9%) |
| 40 to 44 Years | 2,469 (6.2%) | 2,123 (5.6%) |
| 45 to 49 Years | 2,428 (6.1%) | 2,279 (6.0%) |
| 50 to 54 Years | 2,743 (6.9%) | 2,560 (6.8%) |
| 55 to 59 Years | 3,123 (7.9%) | 2,833 (7.5%) |
| 60 to 64 Years | 2,793 (7.1%) | 2,988 (7.9%) |
| 65 to 69 Years | 2,761 (7.0%) | 2,813 (7.4%) |
| 70 to 74 Years | 1,919 (4.9%) | 2,216 (5.9%) |
| 75 to 79 Years | 1,232 (3.1%) | 1,707 (4.5%) |
| 80 to 84 Years | 905 (2.3%) | 1,161 (3.1%) |
| 85 Years and over | 1,027 (2.6%) | 1,068 (2.8%) |
| Total | 39,547 (100.0%) | 37,886 (100.0%) |
Families and Households in Augusta County
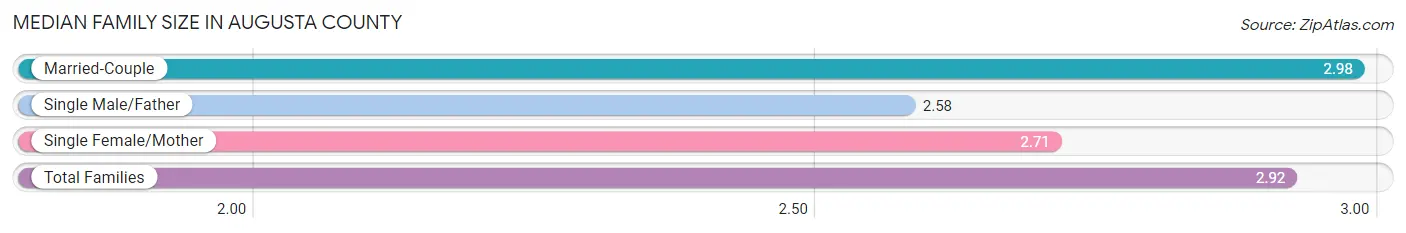
Median Family Size in Augusta County
The median family size in Augusta County is 2.92 persons per family, with married-couple families (16,418 | 79.2%) accounting for the largest median family size of 2.98 persons per family. On the other hand, single male/father families (1,294 | 6.2%) represent the smallest median family size with 2.58 persons per family.
| Family Type | # Families | Family Size |
| Married-Couple | 16,418 (79.2%) | 2.98 |
| Single Male/Father | 1,294 (6.2%) | 2.58 |
| Single Female/Mother | 3,023 (14.6%) | 2.71 |
| Total Families | 20,735 (100.0%) | 2.92 |
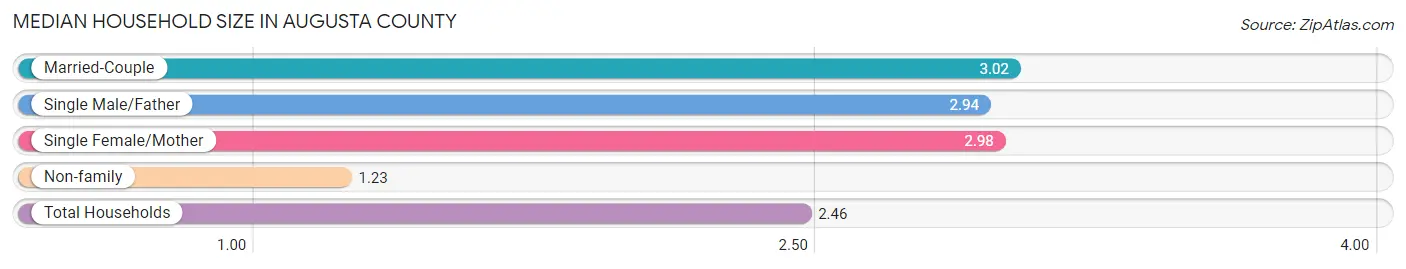
Median Household Size in Augusta County
The median household size in Augusta County is 2.46 persons per household, with married-couple households (16,418 | 54.6%) accounting for the largest median household size of 3.02 persons per household. non-family households (9,321 | 31.0%) represent the smallest median household size with 1.23 persons per household.
| Household Type | # Households | Household Size |
| Married-Couple | 16,418 (54.6%) | 3.02 |
| Single Male/Father | 1,294 (4.3%) | 2.94 |
| Single Female/Mother | 3,023 (10.1%) | 2.98 |
| Non-family | 9,321 (31.0%) | 1.23 |
| Total Households | 30,056 (100.0%) | 2.46 |
Household Size by Marriage Status in Augusta County
Out of a total of 30,056 households in Augusta County, 20,735 (69.0%) are family households, while 9,321 (31.0%) are nonfamily households. The most numerous type of family households are 2-person households, comprising 10,068, and the most common type of nonfamily households are 1-person households, comprising 7,616.
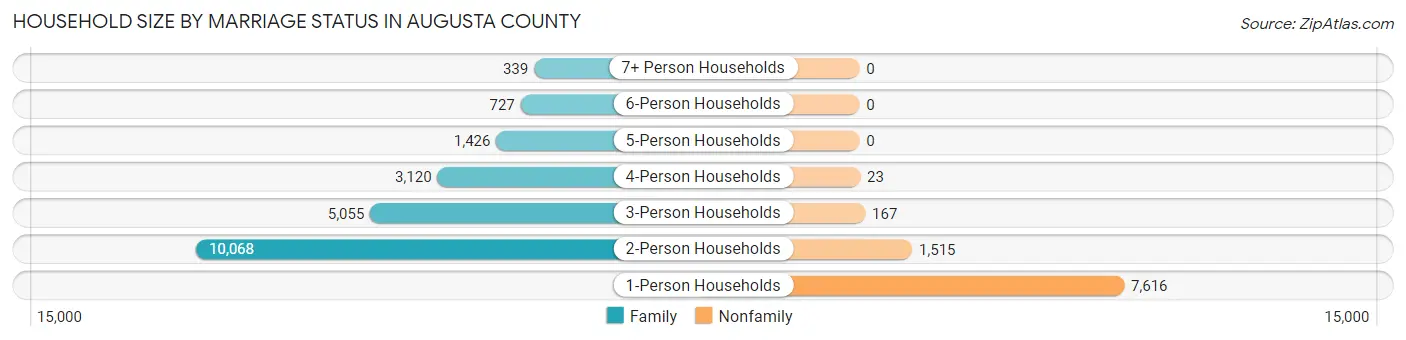
| Household Size | Family Households | Nonfamily Households |
| 1-Person Households | - | 7,616 (25.3%) |
| 2-Person Households | 10,068 (33.5%) | 1,515 (5.0%) |
| 3-Person Households | 5,055 (16.8%) | 167 (0.6%) |
| 4-Person Households | 3,120 (10.4%) | 23 (0.1%) |
| 5-Person Households | 1,426 (4.7%) | 0 (0.0%) |
| 6-Person Households | 727 (2.4%) | 0 (0.0%) |
| 7+ Person Households | 339 (1.1%) | 0 (0.0%) |
| Total | 20,735 (69.0%) | 9,321 (31.0%) |
Female Fertility in Augusta County
Fertility by Age in Augusta County
Average fertility rate in Augusta County is 52.0 births per 1,000 women. Women in the age bracket of 20 to 34 years have the highest fertility rate with 88.0 births per 1,000 women. Women in the age bracket of 20 to 34 years acount for 67.3% of all women with births.
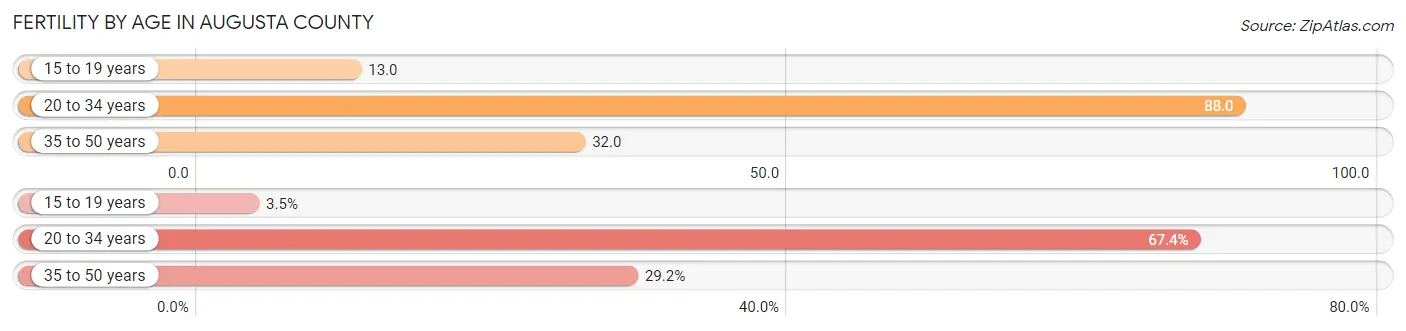
| Age Bracket | Women with Births | Births / 1,000 Women |
| 15 to 19 years | 27 (3.5%) | 13.0 |
| 20 to 34 years | 524 (67.3%) | 88.0 |
| 35 to 50 years | 227 (29.2%) | 32.0 |
| Total | 778 (100.0%) | 52.0 |
Fertility by Age by Marriage Status in Augusta County
63.5% of women with births (778) in Augusta County are married. The highest percentage of unmarried women with births falls into 15 to 19 years age bracket with 100.0% of them unmarried at the time of birth, while the lowest percentage of unmarried women with births belong to 35 to 50 years age bracket with 30.4% of them unmarried.
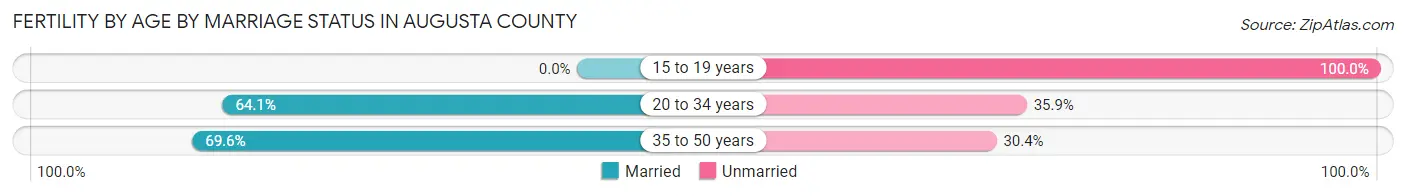
| Age Bracket | Married | Unmarried |
| 15 to 19 years | 0 (0.0%) | 27 (100.0%) |
| 20 to 34 years | 336 (64.1%) | 188 (35.9%) |
| 35 to 50 years | 158 (69.6%) | 69 (30.4%) |
| Total | 494 (63.5%) | 284 (36.5%) |
Fertility by Education in Augusta County
Average fertility rate in Augusta County is 52.0 births per 1,000 women. Women with the education attainment of graduate degree have the highest fertility rate of 98.0 births per 1,000 women, while women with the education attainment of less than high school have the lowest fertility at 36.0 births per 1,000 women. Women with the education attainment of high school diploma represent 33.3% of all women with births.
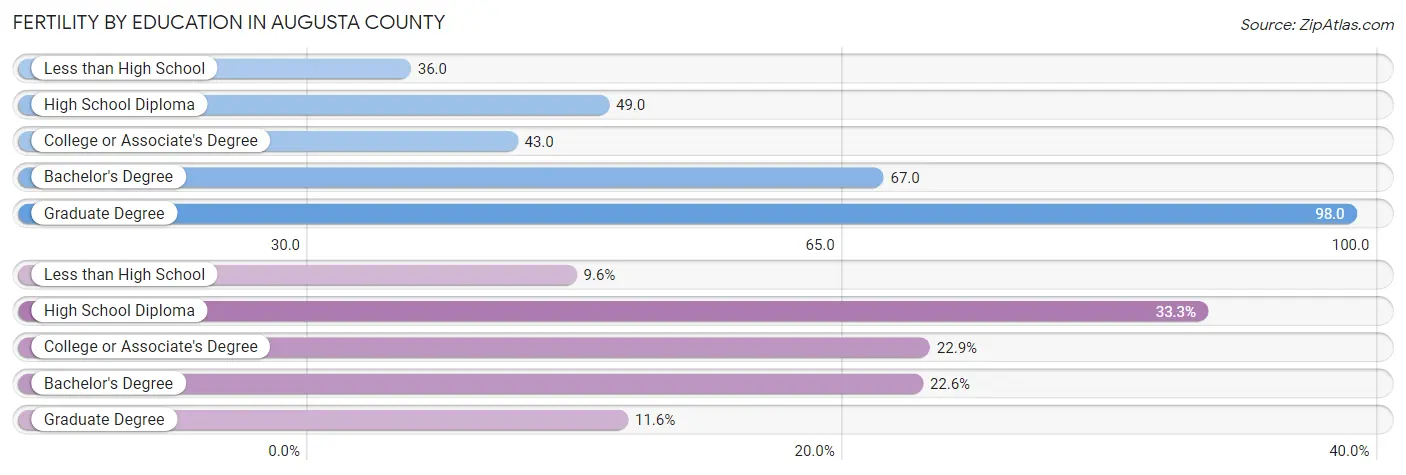
| Educational Attainment | Women with Births | Births / 1,000 Women |
| Less than High School | 75 (9.6%) | 36.0 |
| High School Diploma | 259 (33.3%) | 49.0 |
| College or Associate's Degree | 178 (22.9%) | 43.0 |
| Bachelor's Degree | 176 (22.6%) | 67.0 |
| Graduate Degree | 90 (11.6%) | 98.0 |
| Total | 778 (100.0%) | 52.0 |
Fertility by Education by Marriage Status in Augusta County
36.5% of women with births in Augusta County are unmarried. Women with the educational attainment of bachelor's degree are most likely to be married with 100.0% of them married at childbirth, while women with the educational attainment of less than high school are least likely to be married with 70.7% of them unmarried at childbirth.
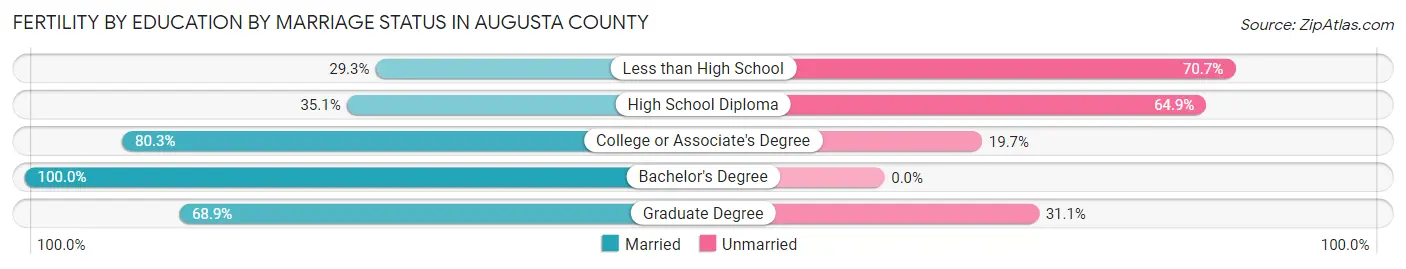
| Educational Attainment | Married | Unmarried |
| Less than High School | 22 (29.3%) | 53 (70.7%) |
| High School Diploma | 91 (35.1%) | 168 (64.9%) |
| College or Associate's Degree | 143 (80.3%) | 35 (19.7%) |
| Bachelor's Degree | 176 (100.0%) | 0 (0.0%) |
| Graduate Degree | 62 (68.9%) | 28 (31.1%) |
| Total | 494 (63.5%) | 284 (36.5%) |
Employment Characteristics in Augusta County
Employment by Class of Employer in Augusta County
Among the 37,136 employed individuals in Augusta County, private company employees (25,106 | 67.6%), local government employees (2,796 | 7.5%), and not-for-profit organizations (2,662 | 7.2%) make up the most common classes of employment.
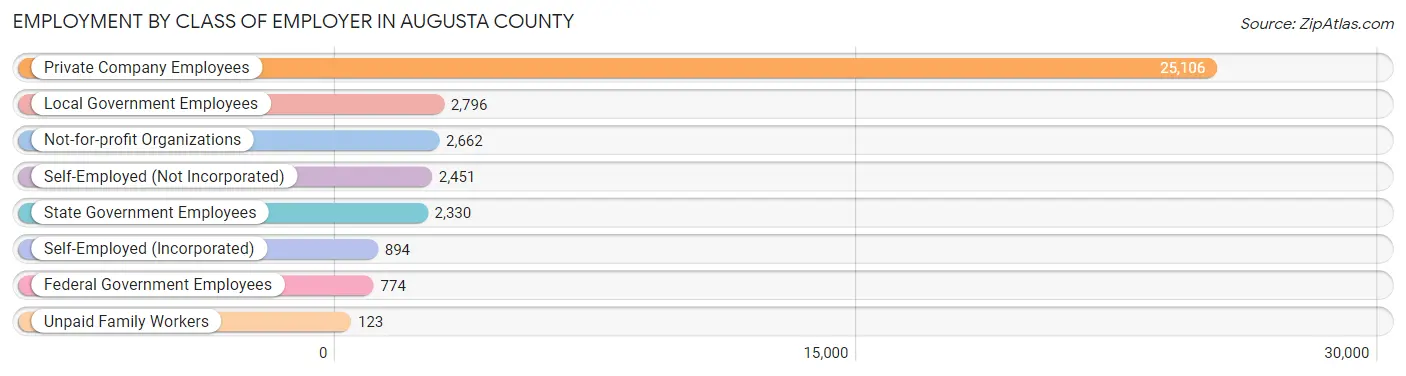
| Employer Class | # Employees | % Employees |
| Private Company Employees | 25,106 | 67.6% |
| Self-Employed (Incorporated) | 894 | 2.4% |
| Self-Employed (Not Incorporated) | 2,451 | 6.6% |
| Not-for-profit Organizations | 2,662 | 7.2% |
| Local Government Employees | 2,796 | 7.5% |
| State Government Employees | 2,330 | 6.3% |
| Federal Government Employees | 774 | 2.1% |
| Unpaid Family Workers | 123 | 0.3% |
| Total | 37,136 | 100.0% |
Employment Status by Age in Augusta County
According to the labor force statistics for Augusta County, out of the total population over 16 years of age (64,695), 60.1% or 38,882 individuals are in the labor force, with 3.0% or 1,166 of them unemployed. The age group with the highest labor force participation rate is 25 to 29 years, with 85.1% or 3,792 individuals in the labor force. Within the labor force, the 16 to 19 years age range has the highest percentage of unemployed individuals, with 13.9% or 224 of them being unemployed.
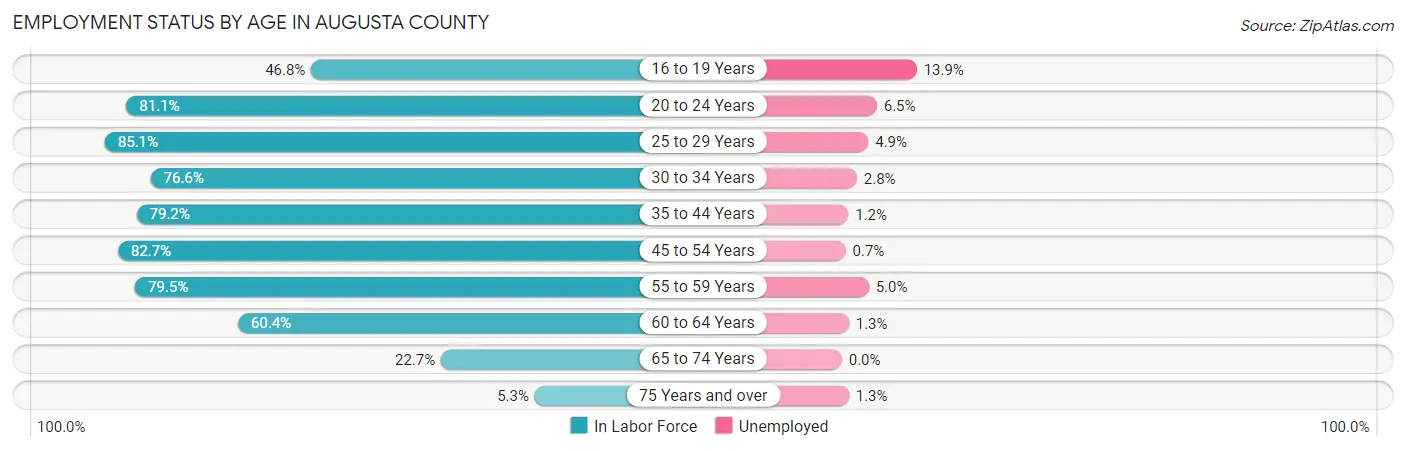
| Age Bracket | In Labor Force | Unemployed |
| 16 to 19 Years | 1,613 (46.8%) | 224 (13.9%) |
| 20 to 24 Years | 3,360 (81.1%) | 218 (6.5%) |
| 25 to 29 Years | 3,792 (85.1%) | 186 (4.9%) |
| 30 to 34 Years | 3,705 (76.6%) | 104 (2.8%) |
| 35 to 44 Years | 7,332 (79.2%) | 88 (1.2%) |
| 45 to 54 Years | 8,278 (82.7%) | 58 (0.7%) |
| 55 to 59 Years | 4,735 (79.5%) | 237 (5.0%) |
| 60 to 64 Years | 3,492 (60.4%) | 45 (1.3%) |
| 65 to 74 Years | 2,204 (22.7%) | 0 (0.0%) |
| 75 Years and over | 376 (5.3%) | 5 (1.3%) |
| Total | 38,882 (60.1%) | 1,166 (3.0%) |
Employment Status by Educational Attainment in Augusta County
According to labor force statistics for Augusta County, 77.7% of individuals (31,311) out of the total population between 25 and 64 years of age (40,297) are in the labor force, with 2.3% or 720 of them being unemployed. The group with the highest labor force participation rate are those with the educational attainment of bachelor's degree or higher, with 89.3% or 8,421 individuals in the labor force. Within the labor force, individuals with high school diploma education have the highest percentage of unemployment, with 3.6% or 453 of them being unemployed.
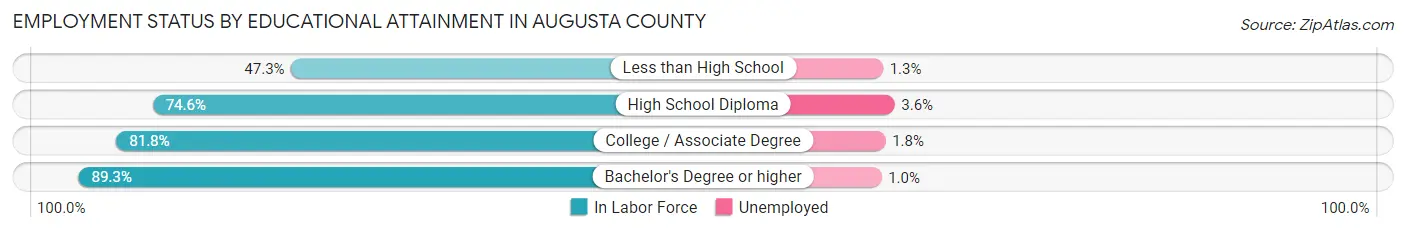
| Educational Attainment | In Labor Force | Unemployed |
| Less than High School | 1,558 (47.3%) | 43 (1.3%) |
| High School Diploma | 12,587 (74.6%) | 607 (3.6%) |
| College / Associate Degree | 8,754 (81.8%) | 193 (1.8%) |
| Bachelor's Degree or higher | 8,421 (89.3%) | 94 (1.0%) |
| Total | 31,311 (77.7%) | 927 (2.3%) |
Employment Occupations by Sex in Augusta County
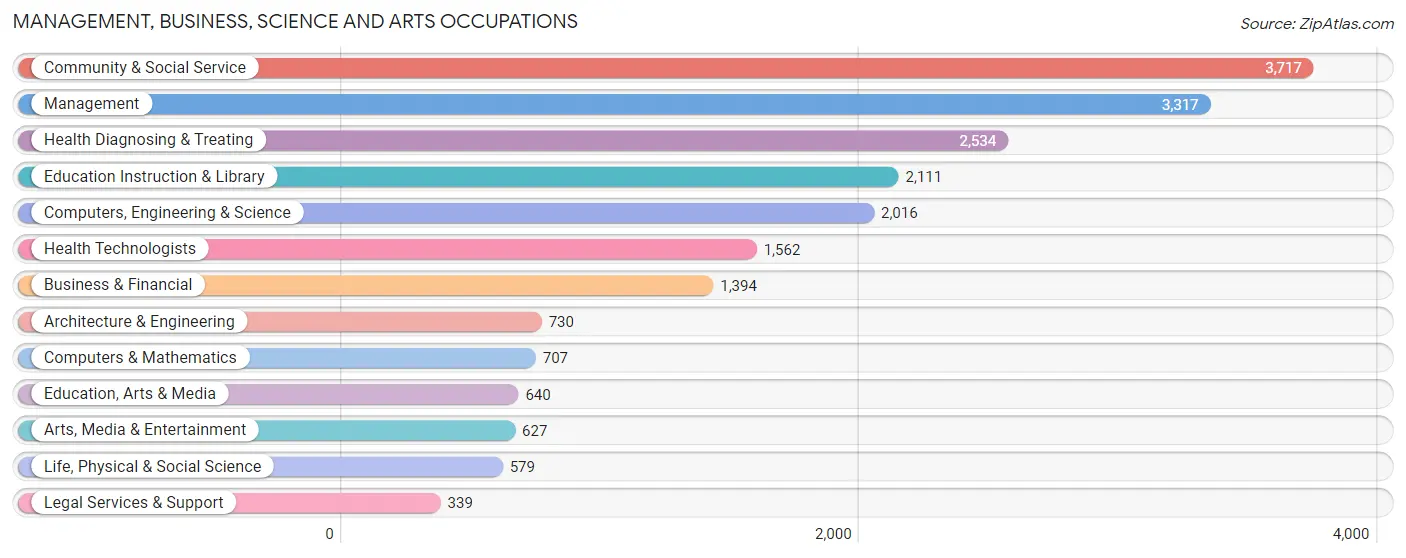
Management, Business, Science and Arts Occupations
The most common Management, Business, Science and Arts occupations in Augusta County are Community & Social Service (3,717 | 9.9%), Management (3,317 | 8.8%), Health Diagnosing & Treating (2,534 | 6.7%), Education Instruction & Library (2,111 | 5.6%), and Computers, Engineering & Science (2,016 | 5.4%).
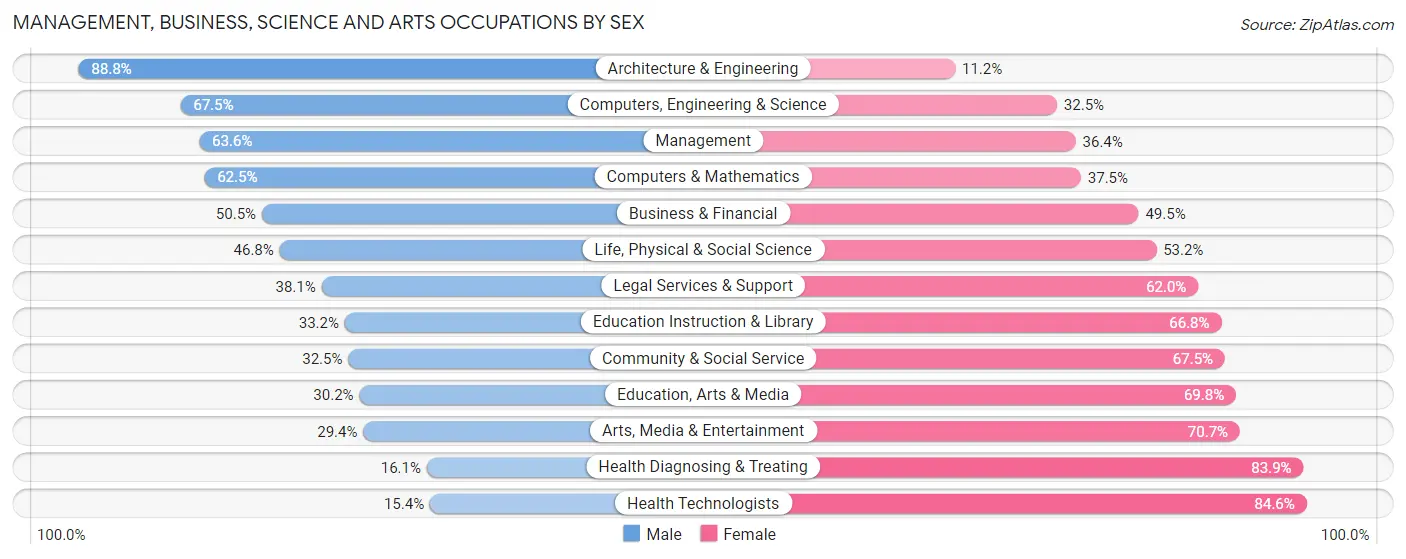
Management, Business, Science and Arts Occupations by Sex
Within the Management, Business, Science and Arts occupations in Augusta County, the most male-oriented occupations are Architecture & Engineering (88.8%), Computers, Engineering & Science (67.5%), and Management (63.6%), while the most female-oriented occupations are Health Technologists (84.6%), Health Diagnosing & Treating (83.9%), and Arts, Media & Entertainment (70.7%).
| Occupation | Male | Female |
| Management | 2,110 (63.6%) | 1,207 (36.4%) |
| Business & Financial | 704 (50.5%) | 690 (49.5%) |
| Computers, Engineering & Science | 1,361 (67.5%) | 655 (32.5%) |
| Computers & Mathematics | 442 (62.5%) | 265 (37.5%) |
| Architecture & Engineering | 648 (88.8%) | 82 (11.2%) |
| Life, Physical & Social Science | 271 (46.8%) | 308 (53.2%) |
| Community & Social Service | 1,207 (32.5%) | 2,510 (67.5%) |
| Education, Arts & Media | 193 (30.2%) | 447 (69.8%) |
| Legal Services & Support | 129 (38.1%) | 210 (62.0%) |
| Education Instruction & Library | 701 (33.2%) | 1,410 (66.8%) |
| Arts, Media & Entertainment | 184 (29.3%) | 443 (70.7%) |
| Health Diagnosing & Treating | 408 (16.1%) | 2,126 (83.9%) |
| Health Technologists | 241 (15.4%) | 1,321 (84.6%) |
| Total (Category) | 5,790 (44.6%) | 7,188 (55.4%) |
| Total (Overall) | 19,671 (52.3%) | 17,902 (47.6%) |
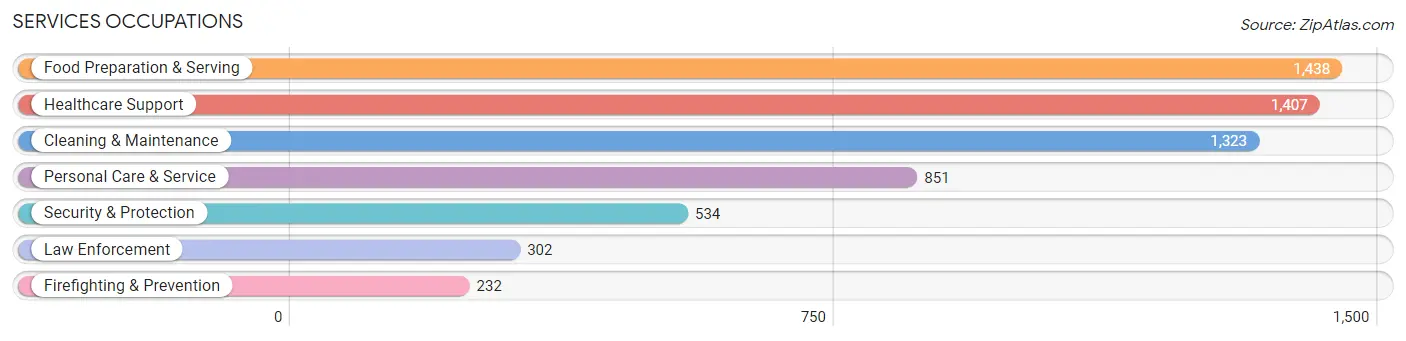
Services Occupations
The most common Services occupations in Augusta County are Food Preparation & Serving (1,438 | 3.8%), Healthcare Support (1,407 | 3.7%), Cleaning & Maintenance (1,323 | 3.5%), Personal Care & Service (851 | 2.3%), and Security & Protection (534 | 1.4%).
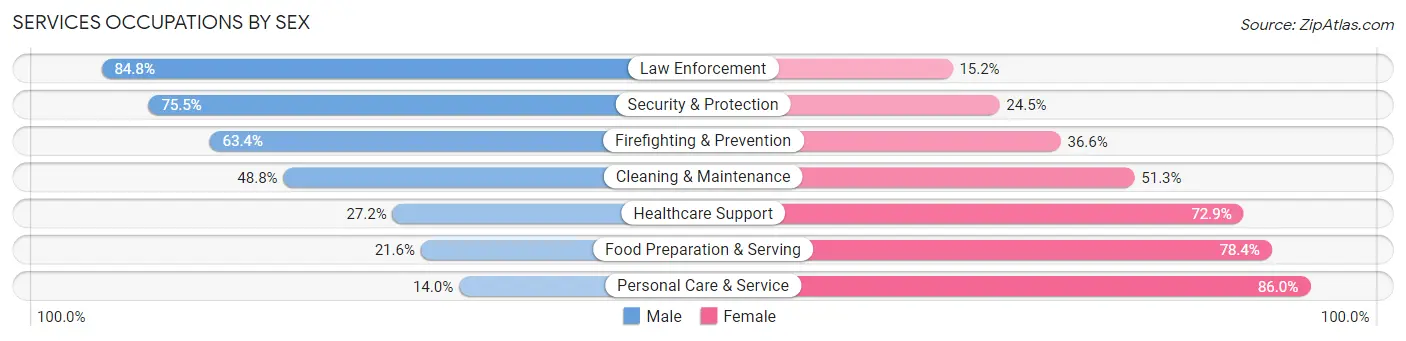
Services Occupations by Sex
Within the Services occupations in Augusta County, the most male-oriented occupations are Law Enforcement (84.8%), Security & Protection (75.5%), and Firefighting & Prevention (63.4%), while the most female-oriented occupations are Personal Care & Service (86.0%), Food Preparation & Serving (78.4%), and Healthcare Support (72.9%).
| Occupation | Male | Female |
| Healthcare Support | 382 (27.2%) | 1,025 (72.9%) |
| Security & Protection | 403 (75.5%) | 131 (24.5%) |
| Firefighting & Prevention | 147 (63.4%) | 85 (36.6%) |
| Law Enforcement | 256 (84.8%) | 46 (15.2%) |
| Food Preparation & Serving | 310 (21.6%) | 1,128 (78.4%) |
| Cleaning & Maintenance | 645 (48.7%) | 678 (51.2%) |
| Personal Care & Service | 119 (14.0%) | 732 (86.0%) |
| Total (Category) | 1,859 (33.5%) | 3,694 (66.5%) |
| Total (Overall) | 19,671 (52.3%) | 17,902 (47.6%) |
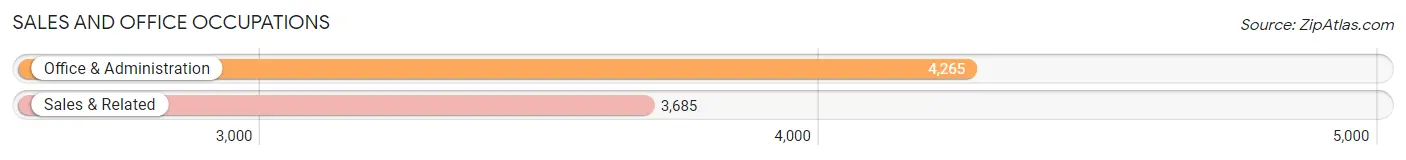
Sales and Office Occupations
The most common Sales and Office occupations in Augusta County are Office & Administration (4,265 | 11.4%), and Sales & Related (3,685 | 9.8%).
Sales and Office Occupations by Sex

| Occupation | Male | Female |
| Sales & Related | 1,777 (48.2%) | 1,908 (51.8%) |
| Office & Administration | 844 (19.8%) | 3,421 (80.2%) |
| Total (Category) | 2,621 (33.0%) | 5,329 (67.0%) |
| Total (Overall) | 19,671 (52.3%) | 17,902 (47.6%) |
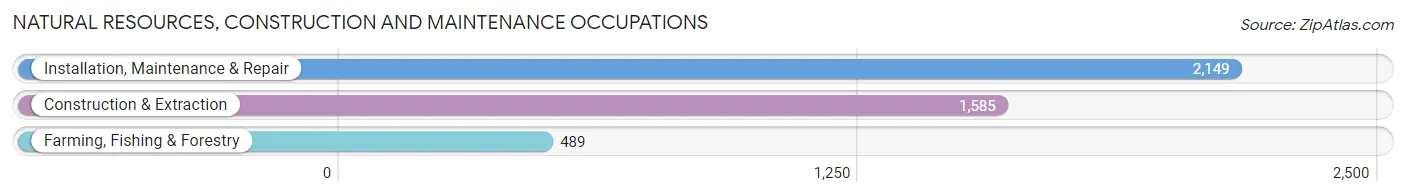
Natural Resources, Construction and Maintenance Occupations
The most common Natural Resources, Construction and Maintenance occupations in Augusta County are Installation, Maintenance & Repair (2,149 | 5.7%), Construction & Extraction (1,585 | 4.2%), and Farming, Fishing & Forestry (489 | 1.3%).
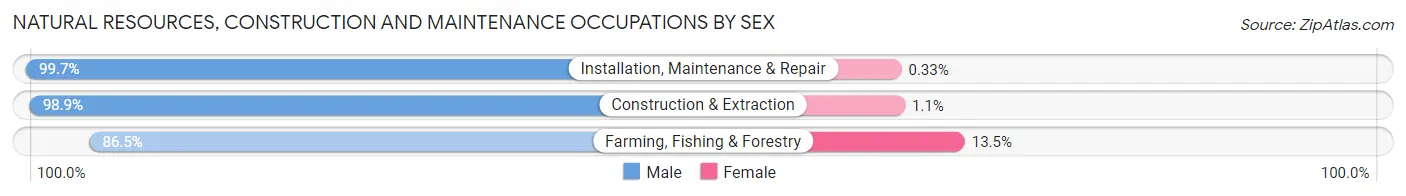
Natural Resources, Construction and Maintenance Occupations by Sex
| Occupation | Male | Female |
| Farming, Fishing & Forestry | 423 (86.5%) | 66 (13.5%) |
| Construction & Extraction | 1,568 (98.9%) | 17 (1.1%) |
| Installation, Maintenance & Repair | 2,142 (99.7%) | 7 (0.3%) |
| Total (Category) | 4,133 (97.9%) | 90 (2.1%) |
| Total (Overall) | 19,671 (52.3%) | 17,902 (47.6%) |
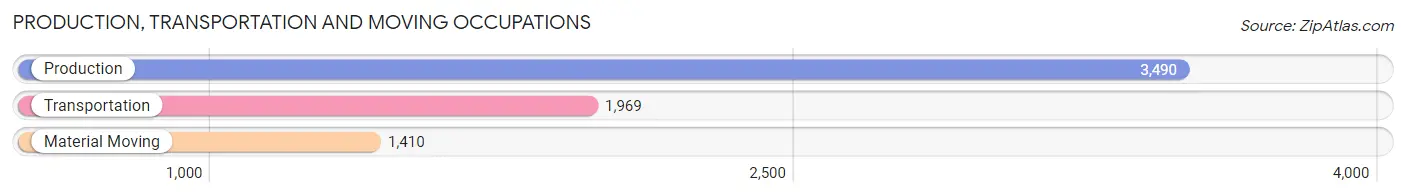
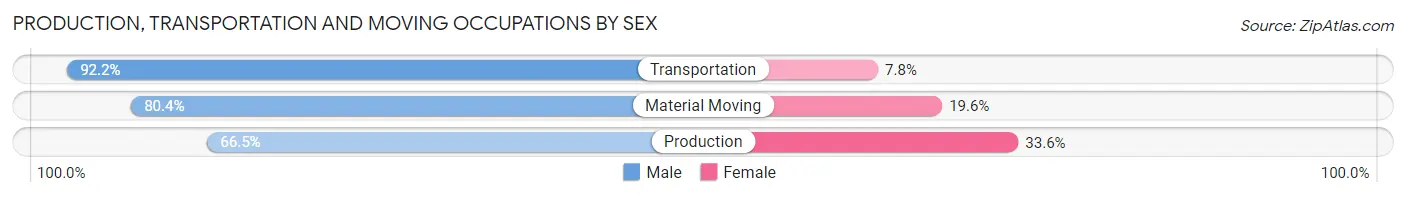
Production, Transportation and Moving Occupations
The most common Production, Transportation and Moving occupations in Augusta County are Production (3,490 | 9.3%), Transportation (1,969 | 5.2%), and Material Moving (1,410 | 3.7%).
Production, Transportation and Moving Occupations by Sex
| Occupation | Male | Female |
| Production | 2,319 (66.4%) | 1,171 (33.6%) |
| Transportation | 1,815 (92.2%) | 154 (7.8%) |
| Material Moving | 1,134 (80.4%) | 276 (19.6%) |
| Total (Category) | 5,268 (76.7%) | 1,601 (23.3%) |
| Total (Overall) | 19,671 (52.3%) | 17,902 (47.6%) |
Employment Industries by Sex in Augusta County
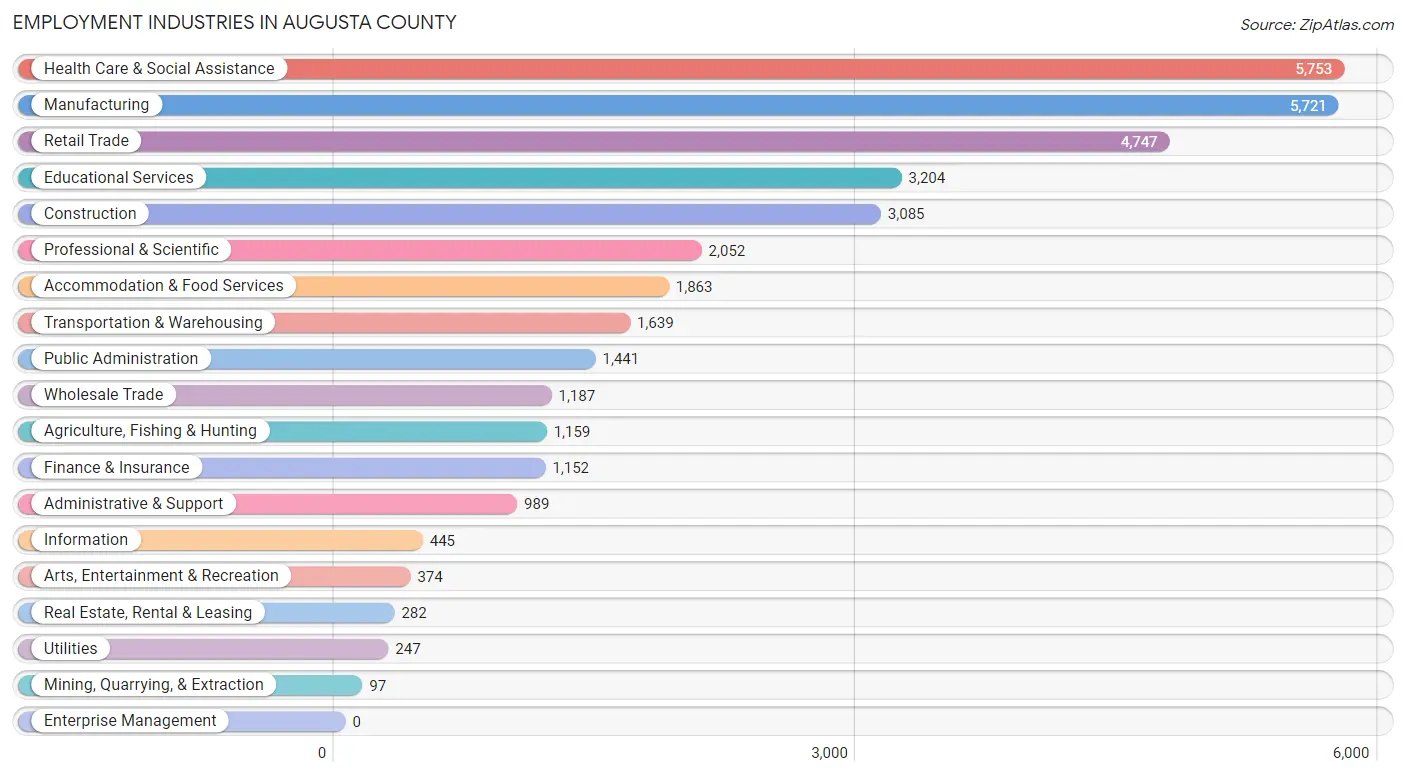
Employment Industries in Augusta County
The major employment industries in Augusta County include Health Care & Social Assistance (5,753 | 15.3%), Manufacturing (5,721 | 15.2%), Retail Trade (4,747 | 12.6%), Educational Services (3,204 | 8.5%), and Construction (3,085 | 8.2%).
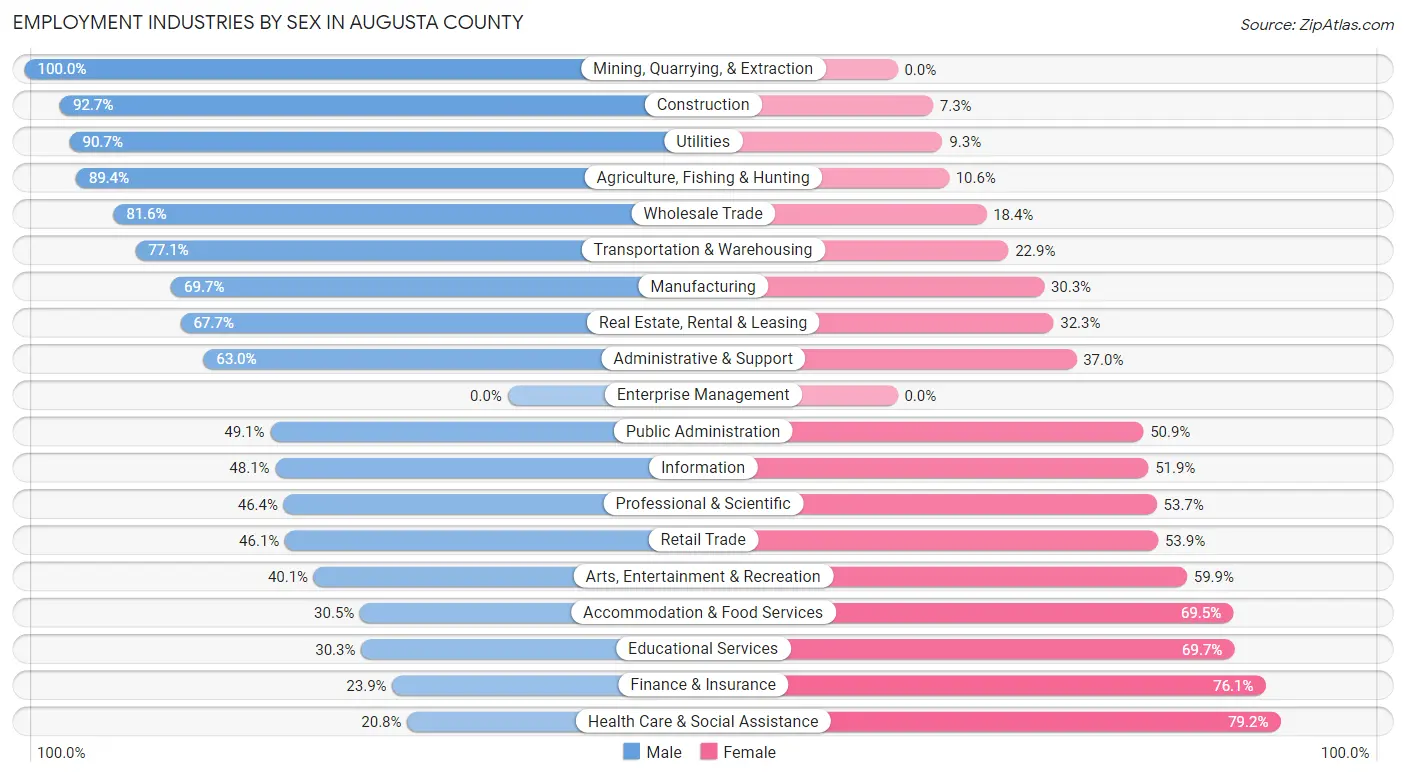
Employment Industries by Sex in Augusta County
The Augusta County industries that see more men than women are Mining, Quarrying, & Extraction (100.0%), Construction (92.7%), and Utilities (90.7%), whereas the industries that tend to have a higher number of women are Health Care & Social Assistance (79.2%), Finance & Insurance (76.1%), and Educational Services (69.7%).
| Industry | Male | Female |
| Agriculture, Fishing & Hunting | 1,036 (89.4%) | 123 (10.6%) |
| Mining, Quarrying, & Extraction | 97 (100.0%) | 0 (0.0%) |
| Construction | 2,859 (92.7%) | 226 (7.3%) |
| Manufacturing | 3,986 (69.7%) | 1,735 (30.3%) |
| Wholesale Trade | 969 (81.6%) | 218 (18.4%) |
| Retail Trade | 2,187 (46.1%) | 2,560 (53.9%) |
| Transportation & Warehousing | 1,263 (77.1%) | 376 (22.9%) |
| Utilities | 224 (90.7%) | 23 (9.3%) |
| Information | 214 (48.1%) | 231 (51.9%) |
| Finance & Insurance | 275 (23.9%) | 877 (76.1%) |
| Real Estate, Rental & Leasing | 191 (67.7%) | 91 (32.3%) |
| Professional & Scientific | 951 (46.4%) | 1,101 (53.6%) |
| Enterprise Management | 0 (0.0%) | 0 (0.0%) |
| Administrative & Support | 623 (63.0%) | 366 (37.0%) |
| Educational Services | 971 (30.3%) | 2,233 (69.7%) |
| Health Care & Social Assistance | 1,195 (20.8%) | 4,558 (79.2%) |
| Arts, Entertainment & Recreation | 150 (40.1%) | 224 (59.9%) |
| Accommodation & Food Services | 569 (30.5%) | 1,294 (69.5%) |
| Public Administration | 708 (49.1%) | 733 (50.9%) |
| Total | 19,671 (52.3%) | 17,902 (47.6%) |
Education in Augusta County
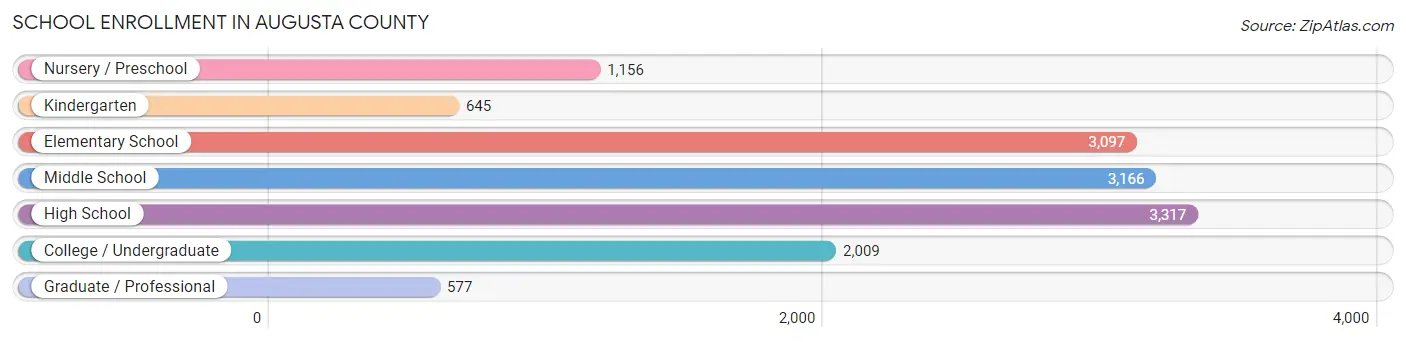
School Enrollment in Augusta County
The most common levels of schooling among the 13,967 students in Augusta County are high school (3,317 | 23.7%), middle school (3,166 | 22.7%), and elementary school (3,097 | 22.2%).
| School Level | # Students | % Students |
| Nursery / Preschool | 1,156 | 8.3% |
| Kindergarten | 645 | 4.6% |
| Elementary School | 3,097 | 22.2% |
| Middle School | 3,166 | 22.7% |
| High School | 3,317 | 23.7% |
| College / Undergraduate | 2,009 | 14.4% |
| Graduate / Professional | 577 | 4.1% |
| Total | 13,967 | 100.0% |
School Enrollment by Age by Funding Source in Augusta County
Out of a total of 13,967 students who are enrolled in schools in Augusta County, 3,576 (25.6%) attend a private institution, while the remaining 10,391 (74.4%) are enrolled in public schools. The age group of 3 to 4 year olds has the highest likelihood of being enrolled in private schools, with 419 (63.0% in the age bracket) enrolled. Conversely, the age group of 18 to 19 year olds has the lowest likelihood of being enrolled in a private school, with 610 (83.2% in the age bracket) attending a public institution.
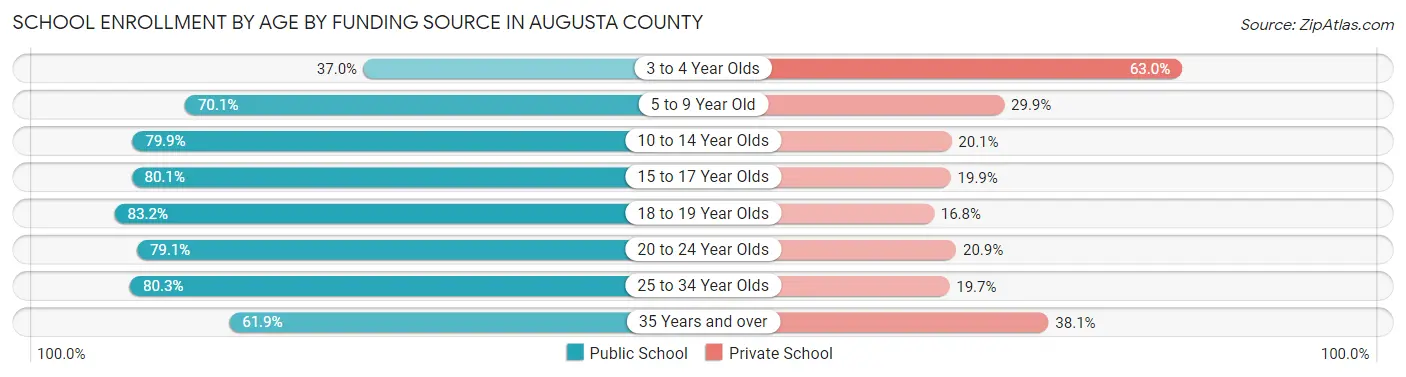
| Age Bracket | Public School | Private School |
| 3 to 4 Year Olds | 246 (37.0%) | 419 (63.0%) |
| 5 to 9 Year Old | 2,800 (70.1%) | 1,193 (29.9%) |
| 10 to 14 Year Olds | 3,069 (79.9%) | 770 (20.1%) |
| 15 to 17 Year Olds | 2,135 (80.1%) | 531 (19.9%) |
| 18 to 19 Year Olds | 610 (83.2%) | 123 (16.8%) |
| 20 to 24 Year Olds | 612 (79.1%) | 162 (20.9%) |
| 25 to 34 Year Olds | 490 (80.3%) | 120 (19.7%) |
| 35 Years and over | 425 (61.9%) | 262 (38.1%) |
| Total | 10,391 (74.4%) | 3,576 (25.6%) |
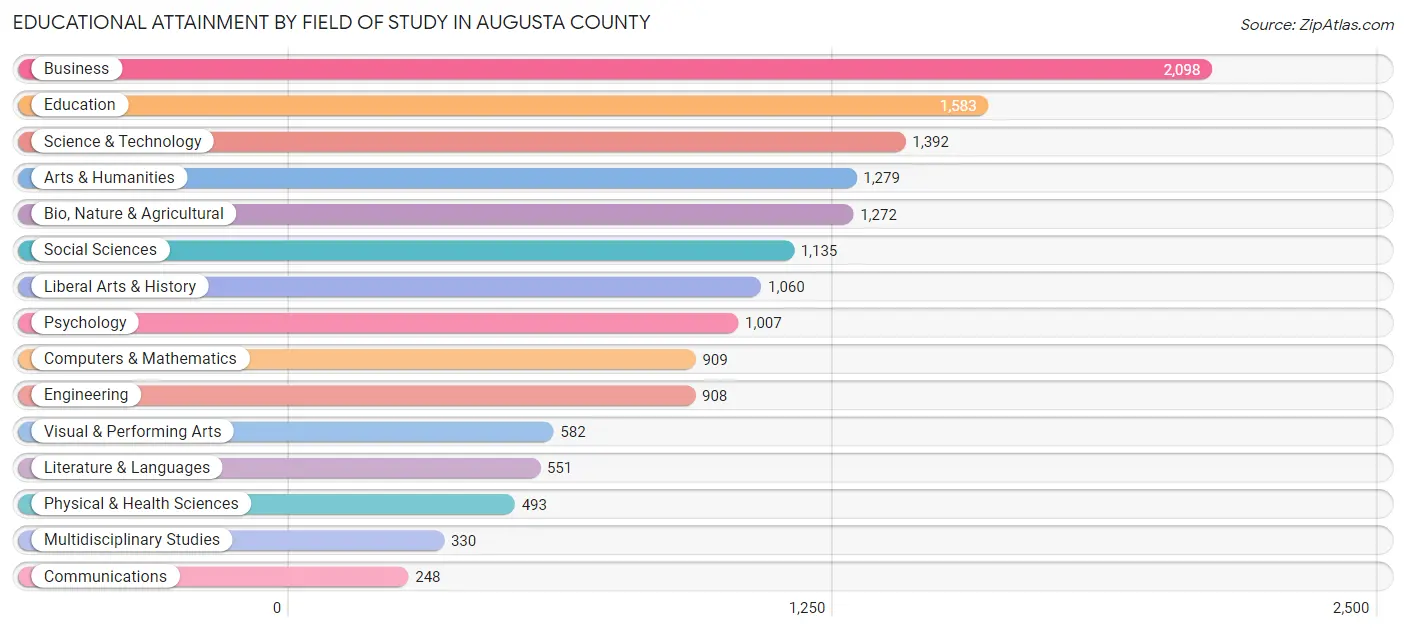
Educational Attainment by Field of Study in Augusta County
Business (2,098 | 14.1%), education (1,583 | 10.7%), science & technology (1,392 | 9.4%), arts & humanities (1,279 | 8.6%), and bio, nature & agricultural (1,272 | 8.6%) are the most common fields of study among 14,847 individuals in Augusta County who have obtained a bachelor's degree or higher.
| Field of Study | # Graduates | % Graduates |
| Computers & Mathematics | 909 | 6.1% |
| Bio, Nature & Agricultural | 1,272 | 8.6% |
| Physical & Health Sciences | 493 | 3.3% |
| Psychology | 1,007 | 6.8% |
| Social Sciences | 1,135 | 7.6% |
| Engineering | 908 | 6.1% |
| Multidisciplinary Studies | 330 | 2.2% |
| Science & Technology | 1,392 | 9.4% |
| Business | 2,098 | 14.1% |
| Education | 1,583 | 10.7% |
| Literature & Languages | 551 | 3.7% |
| Liberal Arts & History | 1,060 | 7.1% |
| Visual & Performing Arts | 582 | 3.9% |
| Communications | 248 | 1.7% |
| Arts & Humanities | 1,279 | 8.6% |
| Total | 14,847 | 100.0% |
Transportation & Commute in Augusta County
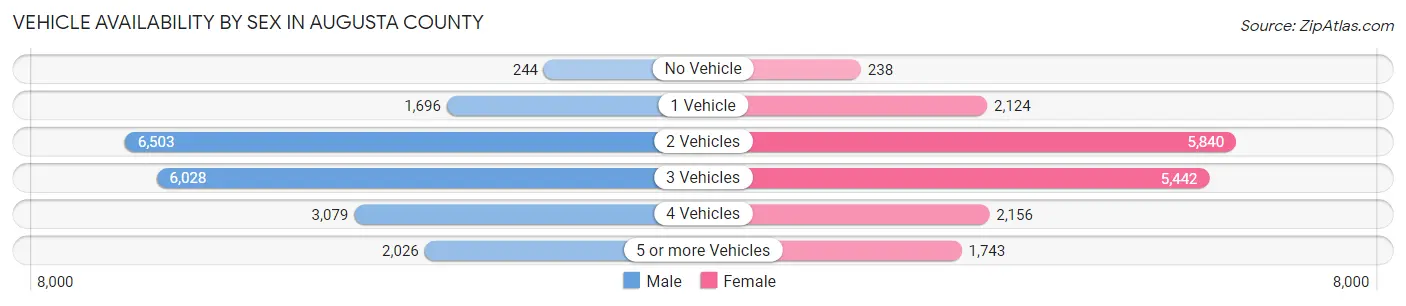
Vehicle Availability by Sex in Augusta County
The most prevalent vehicle ownership categories in Augusta County are males with 2 vehicles (6,503, accounting for 33.2%) and females with 2 vehicles (5,840, making up 37.1%).
| Vehicles Available | Male | Female |
| No Vehicle | 244 (1.3%) | 238 (1.4%) |
| 1 Vehicle | 1,696 (8.7%) | 2,124 (12.1%) |
| 2 Vehicles | 6,503 (33.2%) | 5,840 (33.3%) |
| 3 Vehicles | 6,028 (30.8%) | 5,442 (31.0%) |
| 4 Vehicles | 3,079 (15.7%) | 2,156 (12.3%) |
| 5 or more Vehicles | 2,026 (10.3%) | 1,743 (9.9%) |
| Total | 19,576 (100.0%) | 17,543 (100.0%) |
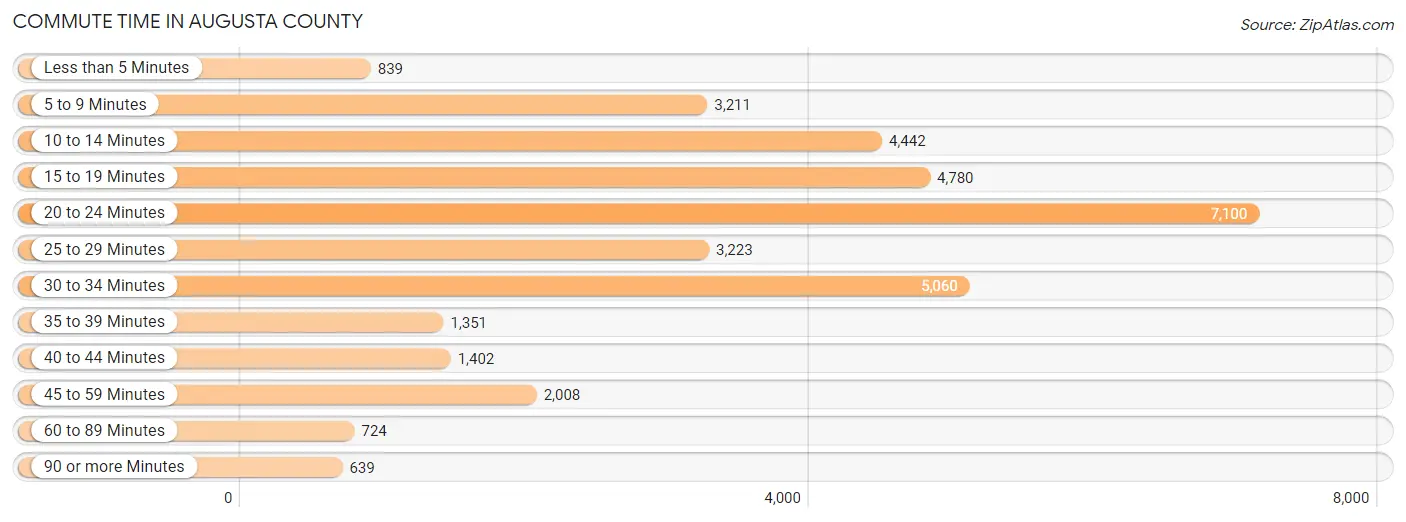
Commute Time in Augusta County
The most frequently occuring commute durations in Augusta County are 20 to 24 minutes (7,100 commuters, 20.4%), 30 to 34 minutes (5,060 commuters, 14.5%), and 15 to 19 minutes (4,780 commuters, 13.7%).
| Commute Time | # Commuters | % Commuters |
| Less than 5 Minutes | 839 | 2.4% |
| 5 to 9 Minutes | 3,211 | 9.2% |
| 10 to 14 Minutes | 4,442 | 12.8% |
| 15 to 19 Minutes | 4,780 | 13.7% |
| 20 to 24 Minutes | 7,100 | 20.4% |
| 25 to 29 Minutes | 3,223 | 9.3% |
| 30 to 34 Minutes | 5,060 | 14.5% |
| 35 to 39 Minutes | 1,351 | 3.9% |
| 40 to 44 Minutes | 1,402 | 4.0% |
| 45 to 59 Minutes | 2,008 | 5.8% |
| 60 to 89 Minutes | 724 | 2.1% |
| 90 or more Minutes | 639 | 1.8% |
Commute Time by Sex in Augusta County
The most common commute times in Augusta County are 20 to 24 minutes (3,503 commuters, 18.9%) for males and 20 to 24 minutes (3,597 commuters, 22.2%) for females.
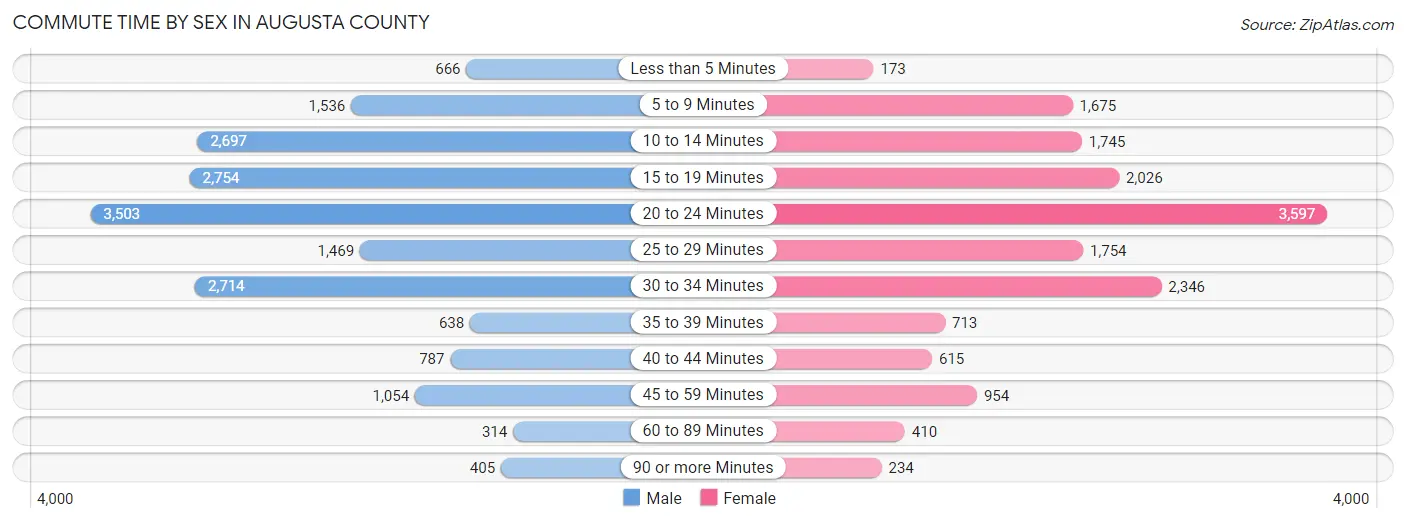
| Commute Time | Male | Female |
| Less than 5 Minutes | 666 (3.6%) | 173 (1.1%) |
| 5 to 9 Minutes | 1,536 (8.3%) | 1,675 (10.3%) |
| 10 to 14 Minutes | 2,697 (14.5%) | 1,745 (10.7%) |
| 15 to 19 Minutes | 2,754 (14.9%) | 2,026 (12.5%) |
| 20 to 24 Minutes | 3,503 (18.9%) | 3,597 (22.2%) |
| 25 to 29 Minutes | 1,469 (7.9%) | 1,754 (10.8%) |
| 30 to 34 Minutes | 2,714 (14.6%) | 2,346 (14.4%) |
| 35 to 39 Minutes | 638 (3.4%) | 713 (4.4%) |
| 40 to 44 Minutes | 787 (4.3%) | 615 (3.8%) |
| 45 to 59 Minutes | 1,054 (5.7%) | 954 (5.9%) |
| 60 to 89 Minutes | 314 (1.7%) | 410 (2.5%) |
| 90 or more Minutes | 405 (2.2%) | 234 (1.4%) |
Time of Departure to Work by Sex in Augusta County
The most frequent times of departure to work in Augusta County are 7:00 AM to 7:29 AM (3,267, 17.6%) for males and 7:00 AM to 7:29 AM (3,307, 20.4%) for females.
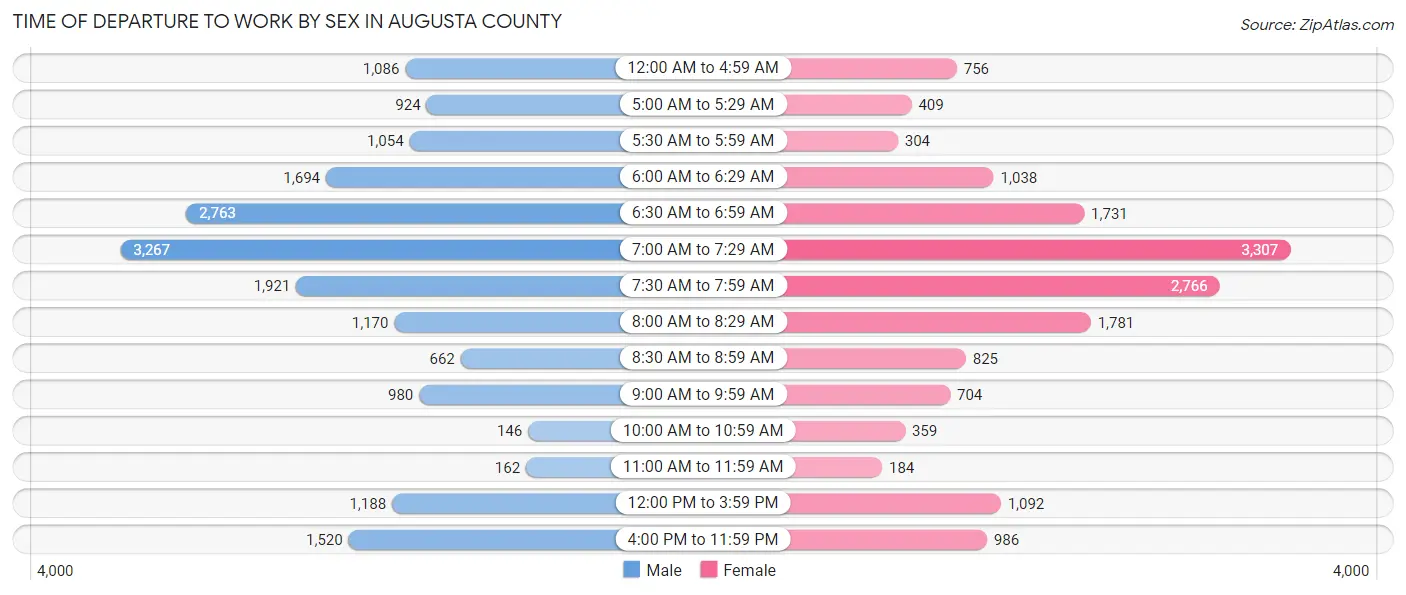
| Time of Departure | Male | Female |
| 12:00 AM to 4:59 AM | 1,086 (5.9%) | 756 (4.6%) |
| 5:00 AM to 5:29 AM | 924 (5.0%) | 409 (2.5%) |
| 5:30 AM to 5:59 AM | 1,054 (5.7%) | 304 (1.9%) |
| 6:00 AM to 6:29 AM | 1,694 (9.1%) | 1,038 (6.4%) |
| 6:30 AM to 6:59 AM | 2,763 (14.9%) | 1,731 (10.7%) |
| 7:00 AM to 7:29 AM | 3,267 (17.6%) | 3,307 (20.4%) |
| 7:30 AM to 7:59 AM | 1,921 (10.4%) | 2,766 (17.0%) |
| 8:00 AM to 8:29 AM | 1,170 (6.3%) | 1,781 (11.0%) |
| 8:30 AM to 8:59 AM | 662 (3.6%) | 825 (5.1%) |
| 9:00 AM to 9:59 AM | 980 (5.3%) | 704 (4.3%) |
| 10:00 AM to 10:59 AM | 146 (0.8%) | 359 (2.2%) |
| 11:00 AM to 11:59 AM | 162 (0.9%) | 184 (1.1%) |
| 12:00 PM to 3:59 PM | 1,188 (6.4%) | 1,092 (6.7%) |
| 4:00 PM to 11:59 PM | 1,520 (8.2%) | 986 (6.1%) |
| Total | 18,537 (100.0%) | 16,242 (100.0%) |
Housing Occupancy in Augusta County
Occupancy by Ownership in Augusta County
Of the total 30,056 dwellings in Augusta County, owner-occupied units account for 23,663 (78.7%), while renter-occupied units make up 6,393 (21.3%).
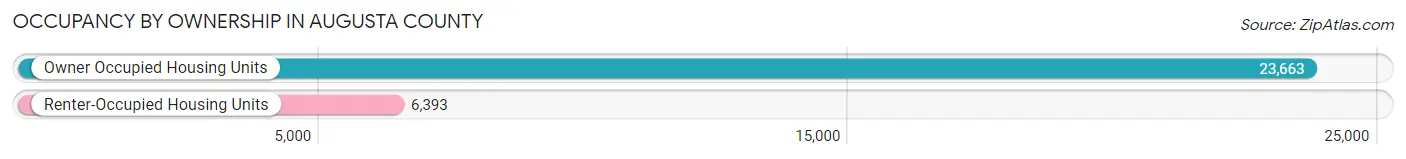
| Occupancy | # Housing Units | % Housing Units |
| Owner Occupied Housing Units | 23,663 | 78.7% |
| Renter-Occupied Housing Units | 6,393 | 21.3% |
| Total Occupied Housing Units | 30,056 | 100.0% |
Occupancy by Household Size in Augusta County
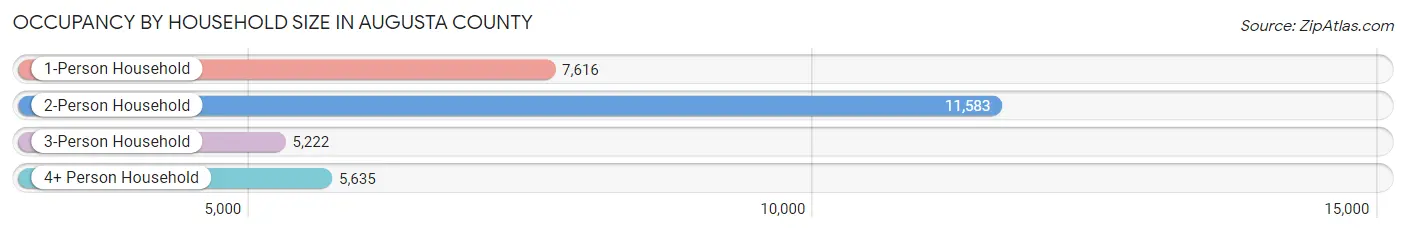
| Household Size | # Housing Units | % Housing Units |
| 1-Person Household | 7,616 | 25.3% |
| 2-Person Household | 11,583 | 38.5% |
| 3-Person Household | 5,222 | 17.4% |
| 4+ Person Household | 5,635 | 18.8% |
| Total Housing Units | 30,056 | 100.0% |
Occupancy by Ownership by Household Size in Augusta County
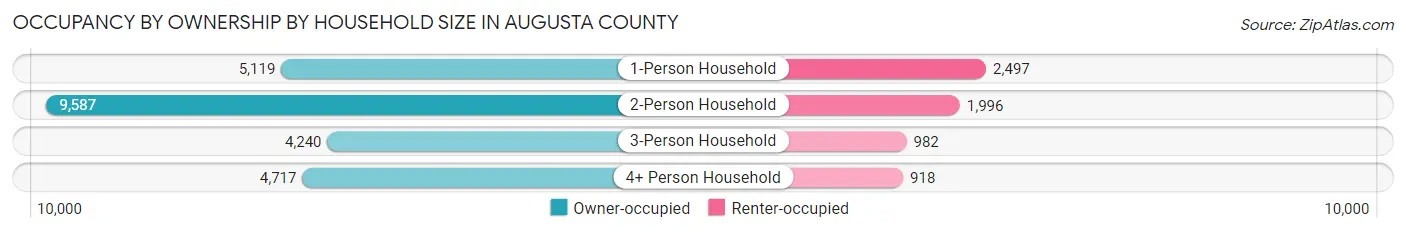
| Household Size | Owner-occupied | Renter-occupied |
| 1-Person Household | 5,119 (67.2%) | 2,497 (32.8%) |
| 2-Person Household | 9,587 (82.8%) | 1,996 (17.2%) |
| 3-Person Household | 4,240 (81.2%) | 982 (18.8%) |
| 4+ Person Household | 4,717 (83.7%) | 918 (16.3%) |
| Total Housing Units | 23,663 (78.7%) | 6,393 (21.3%) |
Occupancy by Educational Attainment in Augusta County
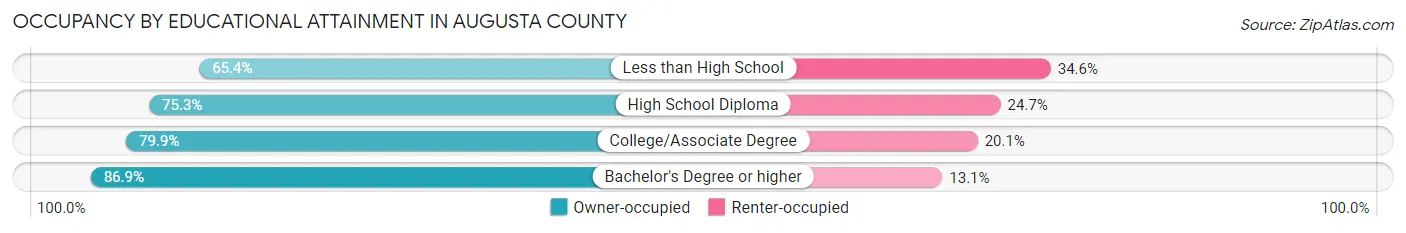
| Household Size | Owner-occupied | Renter-occupied |
| Less than High School | 1,671 (65.4%) | 885 (34.6%) |
| High School Diploma | 8,306 (75.3%) | 2,721 (24.7%) |
| College/Associate Degree | 7,136 (79.9%) | 1,798 (20.1%) |
| Bachelor's Degree or higher | 6,550 (86.9%) | 989 (13.1%) |
Occupancy by Age of Householder in Augusta County
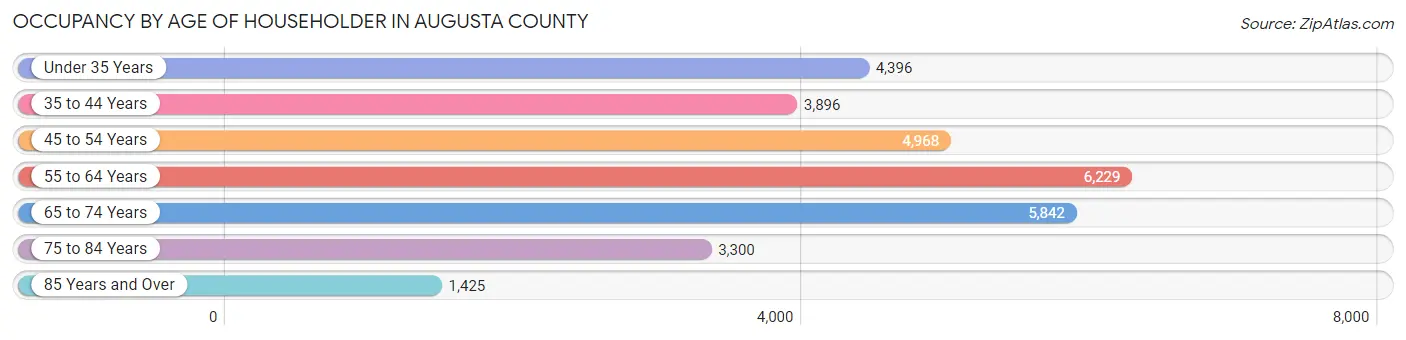
| Age Bracket | # Households | % Households |
| Under 35 Years | 4,396 | 14.6% |
| 35 to 44 Years | 3,896 | 13.0% |
| 45 to 54 Years | 4,968 | 16.5% |
| 55 to 64 Years | 6,229 | 20.7% |
| 65 to 74 Years | 5,842 | 19.4% |
| 75 to 84 Years | 3,300 | 11.0% |
| 85 Years and Over | 1,425 | 4.7% |
| Total | 30,056 | 100.0% |
Housing Finances in Augusta County
Median Income by Occupancy in Augusta County
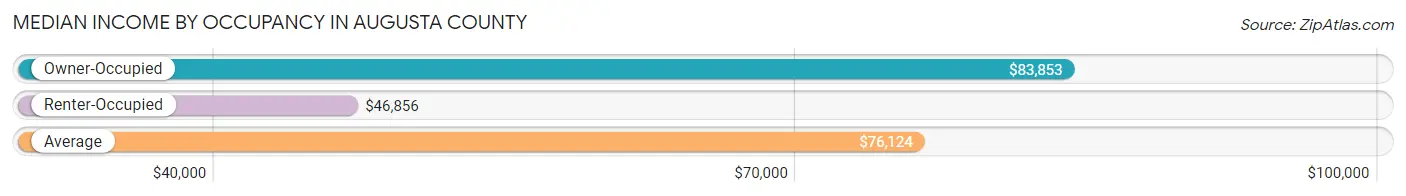
| Occupancy Type | # Households | Median Income |
| Owner-Occupied | 23,663 (78.7%) | $83,853 |
| Renter-Occupied | 6,393 (21.3%) | $46,856 |
| Average | 30,056 (100.0%) | $76,124 |
Occupancy by Householder Income Bracket in Augusta County
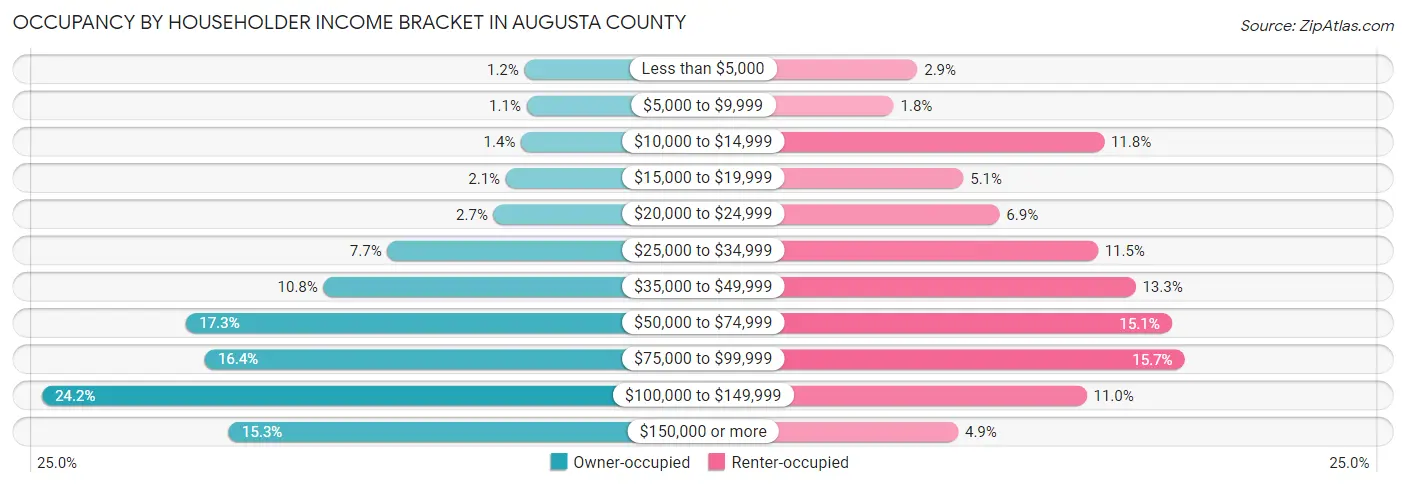
| Income Bracket | Owner-occupied | Renter-occupied |
| Less than $5,000 | 282 (1.2%) | 188 (2.9%) |
| $5,000 to $9,999 | 258 (1.1%) | 116 (1.8%) |
| $10,000 to $14,999 | 319 (1.3%) | 756 (11.8%) |
| $15,000 to $19,999 | 492 (2.1%) | 328 (5.1%) |
| $20,000 to $24,999 | 629 (2.7%) | 438 (6.9%) |
| $25,000 to $34,999 | 1,826 (7.7%) | 737 (11.5%) |
| $35,000 to $49,999 | 2,546 (10.8%) | 852 (13.3%) |
| $50,000 to $74,999 | 4,094 (17.3%) | 962 (15.0%) |
| $75,000 to $99,999 | 3,883 (16.4%) | 1,001 (15.7%) |
| $100,000 to $149,999 | 5,720 (24.2%) | 703 (11.0%) |
| $150,000 or more | 3,614 (15.3%) | 312 (4.9%) |
| Total | 23,663 (100.0%) | 6,393 (100.0%) |
Monthly Housing Cost Tiers in Augusta County
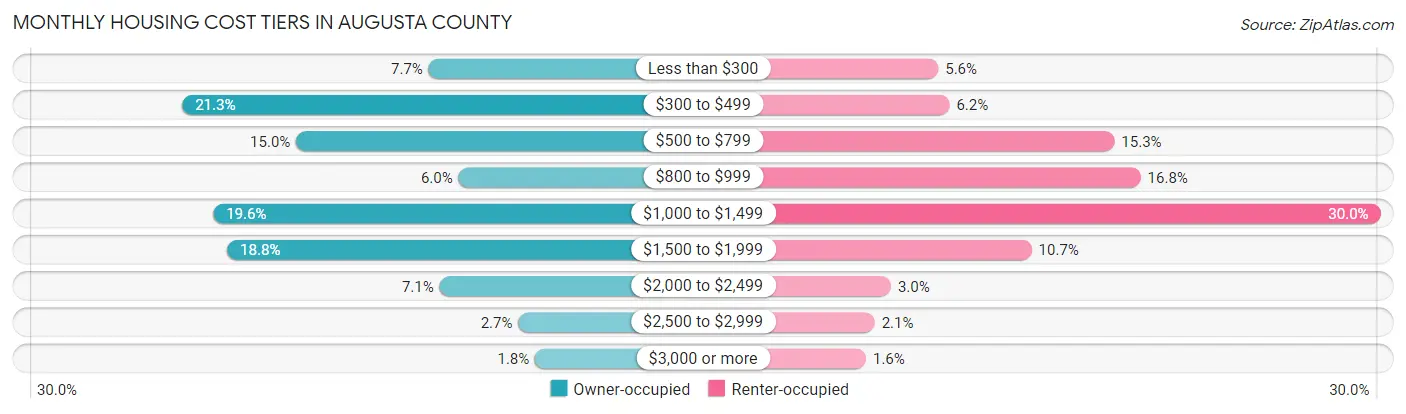
| Monthly Cost | Owner-occupied | Renter-occupied |
| Less than $300 | 1,817 (7.7%) | 356 (5.6%) |
| $300 to $499 | 5,037 (21.3%) | 396 (6.2%) |
| $500 to $799 | 3,549 (15.0%) | 978 (15.3%) |
| $800 to $999 | 1,428 (6.0%) | 1,071 (16.8%) |
| $1,000 to $1,499 | 4,633 (19.6%) | 1,917 (30.0%) |
| $1,500 to $1,999 | 4,450 (18.8%) | 686 (10.7%) |
| $2,000 to $2,499 | 1,676 (7.1%) | 189 (3.0%) |
| $2,500 to $2,999 | 646 (2.7%) | 132 (2.1%) |
| $3,000 or more | 427 (1.8%) | 101 (1.6%) |
| Total | 23,663 (100.0%) | 6,393 (100.0%) |
Physical Housing Characteristics in Augusta County
Housing Structures in Augusta County
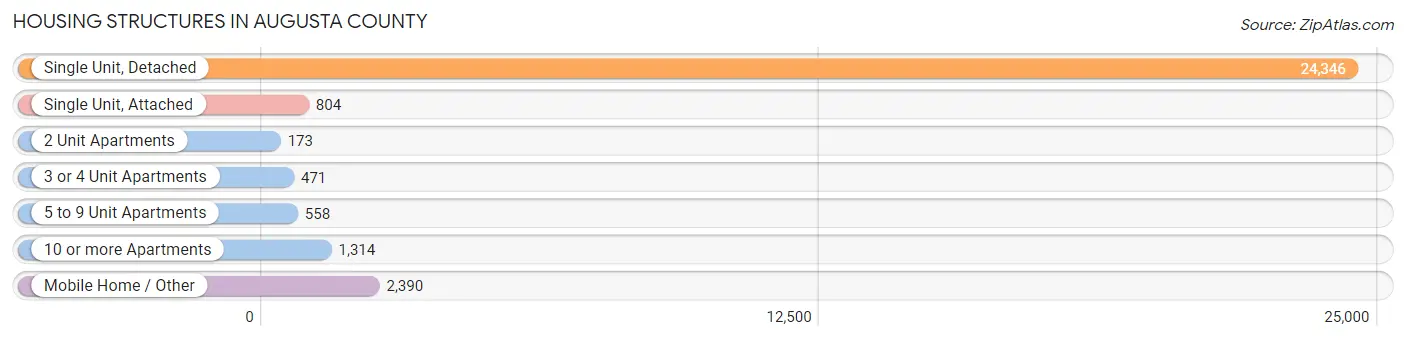
| Structure Type | # Housing Units | % Housing Units |
| Single Unit, Detached | 24,346 | 81.0% |
| Single Unit, Attached | 804 | 2.7% |
| 2 Unit Apartments | 173 | 0.6% |
| 3 or 4 Unit Apartments | 471 | 1.6% |
| 5 to 9 Unit Apartments | 558 | 1.9% |
| 10 or more Apartments | 1,314 | 4.4% |
| Mobile Home / Other | 2,390 | 8.0% |
| Total | 30,056 | 100.0% |
Housing Structures by Occupancy in Augusta County
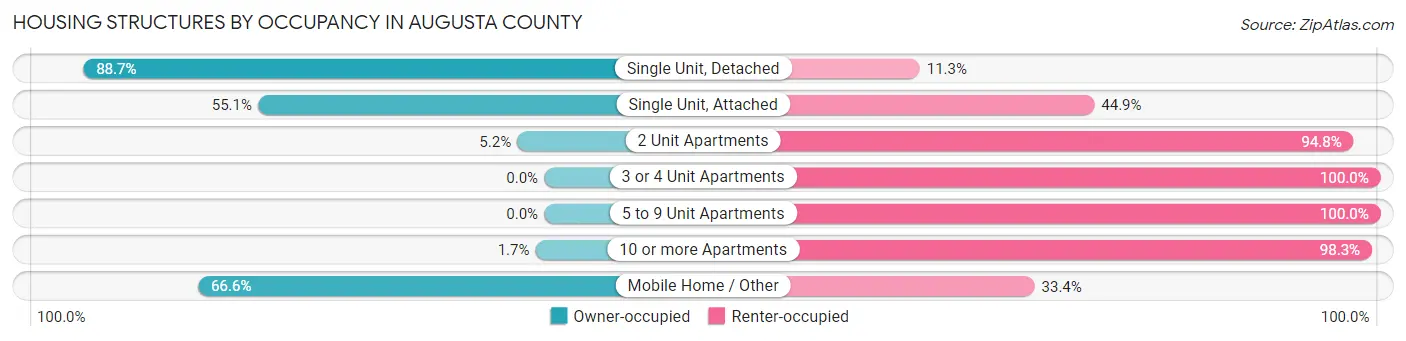
| Structure Type | Owner-occupied | Renter-occupied |
| Single Unit, Detached | 21,597 (88.7%) | 2,749 (11.3%) |
| Single Unit, Attached | 443 (55.1%) | 361 (44.9%) |
| 2 Unit Apartments | 9 (5.2%) | 164 (94.8%) |
| 3 or 4 Unit Apartments | 0 (0.0%) | 471 (100.0%) |
| 5 to 9 Unit Apartments | 0 (0.0%) | 558 (100.0%) |
| 10 or more Apartments | 22 (1.7%) | 1,292 (98.3%) |
| Mobile Home / Other | 1,592 (66.6%) | 798 (33.4%) |
| Total | 23,663 (78.7%) | 6,393 (21.3%) |
Housing Structures by Number of Rooms in Augusta County
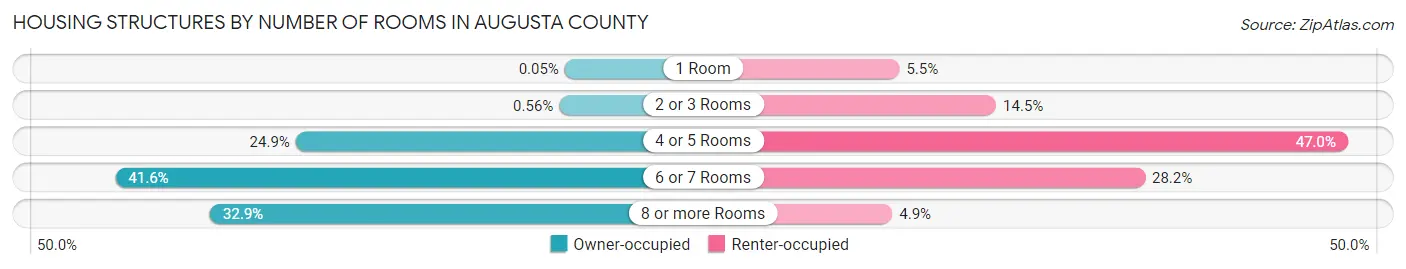
| Number of Rooms | Owner-occupied | Renter-occupied |
| 1 Room | 12 (0.1%) | 352 (5.5%) |
| 2 or 3 Rooms | 132 (0.6%) | 924 (14.4%) |
| 4 or 5 Rooms | 5,899 (24.9%) | 3,003 (47.0%) |
| 6 or 7 Rooms | 9,844 (41.6%) | 1,804 (28.2%) |
| 8 or more Rooms | 7,776 (32.9%) | 310 (4.9%) |
| Total | 23,663 (100.0%) | 6,393 (100.0%) |
Housing Structure by Heating Type in Augusta County
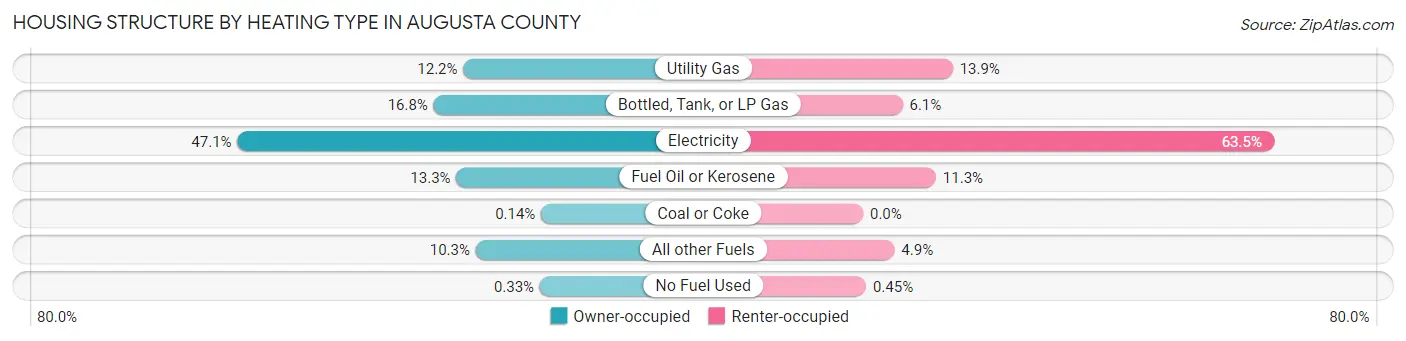
| Heating Type | Owner-occupied | Renter-occupied |
| Utility Gas | 2,880 (12.2%) | 886 (13.9%) |
| Bottled, Tank, or LP Gas | 3,966 (16.8%) | 390 (6.1%) |
| Electricity | 11,146 (47.1%) | 4,058 (63.5%) |
| Fuel Oil or Kerosene | 3,135 (13.3%) | 720 (11.3%) |
| Coal or Coke | 32 (0.1%) | 0 (0.0%) |
| All other Fuels | 2,425 (10.2%) | 310 (4.9%) |
| No Fuel Used | 79 (0.3%) | 29 (0.4%) |
| Total | 23,663 (100.0%) | 6,393 (100.0%) |
Household Vehicle Usage in Augusta County
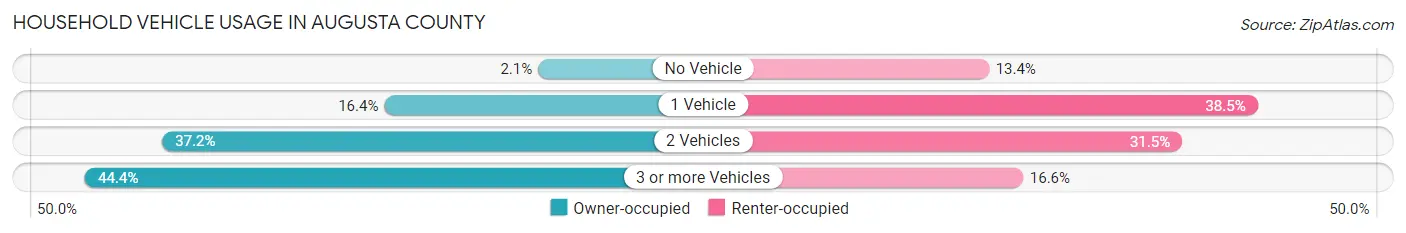
| Vehicles per Household | Owner-occupied | Renter-occupied |
| No Vehicle | 490 (2.1%) | 858 (13.4%) |
| 1 Vehicle | 3,887 (16.4%) | 2,462 (38.5%) |
| 2 Vehicles | 8,792 (37.2%) | 2,011 (31.5%) |
| 3 or more Vehicles | 10,494 (44.4%) | 1,062 (16.6%) |
| Total | 23,663 (100.0%) | 6,393 (100.0%) |
Real Estate & Mortgages in Augusta County
Real Estate and Mortgage Overview in Augusta County
| Characteristic | Without Mortgage | With Mortgage |
| Housing Units | 9,782 | 13,881 |
| Median Property Value | $253,200 | $274,800 |
| Median Household Income | $65,285 | $2,655 |
| Monthly Housing Costs | $431 | $427 |
| Real Estate Taxes | $1,318 | $460 |
Property Value by Mortgage Status in Augusta County
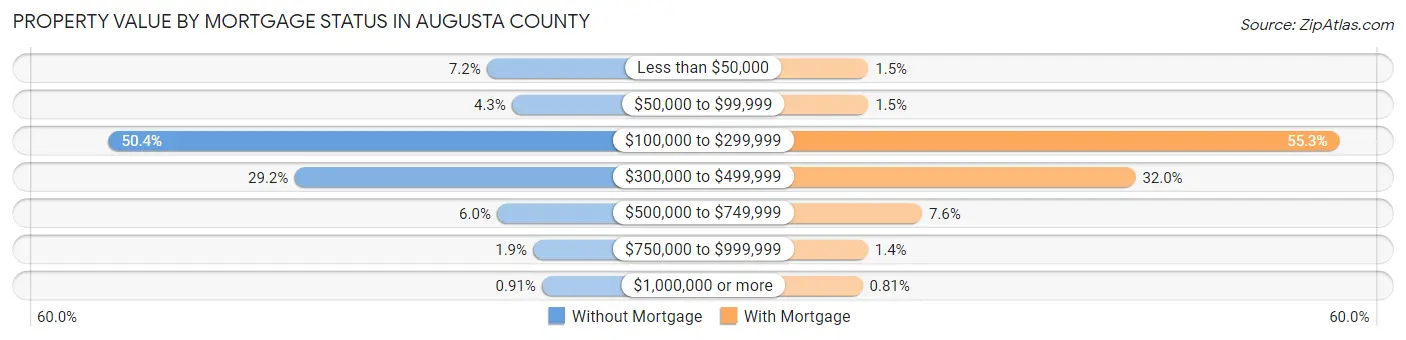
| Property Value | Without Mortgage | With Mortgage |
| Less than $50,000 | 705 (7.2%) | 202 (1.5%) |
| $50,000 to $99,999 | 425 (4.3%) | 201 (1.5%) |
| $100,000 to $299,999 | 4,929 (50.4%) | 7,675 (55.3%) |
| $300,000 to $499,999 | 2,856 (29.2%) | 4,441 (32.0%) |
| $500,000 to $749,999 | 591 (6.0%) | 1,054 (7.6%) |
| $750,000 to $999,999 | 187 (1.9%) | 196 (1.4%) |
| $1,000,000 or more | 89 (0.9%) | 112 (0.8%) |
| Total | 9,782 (100.0%) | 13,881 (100.0%) |
Household Income by Mortgage Status in Augusta County
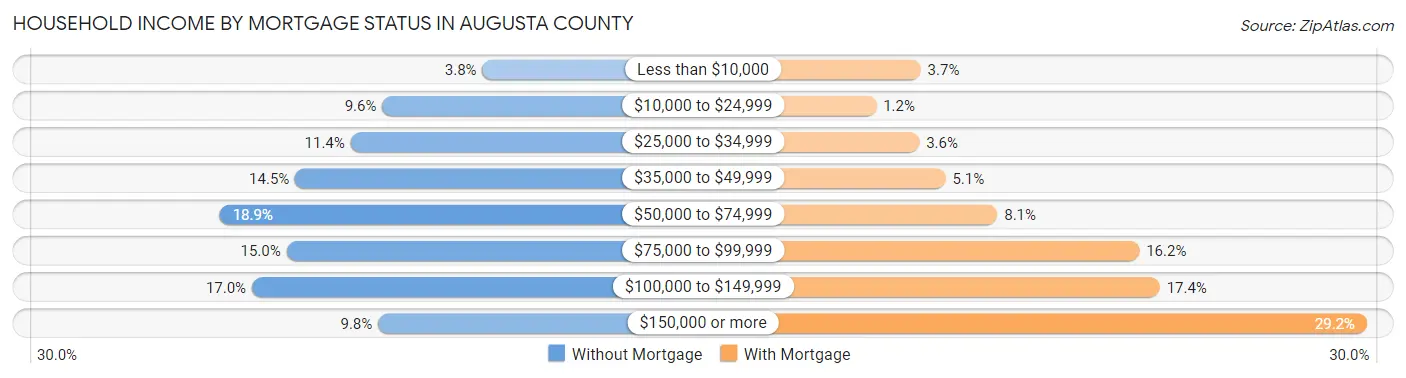
| Household Income | Without Mortgage | With Mortgage |
| Less than $10,000 | 376 (3.8%) | 517 (3.7%) |
| $10,000 to $24,999 | 935 (9.6%) | 164 (1.2%) |
| $25,000 to $34,999 | 1,112 (11.4%) | 505 (3.6%) |
| $35,000 to $49,999 | 1,422 (14.5%) | 714 (5.1%) |
| $50,000 to $74,999 | 1,844 (18.9%) | 1,124 (8.1%) |
| $75,000 to $99,999 | 1,470 (15.0%) | 2,250 (16.2%) |
| $100,000 to $149,999 | 1,664 (17.0%) | 2,413 (17.4%) |
| $150,000 or more | 959 (9.8%) | 4,056 (29.2%) |
| Total | 9,782 (100.0%) | 13,881 (100.0%) |
Property Value to Household Income Ratio in Augusta County
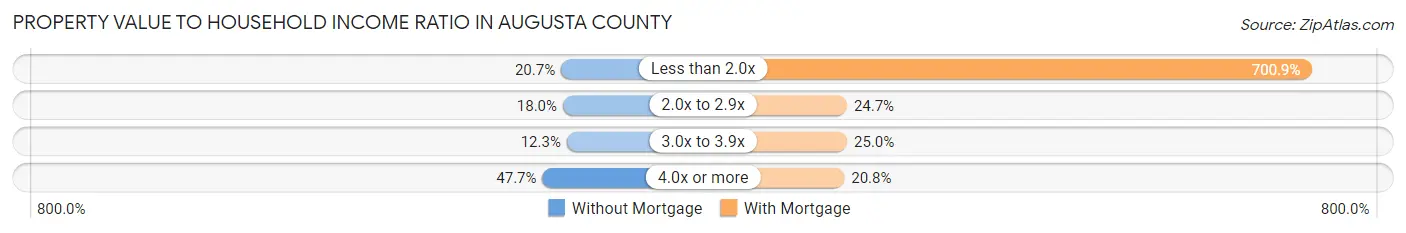
| Value-to-Income Ratio | Without Mortgage | With Mortgage |
| Less than 2.0x | 2,023 (20.7%) | 97,292 (700.9%) |
| 2.0x to 2.9x | 1,757 (18.0%) | 3,432 (24.7%) |
| 3.0x to 3.9x | 1,206 (12.3%) | 3,468 (25.0%) |
| 4.0x or more | 4,669 (47.7%) | 2,893 (20.8%) |
| Total | 9,782 (100.0%) | 13,881 (100.0%) |
Real Estate Taxes by Mortgage Status in Augusta County
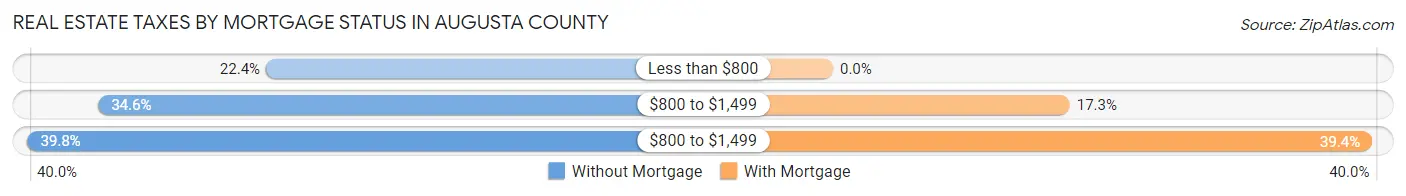
| Property Taxes | Without Mortgage | With Mortgage |
| Less than $800 | 2,188 (22.4%) | 0 (0.0%) |
| $800 to $1,499 | 3,387 (34.6%) | 2,401 (17.3%) |
| $800 to $1,499 | 3,892 (39.8%) | 5,467 (39.4%) |
| Total | 9,782 (100.0%) | 13,881 (100.0%) |
Health & Disability in Augusta County
Health Insurance Coverage by Age in Augusta County
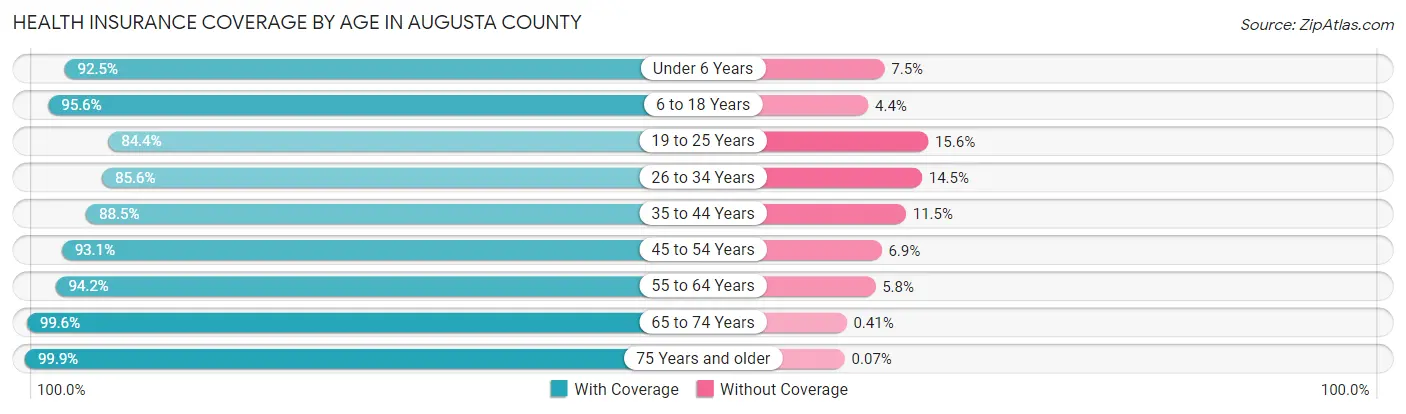
| Age Bracket | With Coverage | Without Coverage |
| Under 6 Years | 4,175 (92.5%) | 337 (7.5%) |
| 6 to 18 Years | 10,366 (95.6%) | 482 (4.4%) |
| 19 to 25 Years | 4,444 (84.4%) | 822 (15.6%) |
| 26 to 34 Years | 6,312 (85.6%) | 1,066 (14.4%) |
| 35 to 44 Years | 7,474 (88.5%) | 968 (11.5%) |
| 45 to 54 Years | 8,787 (93.1%) | 654 (6.9%) |
| 55 to 64 Years | 10,691 (94.2%) | 654 (5.8%) |
| 65 to 74 Years | 9,493 (99.6%) | 39 (0.4%) |
| 75 Years and older | 6,962 (99.9%) | 5 (0.1%) |
| Total | 68,704 (93.2%) | 5,027 (6.8%) |
Health Insurance Coverage by Citizenship Status in Augusta County
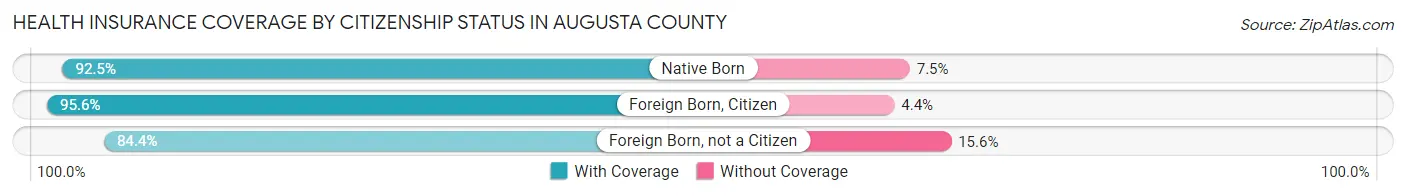
| Citizenship Status | With Coverage | Without Coverage |
| Native Born | 4,175 (92.5%) | 337 (7.5%) |
| Foreign Born, Citizen | 10,366 (95.6%) | 482 (4.4%) |
| Foreign Born, not a Citizen | 4,444 (84.4%) | 822 (15.6%) |
Health Insurance Coverage by Household Income in Augusta County
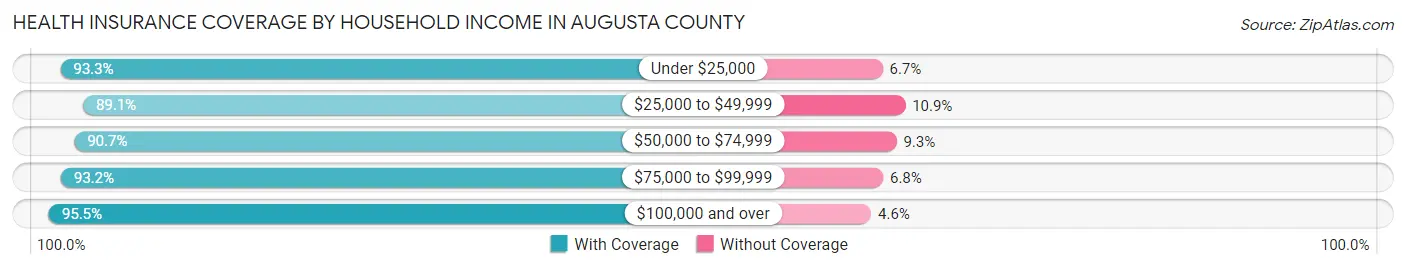
| Household Income | With Coverage | Without Coverage |
| Under $25,000 | 5,506 (93.3%) | 395 (6.7%) |
| $25,000 to $49,999 | 9,528 (89.1%) | 1,171 (10.9%) |
| $50,000 to $74,999 | 10,731 (90.7%) | 1,100 (9.3%) |
| $75,000 to $99,999 | 12,272 (93.2%) | 894 (6.8%) |
| $100,000 and over | 30,598 (95.5%) | 1,460 (4.5%) |
Public vs Private Health Insurance Coverage by Age in Augusta County
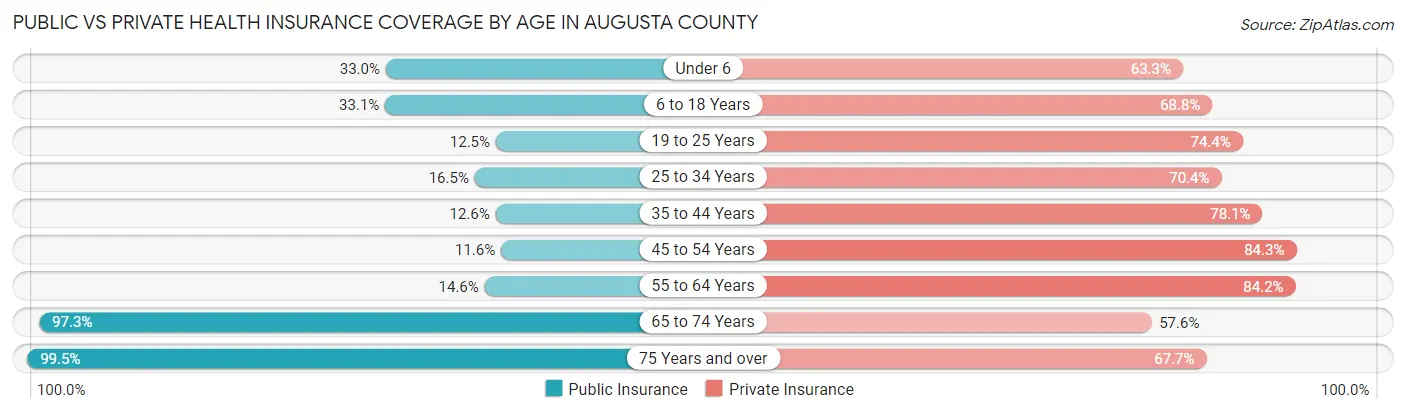
| Age Bracket | Public Insurance | Private Insurance |
| Under 6 | 1,487 (33.0%) | 2,855 (63.3%) |
| 6 to 18 Years | 3,587 (33.1%) | 7,458 (68.8%) |
| 19 to 25 Years | 660 (12.5%) | 3,918 (74.4%) |
| 25 to 34 Years | 1,214 (16.5%) | 5,196 (70.4%) |
| 35 to 44 Years | 1,062 (12.6%) | 6,590 (78.1%) |
| 45 to 54 Years | 1,091 (11.6%) | 7,963 (84.3%) |
| 55 to 64 Years | 1,659 (14.6%) | 9,551 (84.2%) |
| 65 to 74 Years | 9,277 (97.3%) | 5,492 (57.6%) |
| 75 Years and over | 6,933 (99.5%) | 4,714 (67.7%) |
| Total | 26,970 (36.6%) | 53,737 (72.9%) |
Disability Status by Sex by Age in Augusta County
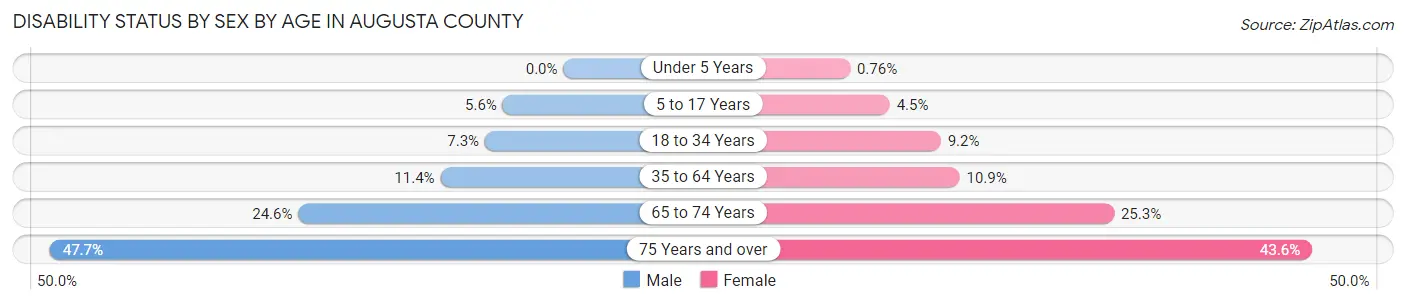
| Age Bracket | Male | Female |
| Under 5 Years | 0 (0.0%) | 13 (0.8%) |
| 5 to 17 Years | 319 (5.6%) | 240 (4.4%) |
| 18 to 34 Years | 499 (7.3%) | 609 (9.2%) |
| 35 to 64 Years | 1,631 (11.4%) | 1,633 (10.9%) |
| 65 to 74 Years | 1,121 (24.6%) | 1,257 (25.3%) |
| 75 Years and over | 1,499 (47.7%) | 1,668 (43.6%) |
Disability Class by Sex by Age in Augusta County
Disability Class: Hearing Difficulty
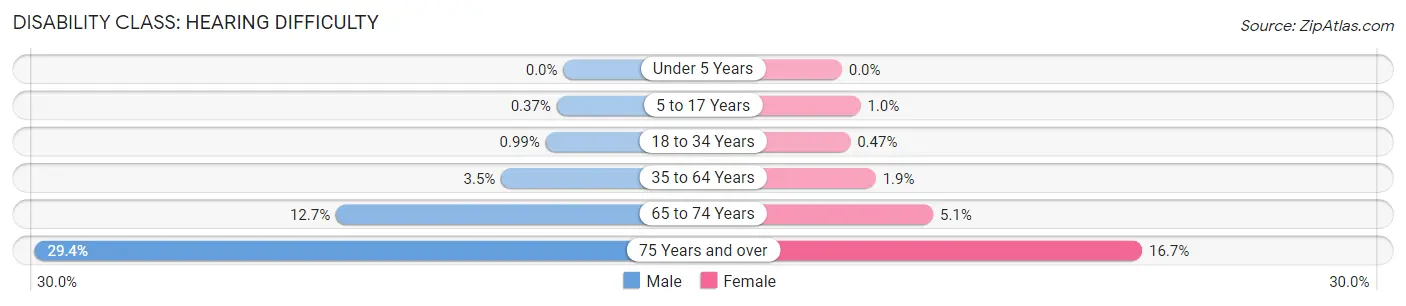
| Age Bracket | Male | Female |
| Under 5 Years | 0 (0.0%) | 0 (0.0%) |
| 5 to 17 Years | 21 (0.4%) | 56 (1.0%) |
| 18 to 34 Years | 68 (1.0%) | 31 (0.5%) |
| 35 to 64 Years | 494 (3.5%) | 283 (1.9%) |
| 65 to 74 Years | 577 (12.7%) | 253 (5.1%) |
| 75 Years and over | 926 (29.4%) | 639 (16.7%) |
Disability Class: Vision Difficulty
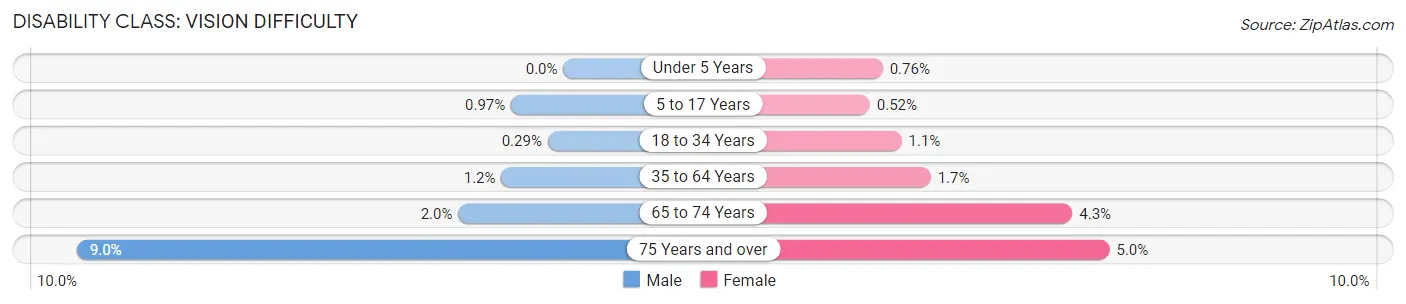
| Age Bracket | Male | Female |
| Under 5 Years | 0 (0.0%) | 13 (0.8%) |
| 5 to 17 Years | 55 (1.0%) | 28 (0.5%) |
| 18 to 34 Years | 20 (0.3%) | 74 (1.1%) |
| 35 to 64 Years | 165 (1.1%) | 246 (1.7%) |
| 65 to 74 Years | 89 (1.9%) | 213 (4.3%) |
| 75 Years and over | 284 (9.0%) | 190 (5.0%) |
Disability Class: Cognitive Difficulty
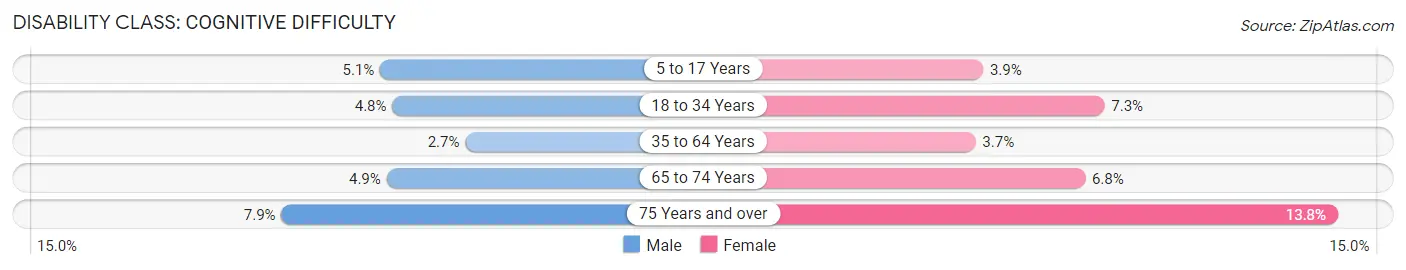
| Age Bracket | Male | Female |
| 5 to 17 Years | 289 (5.1%) | 212 (3.9%) |
| 18 to 34 Years | 326 (4.8%) | 485 (7.3%) |
| 35 to 64 Years | 390 (2.7%) | 555 (3.7%) |
| 65 to 74 Years | 224 (4.9%) | 337 (6.8%) |
| 75 Years and over | 247 (7.9%) | 528 (13.8%) |
Disability Class: Ambulatory Difficulty
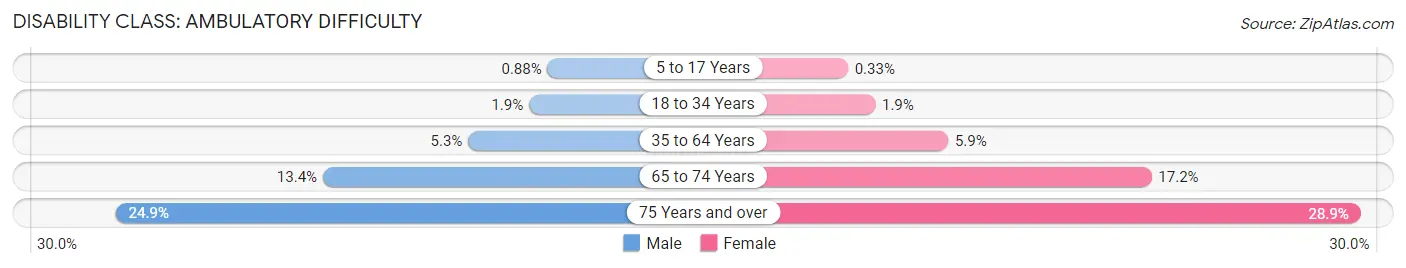
| Age Bracket | Male | Female |
| 5 to 17 Years | 50 (0.9%) | 18 (0.3%) |
| 18 to 34 Years | 131 (1.9%) | 123 (1.8%) |
| 35 to 64 Years | 758 (5.3%) | 883 (5.9%) |
| 65 to 74 Years | 610 (13.4%) | 858 (17.2%) |
| 75 Years and over | 784 (24.9%) | 1,104 (28.9%) |
Disability Class: Self-Care Difficulty
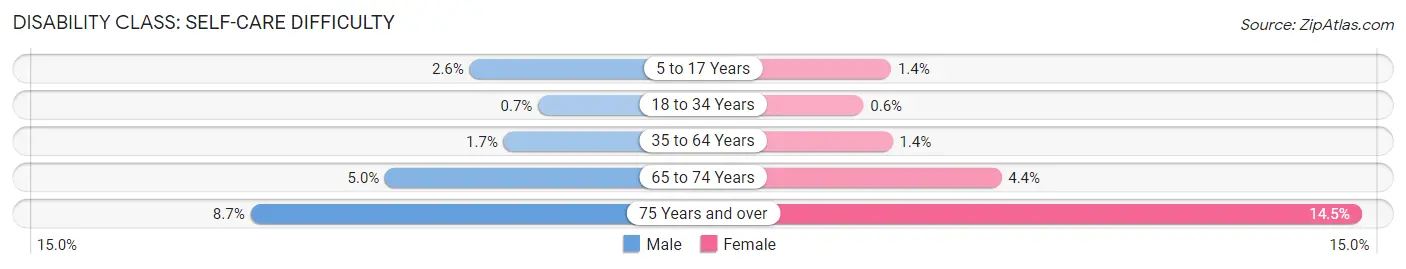
| Age Bracket | Male | Female |
| 5 to 17 Years | 148 (2.6%) | 74 (1.4%) |
| 18 to 34 Years | 48 (0.7%) | 40 (0.6%) |
| 35 to 64 Years | 237 (1.7%) | 210 (1.4%) |
| 65 to 74 Years | 226 (5.0%) | 221 (4.4%) |
| 75 Years and over | 274 (8.7%) | 553 (14.5%) |
Technology Access in Augusta County
Computing Device Access in Augusta County
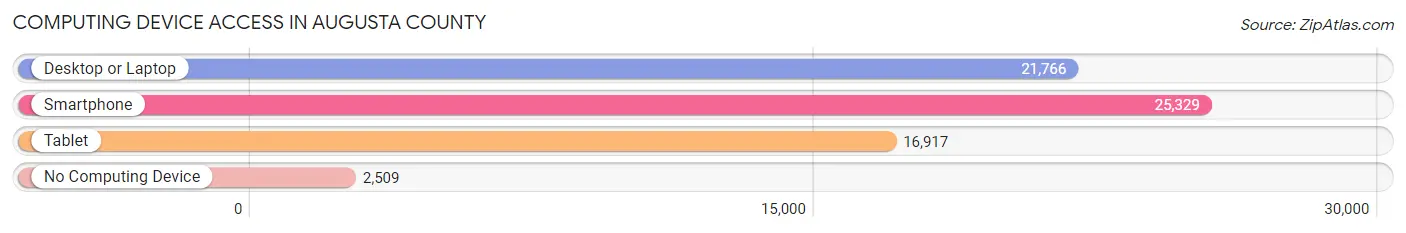
| Device Type | # Households | % Households |
| Desktop or Laptop | 21,766 | 72.4% |
| Smartphone | 25,329 | 84.3% |
| Tablet | 16,917 | 56.3% |
| No Computing Device | 2,509 | 8.4% |
| Total | 30,056 | 100.0% |
Internet Access in Augusta County
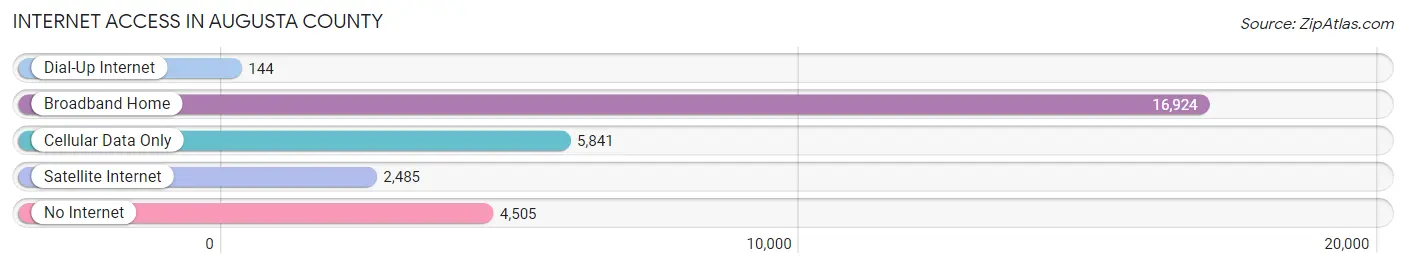
| Internet Type | # Households | % Households |
| Dial-Up Internet | 144 | 0.5% |
| Broadband Home | 16,924 | 56.3% |
| Cellular Data Only | 5,841 | 19.4% |
| Satellite Internet | 2,485 | 8.3% |
| No Internet | 4,505 | 15.0% |
| Total | 30,056 | 100.0% |
Augusta County Summary
Augusta County, Virginia is located in the Shenandoah Valley region of the Commonwealth of Virginia. It is bordered by Rockingham County to the north, Page County to the east, Rockbridge County to the south, and Highland County to the west. Augusta County is the second largest county in Virginia, covering an area of 1,312 square miles.
History
Augusta County was formed in 1738 from Orange County. It was named for Princess Augusta of Saxe-Gotha, the mother of King George III of England. The county was divided into two parts in 1745, with the northern part becoming Rockingham County.
During the American Revolution, Augusta County was the site of several battles, including the Battle of Cross Keys and the Battle of Port Republic. The county was also the site of the Staunton Convention in 1781, which was a meeting of Virginia delegates to discuss the state's response to the Articles of Confederation.
In the 19th century, Augusta County was a major center of the Shenandoah Valley agricultural economy. The county was also the site of several important Civil War battles, including the Battle of Port Republic and the Battle of Cross Keys.
Geography
Augusta County is located in the Shenandoah Valley region of Virginia. The county is bordered by Rockingham County to the north, Page County to the east, Rockbridge County to the south, and Highland County to the west. The county is divided into two parts by the Blue Ridge Mountains, with the northern part being more mountainous and the southern part being more rolling hills.
The county is home to several rivers, including the Shenandoah River, the South River, and the North River. The county also contains several mountain ranges, including the Blue Ridge Mountains, the Allegheny Mountains, and the Massanutten Mountains.
Economy
Augusta County is a major agricultural center in the Shenandoah Valley region of Virginia. The county is home to several large farms, including the Shenandoah Valley Organic Farm and the Augusta County Farm Bureau. The county is also home to several wineries, including the Shenandoah Vineyards and the Rockbridge Vineyards.
The county is also home to several manufacturing companies, including the Augusta County Manufacturing Company and the Augusta County Tool and Die Company. The county is also home to several technology companies, including the Augusta County Technology Park and the Augusta County Technology Center.
Demographics
As of the 2010 census, Augusta County had a population of 73,750. The racial makeup of the county was 92.3% White, 4.3% Black or African American, 0.4% Native American, 0.7% Asian, 0.1% Pacific Islander, 1.2% from other races, and 1.1% from two or more races. Hispanic or Latino of any race were 3.2% of the population.
The median income for a household in the county was $45,945, and the median income for a family was $54,945. The per capita income for the county was $23,945. About 8.7% of families and 11.2% of the population were below the poverty line, including 15.2% of those under age 18 and 8.2% of those age 65 or over.
Common Questions
What is Per Capita Income in Augusta County?
Per Capita income in Augusta County is $35,582.
What is the Median Family Income in Augusta County?
Median Family Income in Augusta County is $90,083.
What is the Median Household income in Augusta County?
Median Household Income in Augusta County is $76,124.
What is Income or Wage Gap in Augusta County?
Income or Wage Gap in Augusta County is 24.4%.
Women in Augusta County earn 75.6 cents for every dollar earned by a man.
What is Family Income Deficit in Augusta County?
Family Income Deficit in Augusta County is $10,321.
Families that are below poverty line in Augusta County earn $10,321 less on average than the poverty threshold level.
What is Inequality or Gini Index in Augusta County?
Inequality or Gini Index in Augusta County is 0.40.
What is the Total Population of Augusta County?
Total Population of Augusta County is 77,433.
What is the Total Male Population of Augusta County?
Total Male Population of Augusta County is 39,547.
What is the Total Female Population of Augusta County?
Total Female Population of Augusta County is 37,886.
What is the Ratio of Males per 100 Females in Augusta County?
There are 104.38 Males per 100 Females in Augusta County.
What is the Ratio of Females per 100 Males in Augusta County?
There are 95.80 Females per 100 Males in Augusta County.
What is the Median Population Age in Augusta County?
Median Population Age in Augusta County is 44.8 Years.
What is the Average Family Size in Augusta County
Average Family Size in Augusta County is 2.9 People.
What is the Average Household Size in Augusta County
Average Household Size in Augusta County is 2.5 People.
How Large is the Labor Force in Augusta County?
There are 38,882 People in the Labor Forcein in Augusta County.
What is the Percentage of People in the Labor Force in Augusta County?
60.1% of People are in the Labor Force in Augusta County.
What is the Unemployment Rate in Augusta County?
Unemployment Rate in Augusta County is 3.0%.