Arlington County, VA Map & Demographics
Arlington County Map
Arlington County Overview
$85,221
PER CAPITA INCOME
$188,191
AVG FAMILY INCOME
$137,387
AVG HOUSEHOLD INCOME
21.6%
WAGE / INCOME GAP [ % ]
78.4¢/ $1
WAGE / INCOME GAP [ $ ]
$11,458
FAMILY INCOME DEFICIT
0.45
INEQUALITY / GINI INDEX
235,845
TOTAL POPULATION
119,030
MALE POPULATION
116,815
FEMALE POPULATION
101.90
MALES / 100 FEMALES
98.14
FEMALES / 100 MALES
35.3
MEDIAN AGE
3.0
AVG FAMILY SIZE
2.1
AVG HOUSEHOLD SIZE
154,912
LABOR FORCE [ PEOPLE ]
78.4%
PERCENT IN LABOR FORCE
2.8%
UNEMPLOYMENT RATE
Income in Arlington County
Income Overview in Arlington County
Per Capita Income in Arlington County is $85,221, while median incomes of families and households are $188,191 and $137,387 respectively.
| Characteristic | Number | Measure |
| Per Capita Income | 235,845 | $85,221 |
| Median Family Income | 50,024 | $188,191 |
| Mean Family Income | 50,024 | $236,906 |
| Median Household Income | 110,887 | $137,387 |
| Mean Household Income | 110,887 | $180,199 |
| Income Deficit | 50,024 | $11,458 |
| Wage / Income Gap (%) | 235,845 | 21.57% |
| Wage / Income Gap ($) | 235,845 | 78.43¢ per $1 |
| Gini / Inequality Index | 235,845 | 0.45 |
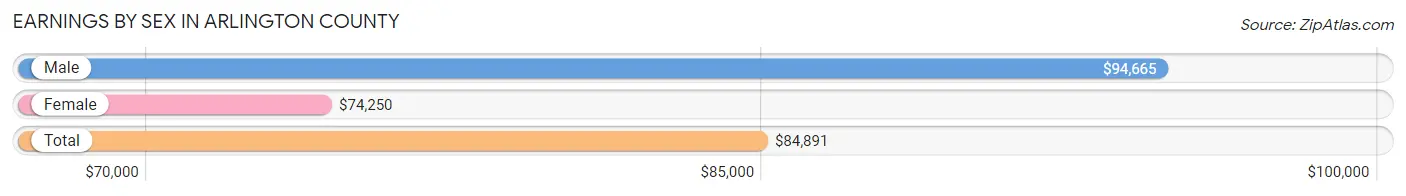
Earnings by Sex in Arlington County
Average Earnings in Arlington County are $84,891, $94,665 for men and $74,250 for women, a difference of 21.6%.
| Sex | Number | Average Earnings |
| Male | 83,822 (52.7%) | $94,665 |
| Female | 75,272 (47.3%) | $74,250 |
| Total | 159,094 (100.0%) | $84,891 |
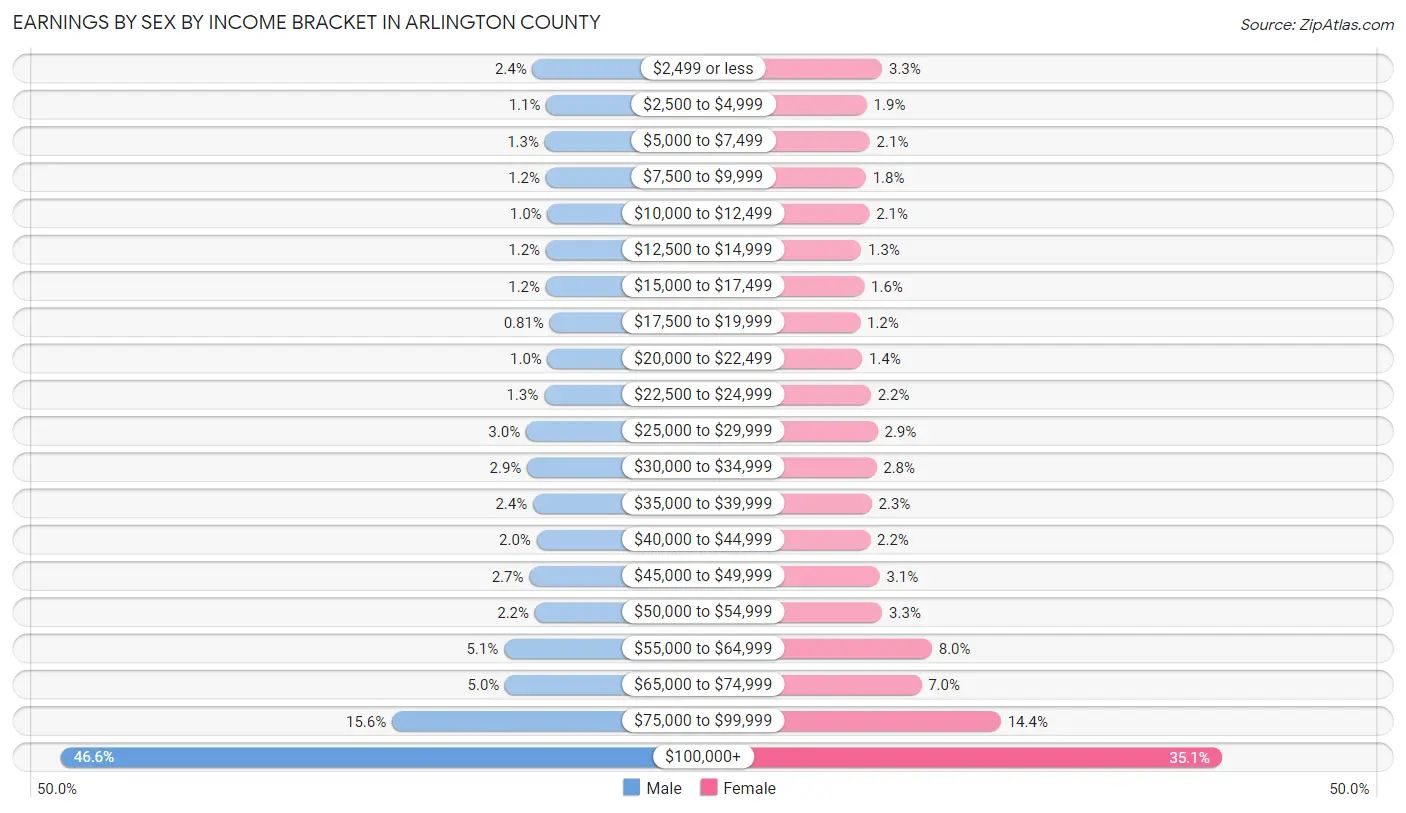
Earnings by Sex by Income Bracket in Arlington County
The most common earnings brackets in Arlington County are $100,000+ for men (39,065 | 46.6%) and $100,000+ for women (26,418 | 35.1%).
| Income | Male | Female |
| $2,499 or less | 2,027 (2.4%) | 2,484 (3.3%) |
| $2,500 to $4,999 | 944 (1.1%) | 1,402 (1.9%) |
| $5,000 to $7,499 | 1,062 (1.3%) | 1,613 (2.1%) |
| $7,500 to $9,999 | 977 (1.2%) | 1,336 (1.8%) |
| $10,000 to $12,499 | 851 (1.0%) | 1,581 (2.1%) |
| $12,500 to $14,999 | 973 (1.2%) | 1,008 (1.3%) |
| $15,000 to $17,499 | 981 (1.2%) | 1,218 (1.6%) |
| $17,500 to $19,999 | 681 (0.8%) | 933 (1.2%) |
| $20,000 to $22,499 | 838 (1.0%) | 1,072 (1.4%) |
| $22,500 to $24,999 | 1,127 (1.3%) | 1,684 (2.2%) |
| $25,000 to $29,999 | 2,539 (3.0%) | 2,169 (2.9%) |
| $30,000 to $34,999 | 2,446 (2.9%) | 2,081 (2.8%) |
| $35,000 to $39,999 | 1,984 (2.4%) | 1,745 (2.3%) |
| $40,000 to $44,999 | 1,701 (2.0%) | 1,642 (2.2%) |
| $45,000 to $49,999 | 2,281 (2.7%) | 2,311 (3.1%) |
| $50,000 to $54,999 | 1,847 (2.2%) | 2,490 (3.3%) |
| $55,000 to $64,999 | 4,269 (5.1%) | 5,988 (8.0%) |
| $65,000 to $74,999 | 4,173 (5.0%) | 5,244 (7.0%) |
| $75,000 to $99,999 | 13,056 (15.6%) | 10,853 (14.4%) |
| $100,000+ | 39,065 (46.6%) | 26,418 (35.1%) |
| Total | 83,822 (100.0%) | 75,272 (100.0%) |
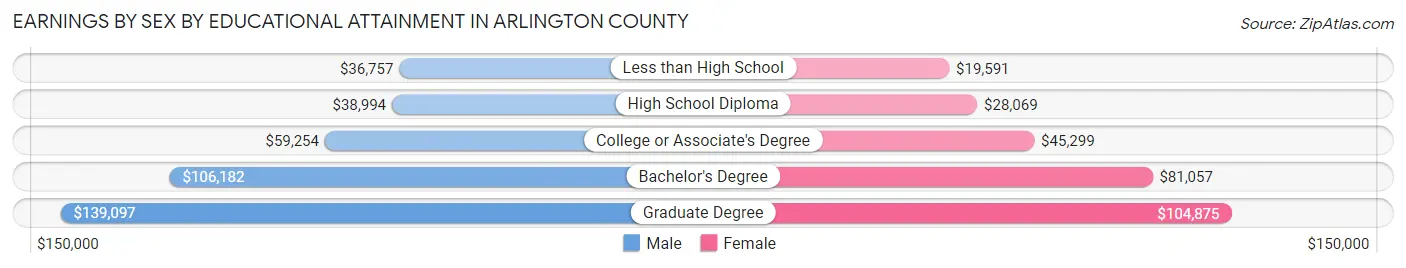
Earnings by Sex by Educational Attainment in Arlington County
Average earnings in Arlington County are $103,589 for men and $82,156 for women, a difference of 20.7%. Men with an educational attainment of graduate degree enjoy the highest average annual earnings of $139,097, while those with less than high school education earn the least with $36,757. Women with an educational attainment of graduate degree earn the most with the average annual earnings of $104,875, while those with less than high school education have the smallest earnings of $19,591.
| Educational Attainment | Male Income | Female Income |
| Less than High School | $36,757 | $19,591 |
| High School Diploma | $38,994 | $28,069 |
| College or Associate's Degree | $59,254 | $45,299 |
| Bachelor's Degree | $106,182 | $81,057 |
| Graduate Degree | $139,097 | $104,875 |
| Total | $103,589 | $82,156 |
Family Income in Arlington County
Family Income Brackets in Arlington County
According to the Arlington County family income data, there are 23,361 families falling into the $200,000+ income range, which is the most common income bracket and makes up 46.7% of all families. Conversely, the $10,000 to $14,999 income bracket is the least frequent group with only 400 families (0.8%) belonging to this category.
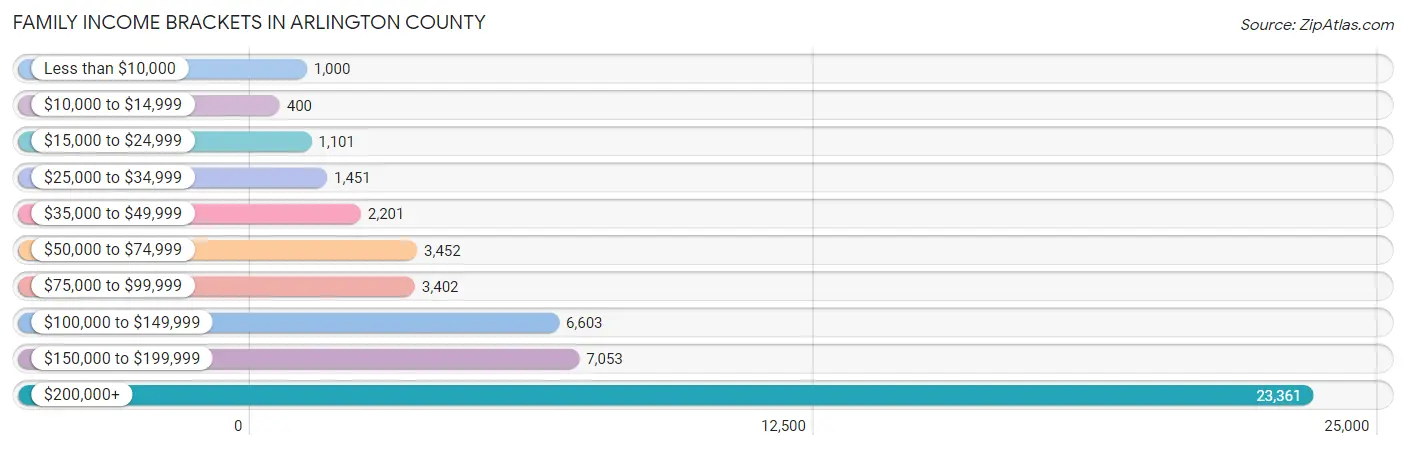
| Income Bracket | # Families | % Families |
| Less than $10,000 | 1,000 | 2.0% |
| $10,000 to $14,999 | 400 | 0.8% |
| $15,000 to $24,999 | 1,101 | 2.2% |
| $25,000 to $34,999 | 1,451 | 2.9% |
| $35,000 to $49,999 | 2,201 | 4.4% |
| $50,000 to $74,999 | 3,452 | 6.9% |
| $75,000 to $99,999 | 3,402 | 6.8% |
| $100,000 to $149,999 | 6,603 | 13.2% |
| $150,000 to $199,999 | 7,053 | 14.1% |
| $200,000+ | 23,361 | 46.7% |
Family Income by Famaliy Size in Arlington County
4-person families (10,052 | 20.1%) account for the highest median family income in Arlington County with $240,606 per family, while 2-person families (25,019 | 50.0%) have the highest median income of $83,997 per family member.
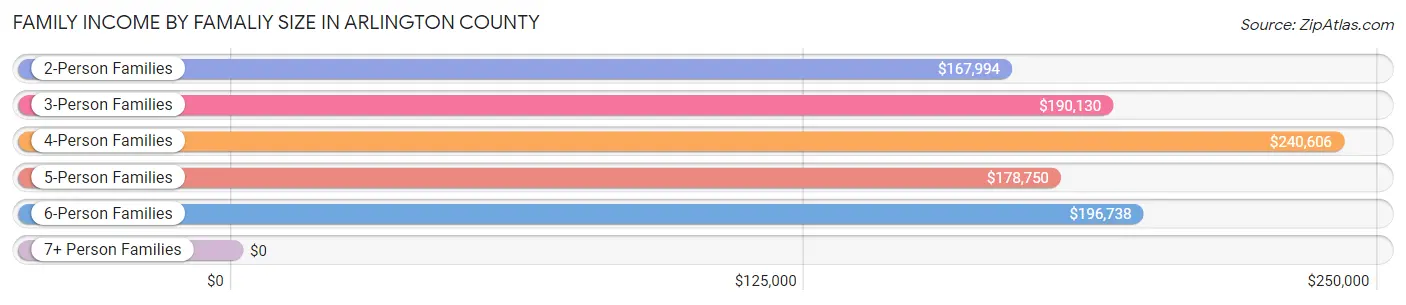
| Income Bracket | # Families | Median Income |
| 2-Person Families | 25,019 (50.0%) | $167,994 |
| 3-Person Families | 10,824 (21.6%) | $190,130 |
| 4-Person Families | 10,052 (20.1%) | $240,606 |
| 5-Person Families | 3,068 (6.1%) | $178,750 |
| 6-Person Families | 855 (1.7%) | $196,738 |
| 7+ Person Families | 206 (0.4%) | $0 |
| Total | 50,024 (100.0%) | $188,191 |
Family Income by Number of Earners in Arlington County
The median family income in Arlington County is $188,191, with families comprising 3+ earners (4,533) having the highest median family income of $231,550, while families with no earners (4,223) have the lowest median family income of $105,985, accounting for 9.1% and 8.4% of families, respectively.
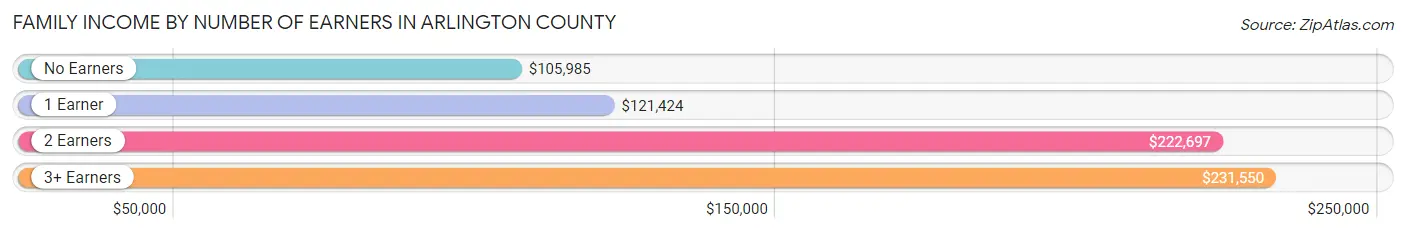
| Number of Earners | # Families | Median Income |
| No Earners | 4,223 (8.4%) | $105,985 |
| 1 Earner | 12,002 (24.0%) | $121,424 |
| 2 Earners | 29,266 (58.5%) | $222,697 |
| 3+ Earners | 4,533 (9.1%) | $231,550 |
| Total | 50,024 (100.0%) | $188,191 |
Household Income in Arlington County
Household Income Brackets in Arlington County
With 33,599 households falling in the category, the $200,000+ income range is the most frequent in Arlington County, accounting for 30.3% of all households. In contrast, only 1,774 households (1.6%) fall into the $10,000 to $14,999 income bracket, making it the least populous group.

| Income Bracket | # Households | % Households |
| Less than $10,000 | 3,659 | 3.3% |
| $10,000 to $14,999 | 1,774 | 1.6% |
| $15,000 to $24,999 | 3,437 | 3.1% |
| $25,000 to $34,999 | 3,548 | 3.2% |
| $35,000 to $49,999 | 5,101 | 4.6% |
| $50,000 to $74,999 | 10,534 | 9.5% |
| $75,000 to $99,999 | 12,198 | 11.0% |
| $100,000 to $149,999 | 20,736 | 18.7% |
| $150,000 to $199,999 | 16,300 | 14.7% |
| $200,000+ | 33,599 | 30.3% |
Household Income by Householder Age in Arlington County
The median household income in Arlington County is $137,387, with the highest median household income of $164,076 found in the 45 to 64 years age bracket for the primary householder. A total of 33,000 households (29.8%) fall into this category. Meanwhile, the 15 to 24 years age bracket for the primary householder has the lowest median household income of $80,524, with 6,864 households (6.2%) in this group.
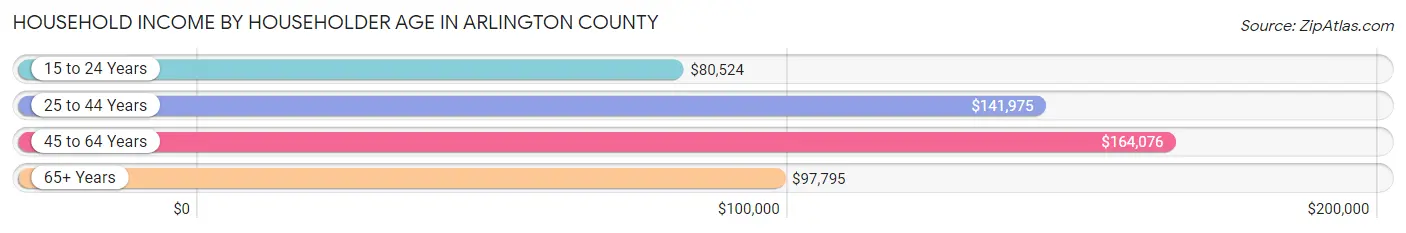
| Income Bracket | # Households | Median Income |
| 15 to 24 Years | 6,864 (6.2%) | $80,524 |
| 25 to 44 Years | 53,399 (48.2%) | $141,975 |
| 45 to 64 Years | 33,000 (29.8%) | $164,076 |
| 65+ Years | 17,624 (15.9%) | $97,795 |
| Total | 110,887 (100.0%) | $137,387 |
Poverty in Arlington County
Income Below Poverty by Sex and Age in Arlington County
With 5.9% poverty level for males and 7.4% for females among the residents of Arlington County, 18 to 24 year old males and 18 to 24 year old females are the most vulnerable to poverty, with 1,295 males (14.4%) and 1,584 females (16.6%) in their respective age groups living below the poverty level.
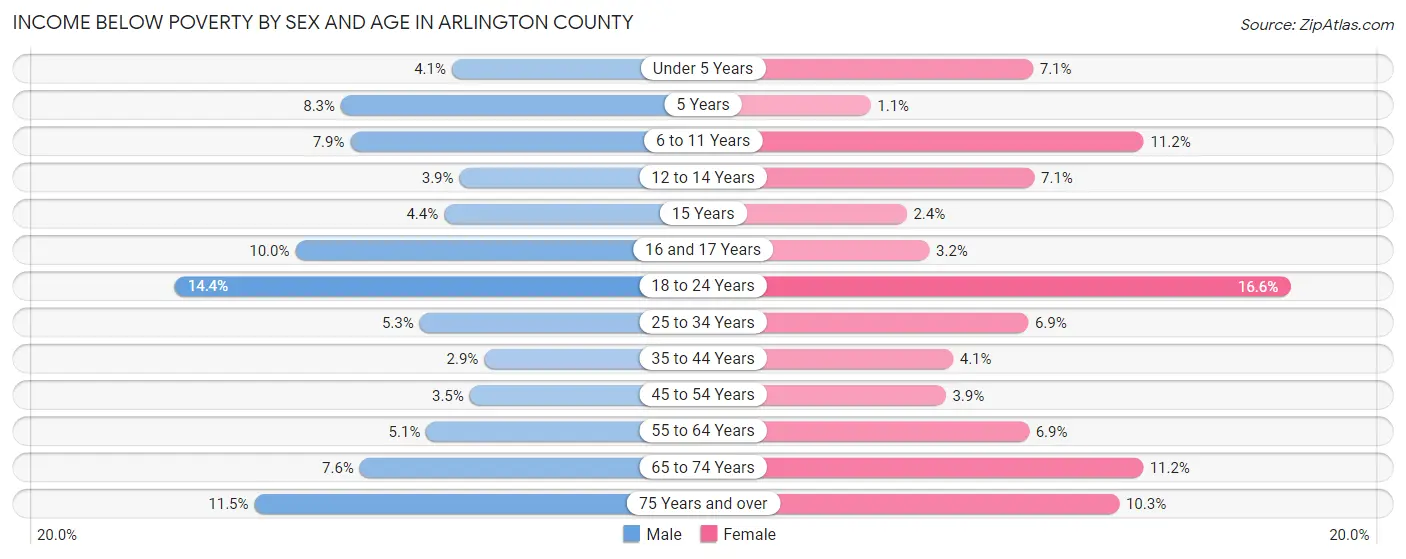
| Age Bracket | Male | Female |
| Under 5 Years | 267 (4.1%) | 448 (7.1%) |
| 5 Years | 94 (8.3%) | 10 (1.1%) |
| 6 to 11 Years | 585 (7.9%) | 757 (11.2%) |
| 12 to 14 Years | 137 (3.9%) | 248 (7.1%) |
| 15 Years | 41 (4.4%) | 25 (2.4%) |
| 16 and 17 Years | 232 (10.0%) | 67 (3.2%) |
| 18 to 24 Years | 1,295 (14.4%) | 1,584 (16.6%) |
| 25 to 34 Years | 1,455 (5.3%) | 1,836 (6.9%) |
| 35 to 44 Years | 578 (2.9%) | 788 (4.1%) |
| 45 to 54 Years | 542 (3.5%) | 558 (3.8%) |
| 55 to 64 Years | 611 (5.1%) | 785 (6.9%) |
| 65 to 74 Years | 576 (7.6%) | 915 (11.2%) |
| 75 Years and over | 493 (11.5%) | 600 (10.3%) |
| Total | 6,906 (5.9%) | 8,621 (7.4%) |
Income Above Poverty by Sex and Age in Arlington County
According to the poverty statistics in Arlington County, males aged 35 to 44 years and females aged 5 years are the age groups that are most secure financially, with 97.1% of males and 98.9% of females in these age groups living above the poverty line.
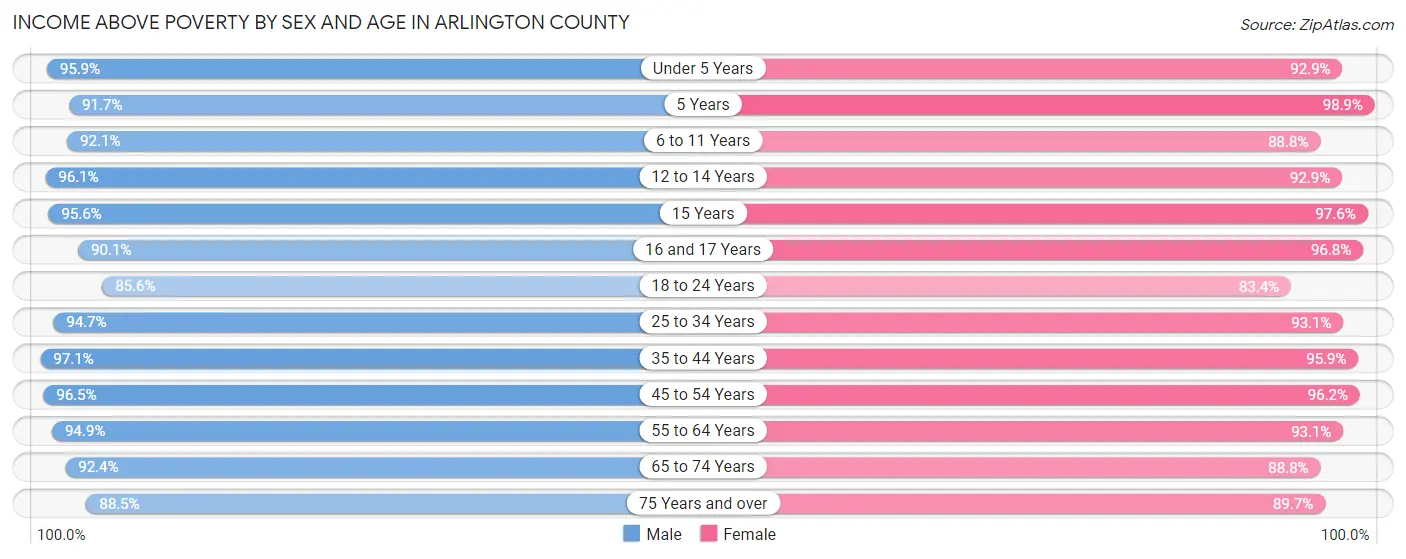
| Age Bracket | Male | Female |
| Under 5 Years | 6,189 (95.9%) | 5,868 (92.9%) |
| 5 Years | 1,044 (91.7%) | 932 (98.9%) |
| 6 to 11 Years | 6,808 (92.1%) | 6,001 (88.8%) |
| 12 to 14 Years | 3,415 (96.1%) | 3,226 (92.9%) |
| 15 Years | 884 (95.6%) | 1,016 (97.6%) |
| 16 and 17 Years | 2,100 (90.0%) | 2,001 (96.8%) |
| 18 to 24 Years | 7,684 (85.6%) | 7,933 (83.4%) |
| 25 to 34 Years | 25,810 (94.7%) | 24,749 (93.1%) |
| 35 to 44 Years | 19,055 (97.1%) | 18,342 (95.9%) |
| 45 to 54 Years | 15,011 (96.5%) | 13,941 (96.2%) |
| 55 to 64 Years | 11,398 (94.9%) | 10,530 (93.1%) |
| 65 to 74 Years | 7,039 (92.4%) | 7,278 (88.8%) |
| 75 Years and over | 3,805 (88.5%) | 5,232 (89.7%) |
| Total | 110,242 (94.1%) | 107,049 (92.5%) |
Income Below Poverty Among Married-Couple Families in Arlington County
The poverty statistics for married-couple families in Arlington County show that 3.1% or 1,263 of the total 40,626 families live below the poverty line. Families with 5 or more children have the highest poverty rate of 37.0%, comprising of 27 families. On the other hand, families with 1 or 2 children have the lowest poverty rate of 2.2%, which includes 338 families.
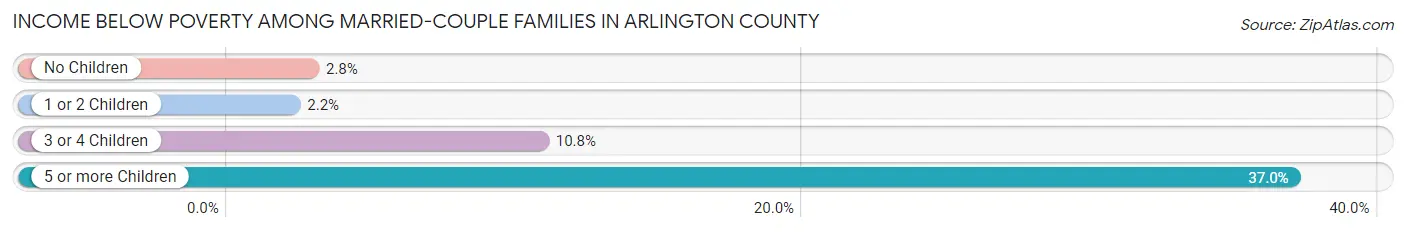
| Children | Above Poverty | Below Poverty |
| No Children | 21,878 (97.2%) | 634 (2.8%) |
| 1 or 2 Children | 15,264 (97.8%) | 338 (2.2%) |
| 3 or 4 Children | 2,175 (89.2%) | 264 (10.8%) |
| 5 or more Children | 46 (63.0%) | 27 (37.0%) |
| Total | 39,363 (96.9%) | 1,263 (3.1%) |
Income Below Poverty Among Single-Parent Households in Arlington County
According to the poverty data in Arlington County, 7.0% or 244 single-father households and 11.3% or 673 single-mother households are living below the poverty line. Among single-father households, those with 1 or 2 children have the highest poverty rate, with 197 households (17.0%) experiencing poverty. Likewise, among single-mother households, those with 3 or 4 children have the highest poverty rate, with 58 households (19.0%) falling below the poverty line.
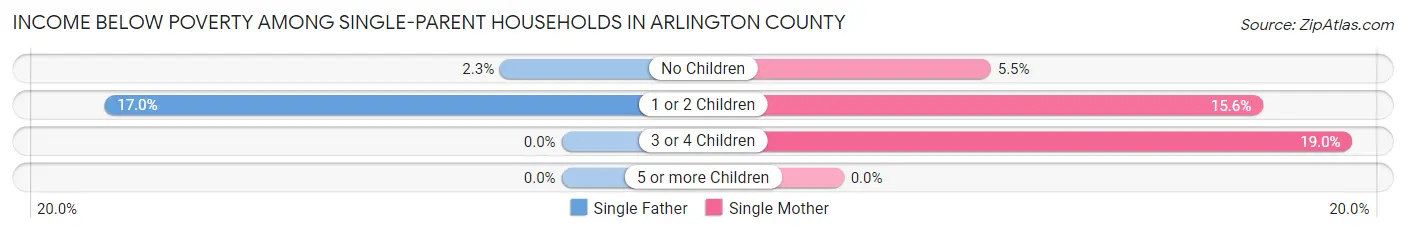
| Children | Single Father | Single Mother |
| No Children | 47 (2.3%) | 143 (5.5%) |
| 1 or 2 Children | 197 (17.0%) | 472 (15.6%) |
| 3 or 4 Children | 0 (0.0%) | 58 (19.0%) |
| 5 or more Children | 0 (0.0%) | 0 (0.0%) |
| Total | 244 (7.0%) | 673 (11.3%) |
Income Below Poverty Among Married-Couple vs Single-Parent Households in Arlington County
The poverty data for Arlington County shows that 1,263 of the married-couple family households (3.1%) and 917 of the single-parent households (9.8%) are living below the poverty level. Within the married-couple family households, those with 5 or more children have the highest poverty rate, with 27 households (37.0%) falling below the poverty line. Among the single-parent households, those with 1 or 2 children have the highest poverty rate, with 669 household (16.0%) living below poverty.
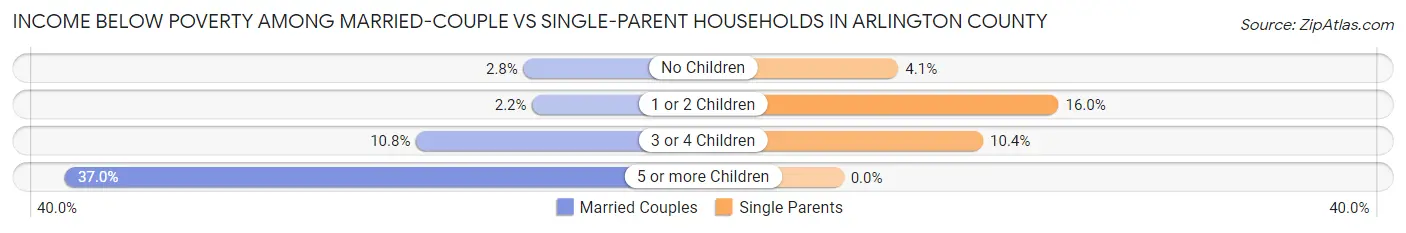
| Children | Married-Couple Families | Single-Parent Households |
| No Children | 634 (2.8%) | 190 (4.1%) |
| 1 or 2 Children | 338 (2.2%) | 669 (16.0%) |
| 3 or 4 Children | 264 (10.8%) | 58 (10.4%) |
| 5 or more Children | 27 (37.0%) | 0 (0.0%) |
| Total | 1,263 (3.1%) | 917 (9.8%) |
Race in Arlington County
The most populous races in Arlington County are White / Caucasian (153,250 | 65.0%), Hispanic or Latino (36,734 | 15.6%), and Asian (24,308 | 10.3%).
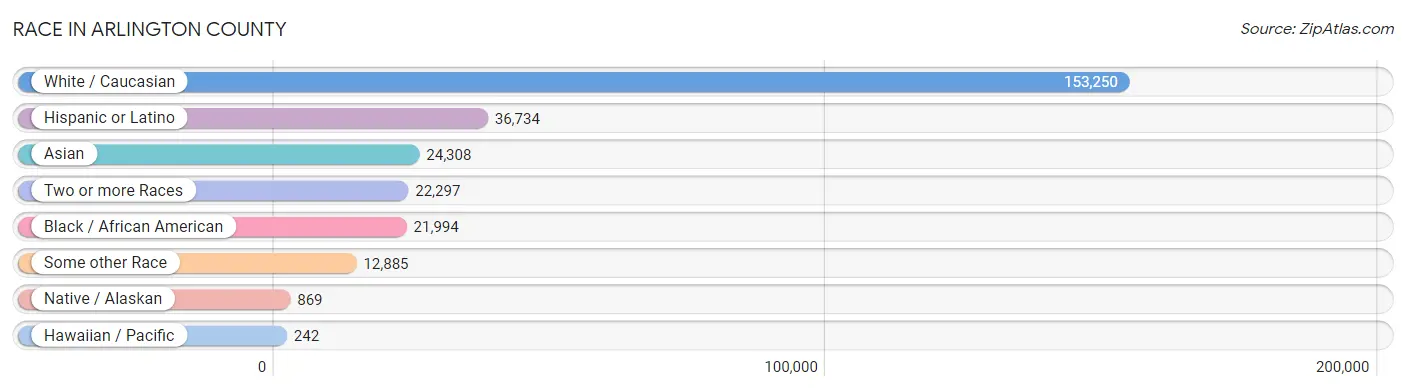
| Race | # Population | % Population |
| Asian | 24,308 | 10.3% |
| Black / African American | 21,994 | 9.3% |
| Hawaiian / Pacific | 242 | 0.1% |
| Hispanic or Latino | 36,734 | 15.6% |
| Native / Alaskan | 869 | 0.4% |
| White / Caucasian | 153,250 | 65.0% |
| Two or more Races | 22,297 | 9.5% |
| Some other Race | 12,885 | 5.5% |
| Total | 235,845 | 100.0% |
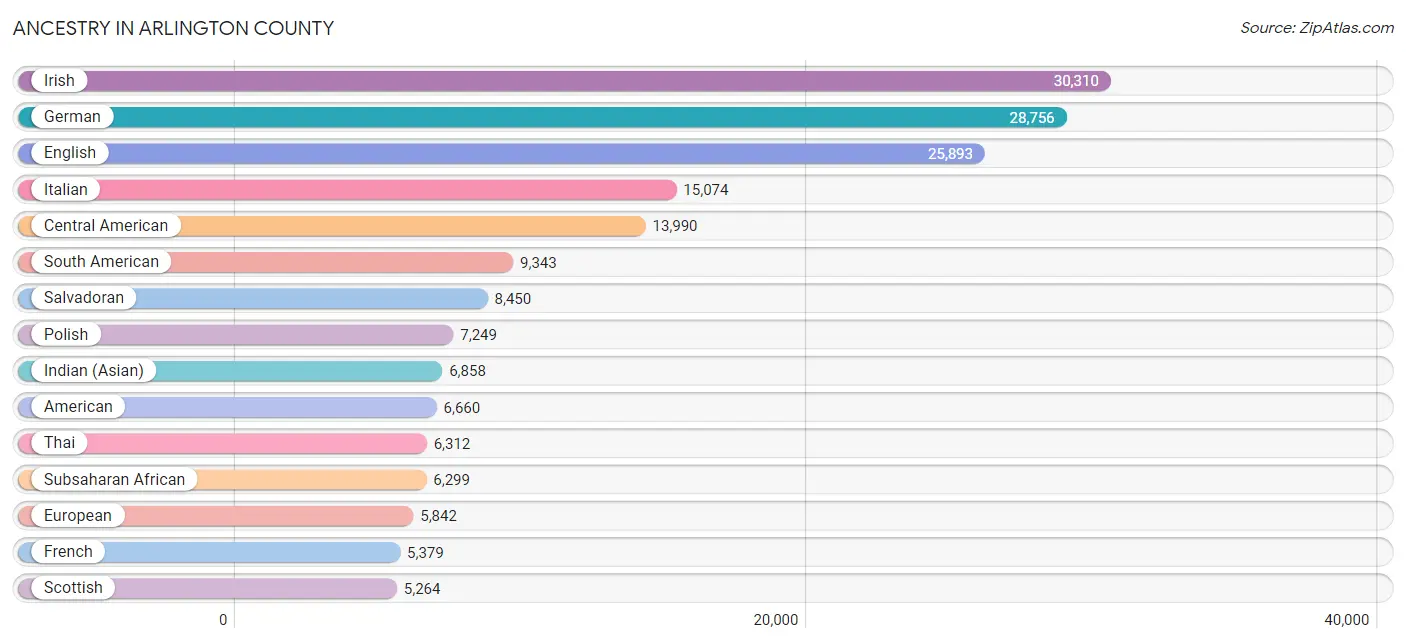
Ancestry in Arlington County
The most populous ancestries reported in Arlington County are Irish (30,310 | 12.9%), German (28,756 | 12.2%), English (25,893 | 11.0%), Italian (15,074 | 6.4%), and Central American (13,990 | 5.9%), together accounting for 48.3% of all Arlington County residents.
| Ancestry | # Population | % Population |
| Afghan | 264 | 0.1% |
| African | 1,337 | 0.6% |
| Albanian | 129 | 0.1% |
| Alsatian | 28 | 0.0% |
| American | 6,660 | 2.8% |
| Apache | 28 | 0.0% |
| Arab | 4,903 | 2.1% |
| Argentinean | 552 | 0.2% |
| Armenian | 394 | 0.2% |
| Assyrian / Chaldean / Syriac | 86 | 0.0% |
| Australian | 433 | 0.2% |
| Austrian | 921 | 0.4% |
| Bahamian | 41 | 0.0% |
| Bangladeshi | 51 | 0.0% |
| Barbadian | 45 | 0.0% |
| Basque | 41 | 0.0% |
| Belgian | 312 | 0.1% |
| Belizean | 70 | 0.0% |
| Bermudan | 11 | 0.0% |
| Bhutanese | 1,902 | 0.8% |
| Blackfeet | 27 | 0.0% |
| Bolivian | 3,460 | 1.5% |
| Brazilian | 604 | 0.3% |
| British | 3,344 | 1.4% |
| British West Indian | 27 | 0.0% |
| Bulgarian | 336 | 0.1% |
| Burmese | 3,411 | 1.5% |
| Cajun | 63 | 0.0% |
| Cambodian | 1,402 | 0.6% |
| Canadian | 501 | 0.2% |
| Cape Verdean | 46 | 0.0% |
| Carpatho Rusyn | 24 | 0.0% |
| Celtic | 30 | 0.0% |
| Central American | 13,990 | 5.9% |
| Central American Indian | 372 | 0.2% |
| Cherokee | 442 | 0.2% |
| Chilean | 277 | 0.1% |
| Chippewa | 32 | 0.0% |
| Choctaw | 22 | 0.0% |
| Colombian | 2,222 | 0.9% |
| Comanche | 10 | 0.0% |
| Costa Rican | 321 | 0.1% |
| Creek | 37 | 0.0% |
| Croatian | 275 | 0.1% |
| Crow | 19 | 0.0% |
| Cuban | 1,137 | 0.5% |
| Cypriot | 28 | 0.0% |
| Czech | 966 | 0.4% |
| Czechoslovakian | 94 | 0.0% |
| Danish | 1,088 | 0.5% |
| Delaware | 33 | 0.0% |
| Dominican | 483 | 0.2% |
| Dutch | 2,421 | 1.0% |
| Eastern European | 2,187 | 0.9% |
| Ecuadorian | 542 | 0.2% |
| Egyptian | 482 | 0.2% |
| English | 25,893 | 11.0% |
| Estonian | 46 | 0.0% |
| Ethiopian | 3,210 | 1.4% |
| European | 5,842 | 2.5% |
| Filipino | 251 | 0.1% |
| Finnish | 456 | 0.2% |
| French | 5,379 | 2.3% |
| French American Indian | 2 | 0.0% |
| French Canadian | 1,297 | 0.5% |
| German | 28,756 | 12.2% |
| German Russian | 29 | 0.0% |
| Ghanaian | 149 | 0.1% |
| Greek | 2,134 | 0.9% |
| Guamanian / Chamorro | 84 | 0.0% |
| Guatemalan | 3,265 | 1.4% |
| Guyanese | 73 | 0.0% |
| Haitian | 106 | 0.0% |
| Honduran | 628 | 0.3% |
| Hopi | 56 | 0.0% |
| Hungarian | 1,493 | 0.6% |
| Icelander | 44 | 0.0% |
| Indian (Asian) | 6,858 | 2.9% |
| Indonesian | 237 | 0.1% |
| Iranian | 1,332 | 0.6% |
| Iraqi | 225 | 0.1% |
| Irish | 30,310 | 12.9% |
| Iroquois | 60 | 0.0% |
| Israeli | 177 | 0.1% |
| Italian | 15,074 | 6.4% |
| Jamaican | 784 | 0.3% |
| Japanese | 202 | 0.1% |
| Jordanian | 381 | 0.2% |
| Kenyan | 122 | 0.1% |
| Korean | 3,295 | 1.4% |
| Laotian | 491 | 0.2% |
| Latvian | 227 | 0.1% |
| Lebanese | 927 | 0.4% |
| Lithuanian | 737 | 0.3% |
| Lumbee | 87 | 0.0% |
| Luxembourger | 38 | 0.0% |
| Macedonian | 39 | 0.0% |
| Malaysian | 39 | 0.0% |
| Mexican | 5,208 | 2.2% |
| Mexican American Indian | 140 | 0.1% |
| Mongolian | 58 | 0.0% |
| Moroccan | 973 | 0.4% |
| Native Hawaiian | 147 | 0.1% |
| Navajo | 27 | 0.0% |
| Nepalese | 110 | 0.1% |
| New Zealander | 37 | 0.0% |
| Nicaraguan | 679 | 0.3% |
| Nigerian | 352 | 0.2% |
| Northern European | 764 | 0.3% |
| Norwegian | 2,231 | 0.9% |
| Osage | 46 | 0.0% |
| Pakistani | 602 | 0.3% |
| Palestinian | 320 | 0.1% |
| Panamanian | 647 | 0.3% |
| Paraguayan | 141 | 0.1% |
| Pennsylvania German | 112 | 0.1% |
| Peruvian | 1,659 | 0.7% |
| Polish | 7,249 | 3.1% |
| Portuguese | 723 | 0.3% |
| Pueblo | 38 | 0.0% |
| Puerto Rican | 3,656 | 1.5% |
| Romanian | 678 | 0.3% |
| Russian | 3,999 | 1.7% |
| Salvadoran | 8,450 | 3.6% |
| Samoan | 53 | 0.0% |
| Scandinavian | 653 | 0.3% |
| Scotch-Irish | 2,200 | 0.9% |
| Scottish | 5,264 | 2.2% |
| Senegalese | 26 | 0.0% |
| Serbian | 451 | 0.2% |
| Sierra Leonean | 41 | 0.0% |
| Sioux | 12 | 0.0% |
| Slavic | 133 | 0.1% |
| Slovak | 813 | 0.3% |
| Slovene | 302 | 0.1% |
| Somali | 125 | 0.1% |
| South African | 151 | 0.1% |
| South American | 9,343 | 4.0% |
| South American Indian | 182 | 0.1% |
| Spaniard | 1,367 | 0.6% |
| Spanish | 531 | 0.2% |
| Spanish American | 57 | 0.0% |
| Sri Lankan | 2,072 | 0.9% |
| Subsaharan African | 6,299 | 2.7% |
| Sudanese | 734 | 0.3% |
| Swedish | 3,055 | 1.3% |
| Swiss | 924 | 0.4% |
| Syrian | 332 | 0.1% |
| Thai | 6,312 | 2.7% |
| Tlingit-Haida | 27 | 0.0% |
| Tongan | 25 | 0.0% |
| Trinidadian and Tobagonian | 111 | 0.1% |
| Turkish | 951 | 0.4% |
| Ugandan | 2 | 0.0% |
| Ukrainian | 1,932 | 0.8% |
| Uruguayan | 137 | 0.1% |
| Venezuelan | 334 | 0.1% |
| Vietnamese | 697 | 0.3% |
| Welsh | 1,845 | 0.8% |
| West Indian | 46 | 0.0% |
| Yaqui | 12 | 0.0% |
| Yugoslavian | 276 | 0.1% | View All 162 Rows |
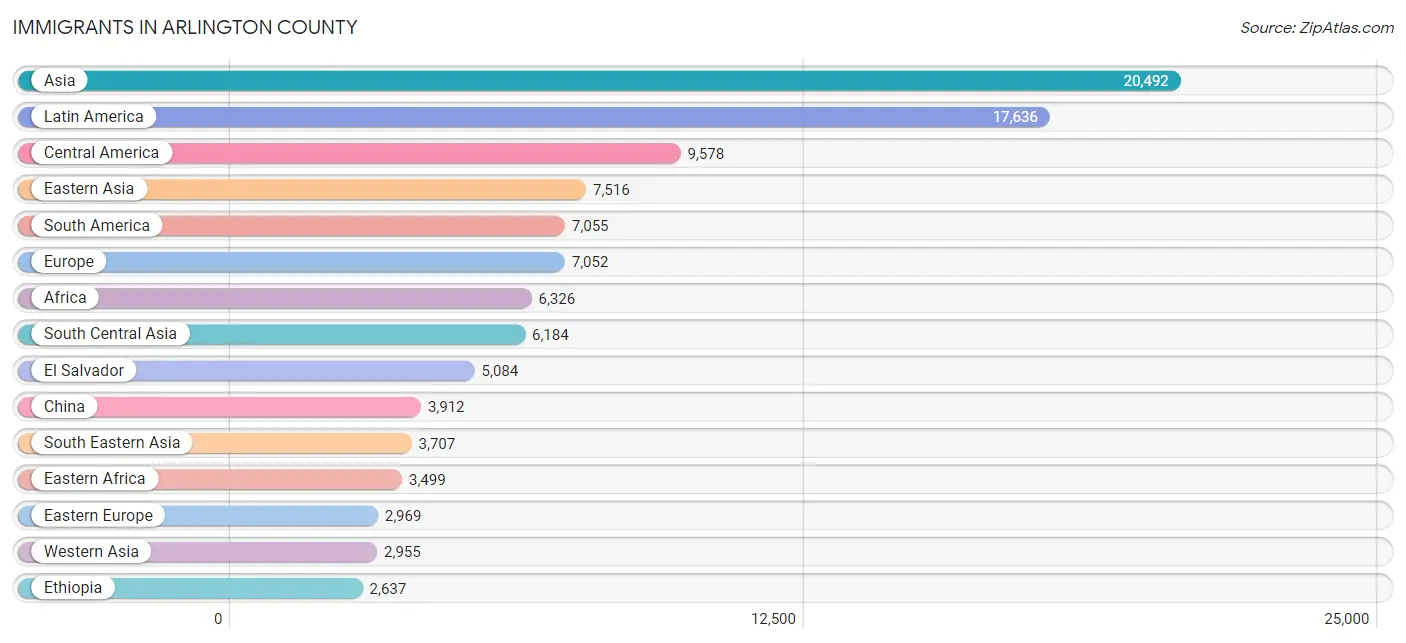
Immigrants in Arlington County
The most numerous immigrant groups reported in Arlington County came from Asia (20,492 | 8.7%), Latin America (17,636 | 7.5%), Central America (9,578 | 4.1%), Eastern Asia (7,516 | 3.2%), and South America (7,055 | 3.0%), together accounting for 26.4% of all Arlington County residents.
| Immigration Origin | # Population | % Population |
| Afghanistan | 195 | 0.1% |
| Africa | 6,326 | 2.7% |
| Albania | 153 | 0.1% |
| Argentina | 375 | 0.2% |
| Armenia | 53 | 0.0% |
| Asia | 20,492 | 8.7% |
| Australia | 223 | 0.1% |
| Austria | 247 | 0.1% |
| Bahamas | 27 | 0.0% |
| Bangladesh | 932 | 0.4% |
| Belarus | 90 | 0.0% |
| Belgium | 29 | 0.0% |
| Belize | 70 | 0.0% |
| Bolivia | 2,543 | 1.1% |
| Bosnia and Herzegovina | 253 | 0.1% |
| Brazil | 678 | 0.3% |
| Bulgaria | 243 | 0.1% |
| Cambodia | 120 | 0.1% |
| Cameroon | 17 | 0.0% |
| Canada | 643 | 0.3% |
| Caribbean | 1,003 | 0.4% |
| Central America | 9,578 | 4.1% |
| Chile | 79 | 0.0% |
| China | 3,912 | 1.7% |
| Colombia | 1,580 | 0.7% |
| Costa Rica | 289 | 0.1% |
| Croatia | 47 | 0.0% |
| Cuba | 269 | 0.1% |
| Czechoslovakia | 54 | 0.0% |
| Denmark | 35 | 0.0% |
| Dominican Republic | 251 | 0.1% |
| Eastern Africa | 3,499 | 1.5% |
| Eastern Asia | 7,516 | 3.2% |
| Eastern Europe | 2,969 | 1.3% |
| Ecuador | 328 | 0.1% |
| Egypt | 289 | 0.1% |
| El Salvador | 5,084 | 2.2% |
| England | 292 | 0.1% |
| Eritrea | 312 | 0.1% |
| Ethiopia | 2,637 | 1.1% |
| Europe | 7,052 | 3.0% |
| Fiji | 10 | 0.0% |
| France | 595 | 0.3% |
| Germany | 421 | 0.2% |
| Ghana | 164 | 0.1% |
| Greece | 421 | 0.2% |
| Guatemala | 1,923 | 0.8% |
| Guyana | 53 | 0.0% |
| Haiti | 64 | 0.0% |
| Honduras | 412 | 0.2% |
| Hong Kong | 190 | 0.1% |
| Hungary | 64 | 0.0% |
| India | 2,585 | 1.1% |
| Indonesia | 514 | 0.2% |
| Iran | 898 | 0.4% |
| Iraq | 130 | 0.1% |
| Ireland | 171 | 0.1% |
| Israel | 271 | 0.1% |
| Italy | 346 | 0.2% |
| Jamaica | 337 | 0.1% |
| Japan | 821 | 0.4% |
| Jordan | 313 | 0.1% |
| Kenya | 143 | 0.1% |
| Korea | 1,695 | 0.7% |
| Kuwait | 30 | 0.0% |
| Latin America | 17,636 | 7.5% |
| Lebanon | 283 | 0.1% |
| Lithuania | 36 | 0.0% |
| Malaysia | 46 | 0.0% |
| Mexico | 1,218 | 0.5% |
| Middle Africa | 178 | 0.1% |
| Moldova | 62 | 0.0% |
| Morocco | 855 | 0.4% |
| Nepal | 677 | 0.3% |
| Netherlands | 113 | 0.1% |
| Nicaragua | 389 | 0.2% |
| Nigeria | 371 | 0.2% |
| North Macedonia | 12 | 0.0% |
| Northern Africa | 1,552 | 0.7% |
| Northern Europe | 1,520 | 0.6% |
| Norway | 54 | 0.0% |
| Oceania | 345 | 0.2% |
| Pakistan | 498 | 0.2% |
| Panama | 193 | 0.1% |
| Peru | 1,010 | 0.4% |
| Philippines | 1,281 | 0.5% |
| Poland | 178 | 0.1% |
| Portugal | 105 | 0.0% |
| Romania | 255 | 0.1% |
| Russia | 800 | 0.3% |
| Saudi Arabia | 443 | 0.2% |
| Scotland | 101 | 0.0% |
| Senegal | 26 | 0.0% |
| Serbia | 259 | 0.1% |
| Sierra Leone | 22 | 0.0% |
| Singapore | 36 | 0.0% |
| Somalia | 159 | 0.1% |
| South Africa | 293 | 0.1% |
| South America | 7,055 | 3.0% |
| South Central Asia | 6,184 | 2.6% |
| South Eastern Asia | 3,707 | 1.6% |
| Southern Europe | 1,062 | 0.4% |
| Spain | 190 | 0.1% |
| Sri Lanka | 194 | 0.1% |
| Sudan | 318 | 0.1% |
| Sweden | 108 | 0.1% |
| Switzerland | 72 | 0.0% |
| Syria | 106 | 0.0% |
| Taiwan | 392 | 0.2% |
| Thailand | 361 | 0.2% |
| Trinidad and Tobago | 55 | 0.0% |
| Turkey | 894 | 0.4% |
| Uganda | 7 | 0.0% |
| Ukraine | 351 | 0.2% |
| Uruguay | 84 | 0.0% |
| Uzbekistan | 14 | 0.0% |
| Venezuela | 246 | 0.1% |
| Vietnam | 1,167 | 0.5% |
| Western Africa | 695 | 0.3% |
| Western Asia | 2,955 | 1.3% |
| Western Europe | 1,477 | 0.6% |
| Yemen | 49 | 0.0% |
| Zaire | 94 | 0.0% |
| Zimbabwe | 65 | 0.0% | View All 124 Rows |
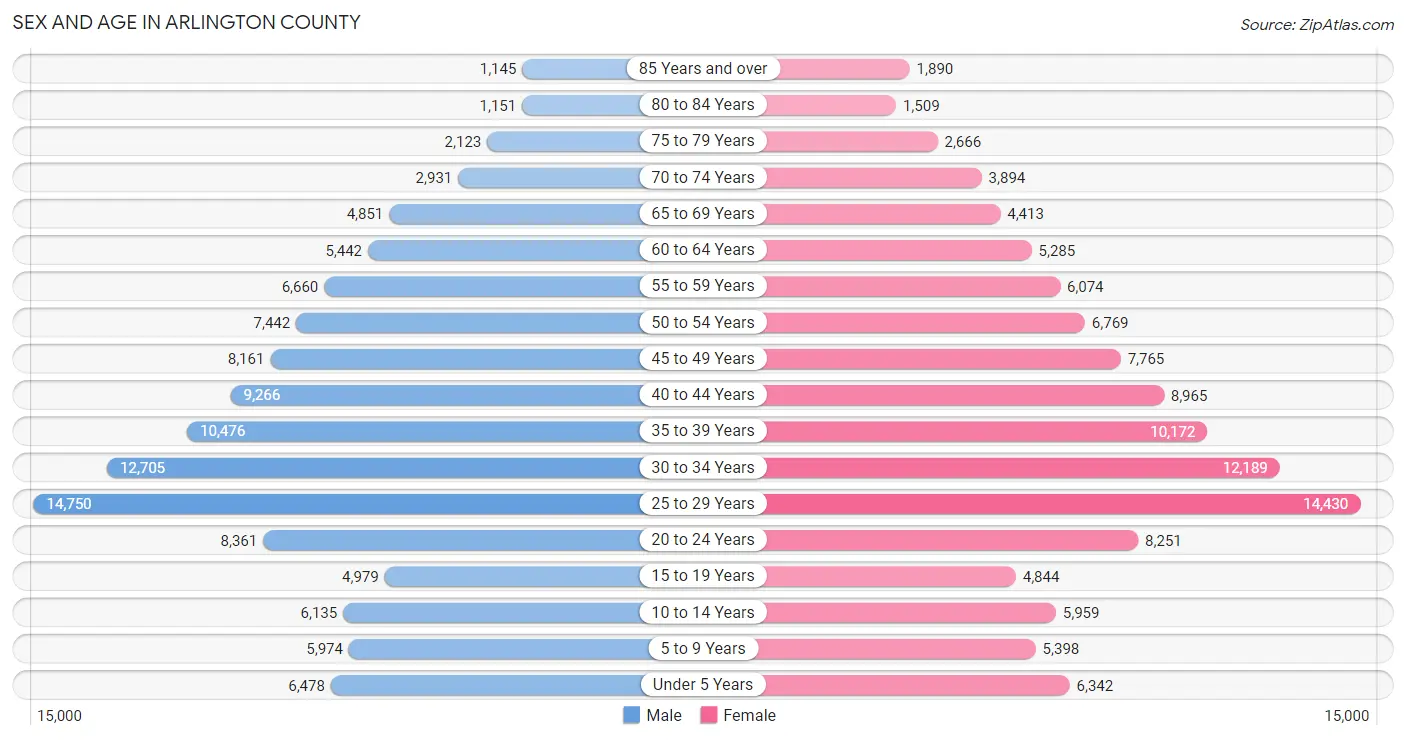
Sex and Age in Arlington County
Sex and Age in Arlington County
The most populous age groups in Arlington County are 25 to 29 Years (14,750 | 12.4%) for men and 25 to 29 Years (14,430 | 12.3%) for women.
| Age Bracket | Male | Female |
| Under 5 Years | 6,478 (5.4%) | 6,342 (5.4%) |
| 5 to 9 Years | 5,974 (5.0%) | 5,398 (4.6%) |
| 10 to 14 Years | 6,135 (5.1%) | 5,959 (5.1%) |
| 15 to 19 Years | 4,979 (4.2%) | 4,844 (4.2%) |
| 20 to 24 Years | 8,361 (7.0%) | 8,251 (7.1%) |
| 25 to 29 Years | 14,750 (12.4%) | 14,430 (12.3%) |
| 30 to 34 Years | 12,705 (10.7%) | 12,189 (10.4%) |
| 35 to 39 Years | 10,476 (8.8%) | 10,172 (8.7%) |
| 40 to 44 Years | 9,266 (7.8%) | 8,965 (7.7%) |
| 45 to 49 Years | 8,161 (6.9%) | 7,765 (6.7%) |
| 50 to 54 Years | 7,442 (6.2%) | 6,769 (5.8%) |
| 55 to 59 Years | 6,660 (5.6%) | 6,074 (5.2%) |
| 60 to 64 Years | 5,442 (4.6%) | 5,285 (4.5%) |
| 65 to 69 Years | 4,851 (4.1%) | 4,413 (3.8%) |
| 70 to 74 Years | 2,931 (2.5%) | 3,894 (3.3%) |
| 75 to 79 Years | 2,123 (1.8%) | 2,666 (2.3%) |
| 80 to 84 Years | 1,151 (1.0%) | 1,509 (1.3%) |
| 85 Years and over | 1,145 (1.0%) | 1,890 (1.6%) |
| Total | 119,030 (100.0%) | 116,815 (100.0%) |
Families and Households in Arlington County
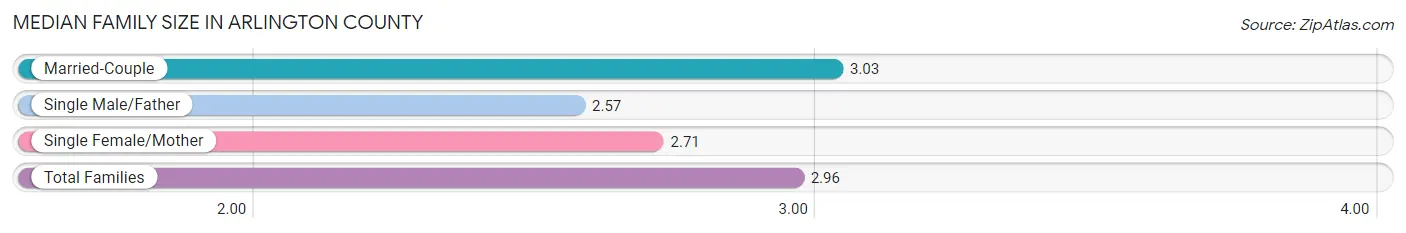
Median Family Size in Arlington County
The median family size in Arlington County is 2.96 persons per family, with married-couple families (40,626 | 81.2%) accounting for the largest median family size of 3.03 persons per family. On the other hand, single male/father families (3,460 | 6.9%) represent the smallest median family size with 2.57 persons per family.
| Family Type | # Families | Family Size |
| Married-Couple | 40,626 (81.2%) | 3.03 |
| Single Male/Father | 3,460 (6.9%) | 2.57 |
| Single Female/Mother | 5,938 (11.9%) | 2.71 |
| Total Families | 50,024 (100.0%) | 2.96 |
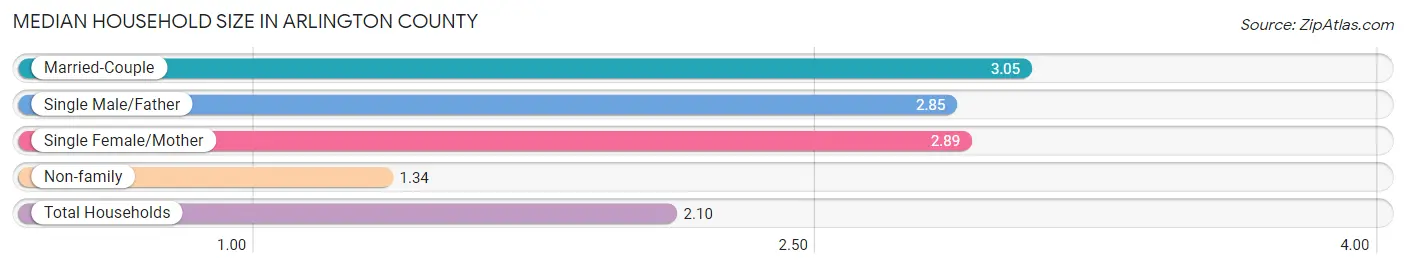
Median Household Size in Arlington County
The median household size in Arlington County is 2.10 persons per household, with married-couple households (40,626 | 36.6%) accounting for the largest median household size of 3.05 persons per household. non-family households (60,863 | 54.9%) represent the smallest median household size with 1.34 persons per household.
| Household Type | # Households | Household Size |
| Married-Couple | 40,626 (36.6%) | 3.05 |
| Single Male/Father | 3,460 (3.1%) | 2.85 |
| Single Female/Mother | 5,938 (5.4%) | 2.89 |
| Non-family | 60,863 (54.9%) | 1.34 |
| Total Households | 110,887 (100.0%) | 2.10 |
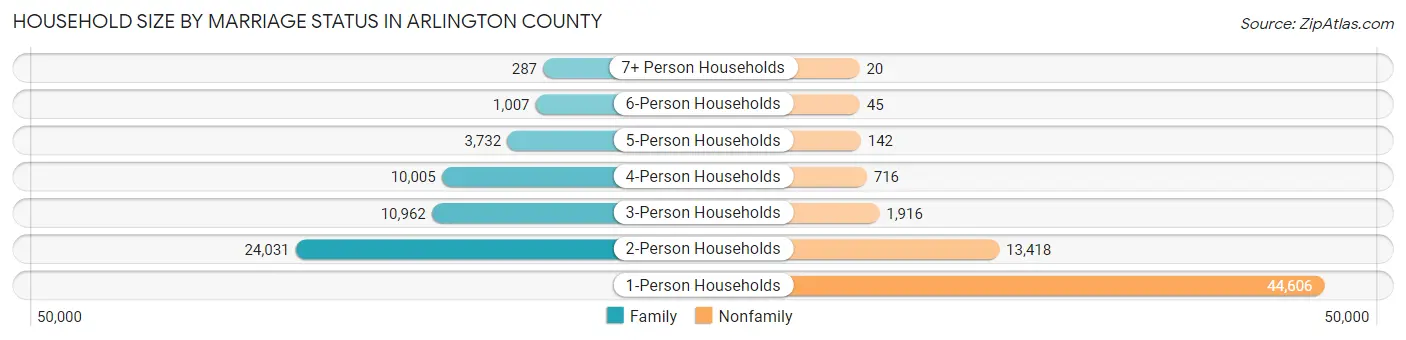
Household Size by Marriage Status in Arlington County
Out of a total of 110,887 households in Arlington County, 50,024 (45.1%) are family households, while 60,863 (54.9%) are nonfamily households. The most numerous type of family households are 2-person households, comprising 24,031, and the most common type of nonfamily households are 1-person households, comprising 44,606.
| Household Size | Family Households | Nonfamily Households |
| 1-Person Households | - | 44,606 (40.2%) |
| 2-Person Households | 24,031 (21.7%) | 13,418 (12.1%) |
| 3-Person Households | 10,962 (9.9%) | 1,916 (1.7%) |
| 4-Person Households | 10,005 (9.0%) | 716 (0.6%) |
| 5-Person Households | 3,732 (3.4%) | 142 (0.1%) |
| 6-Person Households | 1,007 (0.9%) | 45 (0.0%) |
| 7+ Person Households | 287 (0.3%) | 20 (0.0%) |
| Total | 50,024 (45.1%) | 60,863 (54.9%) |
Female Fertility in Arlington County
Fertility by Age in Arlington County
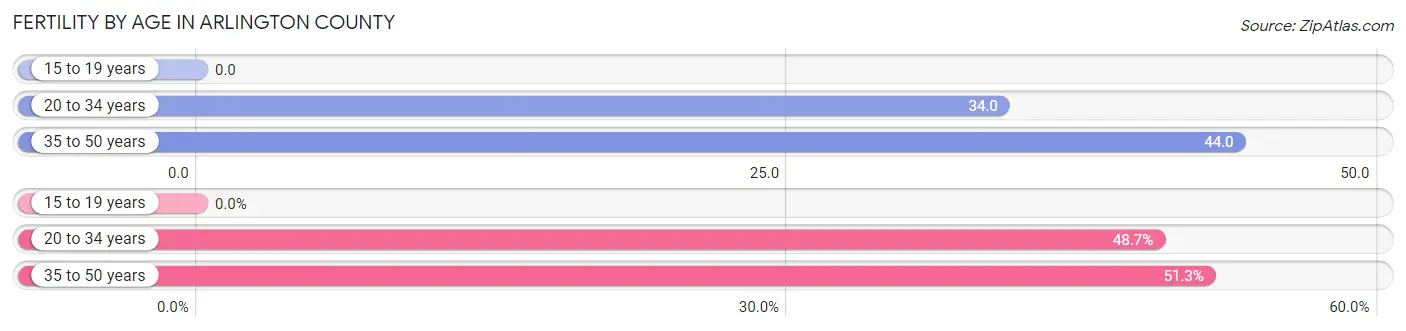
Average fertility rate in Arlington County is 36.0 births per 1,000 women. Women in the age bracket of 35 to 50 years have the highest fertility rate with 44.0 births per 1,000 women. Women in the age bracket of 35 to 50 years acount for 51.3% of all women with births.
| Age Bracket | Women with Births | Births / 1,000 Women |
| 15 to 19 years | 0 (0.0%) | 0.0 |
| 20 to 34 years | 1,186 (48.7%) | 34.0 |
| 35 to 50 years | 1,249 (51.3%) | 44.0 |
| Total | 2,435 (100.0%) | 36.0 |
Fertility by Age by Marriage Status in Arlington County
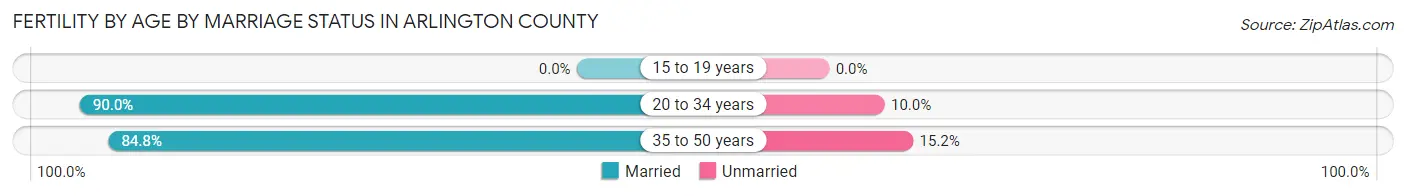
87.3% of women with births (2,435) in Arlington County are married. The highest percentage of unmarried women with births falls into 35 to 50 years age bracket with 15.2% of them unmarried at the time of birth, while the lowest percentage of unmarried women with births belong to 20 to 34 years age bracket with 10.0% of them unmarried.
| Age Bracket | Married | Unmarried |
| 15 to 19 years | 0 (0.0%) | 0 (0.0%) |
| 20 to 34 years | 1,067 (90.0%) | 119 (10.0%) |
| 35 to 50 years | 1,059 (84.8%) | 190 (15.2%) |
| Total | 2,126 (87.3%) | 309 (12.7%) |
Fertility by Education in Arlington County
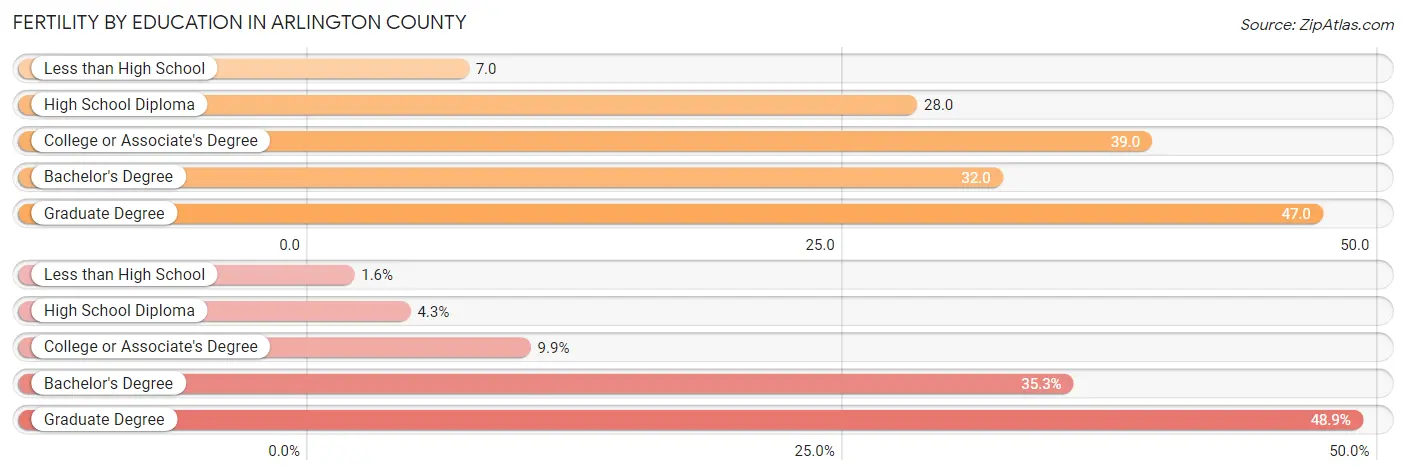
Average fertility rate in Arlington County is 36.0 births per 1,000 women. Women with the education attainment of graduate degree have the highest fertility rate of 47.0 births per 1,000 women, while women with the education attainment of less than high school have the lowest fertility at 7.0 births per 1,000 women. Women with the education attainment of graduate degree represent 48.9% of all women with births.
| Educational Attainment | Women with Births | Births / 1,000 Women |
| Less than High School | 40 (1.6%) | 7.0 |
| High School Diploma | 104 (4.3%) | 28.0 |
| College or Associate's Degree | 241 (9.9%) | 39.0 |
| Bachelor's Degree | 860 (35.3%) | 32.0 |
| Graduate Degree | 1,190 (48.9%) | 47.0 |
| Total | 2,435 (100.0%) | 36.0 |
Fertility by Education by Marriage Status in Arlington County
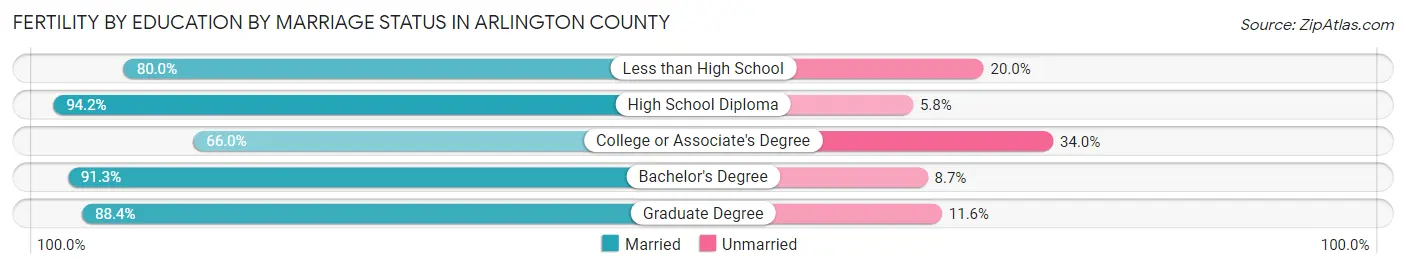
12.7% of women with births in Arlington County are unmarried. Women with the educational attainment of high school diploma are most likely to be married with 94.2% of them married at childbirth, while women with the educational attainment of college or associate's degree are least likely to be married with 34.0% of them unmarried at childbirth.
| Educational Attainment | Married | Unmarried |
| Less than High School | 32 (80.0%) | 8 (20.0%) |
| High School Diploma | 98 (94.2%) | 6 (5.8%) |
| College or Associate's Degree | 159 (66.0%) | 82 (34.0%) |
| Bachelor's Degree | 785 (91.3%) | 75 (8.7%) |
| Graduate Degree | 1,052 (88.4%) | 138 (11.6%) |
| Total | 2,126 (87.3%) | 309 (12.7%) |
Employment Characteristics in Arlington County
Employment by Class of Employer in Arlington County
Among the 148,246 employed individuals in Arlington County, private company employees (78,394 | 52.9%), federal government employees (30,701 | 20.7%), and not-for-profit organizations (19,905 | 13.4%) make up the most common classes of employment.
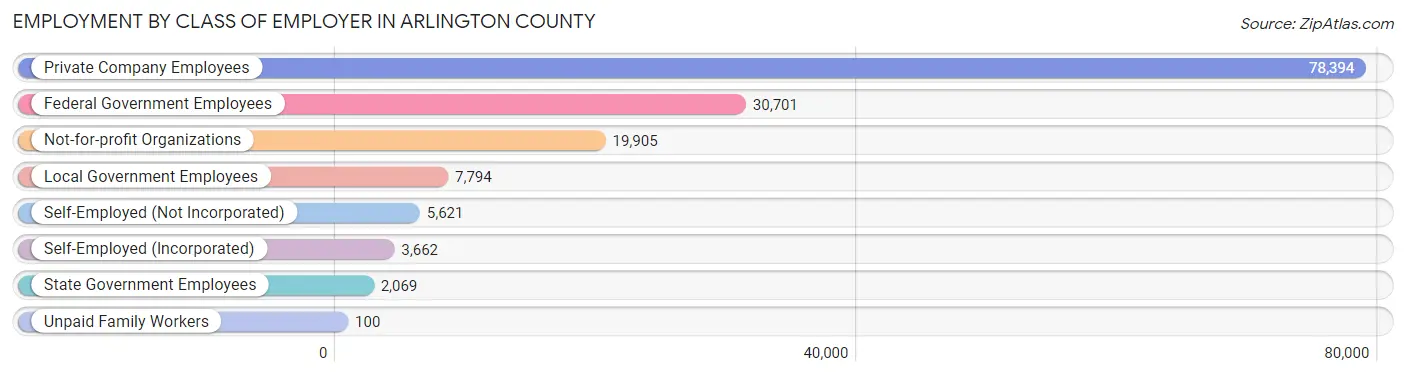
| Employer Class | # Employees | % Employees |
| Private Company Employees | 78,394 | 52.9% |
| Self-Employed (Incorporated) | 3,662 | 2.5% |
| Self-Employed (Not Incorporated) | 5,621 | 3.8% |
| Not-for-profit Organizations | 19,905 | 13.4% |
| Local Government Employees | 7,794 | 5.3% |
| State Government Employees | 2,069 | 1.4% |
| Federal Government Employees | 30,701 | 20.7% |
| Unpaid Family Workers | 100 | 0.1% |
| Total | 148,246 | 100.0% |
Employment Status by Age in Arlington County
According to the labor force statistics for Arlington County, out of the total population over 16 years of age (197,592), 78.4% or 154,912 individuals are in the labor force, with 2.8% or 4,338 of them unemployed. The age group with the highest labor force participation rate is 30 to 34 years, with 92.4% or 23,002 individuals in the labor force. Within the labor force, the 16 to 19 years age range has the highest percentage of unemployed individuals, with 13.6% or 367 of them being unemployed.
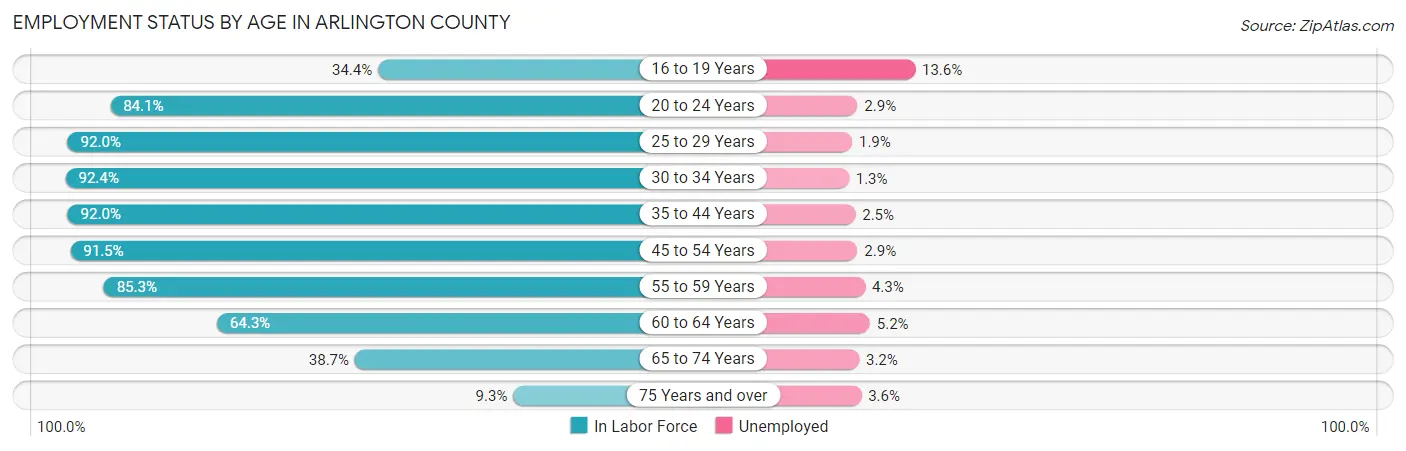
| Age Bracket | In Labor Force | Unemployed |
| 16 to 19 Years | 2,702 (34.4%) | 367 (13.6%) |
| 20 to 24 Years | 13,971 (84.1%) | 405 (2.9%) |
| 25 to 29 Years | 26,846 (92.0%) | 510 (1.9%) |
| 30 to 34 Years | 23,002 (92.4%) | 299 (1.3%) |
| 35 to 44 Years | 35,769 (92.0%) | 894 (2.5%) |
| 45 to 54 Years | 27,575 (91.5%) | 800 (2.9%) |
| 55 to 59 Years | 10,862 (85.3%) | 467 (4.3%) |
| 60 to 64 Years | 6,897 (64.3%) | 359 (5.2%) |
| 65 to 74 Years | 6,226 (38.7%) | 199 (3.2%) |
| 75 Years and over | 975 (9.3%) | 35 (3.6%) |
| Total | 154,912 (78.4%) | 4,338 (2.8%) |
Employment Status by Educational Attainment in Arlington County
According to labor force statistics for Arlington County, 89.4% of individuals (131,017) out of the total population between 25 and 64 years of age (146,551) are in the labor force, with 2.5% or 3,275 of them being unemployed. The group with the highest labor force participation rate are those with the educational attainment of bachelor's degree or higher, with 92.3% or 107,370 individuals in the labor force. Within the labor force, individuals with less than high school education have the highest percentage of unemployment, with 6.7% or 312 of them being unemployed.
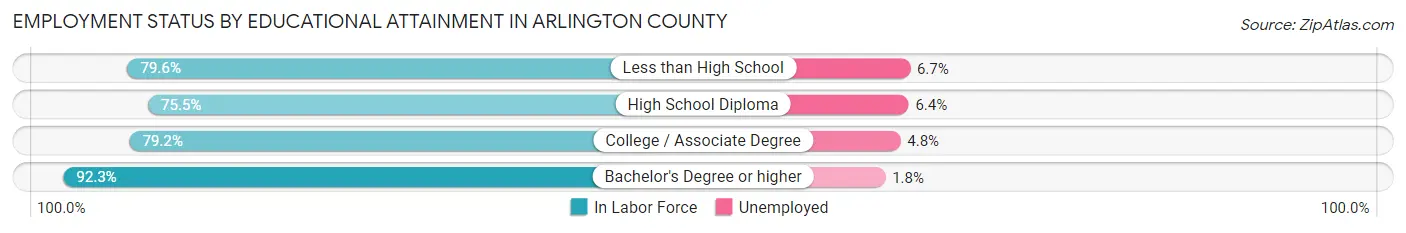
| Educational Attainment | In Labor Force | Unemployed |
| Less than High School | 4,662 (79.6%) | 392 (6.7%) |
| High School Diploma | 6,961 (75.5%) | 590 (6.4%) |
| College / Associate Degree | 11,996 (79.2%) | 727 (4.8%) |
| Bachelor's Degree or higher | 107,370 (92.3%) | 2,094 (1.8%) |
| Total | 131,017 (89.4%) | 3,664 (2.5%) |
Employment Occupations by Sex in Arlington County
Management, Business, Science and Arts Occupations
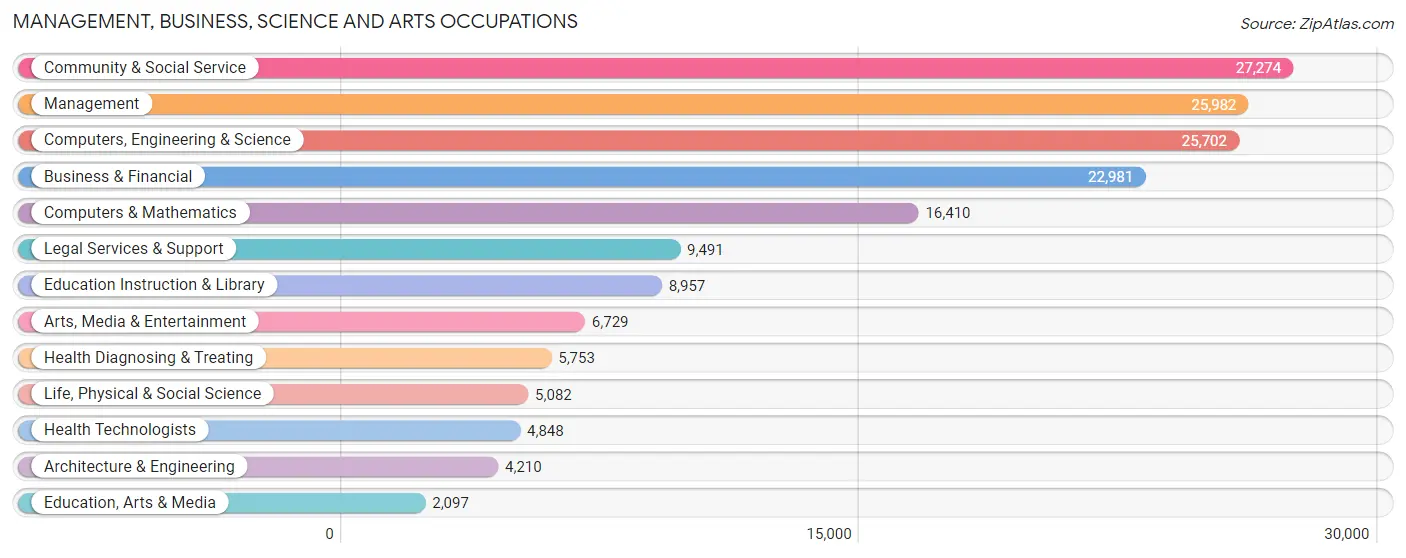
The most common Management, Business, Science and Arts occupations in Arlington County are Community & Social Service (27,274 | 18.6%), Management (25,982 | 17.7%), Computers, Engineering & Science (25,702 | 17.5%), Business & Financial (22,981 | 15.6%), and Computers & Mathematics (16,410 | 11.2%).
Management, Business, Science and Arts Occupations by Sex
Within the Management, Business, Science and Arts occupations in Arlington County, the most male-oriented occupations are Architecture & Engineering (70.3%), Computers & Mathematics (67.1%), and Computers, Engineering & Science (63.1%), while the most female-oriented occupations are Health Technologists (74.7%), Health Diagnosing & Treating (73.9%), and Education Instruction & Library (72.0%).
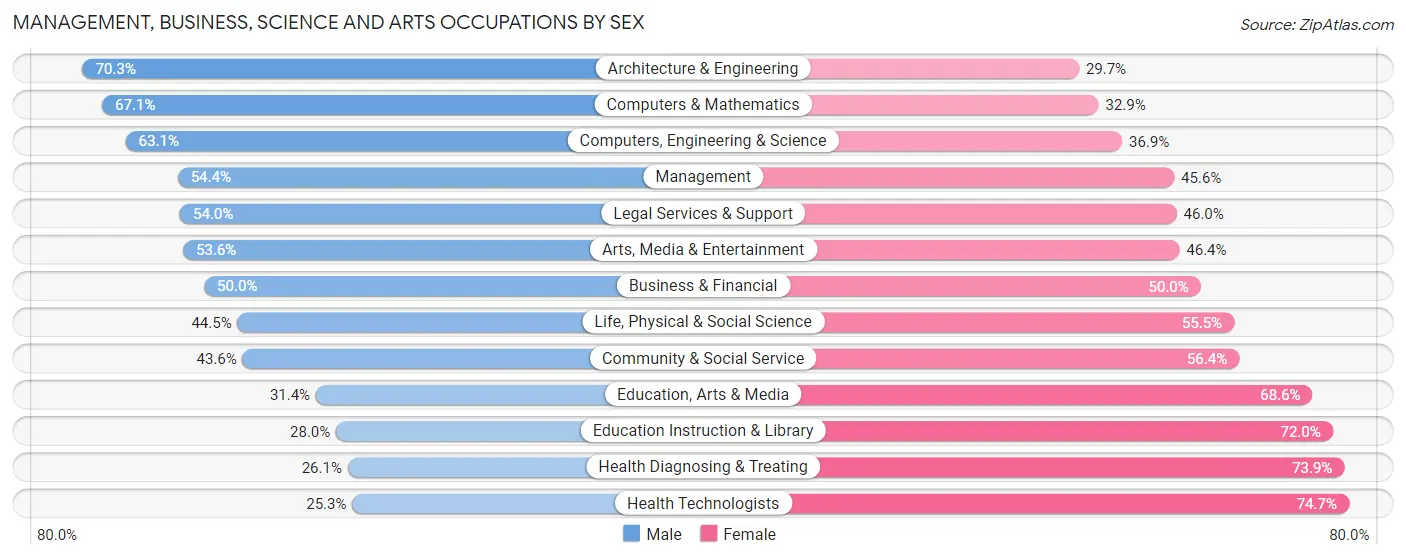
| Occupation | Male | Female |
| Management | 14,145 (54.4%) | 11,837 (45.6%) |
| Business & Financial | 11,498 (50.0%) | 11,483 (50.0%) |
| Computers, Engineering & Science | 16,225 (63.1%) | 9,477 (36.9%) |
| Computers & Mathematics | 11,004 (67.1%) | 5,406 (32.9%) |
| Architecture & Engineering | 2,961 (70.3%) | 1,249 (29.7%) |
| Life, Physical & Social Science | 2,260 (44.5%) | 2,822 (55.5%) |
| Community & Social Service | 11,901 (43.6%) | 15,373 (56.4%) |
| Education, Arts & Media | 658 (31.4%) | 1,439 (68.6%) |
| Legal Services & Support | 5,129 (54.0%) | 4,362 (46.0%) |
| Education Instruction & Library | 2,509 (28.0%) | 6,448 (72.0%) |
| Arts, Media & Entertainment | 3,605 (53.6%) | 3,124 (46.4%) |
| Health Diagnosing & Treating | 1,500 (26.1%) | 4,253 (73.9%) |
| Health Technologists | 1,227 (25.3%) | 3,621 (74.7%) |
| Total (Category) | 55,269 (51.3%) | 52,423 (48.7%) |
| Total (Overall) | 76,763 (52.2%) | 70,194 (47.8%) |
Services Occupations
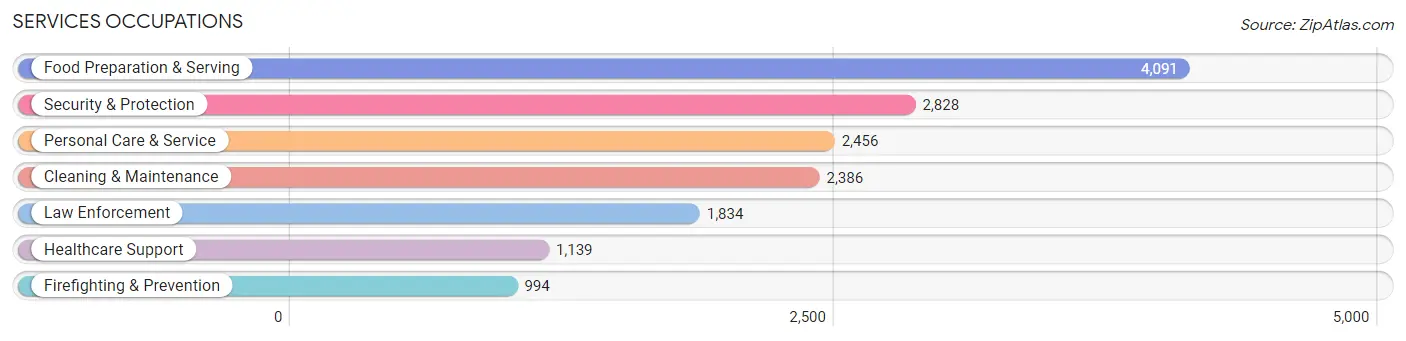
The most common Services occupations in Arlington County are Food Preparation & Serving (4,091 | 2.8%), Security & Protection (2,828 | 1.9%), Personal Care & Service (2,456 | 1.7%), Cleaning & Maintenance (2,386 | 1.6%), and Law Enforcement (1,834 | 1.3%).
Services Occupations by Sex
Within the Services occupations in Arlington County, the most male-oriented occupations are Law Enforcement (74.7%), Security & Protection (74.1%), and Firefighting & Prevention (72.8%), while the most female-oriented occupations are Healthcare Support (91.7%), Personal Care & Service (71.5%), and Cleaning & Maintenance (59.2%).
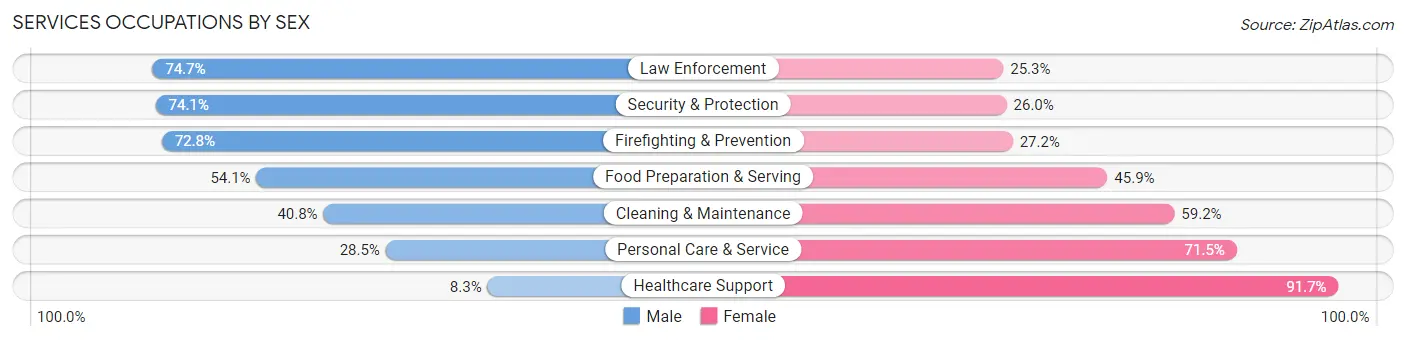
| Occupation | Male | Female |
| Healthcare Support | 95 (8.3%) | 1,044 (91.7%) |
| Security & Protection | 2,094 (74.1%) | 734 (26.0%) |
| Firefighting & Prevention | 724 (72.8%) | 270 (27.2%) |
| Law Enforcement | 1,370 (74.7%) | 464 (25.3%) |
| Food Preparation & Serving | 2,213 (54.1%) | 1,878 (45.9%) |
| Cleaning & Maintenance | 974 (40.8%) | 1,412 (59.2%) |
| Personal Care & Service | 700 (28.5%) | 1,756 (71.5%) |
| Total (Category) | 6,076 (47.1%) | 6,824 (52.9%) |
| Total (Overall) | 76,763 (52.2%) | 70,194 (47.8%) |
Sales and Office Occupations
The most common Sales and Office occupations in Arlington County are Office & Administration (9,236 | 6.3%), and Sales & Related (8,633 | 5.9%).

Sales and Office Occupations by Sex

| Occupation | Male | Female |
| Sales & Related | 5,279 (61.2%) | 3,354 (38.9%) |
| Office & Administration | 3,112 (33.7%) | 6,124 (66.3%) |
| Total (Category) | 8,391 (47.0%) | 9,478 (53.0%) |
| Total (Overall) | 76,763 (52.2%) | 70,194 (47.8%) |
Natural Resources, Construction and Maintenance Occupations
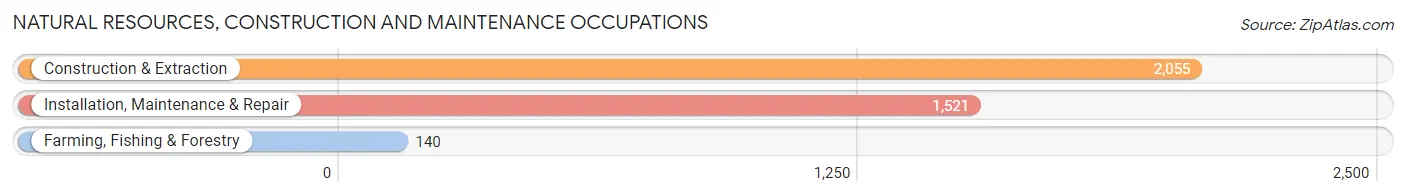
The most common Natural Resources, Construction and Maintenance occupations in Arlington County are Construction & Extraction (2,055 | 1.4%), Installation, Maintenance & Repair (1,521 | 1.0%), and Farming, Fishing & Forestry (140 | 0.1%).
Natural Resources, Construction and Maintenance Occupations by Sex
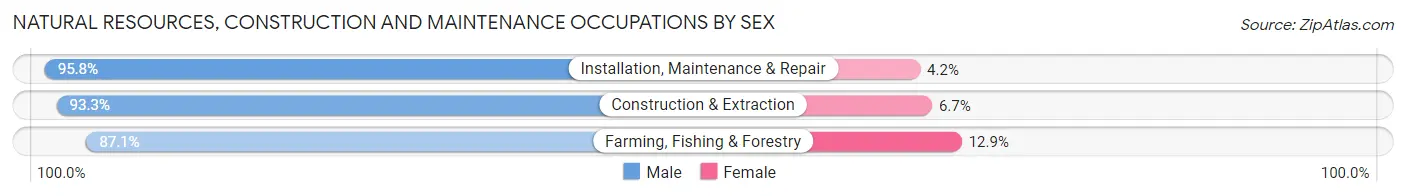
| Occupation | Male | Female |
| Farming, Fishing & Forestry | 122 (87.1%) | 18 (12.9%) |
| Construction & Extraction | 1,918 (93.3%) | 137 (6.7%) |
| Installation, Maintenance & Repair | 1,457 (95.8%) | 64 (4.2%) |
| Total (Category) | 3,497 (94.1%) | 219 (5.9%) |
| Total (Overall) | 76,763 (52.2%) | 70,194 (47.8%) |
Production, Transportation and Moving Occupations
The most common Production, Transportation and Moving occupations in Arlington County are Transportation (2,499 | 1.7%), Material Moving (1,218 | 0.8%), and Production (1,063 | 0.7%).
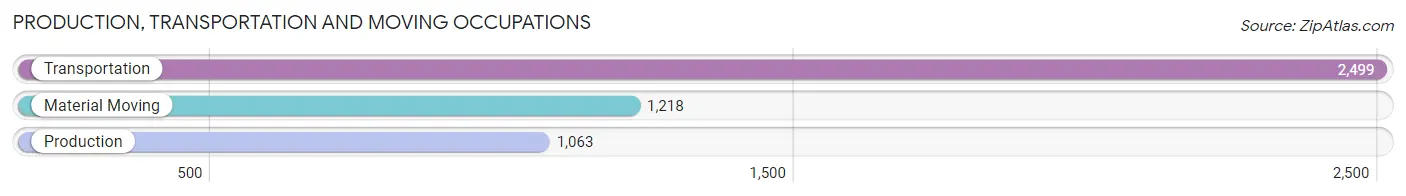
Production, Transportation and Moving Occupations by Sex
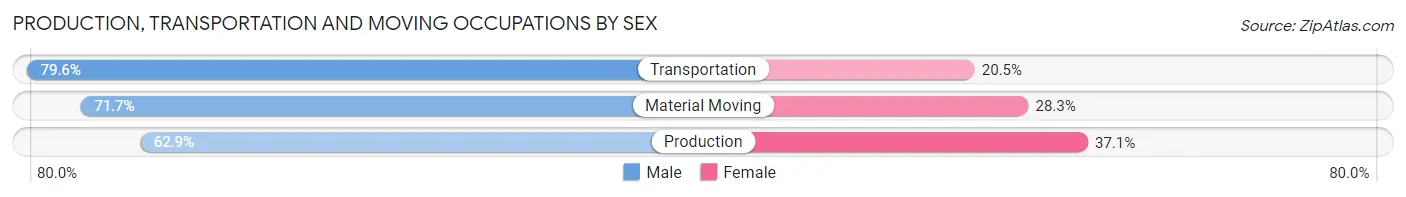
| Occupation | Male | Female |
| Production | 669 (62.9%) | 394 (37.1%) |
| Transportation | 1,988 (79.5%) | 511 (20.4%) |
| Material Moving | 873 (71.7%) | 345 (28.3%) |
| Total (Category) | 3,530 (73.9%) | 1,250 (26.2%) |
| Total (Overall) | 76,763 (52.2%) | 70,194 (47.8%) |
Employment Industries by Sex in Arlington County
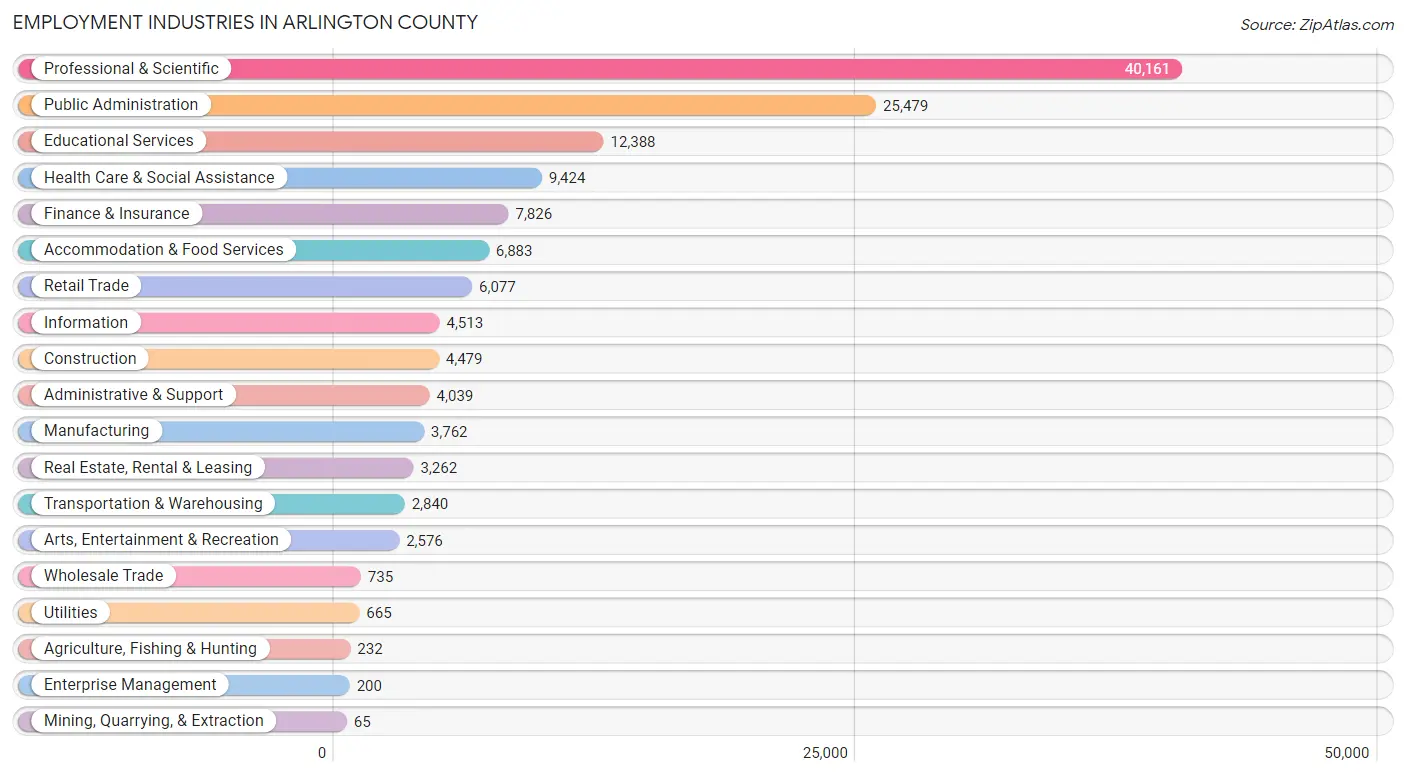
Employment Industries in Arlington County
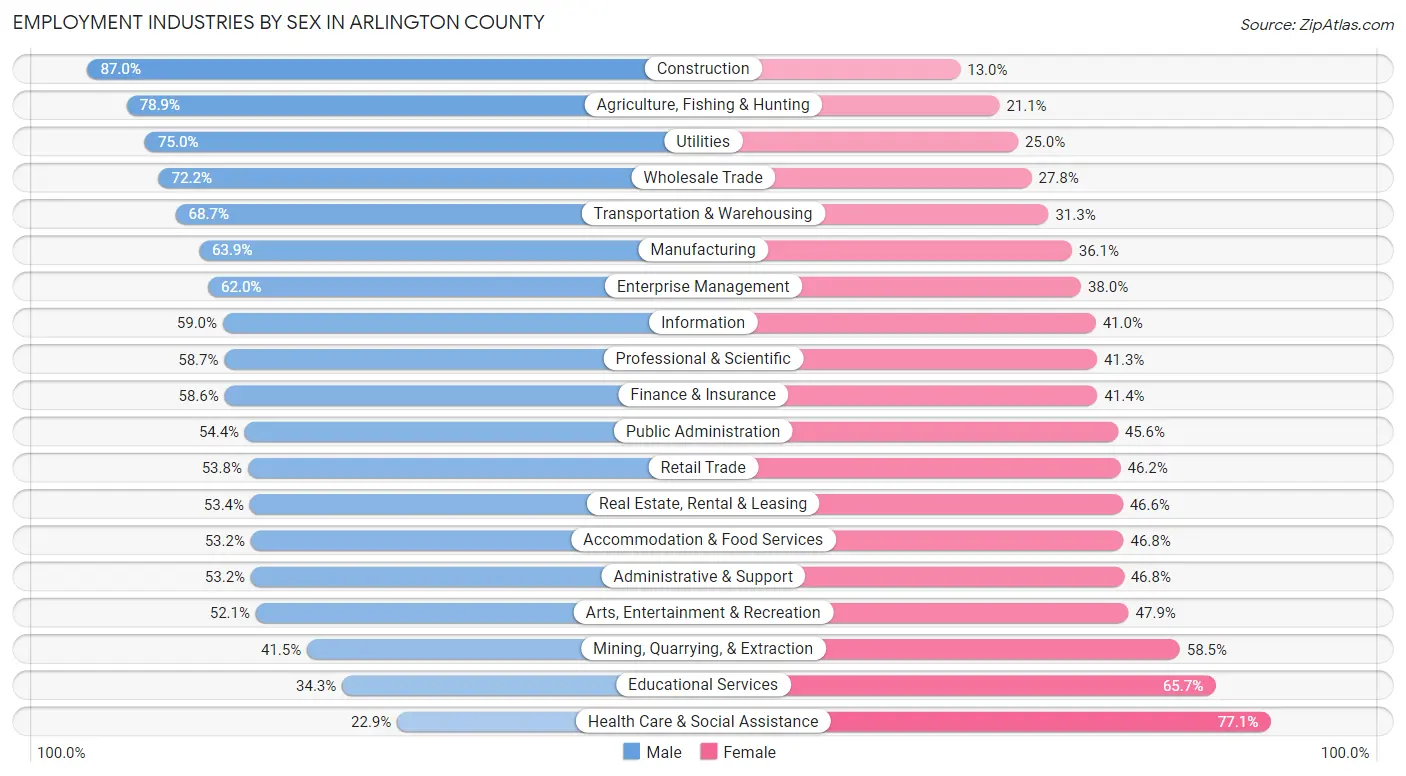
The major employment industries in Arlington County include Professional & Scientific (40,161 | 27.3%), Public Administration (25,479 | 17.3%), Educational Services (12,388 | 8.4%), Health Care & Social Assistance (9,424 | 6.4%), and Finance & Insurance (7,826 | 5.3%).
Employment Industries by Sex in Arlington County
The Arlington County industries that see more men than women are Construction (87.0%), Agriculture, Fishing & Hunting (78.9%), and Utilities (75.0%), whereas the industries that tend to have a higher number of women are Health Care & Social Assistance (77.1%), Educational Services (65.7%), and Mining, Quarrying, & Extraction (58.5%).
| Industry | Male | Female |
| Agriculture, Fishing & Hunting | 183 (78.9%) | 49 (21.1%) |
| Mining, Quarrying, & Extraction | 27 (41.5%) | 38 (58.5%) |
| Construction | 3,896 (87.0%) | 583 (13.0%) |
| Manufacturing | 2,404 (63.9%) | 1,358 (36.1%) |
| Wholesale Trade | 531 (72.2%) | 204 (27.8%) |
| Retail Trade | 3,270 (53.8%) | 2,807 (46.2%) |
| Transportation & Warehousing | 1,952 (68.7%) | 888 (31.3%) |
| Utilities | 499 (75.0%) | 166 (25.0%) |
| Information | 2,661 (59.0%) | 1,852 (41.0%) |
| Finance & Insurance | 4,587 (58.6%) | 3,239 (41.4%) |
| Real Estate, Rental & Leasing | 1,741 (53.4%) | 1,521 (46.6%) |
| Professional & Scientific | 23,559 (58.7%) | 16,602 (41.3%) |
| Enterprise Management | 124 (62.0%) | 76 (38.0%) |
| Administrative & Support | 2,147 (53.2%) | 1,892 (46.8%) |
| Educational Services | 4,247 (34.3%) | 8,141 (65.7%) |
| Health Care & Social Assistance | 2,157 (22.9%) | 7,267 (77.1%) |
| Arts, Entertainment & Recreation | 1,343 (52.1%) | 1,233 (47.9%) |
| Accommodation & Food Services | 3,661 (53.2%) | 3,222 (46.8%) |
| Public Administration | 13,857 (54.4%) | 11,622 (45.6%) |
| Total | 76,763 (52.2%) | 70,194 (47.8%) |
Education in Arlington County
School Enrollment in Arlington County
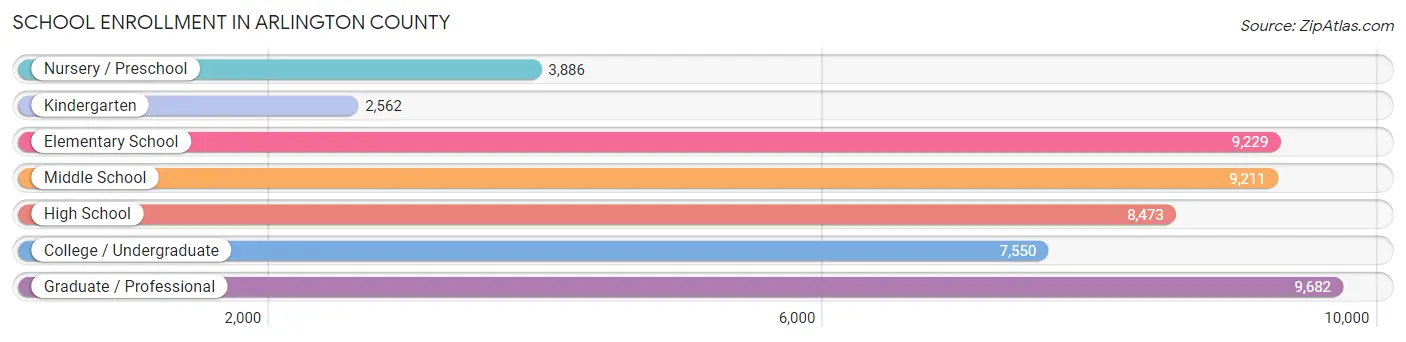
The most common levels of schooling among the 50,593 students in Arlington County are graduate / professional (9,682 | 19.1%), elementary school (9,229 | 18.2%), and middle school (9,211 | 18.2%).
| School Level | # Students | % Students |
| Nursery / Preschool | 3,886 | 7.7% |
| Kindergarten | 2,562 | 5.1% |
| Elementary School | 9,229 | 18.2% |
| Middle School | 9,211 | 18.2% |
| High School | 8,473 | 16.8% |
| College / Undergraduate | 7,550 | 14.9% |
| Graduate / Professional | 9,682 | 19.1% |
| Total | 50,593 | 100.0% |
School Enrollment by Age by Funding Source in Arlington County
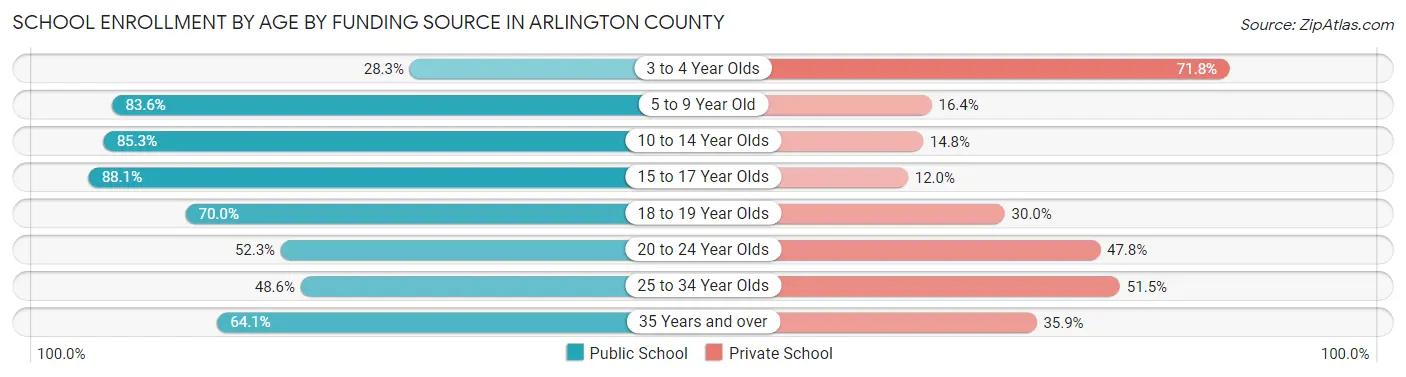
Out of a total of 50,593 students who are enrolled in schools in Arlington County, 14,723 (29.1%) attend a private institution, while the remaining 35,870 (70.9%) are enrolled in public schools. The age group of 3 to 4 year olds has the highest likelihood of being enrolled in private schools, with 2,339 (71.8% in the age bracket) enrolled. Conversely, the age group of 15 to 17 year olds has the lowest likelihood of being enrolled in a private school, with 5,423 (88.0% in the age bracket) attending a public institution.
| Age Bracket | Public School | Private School |
| 3 to 4 Year Olds | 921 (28.2%) | 2,339 (71.8%) |
| 5 to 9 Year Old | 9,278 (83.6%) | 1,816 (16.4%) |
| 10 to 14 Year Olds | 10,142 (85.3%) | 1,755 (14.7%) |
| 15 to 17 Year Olds | 5,423 (88.0%) | 736 (11.9%) |
| 18 to 19 Year Olds | 1,630 (70.0%) | 698 (30.0%) |
| 20 to 24 Year Olds | 2,586 (52.2%) | 2,363 (47.7%) |
| 25 to 34 Year Olds | 3,433 (48.5%) | 3,638 (51.4%) |
| 35 Years and over | 2,458 (64.1%) | 1,377 (35.9%) |
| Total | 35,870 (70.9%) | 14,723 (29.1%) |
Educational Attainment by Field of Study in Arlington County
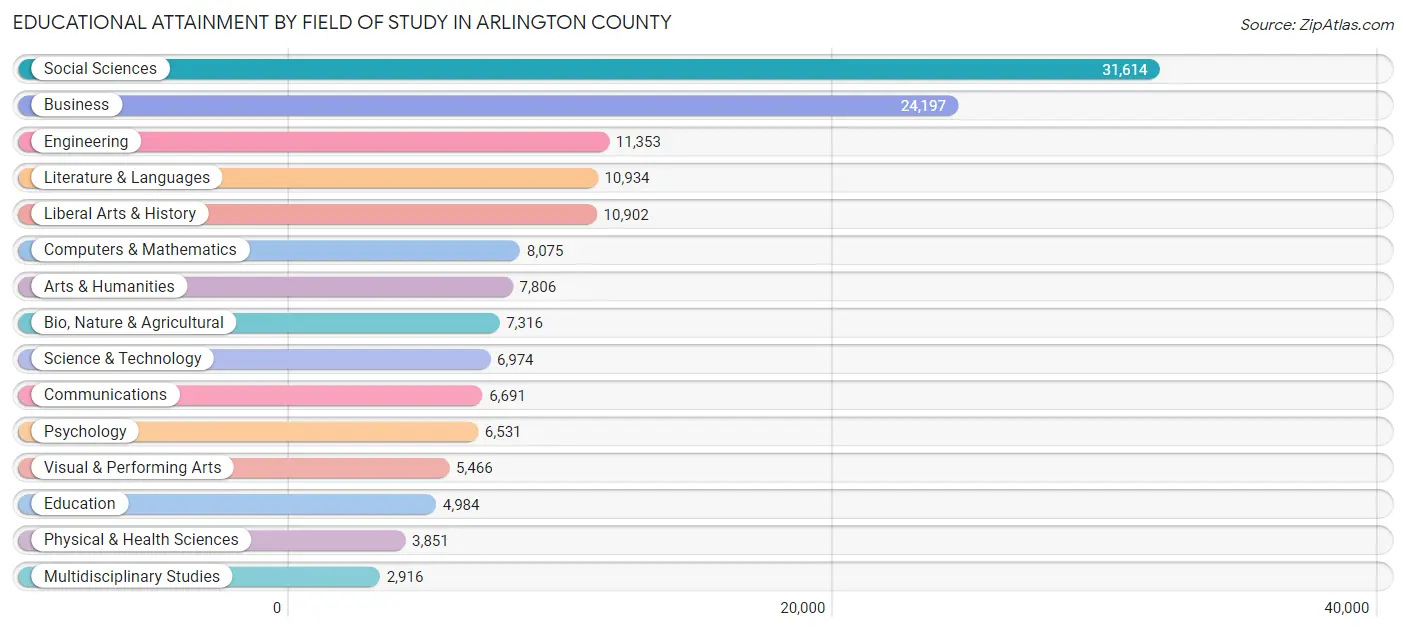
Social sciences (31,614 | 21.1%), business (24,197 | 16.2%), engineering (11,353 | 7.6%), literature & languages (10,934 | 7.3%), and liberal arts & history (10,902 | 7.3%) are the most common fields of study among 149,610 individuals in Arlington County who have obtained a bachelor's degree or higher.
| Field of Study | # Graduates | % Graduates |
| Computers & Mathematics | 8,075 | 5.4% |
| Bio, Nature & Agricultural | 7,316 | 4.9% |
| Physical & Health Sciences | 3,851 | 2.6% |
| Psychology | 6,531 | 4.4% |
| Social Sciences | 31,614 | 21.1% |
| Engineering | 11,353 | 7.6% |
| Multidisciplinary Studies | 2,916 | 1.9% |
| Science & Technology | 6,974 | 4.7% |
| Business | 24,197 | 16.2% |
| Education | 4,984 | 3.3% |
| Literature & Languages | 10,934 | 7.3% |
| Liberal Arts & History | 10,902 | 7.3% |
| Visual & Performing Arts | 5,466 | 3.6% |
| Communications | 6,691 | 4.5% |
| Arts & Humanities | 7,806 | 5.2% |
| Total | 149,610 | 100.0% |
Transportation & Commute in Arlington County
Vehicle Availability by Sex in Arlington County
The most prevalent vehicle ownership categories in Arlington County are males with 1 vehicle (30,372, accounting for 39.1%) and females with 1 vehicle (28,902, making up 43.8%).
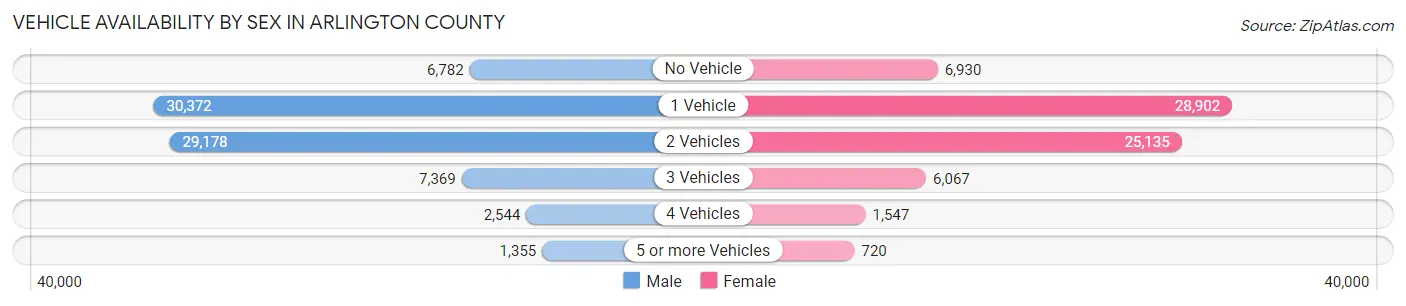
| Vehicles Available | Male | Female |
| No Vehicle | 6,782 (8.7%) | 6,930 (10.0%) |
| 1 Vehicle | 30,372 (39.1%) | 28,902 (41.7%) |
| 2 Vehicles | 29,178 (37.6%) | 25,135 (36.3%) |
| 3 Vehicles | 7,369 (9.5%) | 6,067 (8.7%) |
| 4 Vehicles | 2,544 (3.3%) | 1,547 (2.2%) |
| 5 or more Vehicles | 1,355 (1.8%) | 720 (1.0%) |
| Total | 77,600 (100.0%) | 69,301 (100.0%) |
Commute Time in Arlington County
The most frequently occuring commute durations in Arlington County are 30 to 34 minutes (20,543 commuters, 19.0%), 20 to 24 minutes (15,901 commuters, 14.7%), and 15 to 19 minutes (15,071 commuters, 13.9%).
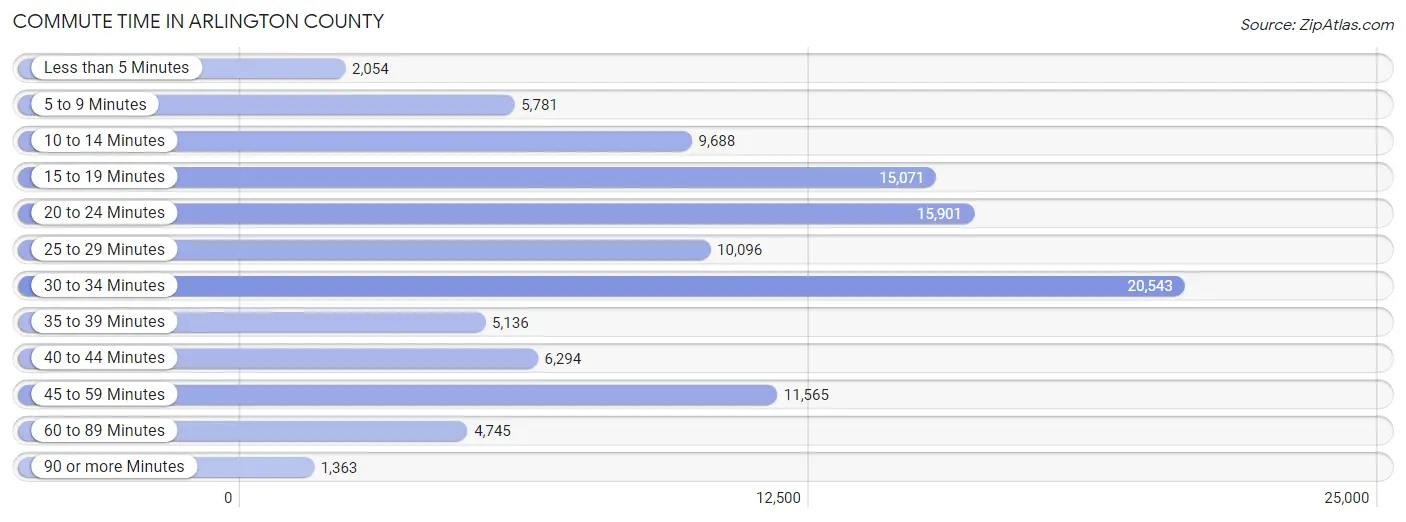
| Commute Time | # Commuters | % Commuters |
| Less than 5 Minutes | 2,054 | 1.9% |
| 5 to 9 Minutes | 5,781 | 5.3% |
| 10 to 14 Minutes | 9,688 | 8.9% |
| 15 to 19 Minutes | 15,071 | 13.9% |
| 20 to 24 Minutes | 15,901 | 14.7% |
| 25 to 29 Minutes | 10,096 | 9.3% |
| 30 to 34 Minutes | 20,543 | 19.0% |
| 35 to 39 Minutes | 5,136 | 4.8% |
| 40 to 44 Minutes | 6,294 | 5.8% |
| 45 to 59 Minutes | 11,565 | 10.7% |
| 60 to 89 Minutes | 4,745 | 4.4% |
| 90 or more Minutes | 1,363 | 1.3% |
Commute Time by Sex in Arlington County
The most common commute times in Arlington County are 30 to 34 minutes (12,124 commuters, 20.6%) for males and 30 to 34 minutes (8,419 commuters, 17.0%) for females.
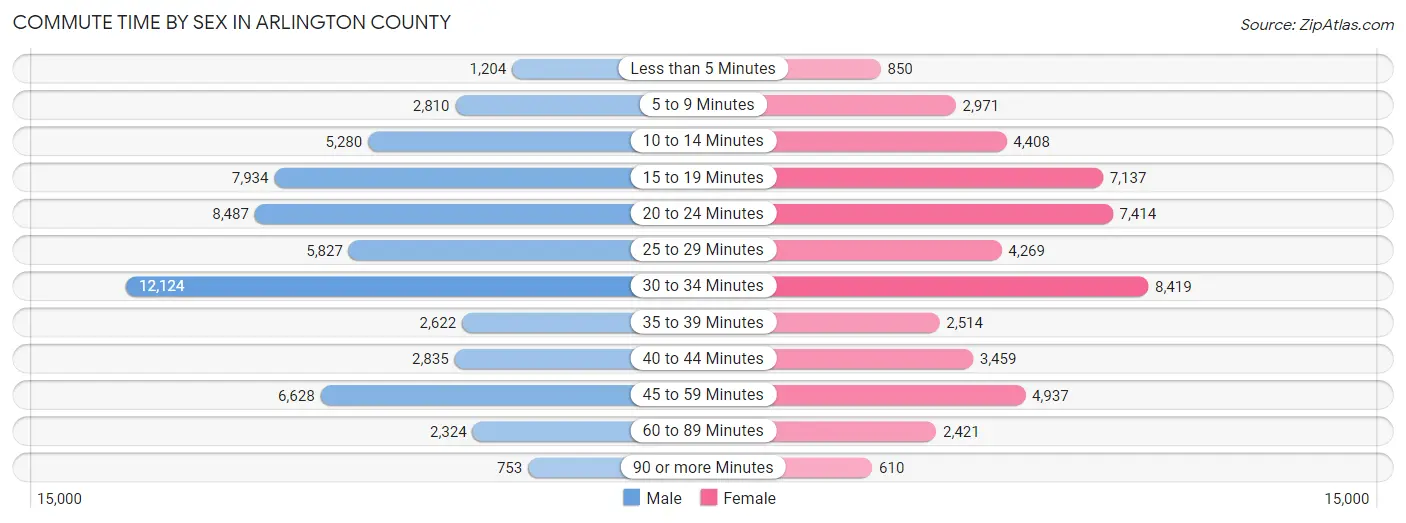
| Commute Time | Male | Female |
| Less than 5 Minutes | 1,204 (2.1%) | 850 (1.7%) |
| 5 to 9 Minutes | 2,810 (4.8%) | 2,971 (6.0%) |
| 10 to 14 Minutes | 5,280 (9.0%) | 4,408 (8.9%) |
| 15 to 19 Minutes | 7,934 (13.5%) | 7,137 (14.4%) |
| 20 to 24 Minutes | 8,487 (14.4%) | 7,414 (15.0%) |
| 25 to 29 Minutes | 5,827 (9.9%) | 4,269 (8.6%) |
| 30 to 34 Minutes | 12,124 (20.6%) | 8,419 (17.0%) |
| 35 to 39 Minutes | 2,622 (4.5%) | 2,514 (5.1%) |
| 40 to 44 Minutes | 2,835 (4.8%) | 3,459 (7.0%) |
| 45 to 59 Minutes | 6,628 (11.3%) | 4,937 (10.0%) |
| 60 to 89 Minutes | 2,324 (4.0%) | 2,421 (4.9%) |
| 90 or more Minutes | 753 (1.3%) | 610 (1.2%) |
Time of Departure to Work by Sex in Arlington County
The most frequent times of departure to work in Arlington County are 8:00 AM to 8:29 AM (10,686, 18.2%) for males and 8:00 AM to 8:29 AM (10,036, 20.3%) for females.
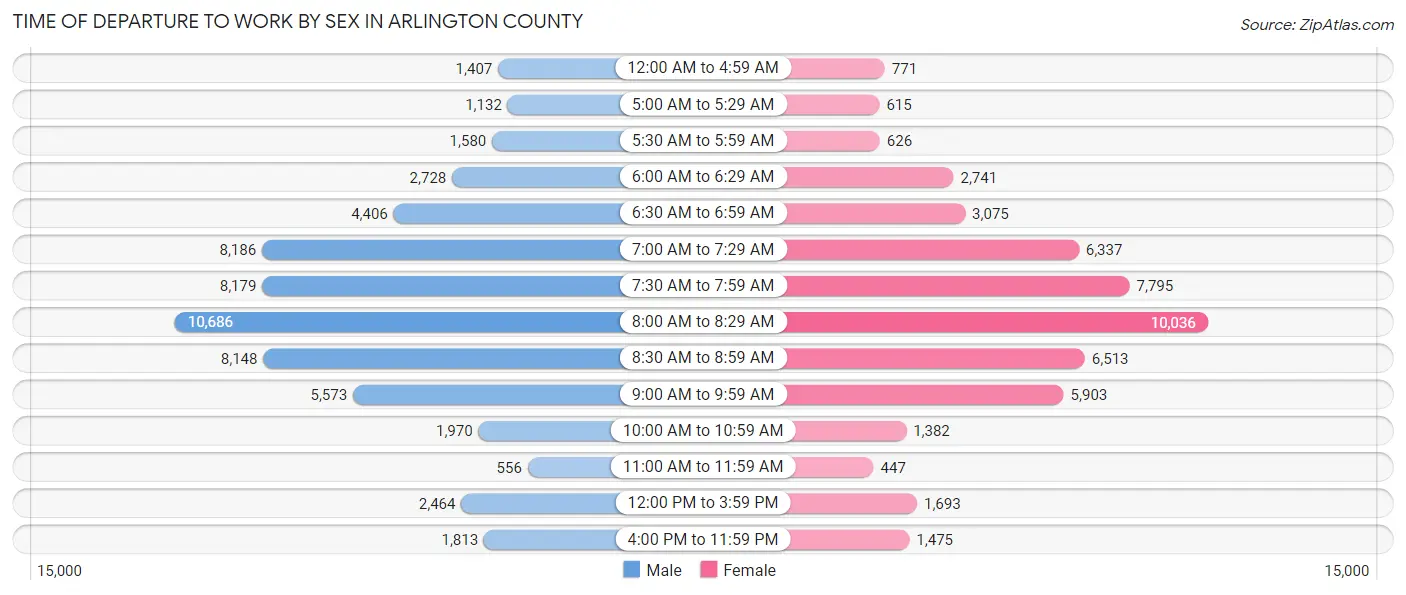
| Time of Departure | Male | Female |
| 12:00 AM to 4:59 AM | 1,407 (2.4%) | 771 (1.6%) |
| 5:00 AM to 5:29 AM | 1,132 (1.9%) | 615 (1.2%) |
| 5:30 AM to 5:59 AM | 1,580 (2.7%) | 626 (1.3%) |
| 6:00 AM to 6:29 AM | 2,728 (4.6%) | 2,741 (5.6%) |
| 6:30 AM to 6:59 AM | 4,406 (7.5%) | 3,075 (6.2%) |
| 7:00 AM to 7:29 AM | 8,186 (13.9%) | 6,337 (12.8%) |
| 7:30 AM to 7:59 AM | 8,179 (13.9%) | 7,795 (15.8%) |
| 8:00 AM to 8:29 AM | 10,686 (18.2%) | 10,036 (20.3%) |
| 8:30 AM to 8:59 AM | 8,148 (13.9%) | 6,513 (13.2%) |
| 9:00 AM to 9:59 AM | 5,573 (9.5%) | 5,903 (11.9%) |
| 10:00 AM to 10:59 AM | 1,970 (3.4%) | 1,382 (2.8%) |
| 11:00 AM to 11:59 AM | 556 (0.9%) | 447 (0.9%) |
| 12:00 PM to 3:59 PM | 2,464 (4.2%) | 1,693 (3.4%) |
| 4:00 PM to 11:59 PM | 1,813 (3.1%) | 1,475 (3.0%) |
| Total | 58,828 (100.0%) | 49,409 (100.0%) |
Housing Occupancy in Arlington County
Occupancy by Ownership in Arlington County
Of the total 110,887 dwellings in Arlington County, owner-occupied units account for 46,842 (42.2%), while renter-occupied units make up 64,045 (57.8%).
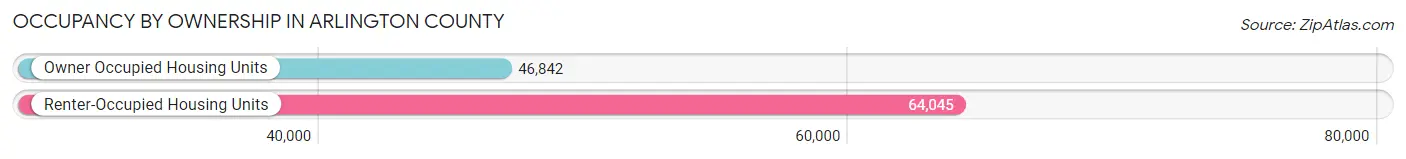
| Occupancy | # Housing Units | % Housing Units |
| Owner Occupied Housing Units | 46,842 | 42.2% |
| Renter-Occupied Housing Units | 64,045 | 57.8% |
| Total Occupied Housing Units | 110,887 | 100.0% |
Occupancy by Household Size in Arlington County
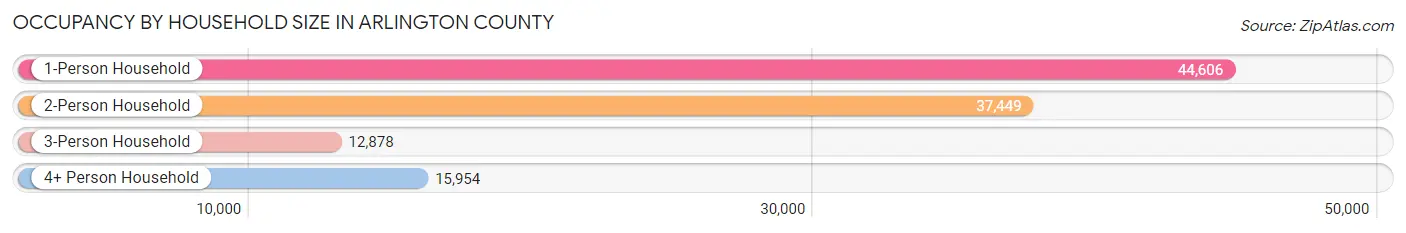
| Household Size | # Housing Units | % Housing Units |
| 1-Person Household | 44,606 | 40.2% |
| 2-Person Household | 37,449 | 33.8% |
| 3-Person Household | 12,878 | 11.6% |
| 4+ Person Household | 15,954 | 14.4% |
| Total Housing Units | 110,887 | 100.0% |
Occupancy by Ownership by Household Size in Arlington County
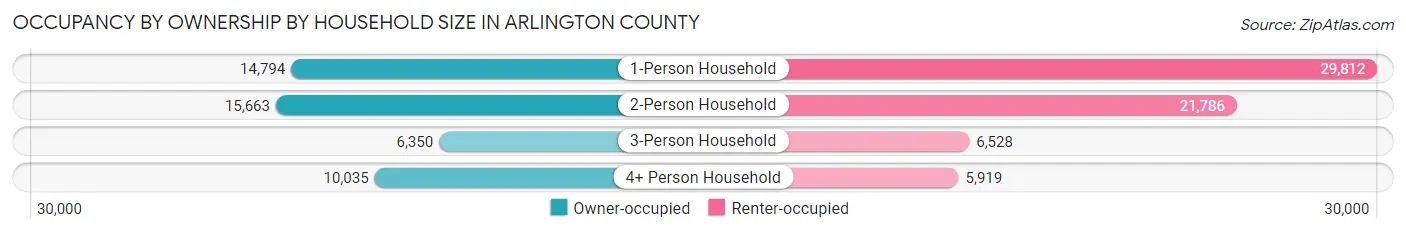
| Household Size | Owner-occupied | Renter-occupied |
| 1-Person Household | 14,794 (33.2%) | 29,812 (66.8%) |
| 2-Person Household | 15,663 (41.8%) | 21,786 (58.2%) |
| 3-Person Household | 6,350 (49.3%) | 6,528 (50.7%) |
| 4+ Person Household | 10,035 (62.9%) | 5,919 (37.1%) |
| Total Housing Units | 46,842 (42.2%) | 64,045 (57.8%) |
Occupancy by Educational Attainment in Arlington County
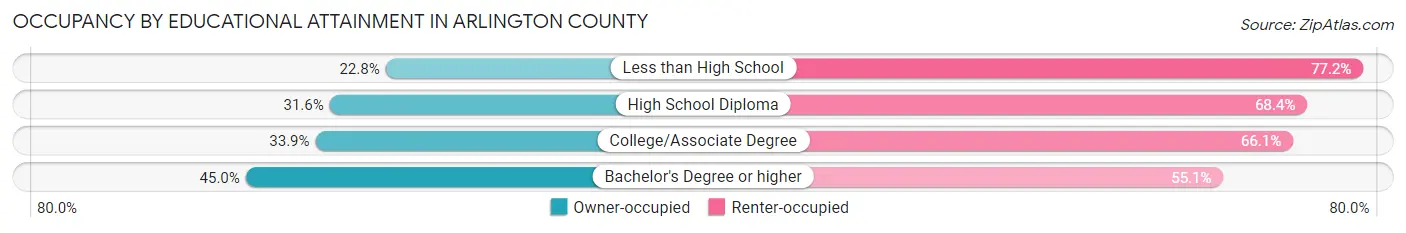
| Household Size | Owner-occupied | Renter-occupied |
| Less than High School | 840 (22.8%) | 2,851 (77.2%) |
| High School Diploma | 2,021 (31.6%) | 4,369 (68.4%) |
| College/Associate Degree | 4,083 (33.9%) | 7,969 (66.1%) |
| Bachelor's Degree or higher | 39,898 (45.0%) | 48,856 (55.0%) |
Occupancy by Age of Householder in Arlington County
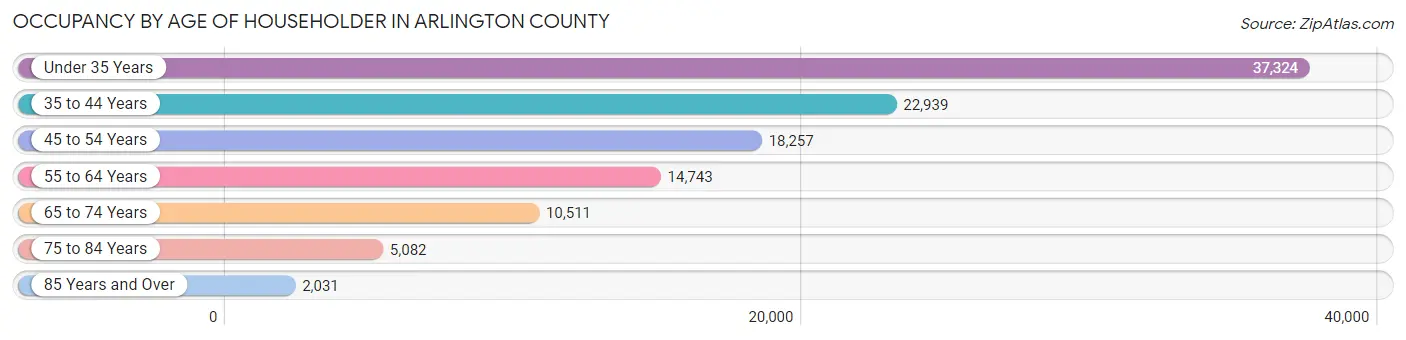
| Age Bracket | # Households | % Households |
| Under 35 Years | 37,324 | 33.7% |
| 35 to 44 Years | 22,939 | 20.7% |
| 45 to 54 Years | 18,257 | 16.5% |
| 55 to 64 Years | 14,743 | 13.3% |
| 65 to 74 Years | 10,511 | 9.5% |
| 75 to 84 Years | 5,082 | 4.6% |
| 85 Years and Over | 2,031 | 1.8% |
| Total | 110,887 | 100.0% |
Housing Finances in Arlington County
Median Income by Occupancy in Arlington County
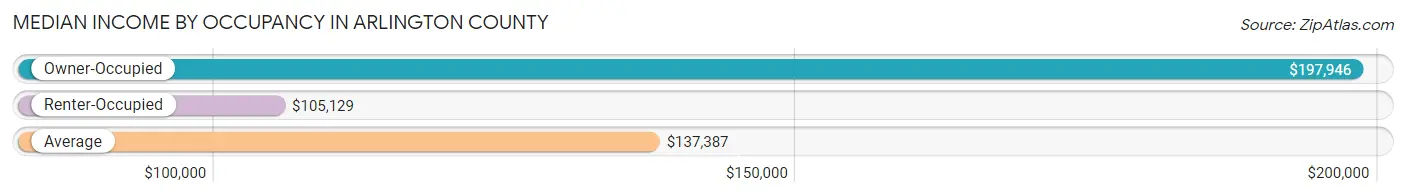
| Occupancy Type | # Households | Median Income |
| Owner-Occupied | 46,842 (42.2%) | $197,946 |
| Renter-Occupied | 64,045 (57.8%) | $105,129 |
| Average | 110,887 (100.0%) | $137,387 |
Occupancy by Householder Income Bracket in Arlington County
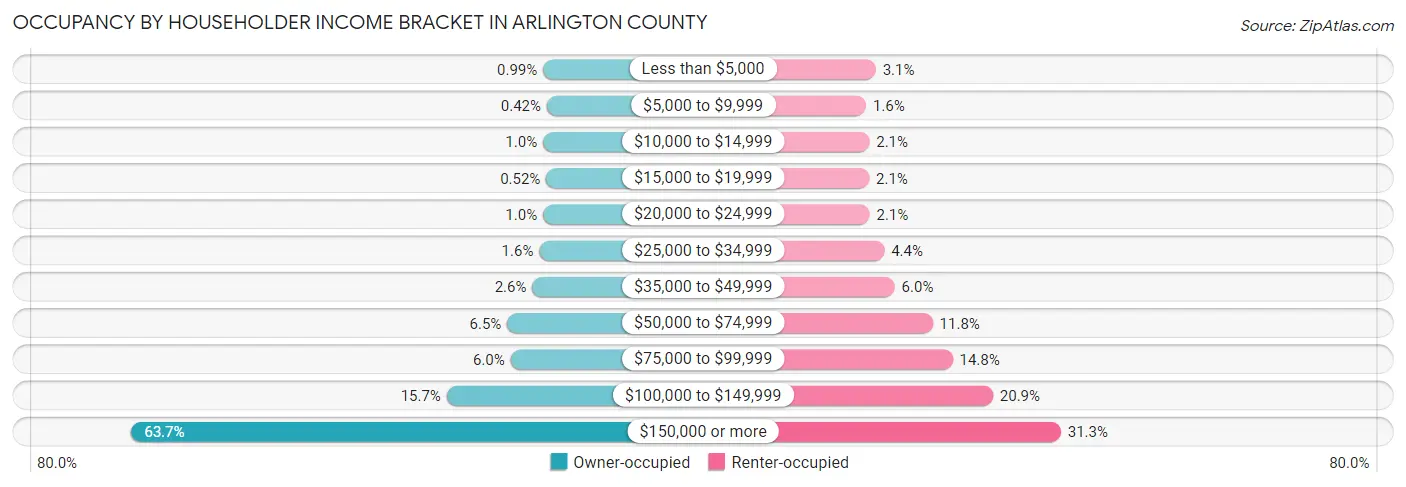
| Income Bracket | Owner-occupied | Renter-occupied |
| Less than $5,000 | 462 (1.0%) | 1,966 (3.1%) |
| $5,000 to $9,999 | 198 (0.4%) | 1,020 (1.6%) |
| $10,000 to $14,999 | 473 (1.0%) | 1,336 (2.1%) |
| $15,000 to $19,999 | 245 (0.5%) | 1,322 (2.1%) |
| $20,000 to $24,999 | 471 (1.0%) | 1,363 (2.1%) |
| $25,000 to $34,999 | 742 (1.6%) | 2,800 (4.4%) |
| $35,000 to $49,999 | 1,238 (2.6%) | 3,818 (6.0%) |
| $50,000 to $74,999 | 3,024 (6.5%) | 7,523 (11.7%) |
| $75,000 to $99,999 | 2,785 (5.9%) | 9,463 (14.8%) |
| $100,000 to $149,999 | 7,347 (15.7%) | 13,398 (20.9%) |
| $150,000 or more | 29,857 (63.7%) | 20,036 (31.3%) |
| Total | 46,842 (100.0%) | 64,045 (100.0%) |
Monthly Housing Cost Tiers in Arlington County
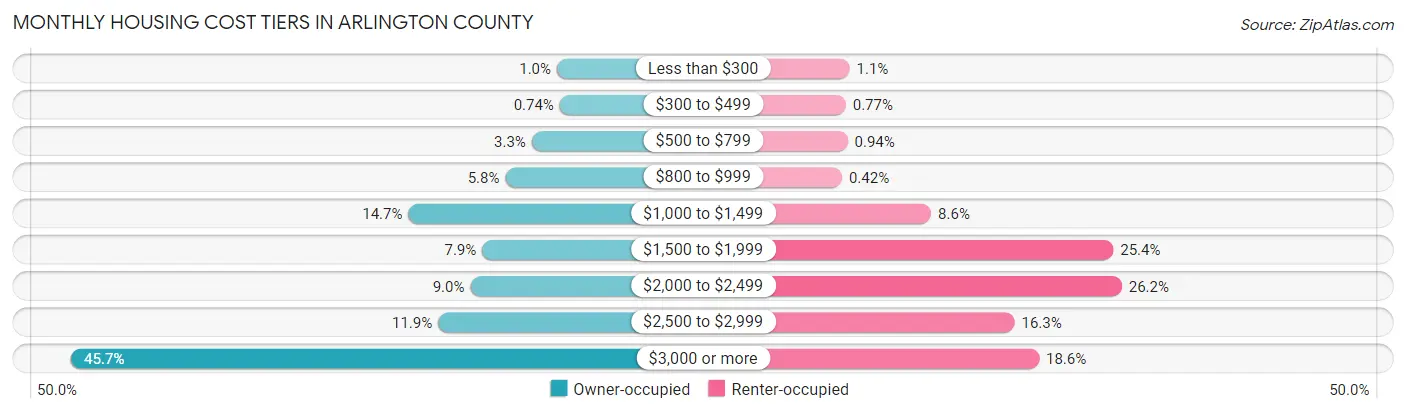
| Monthly Cost | Owner-occupied | Renter-occupied |
| Less than $300 | 467 (1.0%) | 720 (1.1%) |
| $300 to $499 | 347 (0.7%) | 495 (0.8%) |
| $500 to $799 | 1,554 (3.3%) | 605 (0.9%) |
| $800 to $999 | 2,694 (5.8%) | 270 (0.4%) |
| $1,000 to $1,499 | 6,877 (14.7%) | 5,530 (8.6%) |
| $1,500 to $1,999 | 3,691 (7.9%) | 16,269 (25.4%) |
| $2,000 to $2,499 | 4,204 (9.0%) | 16,767 (26.2%) |
| $2,500 to $2,999 | 5,593 (11.9%) | 10,448 (16.3%) |
| $3,000 or more | 21,415 (45.7%) | 11,888 (18.6%) |
| Total | 46,842 (100.0%) | 64,045 (100.0%) |
Physical Housing Characteristics in Arlington County
Housing Structures in Arlington County
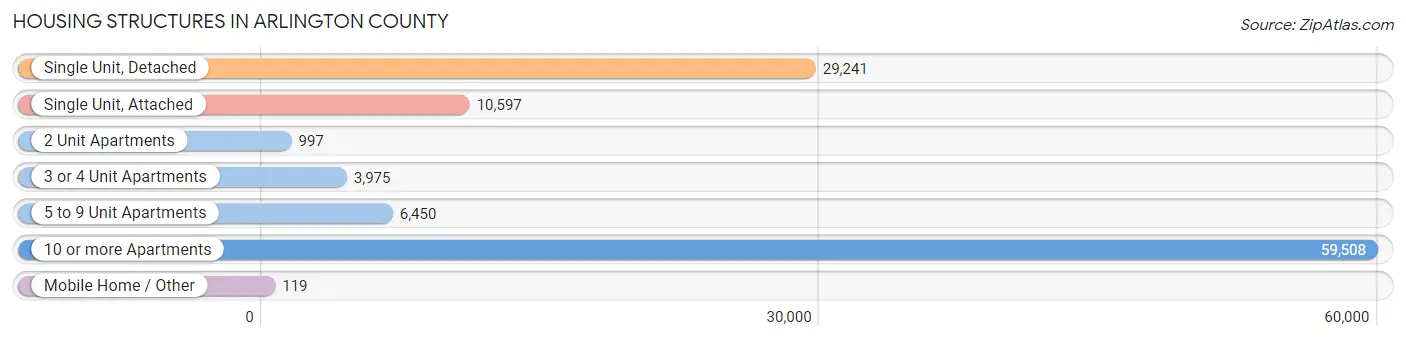
| Structure Type | # Housing Units | % Housing Units |
| Single Unit, Detached | 29,241 | 26.4% |
| Single Unit, Attached | 10,597 | 9.6% |
| 2 Unit Apartments | 997 | 0.9% |
| 3 or 4 Unit Apartments | 3,975 | 3.6% |
| 5 to 9 Unit Apartments | 6,450 | 5.8% |
| 10 or more Apartments | 59,508 | 53.7% |
| Mobile Home / Other | 119 | 0.1% |
| Total | 110,887 | 100.0% |
Housing Structures by Occupancy in Arlington County
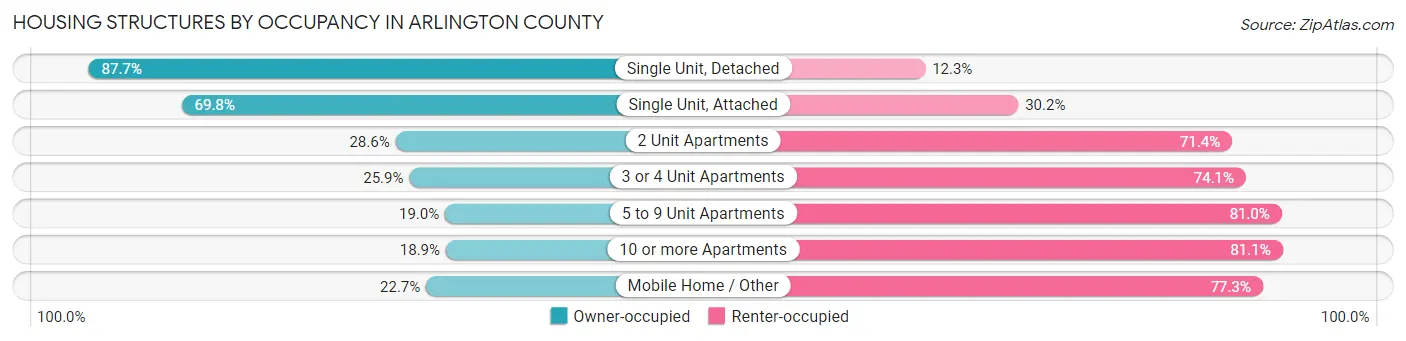
| Structure Type | Owner-occupied | Renter-occupied |
| Single Unit, Detached | 25,636 (87.7%) | 3,605 (12.3%) |
| Single Unit, Attached | 7,392 (69.8%) | 3,205 (30.2%) |
| 2 Unit Apartments | 285 (28.6%) | 712 (71.4%) |
| 3 or 4 Unit Apartments | 1,031 (25.9%) | 2,944 (74.1%) |
| 5 to 9 Unit Apartments | 1,228 (19.0%) | 5,222 (81.0%) |
| 10 or more Apartments | 11,243 (18.9%) | 48,265 (81.1%) |
| Mobile Home / Other | 27 (22.7%) | 92 (77.3%) |
| Total | 46,842 (42.2%) | 64,045 (57.8%) |
Housing Structures by Number of Rooms in Arlington County
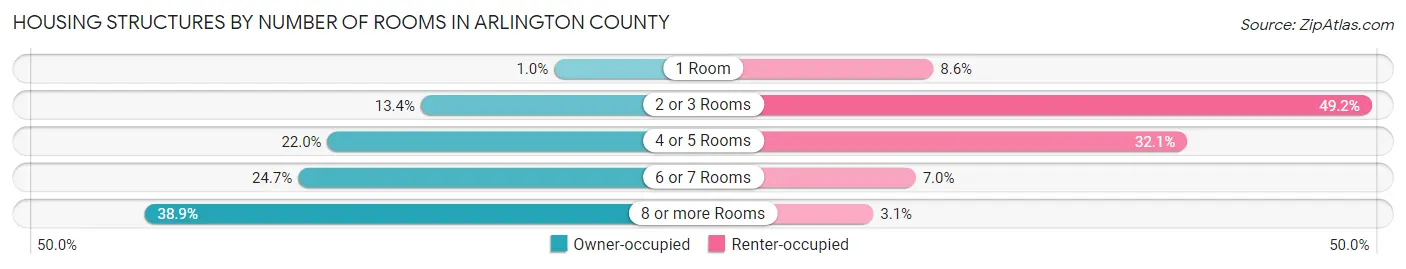
| Number of Rooms | Owner-occupied | Renter-occupied |
| 1 Room | 483 (1.0%) | 5,531 (8.6%) |
| 2 or 3 Rooms | 6,258 (13.4%) | 31,489 (49.2%) |
| 4 or 5 Rooms | 10,301 (22.0%) | 20,560 (32.1%) |
| 6 or 7 Rooms | 11,577 (24.7%) | 4,487 (7.0%) |
| 8 or more Rooms | 18,223 (38.9%) | 1,978 (3.1%) |
| Total | 46,842 (100.0%) | 64,045 (100.0%) |
Housing Structure by Heating Type in Arlington County
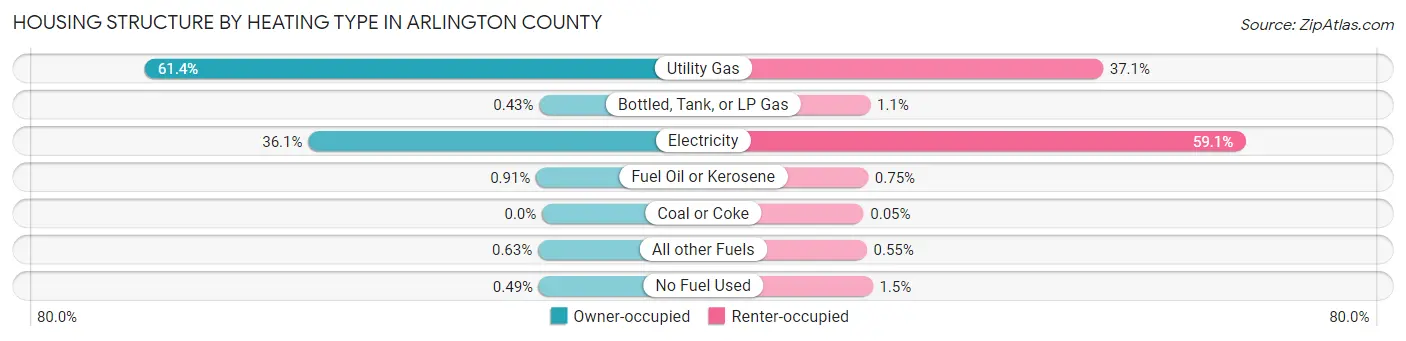
| Heating Type | Owner-occupied | Renter-occupied |
| Utility Gas | 28,760 (61.4%) | 23,734 (37.1%) |
| Bottled, Tank, or LP Gas | 202 (0.4%) | 689 (1.1%) |
| Electricity | 16,928 (36.1%) | 37,818 (59.1%) |
| Fuel Oil or Kerosene | 425 (0.9%) | 483 (0.7%) |
| Coal or Coke | 0 (0.0%) | 33 (0.1%) |
| All other Fuels | 296 (0.6%) | 351 (0.5%) |
| No Fuel Used | 231 (0.5%) | 937 (1.5%) |
| Total | 46,842 (100.0%) | 64,045 (100.0%) |
Household Vehicle Usage in Arlington County
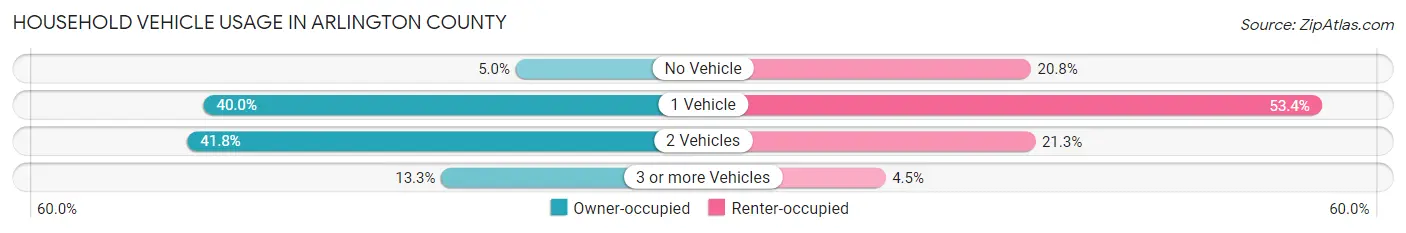
| Vehicles per Household | Owner-occupied | Renter-occupied |
| No Vehicle | 2,333 (5.0%) | 13,320 (20.8%) |
| 1 Vehicle | 18,712 (40.0%) | 34,202 (53.4%) |
| 2 Vehicles | 19,559 (41.8%) | 13,635 (21.3%) |
| 3 or more Vehicles | 6,238 (13.3%) | 2,888 (4.5%) |
| Total | 46,842 (100.0%) | 64,045 (100.0%) |
Real Estate & Mortgages in Arlington County
Real Estate and Mortgage Overview in Arlington County
| Characteristic | Without Mortgage | With Mortgage |
| Housing Units | 12,827 | 34,015 |
| Median Property Value | $819,500 | $839,800 |
| Median Household Income | $137,692 | $24,086 |
| Monthly Housing Costs | $1,129 | $21,127 |
| Real Estate Taxes | $7,721 | $470 |
Property Value by Mortgage Status in Arlington County
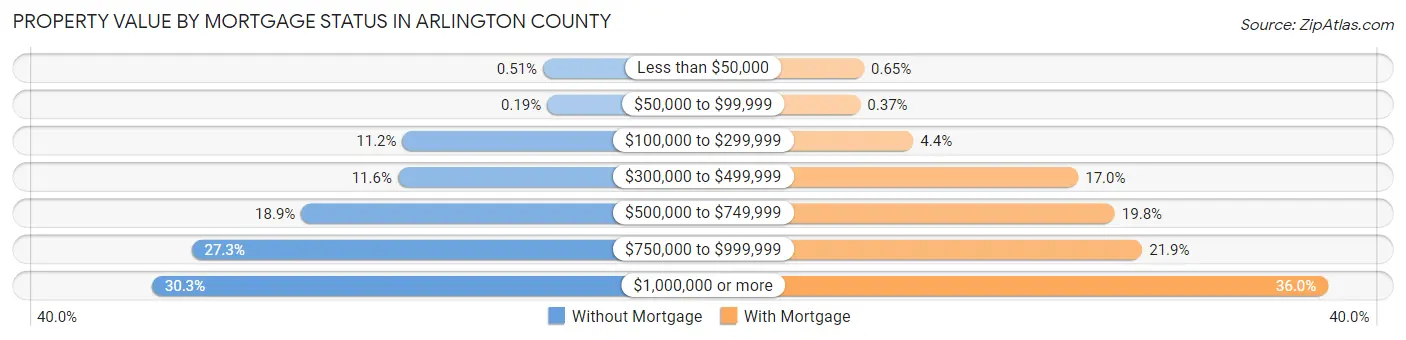
| Property Value | Without Mortgage | With Mortgage |
| Less than $50,000 | 66 (0.5%) | 220 (0.6%) |
| $50,000 to $99,999 | 24 (0.2%) | 125 (0.4%) |
| $100,000 to $299,999 | 1,439 (11.2%) | 1,500 (4.4%) |
| $300,000 to $499,999 | 1,484 (11.6%) | 5,773 (17.0%) |
| $500,000 to $749,999 | 2,428 (18.9%) | 6,720 (19.8%) |
| $750,000 to $999,999 | 3,499 (27.3%) | 7,433 (21.8%) |
| $1,000,000 or more | 3,887 (30.3%) | 12,244 (36.0%) |
| Total | 12,827 (100.0%) | 34,015 (100.0%) |
Household Income by Mortgage Status in Arlington County
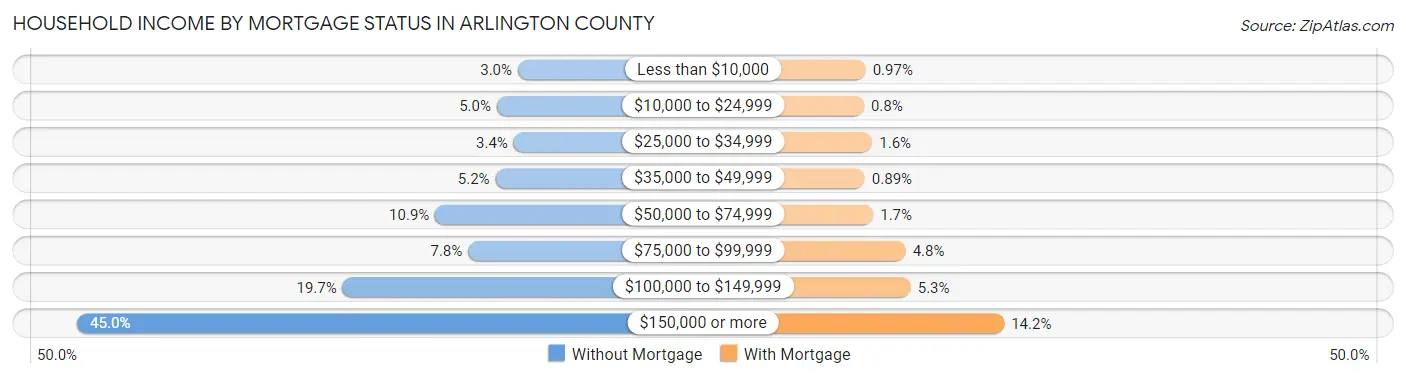
| Household Income | Without Mortgage | With Mortgage |
| Less than $10,000 | 387 (3.0%) | 330 (1.0%) |
| $10,000 to $24,999 | 645 (5.0%) | 273 (0.8%) |
| $25,000 to $34,999 | 439 (3.4%) | 544 (1.6%) |
| $35,000 to $49,999 | 662 (5.2%) | 303 (0.9%) |
| $50,000 to $74,999 | 1,398 (10.9%) | 576 (1.7%) |
| $75,000 to $99,999 | 995 (7.8%) | 1,626 (4.8%) |
| $100,000 to $149,999 | 2,530 (19.7%) | 1,790 (5.3%) |
| $150,000 or more | 5,771 (45.0%) | 4,817 (14.2%) |
| Total | 12,827 (100.0%) | 34,015 (100.0%) |
Property Value to Household Income Ratio in Arlington County
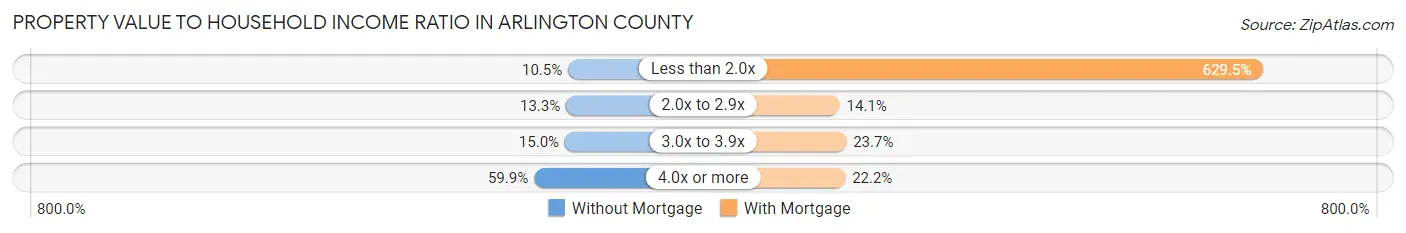
| Value-to-Income Ratio | Without Mortgage | With Mortgage |
| Less than 2.0x | 1,343 (10.5%) | 214,131 (629.5%) |
| 2.0x to 2.9x | 1,711 (13.3%) | 4,798 (14.1%) |
| 3.0x to 3.9x | 1,920 (15.0%) | 8,058 (23.7%) |
| 4.0x or more | 7,685 (59.9%) | 7,555 (22.2%) |
| Total | 12,827 (100.0%) | 34,015 (100.0%) |
Real Estate Taxes by Mortgage Status in Arlington County

| Property Taxes | Without Mortgage | With Mortgage |
| Less than $800 | 176 (1.4%) | 86 (0.3%) |
| $800 to $1,499 | 315 (2.5%) | 618 (1.8%) |
| $800 to $1,499 | 11,878 (92.6%) | 699 (2.1%) |
| Total | 12,827 (100.0%) | 34,015 (100.0%) |
Health & Disability in Arlington County
Health Insurance Coverage by Age in Arlington County
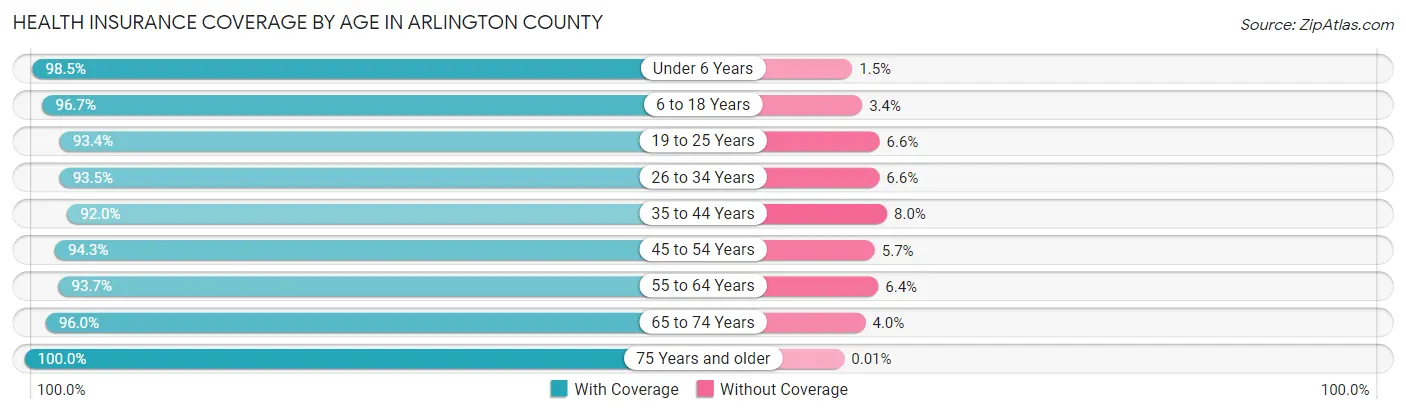
| Age Bracket | With Coverage | Without Coverage |
| Under 6 Years | 14,744 (98.5%) | 224 (1.5%) |
| 6 to 18 Years | 28,459 (96.7%) | 985 (3.4%) |
| 19 to 25 Years | 21,617 (93.4%) | 1,523 (6.6%) |
| 26 to 34 Years | 44,299 (93.4%) | 3,104 (6.6%) |
| 35 to 44 Years | 34,638 (92.0%) | 3,005 (8.0%) |
| 45 to 54 Years | 27,579 (94.3%) | 1,668 (5.7%) |
| 55 to 64 Years | 21,765 (93.6%) | 1,475 (6.4%) |
| 65 to 74 Years | 15,182 (96.0%) | 626 (4.0%) |
| 75 Years and older | 10,129 (100.0%) | 1 (0.0%) |
| Total | 218,412 (94.5%) | 12,611 (5.5%) |
Health Insurance Coverage by Citizenship Status in Arlington County
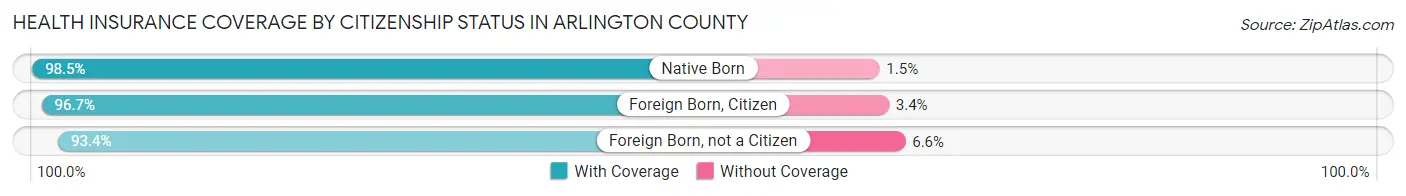
| Citizenship Status | With Coverage | Without Coverage |
| Native Born | 14,744 (98.5%) | 224 (1.5%) |
| Foreign Born, Citizen | 28,459 (96.7%) | 985 (3.4%) |
| Foreign Born, not a Citizen | 21,617 (93.4%) | 1,523 (6.6%) |
Health Insurance Coverage by Household Income in Arlington County
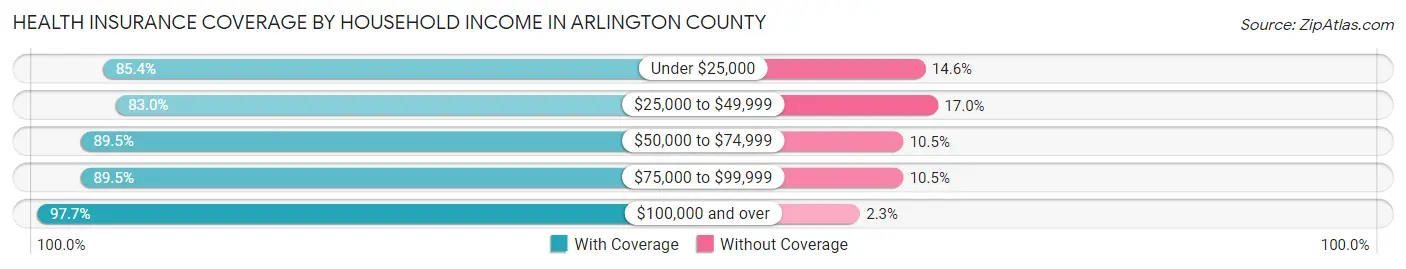
| Household Income | With Coverage | Without Coverage |
| Under $25,000 | 11,571 (85.4%) | 1,984 (14.6%) |
| $25,000 to $49,999 | 12,904 (83.0%) | 2,640 (17.0%) |
| $50,000 to $74,999 | 16,687 (89.5%) | 1,953 (10.5%) |
| $75,000 to $99,999 | 18,213 (89.5%) | 2,133 (10.5%) |
| $100,000 and over | 158,094 (97.7%) | 3,790 (2.3%) |
Public vs Private Health Insurance Coverage by Age in Arlington County
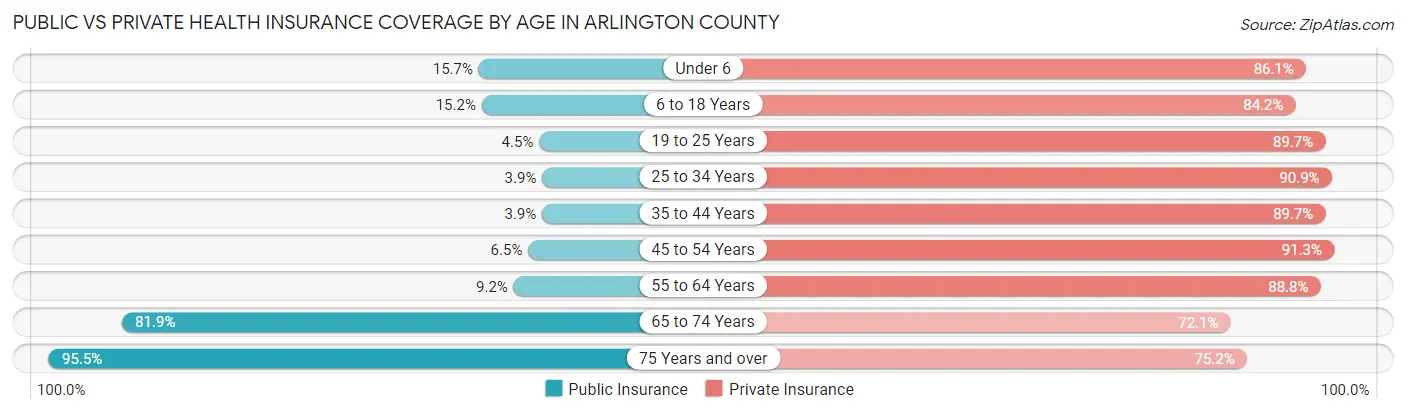
| Age Bracket | Public Insurance | Private Insurance |
| Under 6 | 2,350 (15.7%) | 12,887 (86.1%) |
| 6 to 18 Years | 4,460 (15.1%) | 24,784 (84.2%) |
| 19 to 25 Years | 1,035 (4.5%) | 20,755 (89.7%) |
| 25 to 34 Years | 1,858 (3.9%) | 43,082 (90.9%) |
| 35 to 44 Years | 1,482 (3.9%) | 33,772 (89.7%) |
| 45 to 54 Years | 1,907 (6.5%) | 26,710 (91.3%) |
| 55 to 64 Years | 2,142 (9.2%) | 20,641 (88.8%) |
| 65 to 74 Years | 12,946 (81.9%) | 11,401 (72.1%) |
| 75 Years and over | 9,672 (95.5%) | 7,613 (75.1%) |
| Total | 37,852 (16.4%) | 201,645 (87.3%) |
Disability Status by Sex by Age in Arlington County
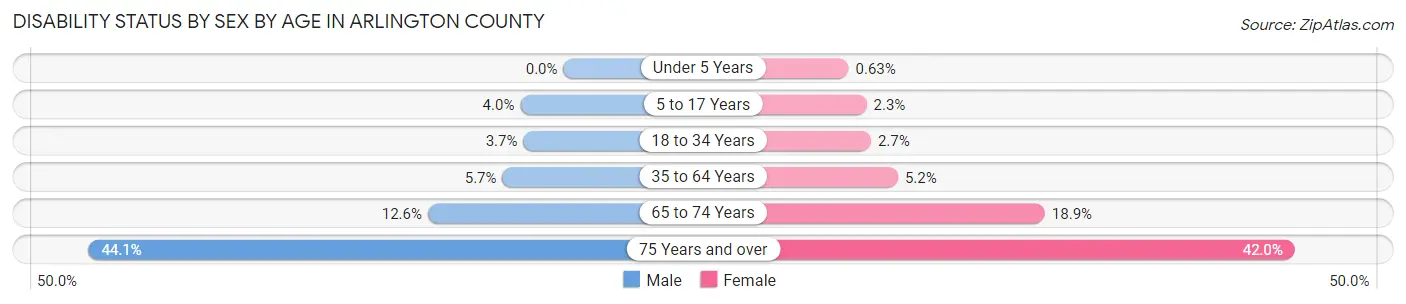
| Age Bracket | Male | Female |
| Under 5 Years | 0 (0.0%) | 40 (0.6%) |
| 5 to 17 Years | 614 (4.0%) | 333 (2.3%) |
| 18 to 34 Years | 1,339 (3.7%) | 984 (2.7%) |
| 35 to 64 Years | 2,587 (5.7%) | 2,316 (5.2%) |
| 65 to 74 Years | 958 (12.6%) | 1,544 (18.9%) |
| 75 Years and over | 1,894 (44.1%) | 2,452 (42.0%) |
Disability Class by Sex by Age in Arlington County
Disability Class: Hearing Difficulty
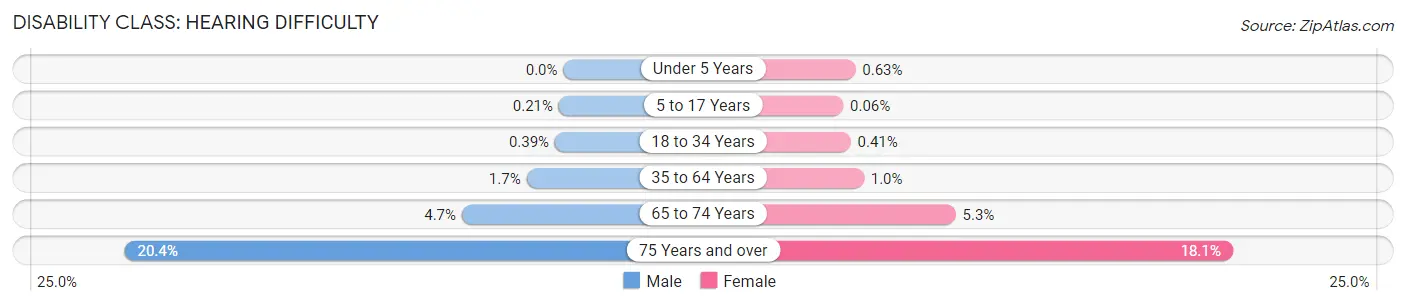
| Age Bracket | Male | Female |
| Under 5 Years | 0 (0.0%) | 40 (0.6%) |
| 5 to 17 Years | 33 (0.2%) | 9 (0.1%) |
| 18 to 34 Years | 142 (0.4%) | 149 (0.4%) |
| 35 to 64 Years | 781 (1.7%) | 451 (1.0%) |
| 65 to 74 Years | 359 (4.7%) | 433 (5.3%) |
| 75 Years and over | 875 (20.4%) | 1,058 (18.1%) |
Disability Class: Vision Difficulty
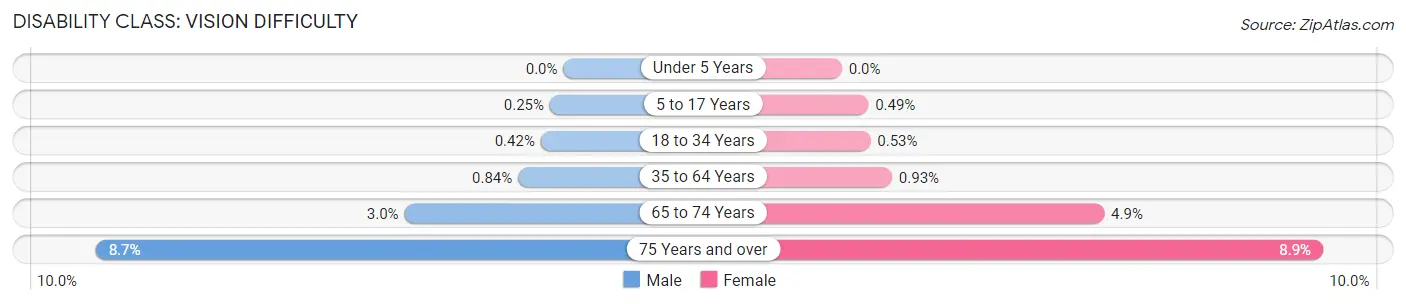
| Age Bracket | Male | Female |
| Under 5 Years | 0 (0.0%) | 0 (0.0%) |
| 5 to 17 Years | 39 (0.3%) | 71 (0.5%) |
| 18 to 34 Years | 151 (0.4%) | 194 (0.5%) |
| 35 to 64 Years | 383 (0.8%) | 411 (0.9%) |
| 65 to 74 Years | 225 (2.9%) | 399 (4.9%) |
| 75 Years and over | 373 (8.7%) | 521 (8.9%) |
Disability Class: Cognitive Difficulty
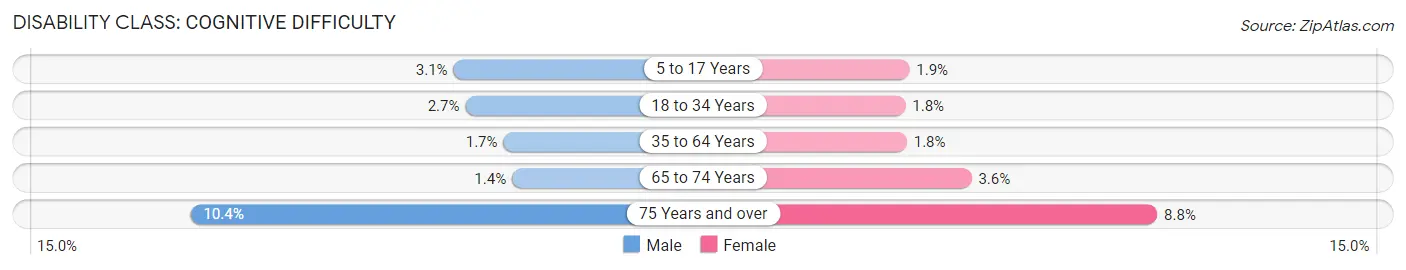
| Age Bracket | Male | Female |
| 5 to 17 Years | 470 (3.1%) | 272 (1.9%) |
| 18 to 34 Years | 982 (2.7%) | 641 (1.8%) |
| 35 to 64 Years | 763 (1.7%) | 806 (1.8%) |
| 65 to 74 Years | 109 (1.4%) | 296 (3.6%) |
| 75 Years and over | 446 (10.4%) | 512 (8.8%) |
Disability Class: Ambulatory Difficulty
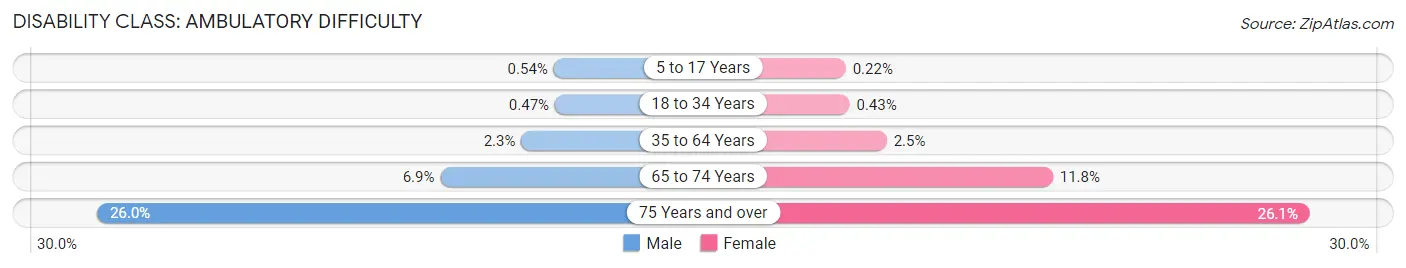
| Age Bracket | Male | Female |
| 5 to 17 Years | 83 (0.5%) | 32 (0.2%) |
| 18 to 34 Years | 169 (0.5%) | 156 (0.4%) |
| 35 to 64 Years | 1,068 (2.3%) | 1,110 (2.5%) |
| 65 to 74 Years | 522 (6.9%) | 963 (11.7%) |
| 75 Years and over | 1,116 (26.0%) | 1,520 (26.1%) |
Disability Class: Self-Care Difficulty
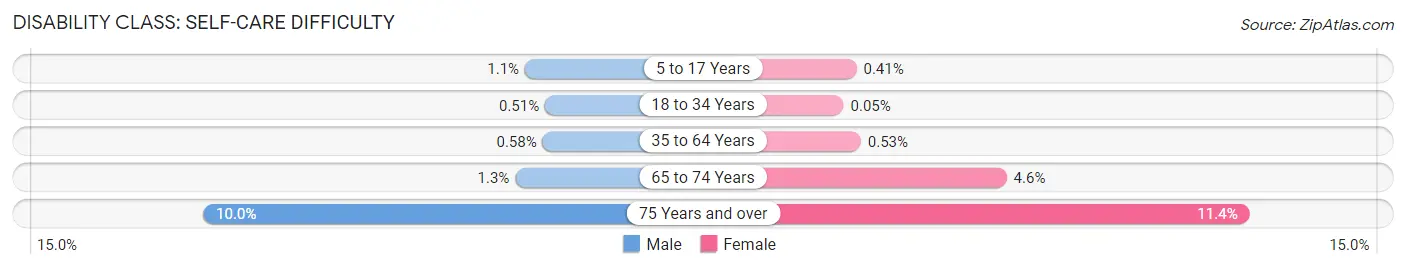
| Age Bracket | Male | Female |
| 5 to 17 Years | 165 (1.1%) | 60 (0.4%) |
| 18 to 34 Years | 185 (0.5%) | 18 (0.1%) |
| 35 to 64 Years | 266 (0.6%) | 234 (0.5%) |
| 65 to 74 Years | 102 (1.3%) | 376 (4.6%) |
| 75 Years and over | 431 (10.0%) | 662 (11.4%) |
Technology Access in Arlington County
Computing Device Access in Arlington County
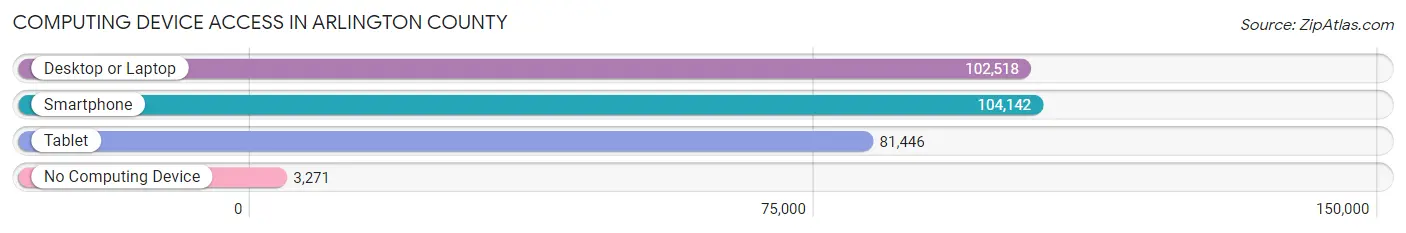
| Device Type | # Households | % Households |
| Desktop or Laptop | 102,518 | 92.4% |
| Smartphone | 104,142 | 93.9% |
| Tablet | 81,446 | 73.5% |
| No Computing Device | 3,271 | 2.9% |
| Total | 110,887 | 100.0% |
Internet Access in Arlington County
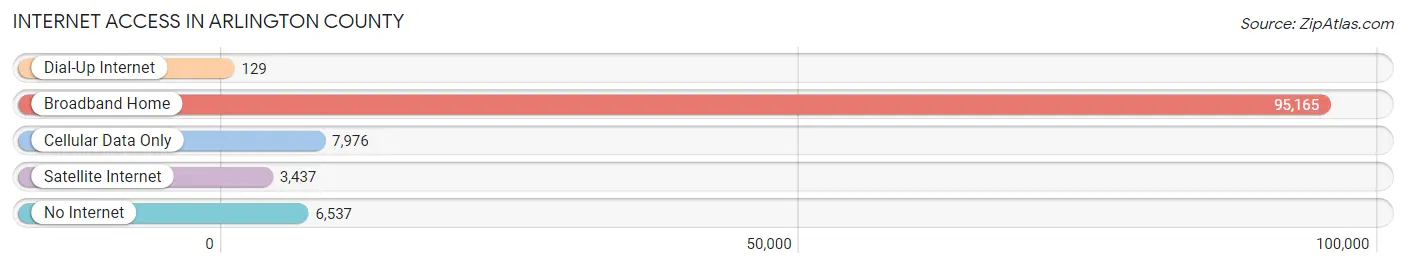
| Internet Type | # Households | % Households |
| Dial-Up Internet | 129 | 0.1% |
| Broadband Home | 95,165 | 85.8% |
| Cellular Data Only | 7,976 | 7.2% |
| Satellite Internet | 3,437 | 3.1% |
| No Internet | 6,537 | 5.9% |
| Total | 110,887 | 100.0% |
Arlington County Summary
Arlington County, Virginia is a county located in the Commonwealth of Virginia, just across the Potomac River from Washington, D.C. It is the smallest self-governing county in the United States, with an area of only 26 square miles. Arlington County is part of the Washington Metropolitan Area and is home to a population of over 230,000 people.
History
Arlington County was originally part of the District of Columbia, but was retroceded to Virginia in 1846. The county was named after General Robert E. Lee’s estate, Arlington House, which was located in the area. During the Civil War, the county was occupied by Union forces and the estate was confiscated by the federal government. After the war, the estate was turned into a military cemetery, now known as Arlington National Cemetery.
In the late 19th century, the county began to develop as a residential suburb of Washington, D.C. The county was officially incorporated in 1920 and was the first county in the United States to be governed by a county manager.
Geography
Arlington County is located in Northern Virginia, just across the Potomac River from Washington, D.C. It is bordered by Fairfax County to the west, Loudoun County to the north, and the District of Columbia to the east. The county is divided into four distinct regions: North Arlington, South Arlington, West Arlington, and East Arlington.
The county is mostly flat, with some rolling hills in the western part of the county. The highest point in the county is the summit of the Navy Annex Hill, which is located in North Arlington and is 400 feet above sea level. The county is home to several parks and trails, including the Potomac Heritage Trail, the Mount Vernon Trail, and the Washington & Old Dominion Trail.
Economy
Arlington County is home to a diverse economy, with a mix of government, technology, and professional services. The county is home to several major employers, including the Department of Defense, the Department of Homeland Security, the Department of State, and the Department of Transportation.
The county is also home to several major technology companies, including Amazon, Microsoft, and Northrop Grumman. The county is also home to several professional services firms, including Deloitte, KPMG, and PricewaterhouseCoopers.
Demographics
As of the 2020 census, Arlington County had a population of 230,050 people. The population is racially and ethnically diverse, with a majority of the population identifying as white (54.3%), followed by Hispanic or Latino (17.2%), Asian (14.2%), and African American (12.2%).
The median household income in the county is $107,817, and the median home value is $637,400. The county has a high rate of educational attainment, with over 90% of adults having at least a high school diploma and over 60% having a bachelor’s degree or higher.
Conclusion
Arlington County, Virginia is a small, self-governing county located in Northern Virginia, just across the Potomac River from Washington, D.C. The county has a rich history, dating back to the Civil War, and is home to a diverse population and economy. The county is home to several major employers, including the Department of Defense, the Department of Homeland Security, and several major technology companies. The county also has a high rate of educational attainment and a median household income of over $107,000.
Common Questions
What is Per Capita Income in Arlington County?
Per Capita income in Arlington County is $85,221.
What is the Median Family Income in Arlington County?
Median Family Income in Arlington County is $188,191.
What is the Median Household income in Arlington County?
Median Household Income in Arlington County is $137,387.
What is Income or Wage Gap in Arlington County?
Income or Wage Gap in Arlington County is 21.6%.
Women in Arlington County earn 78.4 cents for every dollar earned by a man.
What is Family Income Deficit in Arlington County?
Family Income Deficit in Arlington County is $11,458.
Families that are below poverty line in Arlington County earn $11,458 less on average than the poverty threshold level.
What is Inequality or Gini Index in Arlington County?
Inequality or Gini Index in Arlington County is 0.45.
What is the Total Population of Arlington County?
Total Population of Arlington County is 235,845.
What is the Total Male Population of Arlington County?
Total Male Population of Arlington County is 119,030.
What is the Total Female Population of Arlington County?
Total Female Population of Arlington County is 116,815.
What is the Ratio of Males per 100 Females in Arlington County?
There are 101.90 Males per 100 Females in Arlington County.
What is the Ratio of Females per 100 Males in Arlington County?
There are 98.14 Females per 100 Males in Arlington County.
What is the Median Population Age in Arlington County?
Median Population Age in Arlington County is 35.3 Years.
What is the Average Family Size in Arlington County
Average Family Size in Arlington County is 3.0 People.
What is the Average Household Size in Arlington County
Average Household Size in Arlington County is 2.1 People.
How Large is the Labor Force in Arlington County?
There are 154,912 People in the Labor Forcein in Arlington County.
What is the Percentage of People in the Labor Force in Arlington County?
78.4% of People are in the Labor Force in Arlington County.
What is the Unemployment Rate in Arlington County?
Unemployment Rate in Arlington County is 2.8%.