Appomattox County, VA Map & Demographics
Appomattox County Map
Appomattox County Overview
$31,654
PER CAPITA INCOME
$77,972
AVG FAMILY INCOME
$60,041
AVG HOUSEHOLD INCOME
34.6%
WAGE / INCOME GAP [ % ]
65.4¢/ $1
WAGE / INCOME GAP [ $ ]
$11,271
FAMILY INCOME DEFICIT
0.42
INEQUALITY / GINI INDEX
16,253
TOTAL POPULATION
7,910
MALE POPULATION
8,343
FEMALE POPULATION
94.81
MALES / 100 FEMALES
105.47
FEMALES / 100 MALES
43.1
MEDIAN AGE
3.0
AVG FAMILY SIZE
2.5
AVG HOUSEHOLD SIZE
8,121
LABOR FORCE [ PEOPLE ]
62.1%
PERCENT IN LABOR FORCE
3.5%
UNEMPLOYMENT RATE
Appomattox County Area Codes
Income in Appomattox County
Income Overview in Appomattox County
Per Capita Income in Appomattox County is $31,654, while median incomes of families and households are $77,972 and $60,041 respectively.
| Characteristic | Number | Measure |
| Per Capita Income | 16,253 | $31,654 |
| Median Family Income | 4,496 | $77,972 |
| Mean Family Income | 4,496 | $88,086 |
| Median Household Income | 6,535 | $60,041 |
| Mean Household Income | 6,535 | $74,825 |
| Income Deficit | 4,496 | $11,271 |
| Wage / Income Gap (%) | 16,253 | 34.59% |
| Wage / Income Gap ($) | 16,253 | 65.41¢ per $1 |
| Gini / Inequality Index | 16,253 | 0.42 |
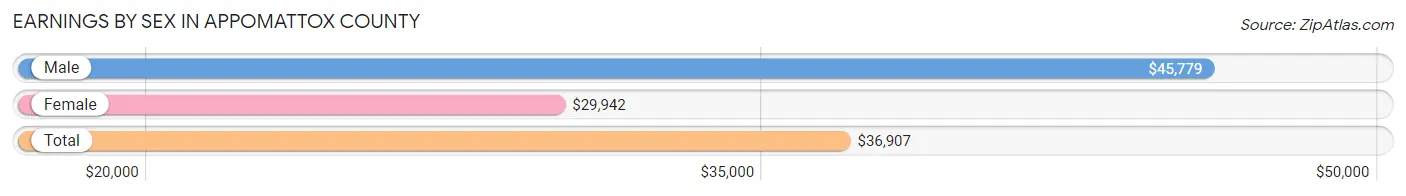
Earnings by Sex in Appomattox County
Average Earnings in Appomattox County are $36,907, $45,779 for men and $29,942 for women, a difference of 34.6%.
| Sex | Number | Average Earnings |
| Male | 4,294 (51.2%) | $45,779 |
| Female | 4,090 (48.8%) | $29,942 |
| Total | 8,384 (100.0%) | $36,907 |
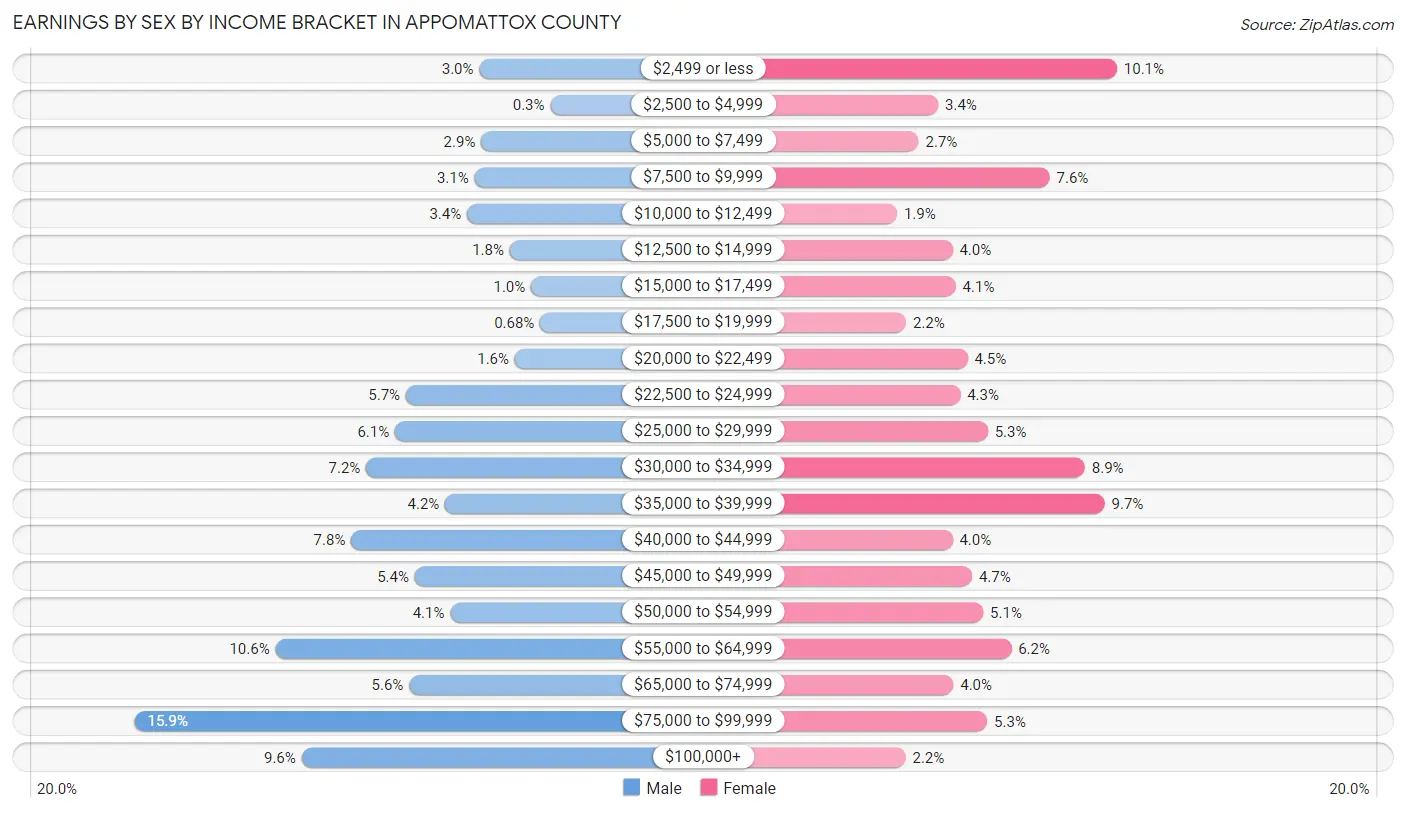
Earnings by Sex by Income Bracket in Appomattox County
The most common earnings brackets in Appomattox County are $75,000 to $99,999 for men (682 | 15.9%) and $2,499 or less for women (414 | 10.1%).
| Income | Male | Female |
| $2,499 or less | 127 (3.0%) | 414 (10.1%) |
| $2,500 to $4,999 | 13 (0.3%) | 140 (3.4%) |
| $5,000 to $7,499 | 124 (2.9%) | 110 (2.7%) |
| $7,500 to $9,999 | 135 (3.1%) | 311 (7.6%) |
| $10,000 to $12,499 | 147 (3.4%) | 77 (1.9%) |
| $12,500 to $14,999 | 78 (1.8%) | 162 (4.0%) |
| $15,000 to $17,499 | 44 (1.0%) | 167 (4.1%) |
| $17,500 to $19,999 | 29 (0.7%) | 91 (2.2%) |
| $20,000 to $22,499 | 70 (1.6%) | 185 (4.5%) |
| $22,500 to $24,999 | 245 (5.7%) | 174 (4.3%) |
| $25,000 to $29,999 | 263 (6.1%) | 216 (5.3%) |
| $30,000 to $34,999 | 309 (7.2%) | 365 (8.9%) |
| $35,000 to $39,999 | 182 (4.2%) | 395 (9.7%) |
| $40,000 to $44,999 | 333 (7.8%) | 162 (4.0%) |
| $45,000 to $49,999 | 231 (5.4%) | 192 (4.7%) |
| $50,000 to $54,999 | 174 (4.1%) | 209 (5.1%) |
| $55,000 to $64,999 | 455 (10.6%) | 252 (6.2%) |
| $65,000 to $74,999 | 240 (5.6%) | 163 (4.0%) |
| $75,000 to $99,999 | 682 (15.9%) | 215 (5.3%) |
| $100,000+ | 413 (9.6%) | 90 (2.2%) |
| Total | 4,294 (100.0%) | 4,090 (100.0%) |
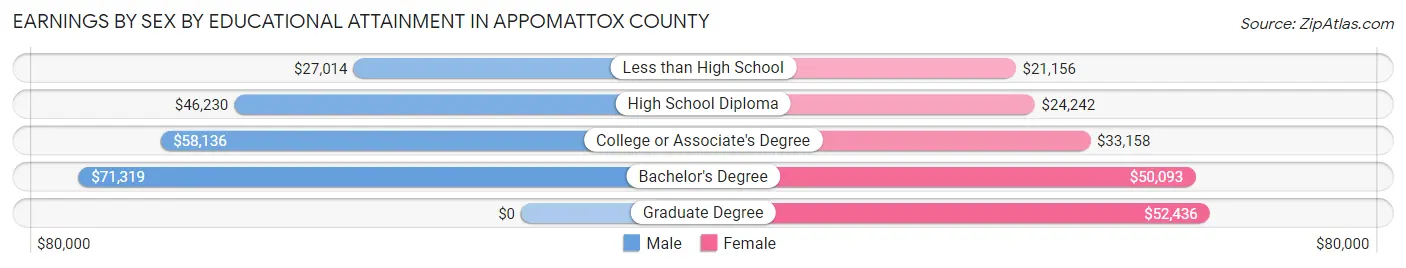
Earnings by Sex by Educational Attainment in Appomattox County
Average earnings in Appomattox County are $50,883 for men and $32,222 for women, a difference of 36.7%. Men with an educational attainment of bachelor's degree enjoy the highest average annual earnings of $71,319, while those with less than high school education earn the least with $27,014. Women with an educational attainment of graduate degree earn the most with the average annual earnings of $52,436, while those with less than high school education have the smallest earnings of $21,156.
| Educational Attainment | Male Income | Female Income |
| Less than High School | $27,014 | $21,156 |
| High School Diploma | $46,230 | $24,242 |
| College or Associate's Degree | $58,136 | $33,158 |
| Bachelor's Degree | $71,319 | $50,093 |
| Graduate Degree | - | - |
| Total | $50,883 | $32,222 |
Family Income in Appomattox County
Family Income Brackets in Appomattox County
According to the Appomattox County family income data, there are 1,021 families falling into the $100,000 to $149,999 income range, which is the most common income bracket and makes up 22.7% of all families. Conversely, the $10,000 to $14,999 income bracket is the least frequent group with only 58 families (1.3%) belonging to this category.
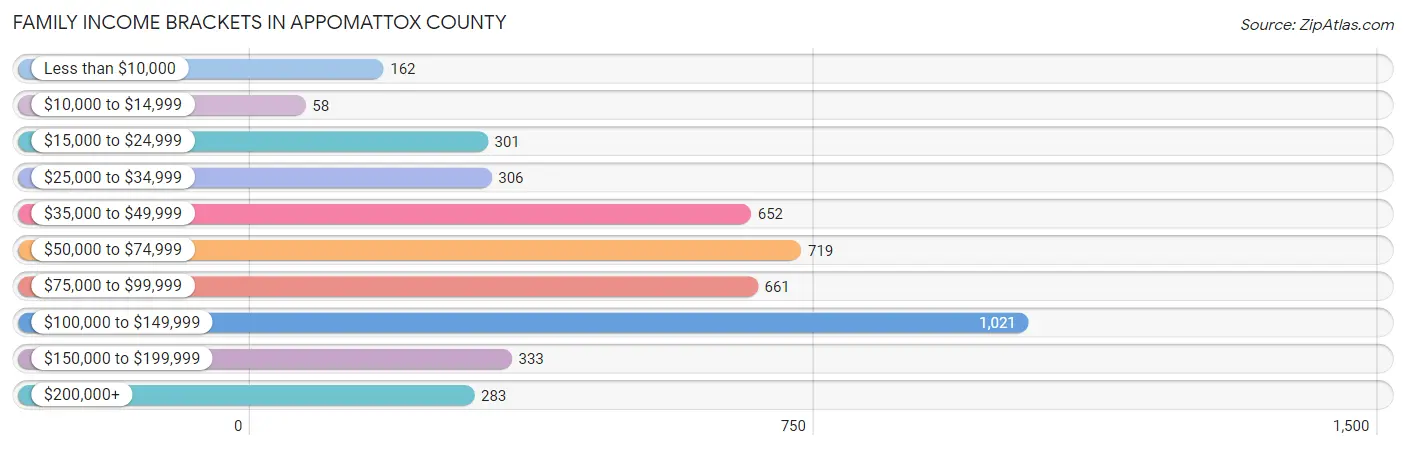
| Income Bracket | # Families | % Families |
| Less than $10,000 | 162 | 3.6% |
| $10,000 to $14,999 | 58 | 1.3% |
| $15,000 to $24,999 | 301 | 6.7% |
| $25,000 to $34,999 | 306 | 6.8% |
| $35,000 to $49,999 | 652 | 14.5% |
| $50,000 to $74,999 | 719 | 16.0% |
| $75,000 to $99,999 | 661 | 14.7% |
| $100,000 to $149,999 | 1,021 | 22.7% |
| $150,000 to $199,999 | 333 | 7.4% |
| $200,000+ | 283 | 6.3% |
Family Income by Famaliy Size in Appomattox County
4-person families (789 | 17.5%) account for the highest median family income in Appomattox County with $102,541 per family, while 2-person families (2,383 | 53.0%) have the highest median income of $32,446 per family member.
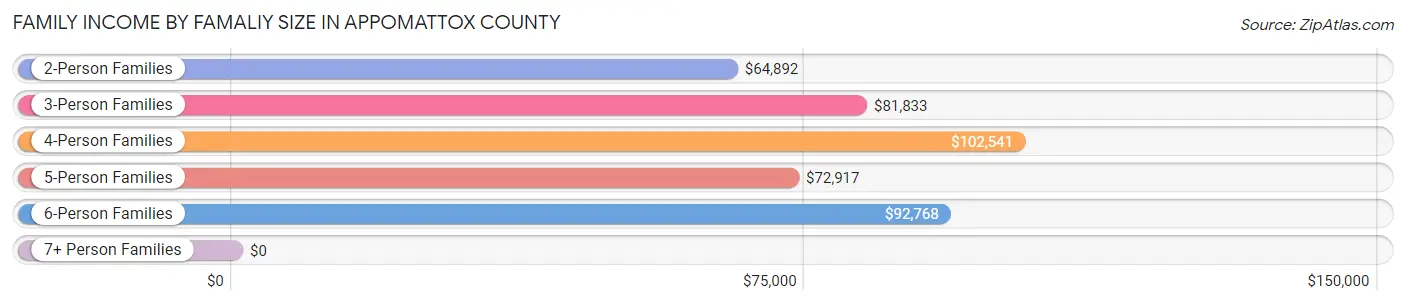
| Income Bracket | # Families | Median Income |
| 2-Person Families | 2,383 (53.0%) | $64,892 |
| 3-Person Families | 850 (18.9%) | $81,833 |
| 4-Person Families | 789 (17.5%) | $102,541 |
| 5-Person Families | 340 (7.6%) | $72,917 |
| 6-Person Families | 71 (1.6%) | $92,768 |
| 7+ Person Families | 63 (1.4%) | $0 |
| Total | 4,496 (100.0%) | $77,972 |
Family Income by Number of Earners in Appomattox County
The median family income in Appomattox County is $77,972, with families comprising 3+ earners (537) having the highest median family income of $107,768, while families with no earners (757) have the lowest median family income of $41,393, accounting for 11.9% and 16.8% of families, respectively.
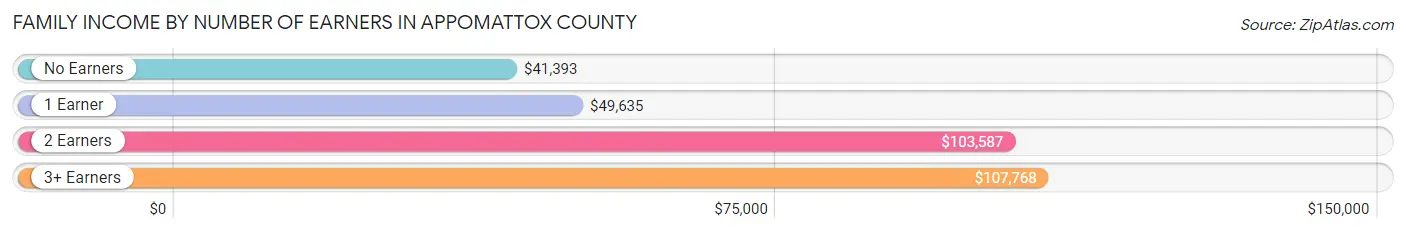
| Number of Earners | # Families | Median Income |
| No Earners | 757 (16.8%) | $41,393 |
| 1 Earner | 1,696 (37.7%) | $49,635 |
| 2 Earners | 1,506 (33.5%) | $103,587 |
| 3+ Earners | 537 (11.9%) | $107,768 |
| Total | 4,496 (100.0%) | $77,972 |
Household Income in Appomattox County
Household Income Brackets in Appomattox County
With 1,131 households falling in the category, the $100,000 to $149,999 income range is the most frequent in Appomattox County, accounting for 17.3% of all households. In contrast, only 314 households (4.8%) fall into the $200,000+ income bracket, making it the least populous group.
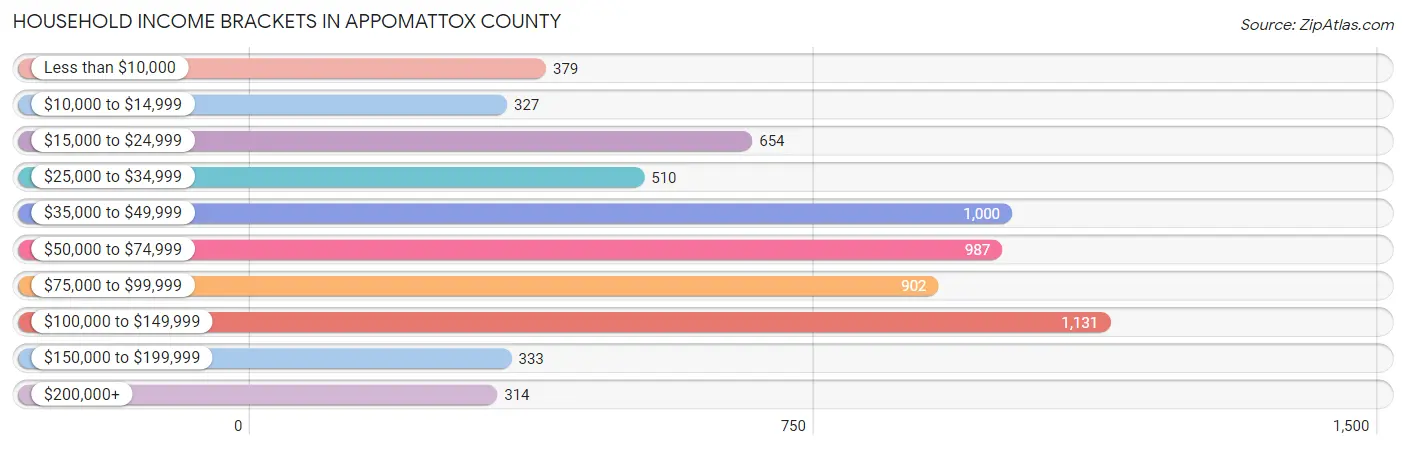
| Income Bracket | # Households | % Households |
| Less than $10,000 | 379 | 5.8% |
| $10,000 to $14,999 | 327 | 5.0% |
| $15,000 to $24,999 | 654 | 10.0% |
| $25,000 to $34,999 | 510 | 7.8% |
| $35,000 to $49,999 | 1,000 | 15.3% |
| $50,000 to $74,999 | 987 | 15.1% |
| $75,000 to $99,999 | 902 | 13.8% |
| $100,000 to $149,999 | 1,131 | 17.3% |
| $150,000 to $199,999 | 333 | 5.1% |
| $200,000+ | 314 | 4.8% |
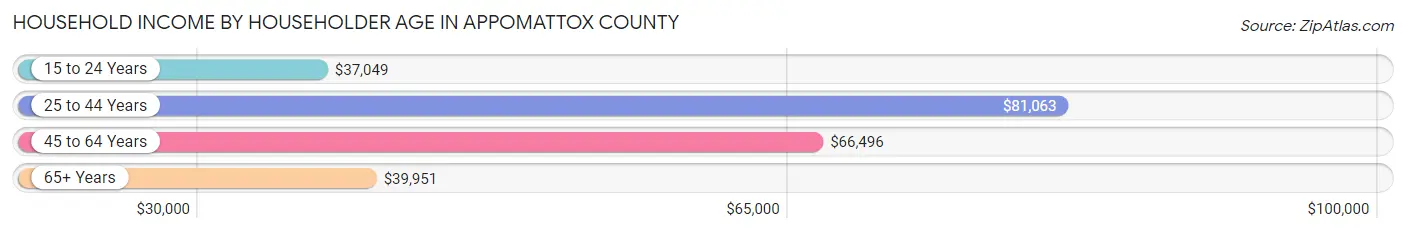
Household Income by Householder Age in Appomattox County
The median household income in Appomattox County is $60,041, with the highest median household income of $81,063 found in the 25 to 44 years age bracket for the primary householder. A total of 1,826 households (27.9%) fall into this category. Meanwhile, the 15 to 24 years age bracket for the primary householder has the lowest median household income of $37,049, with 115 households (1.8%) in this group.
| Income Bracket | # Households | Median Income |
| 15 to 24 Years | 115 (1.8%) | $37,049 |
| 25 to 44 Years | 1,826 (27.9%) | $81,063 |
| 45 to 64 Years | 2,417 (37.0%) | $66,496 |
| 65+ Years | 2,177 (33.3%) | $39,951 |
| Total | 6,535 (100.0%) | $60,041 |
Poverty in Appomattox County
Income Below Poverty by Sex and Age in Appomattox County
With 13.1% poverty level for males and 14.5% for females among the residents of Appomattox County, 15 year old males and under 5 year old females are the most vulnerable to poverty, with 68 males (66.7%) and 165 females (31.4%) in their respective age groups living below the poverty level.
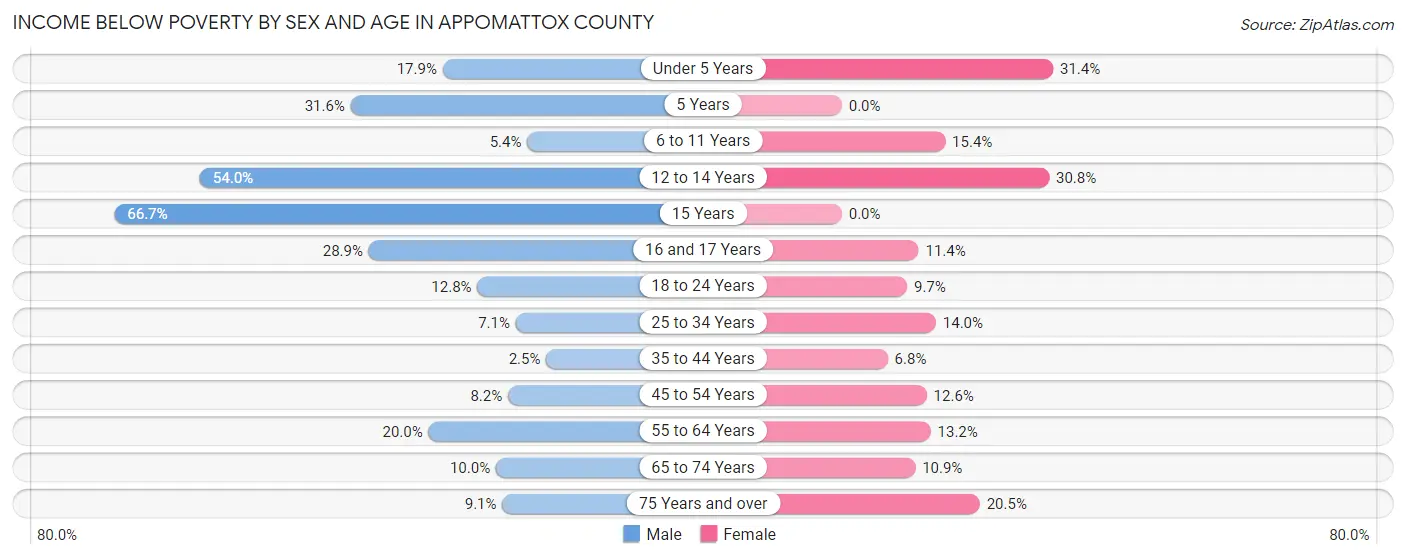
| Age Bracket | Male | Female |
| Under 5 Years | 84 (17.9%) | 165 (31.4%) |
| 5 Years | 18 (31.6%) | 0 (0.0%) |
| 6 to 11 Years | 34 (5.3%) | 103 (15.3%) |
| 12 to 14 Years | 150 (54.0%) | 92 (30.8%) |
| 15 Years | 68 (66.7%) | 0 (0.0%) |
| 16 and 17 Years | 52 (28.9%) | 22 (11.4%) |
| 18 to 24 Years | 85 (12.8%) | 53 (9.7%) |
| 25 to 34 Years | 58 (7.1%) | 150 (14.0%) |
| 35 to 44 Years | 26 (2.5%) | 59 (6.8%) |
| 45 to 54 Years | 83 (8.2%) | 131 (12.6%) |
| 55 to 64 Years | 225 (20.0%) | 157 (13.2%) |
| 65 to 74 Years | 91 (10.0%) | 110 (10.9%) |
| 75 Years and over | 54 (9.1%) | 155 (20.5%) |
| Total | 1,028 (13.1%) | 1,197 (14.5%) |
Income Above Poverty by Sex and Age in Appomattox County
According to the poverty statistics in Appomattox County, males aged 35 to 44 years and females aged 5 years are the age groups that are most secure financially, with 97.5% of males and 100.0% of females in these age groups living above the poverty line.
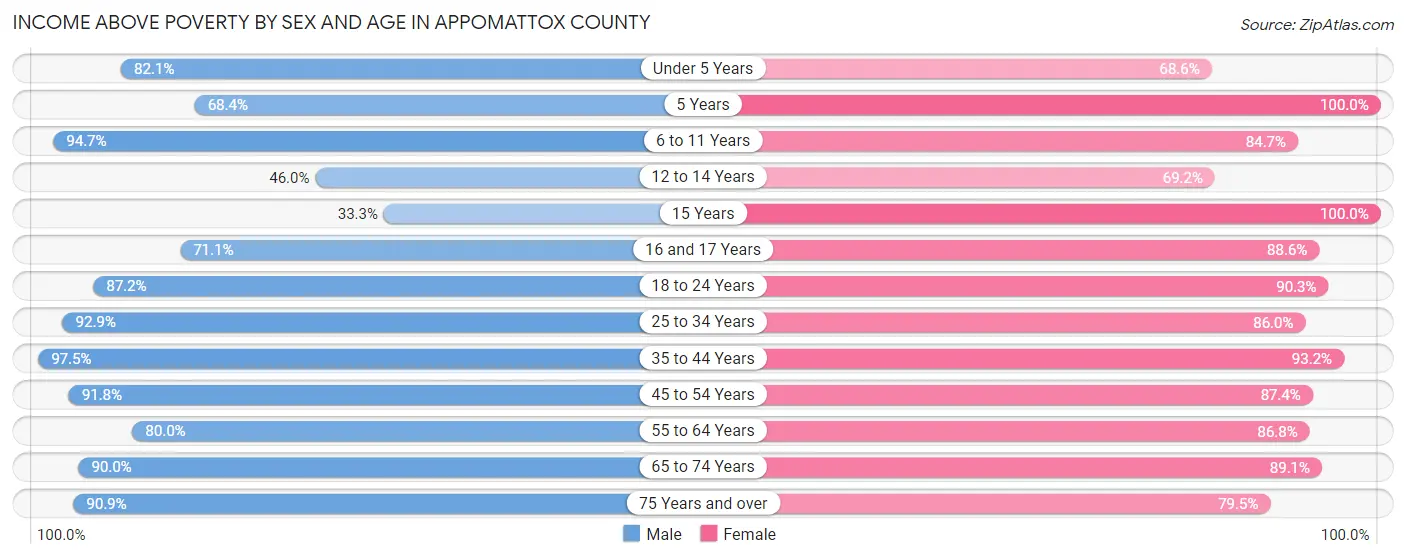
| Age Bracket | Male | Female |
| Under 5 Years | 385 (82.1%) | 361 (68.6%) |
| 5 Years | 39 (68.4%) | 17 (100.0%) |
| 6 to 11 Years | 601 (94.7%) | 568 (84.7%) |
| 12 to 14 Years | 128 (46.0%) | 207 (69.2%) |
| 15 Years | 34 (33.3%) | 87 (100.0%) |
| 16 and 17 Years | 128 (71.1%) | 171 (88.6%) |
| 18 to 24 Years | 581 (87.2%) | 494 (90.3%) |
| 25 to 34 Years | 764 (92.9%) | 924 (86.0%) |
| 35 to 44 Years | 1,003 (97.5%) | 808 (93.2%) |
| 45 to 54 Years | 928 (91.8%) | 909 (87.4%) |
| 55 to 64 Years | 899 (80.0%) | 1,033 (86.8%) |
| 65 to 74 Years | 819 (90.0%) | 899 (89.1%) |
| 75 Years and over | 542 (90.9%) | 602 (79.5%) |
| Total | 6,851 (87.0%) | 7,080 (85.5%) |
Income Below Poverty Among Married-Couple Families in Appomattox County
The poverty statistics for married-couple families in Appomattox County show that 4.7% or 168 of the total 3,568 families live below the poverty line. Families with 1 or 2 children have the highest poverty rate of 5.9%, comprising of 70 families. On the other hand, families with 5 or more children have the lowest poverty rate of 0.0%, which includes 0 families.
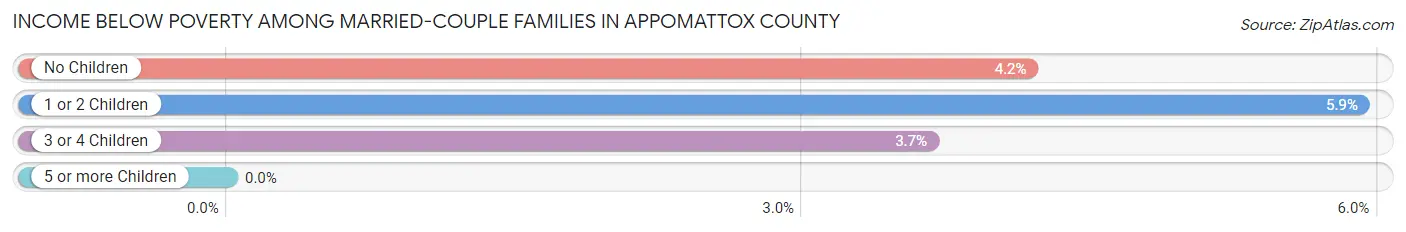
| Children | Above Poverty | Below Poverty |
| No Children | 2,085 (95.8%) | 91 (4.2%) |
| 1 or 2 Children | 1,115 (94.1%) | 70 (5.9%) |
| 3 or 4 Children | 184 (96.3%) | 7 (3.7%) |
| 5 or more Children | 16 (100.0%) | 0 (0.0%) |
| Total | 3,400 (95.3%) | 168 (4.7%) |
Income Below Poverty Among Single-Parent Households in Appomattox County
According to the poverty data in Appomattox County, 36.9% or 73 single-father households and 25.9% or 189 single-mother households are living below the poverty line. Among single-father households, those with no children have the highest poverty rate, with 52 households (83.9%) experiencing poverty. Likewise, among single-mother households, those with 3 or 4 children have the highest poverty rate, with 127 households (85.8%) falling below the poverty line.
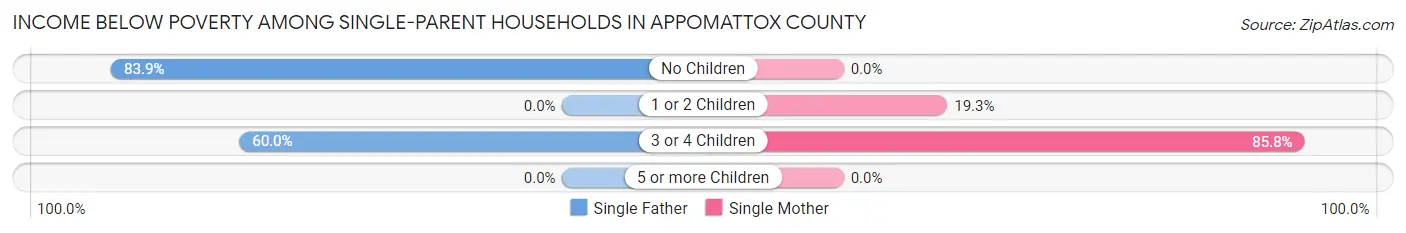
| Children | Single Father | Single Mother |
| No Children | 52 (83.9%) | 0 (0.0%) |
| 1 or 2 Children | 0 (0.0%) | 62 (19.3%) |
| 3 or 4 Children | 21 (60.0%) | 127 (85.8%) |
| 5 or more Children | 0 (0.0%) | 0 (0.0%) |
| Total | 73 (36.9%) | 189 (25.9%) |
Income Below Poverty Among Married-Couple vs Single-Parent Households in Appomattox County
The poverty data for Appomattox County shows that 168 of the married-couple family households (4.7%) and 262 of the single-parent households (28.2%) are living below the poverty level. Within the married-couple family households, those with 1 or 2 children have the highest poverty rate, with 70 households (5.9%) falling below the poverty line. Among the single-parent households, those with 3 or 4 children have the highest poverty rate, with 148 household (80.9%) living below poverty.
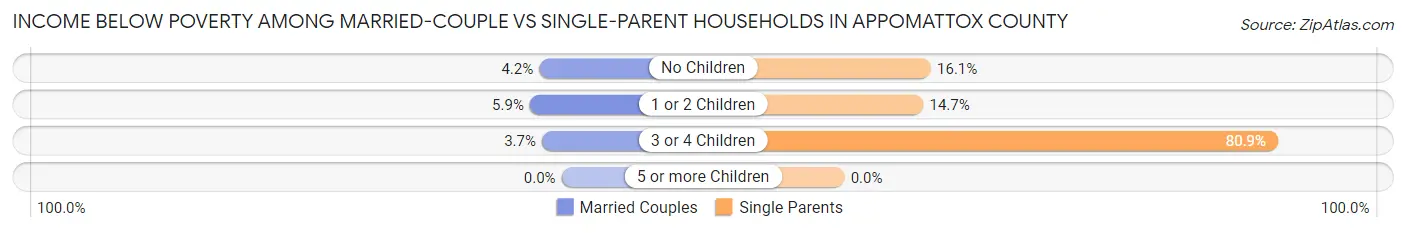
| Children | Married-Couple Families | Single-Parent Households |
| No Children | 91 (4.2%) | 52 (16.1%) |
| 1 or 2 Children | 70 (5.9%) | 62 (14.7%) |
| 3 or 4 Children | 7 (3.7%) | 148 (80.9%) |
| 5 or more Children | 0 (0.0%) | 0 (0.0%) |
| Total | 168 (4.7%) | 262 (28.2%) |
Race in Appomattox County
The most populous races in Appomattox County are White / Caucasian (12,621 | 77.6%), Black / African American (2,943 | 18.1%), and Hispanic or Latino (352 | 2.2%).
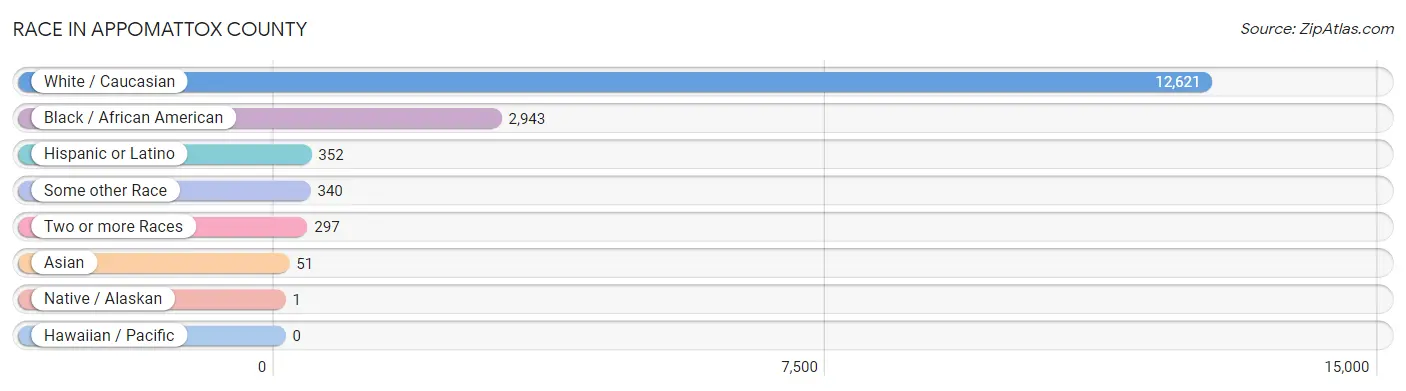
| Race | # Population | % Population |
| Asian | 51 | 0.3% |
| Black / African American | 2,943 | 18.1% |
| Hawaiian / Pacific | 0 | 0.0% |
| Hispanic or Latino | 352 | 2.2% |
| Native / Alaskan | 1 | 0.0% |
| White / Caucasian | 12,621 | 77.6% |
| Two or more Races | 297 | 1.8% |
| Some other Race | 340 | 2.1% |
| Total | 16,253 | 100.0% |
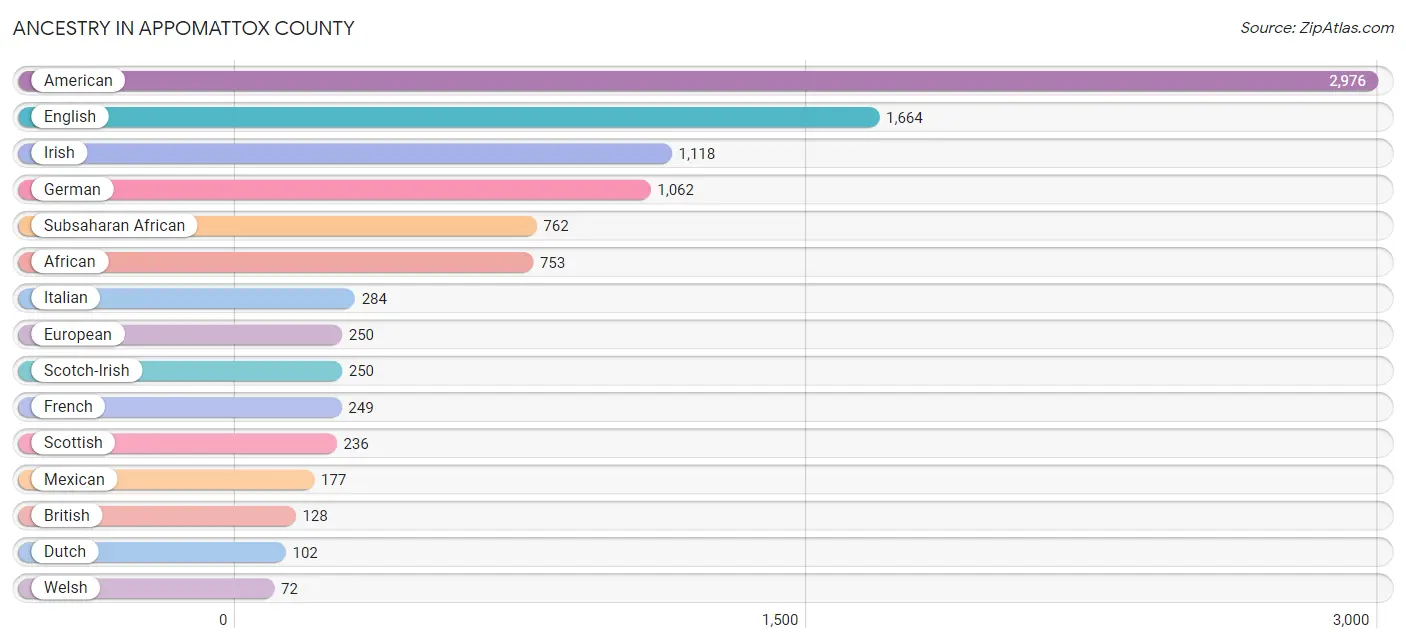
Ancestry in Appomattox County
The most populous ancestries reported in Appomattox County are American (2,976 | 18.3%), English (1,664 | 10.2%), Irish (1,118 | 6.9%), German (1,062 | 6.5%), and Subsaharan African (762 | 4.7%), together accounting for 46.7% of all Appomattox County residents.
| Ancestry | # Population | % Population |
| African | 753 | 4.6% |
| American | 2,976 | 18.3% |
| Apache | 7 | 0.0% |
| Austrian | 36 | 0.2% |
| Belgian | 14 | 0.1% |
| Bhutanese | 23 | 0.1% |
| Blackfeet | 15 | 0.1% |
| Bolivian | 51 | 0.3% |
| British | 128 | 0.8% |
| Burmese | 25 | 0.2% |
| Canadian | 14 | 0.1% |
| Central American | 55 | 0.3% |
| Cherokee | 32 | 0.2% |
| Chilean | 7 | 0.0% |
| Czech | 20 | 0.1% |
| Czechoslovakian | 6 | 0.0% |
| Danish | 6 | 0.0% |
| Dutch | 102 | 0.6% |
| English | 1,664 | 10.2% |
| European | 250 | 1.5% |
| Finnish | 12 | 0.1% |
| French | 249 | 1.5% |
| French Canadian | 44 | 0.3% |
| German | 1,062 | 6.5% |
| Greek | 12 | 0.1% |
| Guatemalan | 48 | 0.3% |
| Honduran | 7 | 0.0% |
| Hungarian | 24 | 0.2% |
| Irish | 1,118 | 6.9% |
| Iroquois | 6 | 0.0% |
| Italian | 284 | 1.8% |
| Korean | 10 | 0.1% |
| Lithuanian | 14 | 0.1% |
| Mexican | 177 | 1.1% |
| Northern European | 10 | 0.1% |
| Norwegian | 53 | 0.3% |
| Polish | 65 | 0.4% |
| Portuguese | 44 | 0.3% |
| Puerto Rican | 14 | 0.1% |
| Romanian | 15 | 0.1% |
| Russian | 40 | 0.3% |
| Scandinavian | 23 | 0.1% |
| Scotch-Irish | 250 | 1.5% |
| Scottish | 236 | 1.5% |
| Slovak | 19 | 0.1% |
| South African | 9 | 0.1% |
| South American | 58 | 0.4% |
| Spaniard | 13 | 0.1% |
| Subsaharan African | 762 | 4.7% |
| Swedish | 29 | 0.2% |
| Swiss | 31 | 0.2% |
| Thai | 32 | 0.2% |
| Ukrainian | 21 | 0.1% |
| Welsh | 72 | 0.4% | View All 54 Rows |
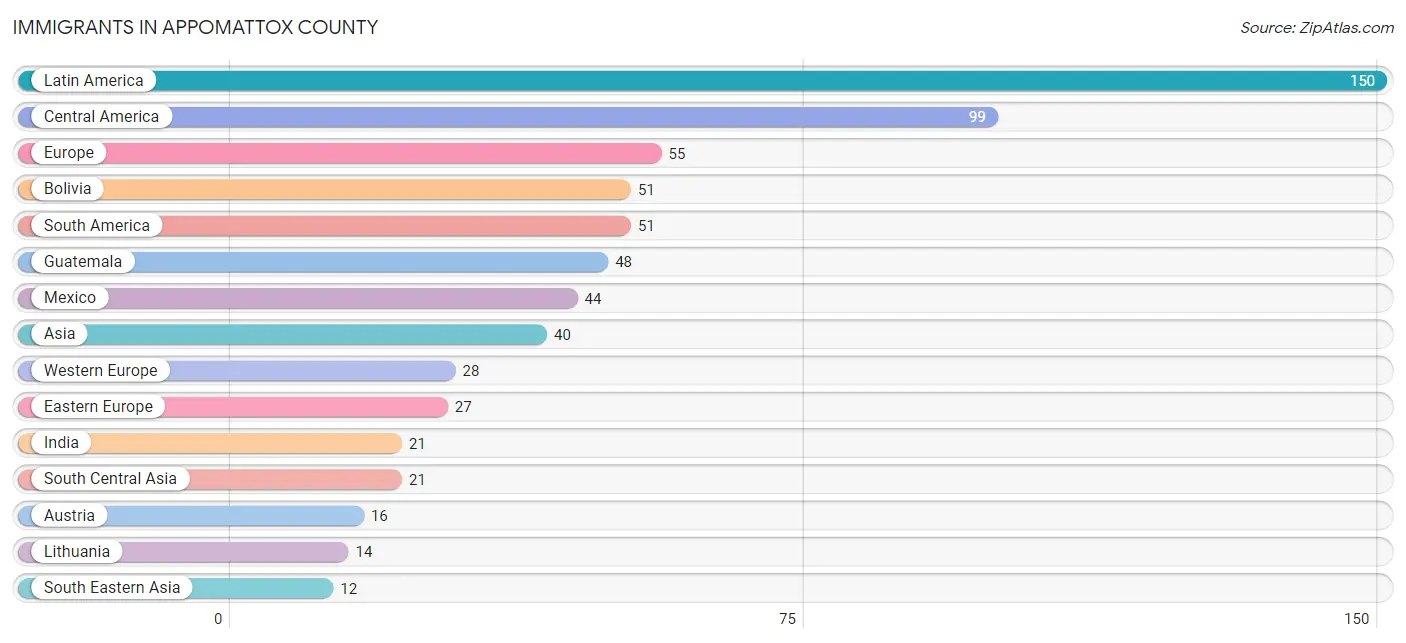
Immigrants in Appomattox County
The most numerous immigrant groups reported in Appomattox County came from Latin America (150 | 0.9%), Central America (99 | 0.6%), Europe (55 | 0.3%), Bolivia (51 | 0.3%), and South America (51 | 0.3%), together accounting for 2.5% of all Appomattox County residents.
| Immigration Origin | # Population | % Population |
| Asia | 40 | 0.3% |
| Austria | 16 | 0.1% |
| Bolivia | 51 | 0.3% |
| Canada | 7 | 0.0% |
| Central America | 99 | 0.6% |
| Czechoslovakia | 6 | 0.0% |
| Eastern Asia | 7 | 0.0% |
| Eastern Europe | 27 | 0.2% |
| Europe | 55 | 0.3% |
| Germany | 7 | 0.0% |
| Guatemala | 48 | 0.3% |
| Honduras | 7 | 0.0% |
| Hungary | 7 | 0.0% |
| India | 21 | 0.1% |
| Korea | 7 | 0.0% |
| Latin America | 150 | 0.9% |
| Lithuania | 14 | 0.1% |
| Mexico | 44 | 0.3% |
| Netherlands | 5 | 0.0% |
| South America | 51 | 0.3% |
| South Central Asia | 21 | 0.1% |
| South Eastern Asia | 12 | 0.1% |
| Vietnam | 12 | 0.1% |
| Western Europe | 28 | 0.2% | View All 24 Rows |
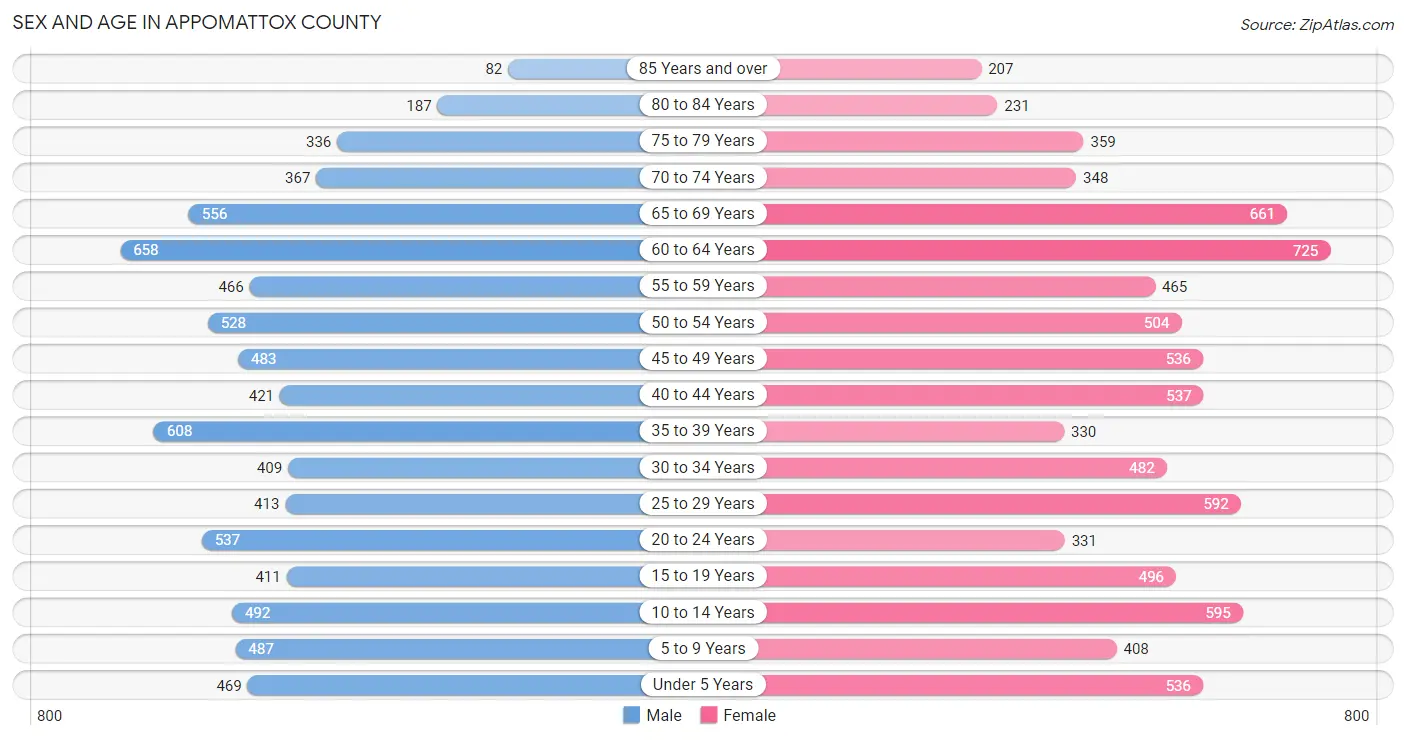
Sex and Age in Appomattox County
Sex and Age in Appomattox County
The most populous age groups in Appomattox County are 60 to 64 Years (658 | 8.3%) for men and 60 to 64 Years (725 | 8.7%) for women.
| Age Bracket | Male | Female |
| Under 5 Years | 469 (5.9%) | 536 (6.4%) |
| 5 to 9 Years | 487 (6.2%) | 408 (4.9%) |
| 10 to 14 Years | 492 (6.2%) | 595 (7.1%) |
| 15 to 19 Years | 411 (5.2%) | 496 (5.9%) |
| 20 to 24 Years | 537 (6.8%) | 331 (4.0%) |
| 25 to 29 Years | 413 (5.2%) | 592 (7.1%) |
| 30 to 34 Years | 409 (5.2%) | 482 (5.8%) |
| 35 to 39 Years | 608 (7.7%) | 330 (4.0%) |
| 40 to 44 Years | 421 (5.3%) | 537 (6.4%) |
| 45 to 49 Years | 483 (6.1%) | 536 (6.4%) |
| 50 to 54 Years | 528 (6.7%) | 504 (6.0%) |
| 55 to 59 Years | 466 (5.9%) | 465 (5.6%) |
| 60 to 64 Years | 658 (8.3%) | 725 (8.7%) |
| 65 to 69 Years | 556 (7.0%) | 661 (7.9%) |
| 70 to 74 Years | 367 (4.6%) | 348 (4.2%) |
| 75 to 79 Years | 336 (4.3%) | 359 (4.3%) |
| 80 to 84 Years | 187 (2.4%) | 231 (2.8%) |
| 85 Years and over | 82 (1.0%) | 207 (2.5%) |
| Total | 7,910 (100.0%) | 8,343 (100.0%) |
Families and Households in Appomattox County
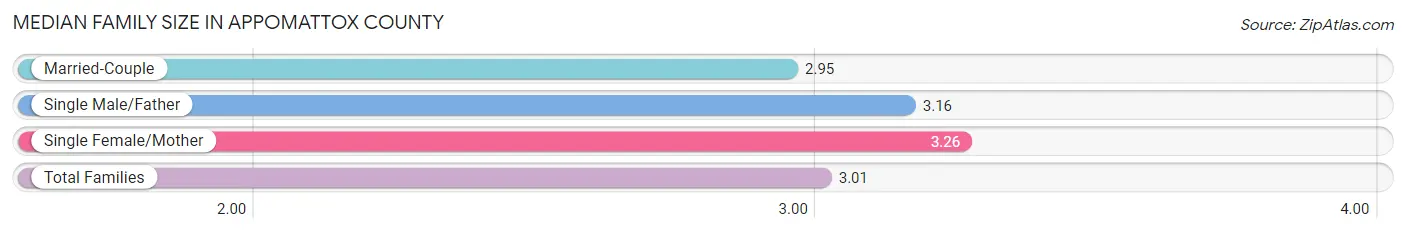
Median Family Size in Appomattox County
The median family size in Appomattox County is 3.01 persons per family, with single female/mother families (730 | 16.2%) accounting for the largest median family size of 3.26 persons per family. On the other hand, married-couple families (3,568 | 79.4%) represent the smallest median family size with 2.95 persons per family.
| Family Type | # Families | Family Size |
| Married-Couple | 3,568 (79.4%) | 2.95 |
| Single Male/Father | 198 (4.4%) | 3.16 |
| Single Female/Mother | 730 (16.2%) | 3.26 |
| Total Families | 4,496 (100.0%) | 3.01 |
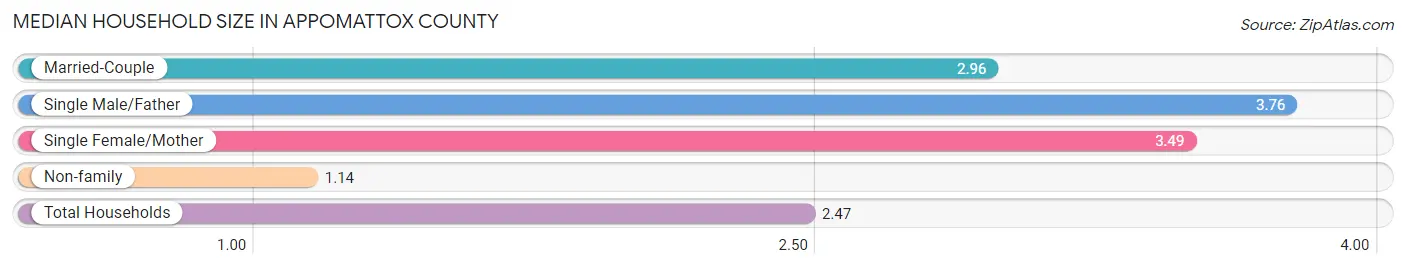
Median Household Size in Appomattox County
The median household size in Appomattox County is 2.47 persons per household, with single male/father households (198 | 3.0%) accounting for the largest median household size of 3.76 persons per household. non-family households (2,039 | 31.2%) represent the smallest median household size with 1.14 persons per household.
| Household Type | # Households | Household Size |
| Married-Couple | 3,568 (54.6%) | 2.96 |
| Single Male/Father | 198 (3.0%) | 3.76 |
| Single Female/Mother | 730 (11.2%) | 3.49 |
| Non-family | 2,039 (31.2%) | 1.14 |
| Total Households | 6,535 (100.0%) | 2.47 |
Household Size by Marriage Status in Appomattox County
Out of a total of 6,535 households in Appomattox County, 4,496 (68.8%) are family households, while 2,039 (31.2%) are nonfamily households. The most numerous type of family households are 2-person households, comprising 2,252, and the most common type of nonfamily households are 1-person households, comprising 1,786.
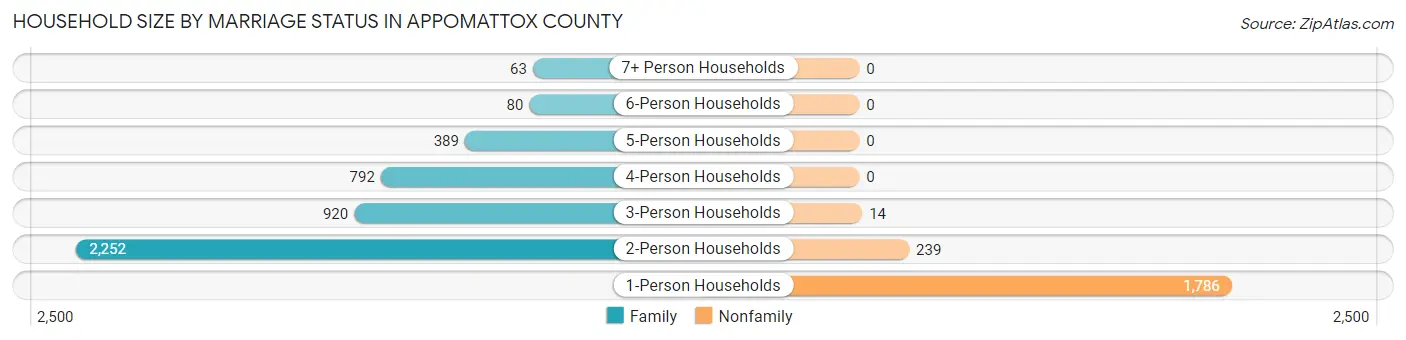
| Household Size | Family Households | Nonfamily Households |
| 1-Person Households | - | 1,786 (27.3%) |
| 2-Person Households | 2,252 (34.5%) | 239 (3.7%) |
| 3-Person Households | 920 (14.1%) | 14 (0.2%) |
| 4-Person Households | 792 (12.1%) | 0 (0.0%) |
| 5-Person Households | 389 (5.9%) | 0 (0.0%) |
| 6-Person Households | 80 (1.2%) | 0 (0.0%) |
| 7+ Person Households | 63 (1.0%) | 0 (0.0%) |
| Total | 4,496 (68.8%) | 2,039 (31.2%) |
Female Fertility in Appomattox County
Fertility by Age in Appomattox County
Average fertility rate in Appomattox County is 60.0 births per 1,000 women. Women in the age bracket of 20 to 34 years have the highest fertility rate with 123.0 births per 1,000 women. Women in the age bracket of 20 to 34 years acount for 84.4% of all women with births.
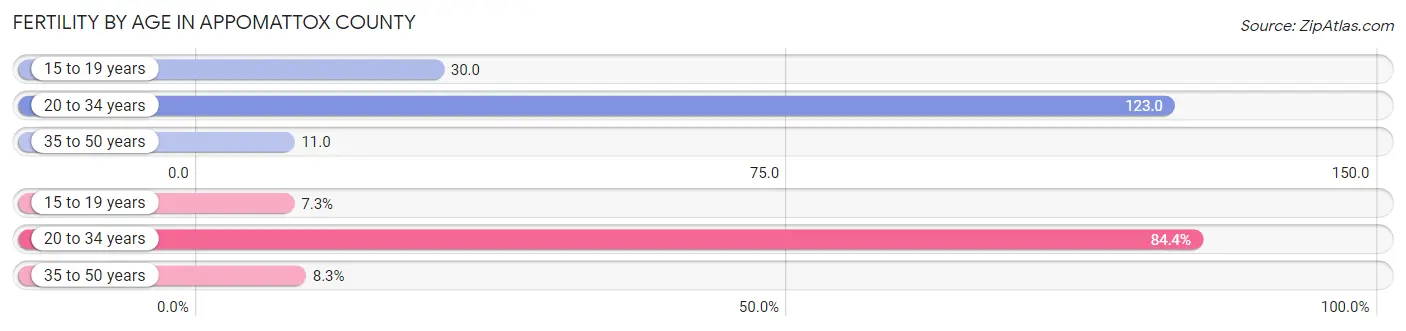
| Age Bracket | Women with Births | Births / 1,000 Women |
| 15 to 19 years | 15 (7.3%) | 30.0 |
| 20 to 34 years | 173 (84.4%) | 123.0 |
| 35 to 50 years | 17 (8.3%) | 11.0 |
| Total | 205 (100.0%) | 60.0 |
Fertility by Age by Marriage Status in Appomattox County
38.0% of women with births (205) in Appomattox County are married. The highest percentage of unmarried women with births falls into 15 to 19 years age bracket with 100.0% of them unmarried at the time of birth, while the lowest percentage of unmarried women with births belong to 35 to 50 years age bracket with 0.0% of them unmarried.
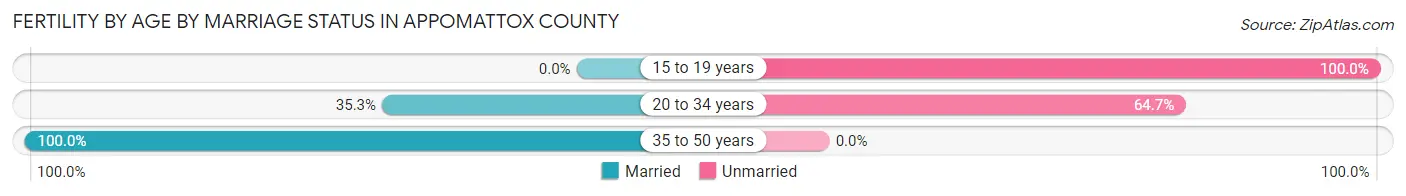
| Age Bracket | Married | Unmarried |
| 15 to 19 years | 0 (0.0%) | 15 (100.0%) |
| 20 to 34 years | 61 (35.3%) | 112 (64.7%) |
| 35 to 50 years | 17 (100.0%) | 0 (0.0%) |
| Total | 78 (38.1%) | 127 (62.0%) |
Fertility by Education in Appomattox County
Average fertility rate in Appomattox County is 60.0 births per 1,000 women. Women with the education attainment of less than high school have the highest fertility rate of 89.0 births per 1,000 women, while women with the education attainment of graduate degree have the lowest fertility at 30.0 births per 1,000 women. Women with the education attainment of high school diploma represent 36.1% of all women with births.
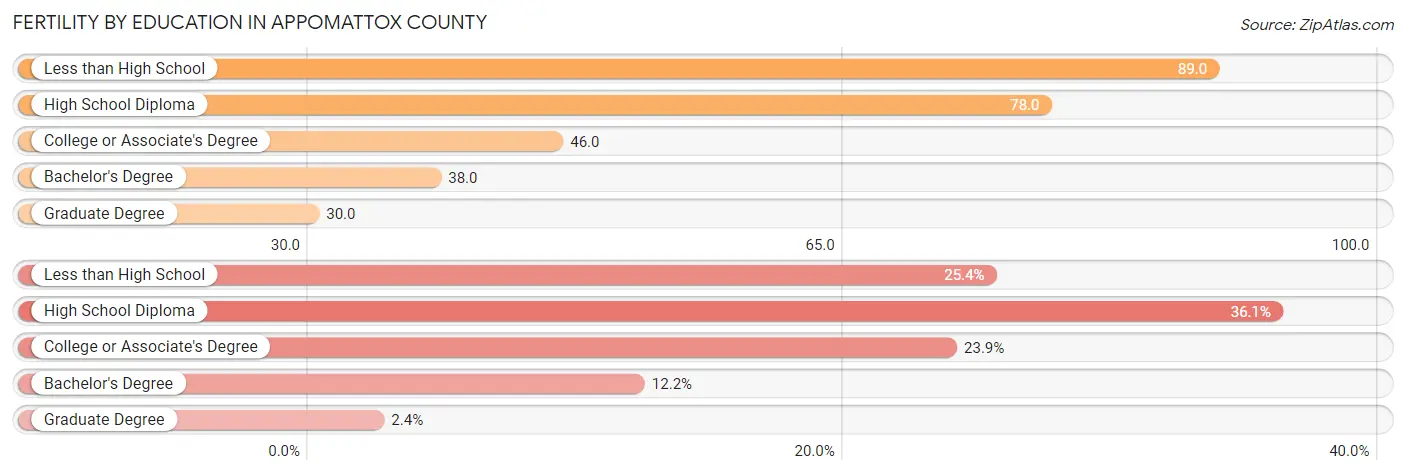
| Educational Attainment | Women with Births | Births / 1,000 Women |
| Less than High School | 52 (25.4%) | 89.0 |
| High School Diploma | 74 (36.1%) | 78.0 |
| College or Associate's Degree | 49 (23.9%) | 46.0 |
| Bachelor's Degree | 25 (12.2%) | 38.0 |
| Graduate Degree | 5 (2.4%) | 30.0 |
| Total | 205 (100.0%) | 60.0 |
Fertility by Education by Marriage Status in Appomattox County
62.0% of women with births in Appomattox County are unmarried. Women with the educational attainment of bachelor's degree are most likely to be married with 100.0% of them married at childbirth, while women with the educational attainment of less than high school are least likely to be married with 100.0% of them unmarried at childbirth.
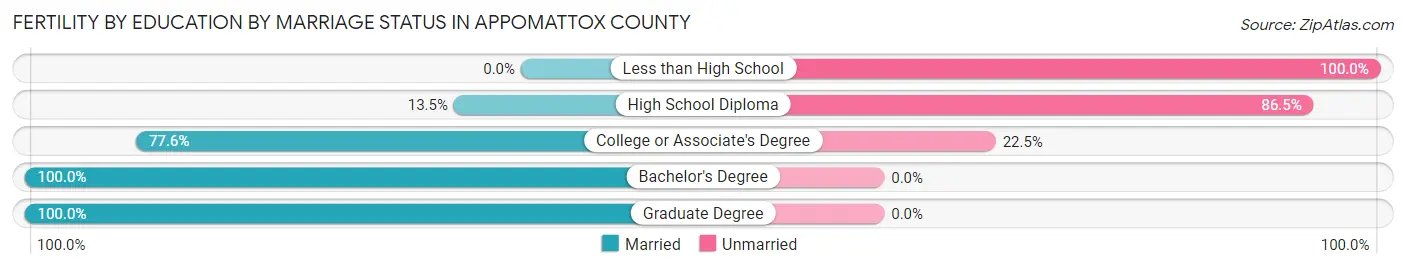
| Educational Attainment | Married | Unmarried |
| Less than High School | 0 (0.0%) | 52 (100.0%) |
| High School Diploma | 10 (13.5%) | 64 (86.5%) |
| College or Associate's Degree | 38 (77.5%) | 11 (22.5%) |
| Bachelor's Degree | 25 (100.0%) | 0 (0.0%) |
| Graduate Degree | 5 (100.0%) | 0 (0.0%) |
| Total | 78 (38.1%) | 127 (62.0%) |
Employment Characteristics in Appomattox County
Employment by Class of Employer in Appomattox County
Among the 7,614 employed individuals in Appomattox County, private company employees (5,011 | 65.8%), local government employees (713 | 9.4%), and not-for-profit organizations (665 | 8.7%) make up the most common classes of employment.
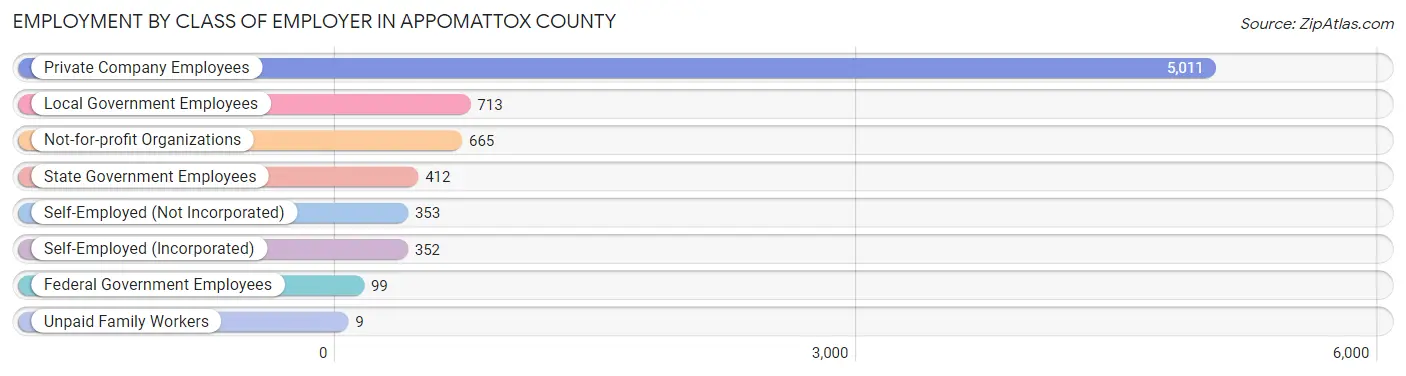
| Employer Class | # Employees | % Employees |
| Private Company Employees | 5,011 | 65.8% |
| Self-Employed (Incorporated) | 352 | 4.6% |
| Self-Employed (Not Incorporated) | 353 | 4.6% |
| Not-for-profit Organizations | 665 | 8.7% |
| Local Government Employees | 713 | 9.4% |
| State Government Employees | 412 | 5.4% |
| Federal Government Employees | 99 | 1.3% |
| Unpaid Family Workers | 9 | 0.1% |
| Total | 7,614 | 100.0% |
Employment Status by Age in Appomattox County
According to the labor force statistics for Appomattox County, out of the total population over 16 years of age (13,077), 62.1% or 8,121 individuals are in the labor force, with 3.5% or 284 of them unemployed. The age group with the highest labor force participation rate is 20 to 24 years, with 95.0% or 825 individuals in the labor force. Within the labor force, the 16 to 19 years age range has the highest percentage of unemployed individuals, with 16.3% or 60 of them being unemployed.
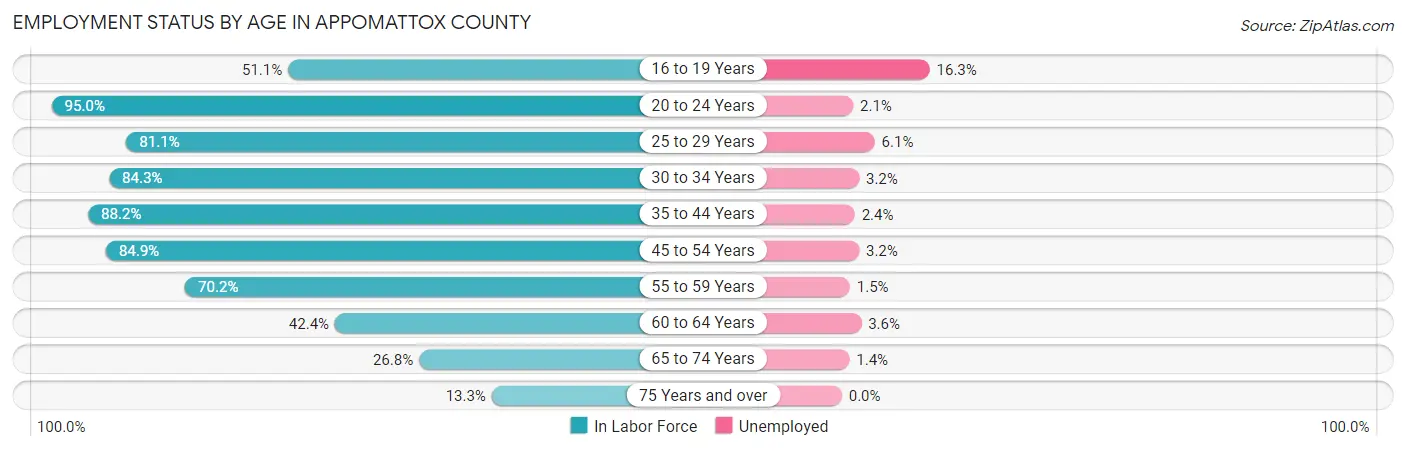
| Age Bracket | In Labor Force | Unemployed |
| 16 to 19 Years | 367 (51.1%) | 60 (16.3%) |
| 20 to 24 Years | 825 (95.0%) | 17 (2.1%) |
| 25 to 29 Years | 815 (81.1%) | 50 (6.1%) |
| 30 to 34 Years | 751 (84.3%) | 24 (3.2%) |
| 35 to 44 Years | 1,672 (88.2%) | 40 (2.4%) |
| 45 to 54 Years | 1,741 (84.9%) | 56 (3.2%) |
| 55 to 59 Years | 654 (70.2%) | 10 (1.5%) |
| 60 to 64 Years | 586 (42.4%) | 21 (3.6%) |
| 65 to 74 Years | 518 (26.8%) | 7 (1.4%) |
| 75 Years and over | 186 (13.3%) | 0 (0.0%) |
| Total | 8,121 (62.1%) | 284 (3.5%) |
Employment Status by Educational Attainment in Appomattox County
According to labor force statistics for Appomattox County, 76.3% of individuals (6,224) out of the total population between 25 and 64 years of age (8,157) are in the labor force, with 3.2% or 199 of them being unemployed. The group with the highest labor force participation rate are those with the educational attainment of college / associate degree, with 84.3% or 2,204 individuals in the labor force. Within the labor force, individuals with less than high school education have the highest percentage of unemployment, with 11.4% or 47 of them being unemployed.
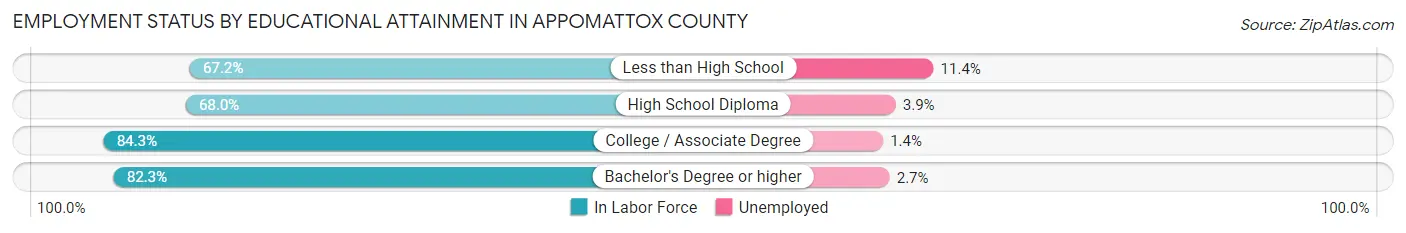
| Educational Attainment | In Labor Force | Unemployed |
| Less than High School | 414 (67.2%) | 70 (11.4%) |
| High School Diploma | 2,141 (68.0%) | 123 (3.9%) |
| College / Associate Degree | 2,204 (84.3%) | 37 (1.4%) |
| Bachelor's Degree or higher | 1,462 (82.3%) | 48 (2.7%) |
| Total | 6,224 (76.3%) | 261 (3.2%) |
Employment Occupations by Sex in Appomattox County
Management, Business, Science and Arts Occupations
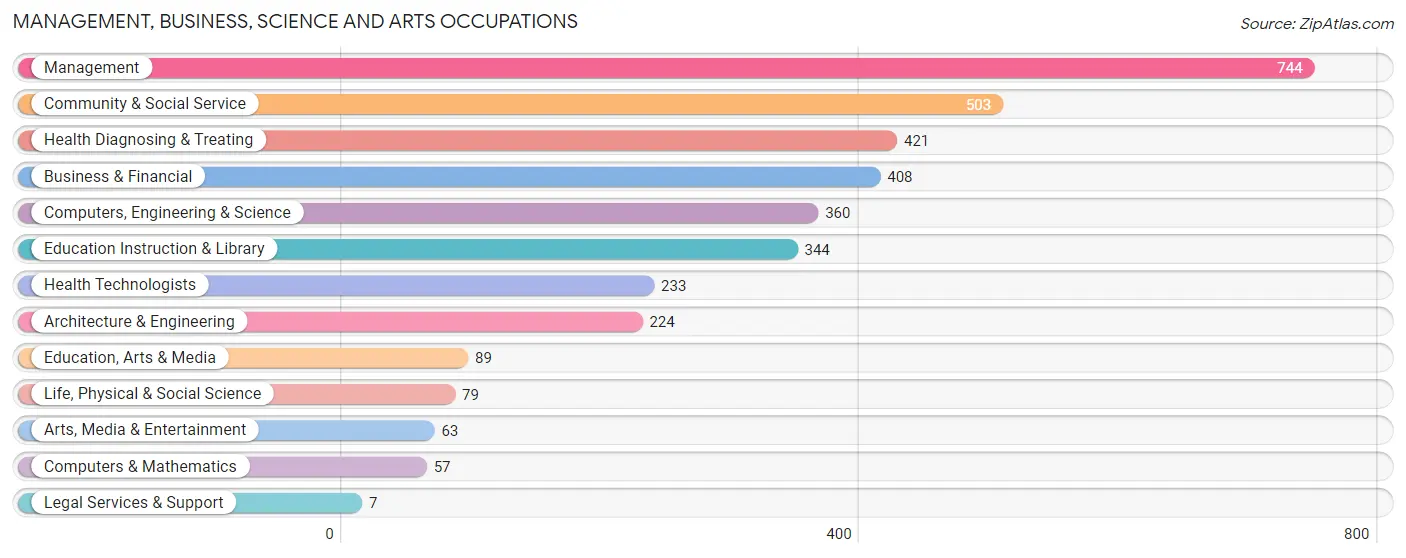
The most common Management, Business, Science and Arts occupations in Appomattox County are Management (744 | 9.5%), Community & Social Service (503 | 6.4%), Health Diagnosing & Treating (421 | 5.4%), Business & Financial (408 | 5.2%), and Computers, Engineering & Science (360 | 4.6%).
Management, Business, Science and Arts Occupations by Sex
Within the Management, Business, Science and Arts occupations in Appomattox County, the most male-oriented occupations are Computers & Mathematics (100.0%), Life, Physical & Social Science (97.5%), and Computers, Engineering & Science (96.9%), while the most female-oriented occupations are Education, Arts & Media (94.4%), Health Diagnosing & Treating (89.8%), and Health Technologists (85.4%).
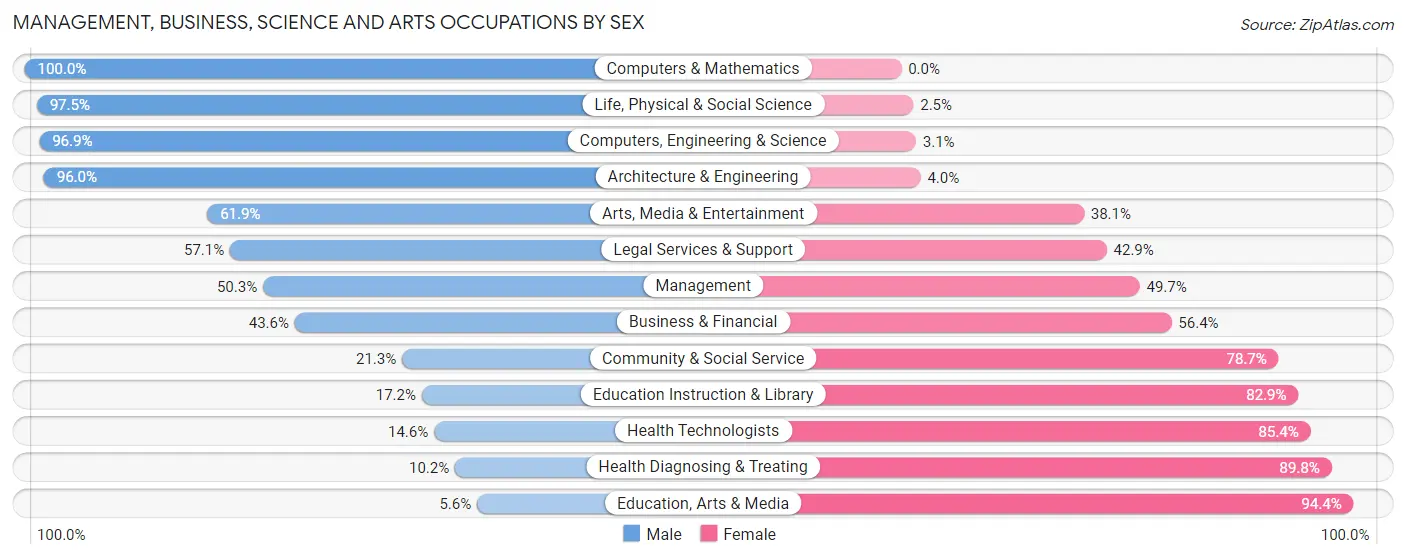
| Occupation | Male | Female |
| Management | 374 (50.3%) | 370 (49.7%) |
| Business & Financial | 178 (43.6%) | 230 (56.4%) |
| Computers, Engineering & Science | 349 (96.9%) | 11 (3.1%) |
| Computers & Mathematics | 57 (100.0%) | 0 (0.0%) |
| Architecture & Engineering | 215 (96.0%) | 9 (4.0%) |
| Life, Physical & Social Science | 77 (97.5%) | 2 (2.5%) |
| Community & Social Service | 107 (21.3%) | 396 (78.7%) |
| Education, Arts & Media | 5 (5.6%) | 84 (94.4%) |
| Legal Services & Support | 4 (57.1%) | 3 (42.9%) |
| Education Instruction & Library | 59 (17.2%) | 285 (82.9%) |
| Arts, Media & Entertainment | 39 (61.9%) | 24 (38.1%) |
| Health Diagnosing & Treating | 43 (10.2%) | 378 (89.8%) |
| Health Technologists | 34 (14.6%) | 199 (85.4%) |
| Total (Category) | 1,051 (43.1%) | 1,385 (56.9%) |
| Total (Overall) | 4,084 (52.1%) | 3,748 (47.8%) |
Services Occupations
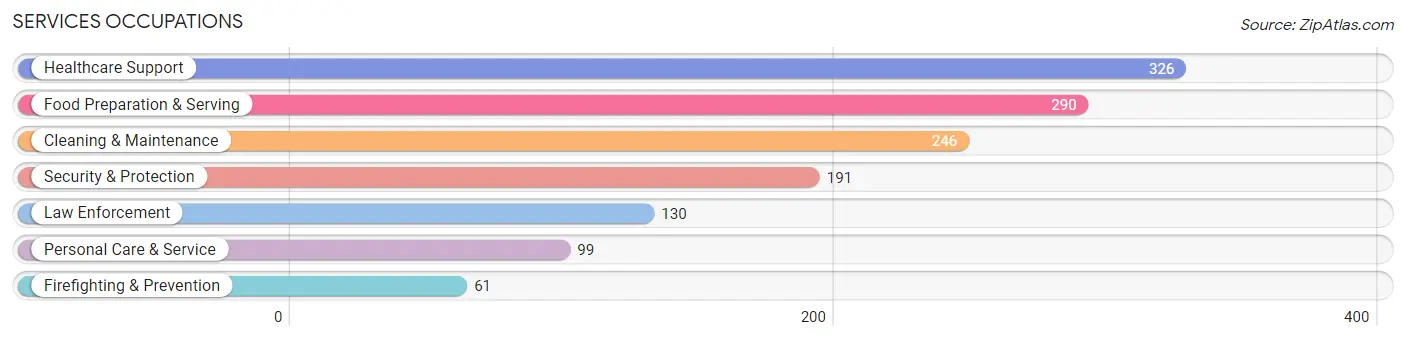
The most common Services occupations in Appomattox County are Healthcare Support (326 | 4.2%), Food Preparation & Serving (290 | 3.7%), Cleaning & Maintenance (246 | 3.1%), Security & Protection (191 | 2.4%), and Law Enforcement (130 | 1.7%).
Services Occupations by Sex
Within the Services occupations in Appomattox County, the most male-oriented occupations are Cleaning & Maintenance (77.6%), Law Enforcement (71.5%), and Security & Protection (68.6%), while the most female-oriented occupations are Food Preparation & Serving (82.4%), Healthcare Support (81.6%), and Personal Care & Service (45.5%).
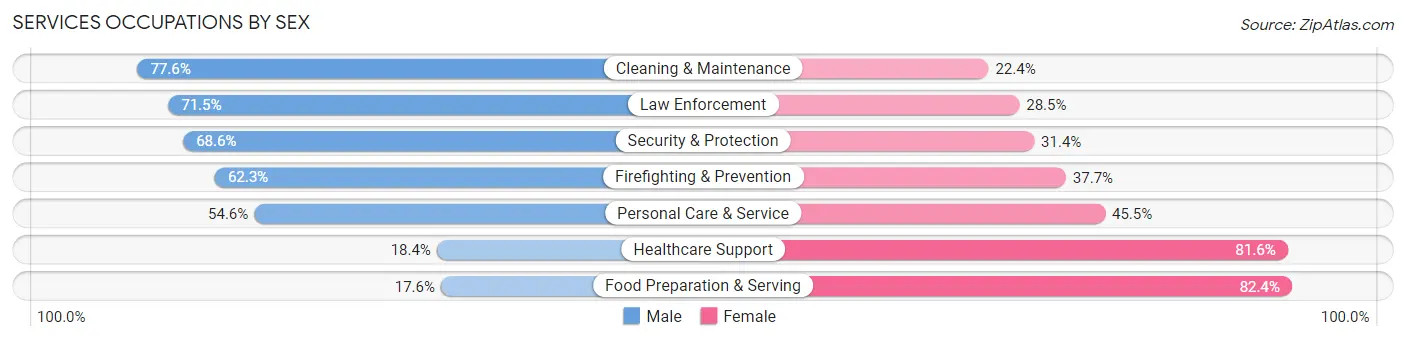
| Occupation | Male | Female |
| Healthcare Support | 60 (18.4%) | 266 (81.6%) |
| Security & Protection | 131 (68.6%) | 60 (31.4%) |
| Firefighting & Prevention | 38 (62.3%) | 23 (37.7%) |
| Law Enforcement | 93 (71.5%) | 37 (28.5%) |
| Food Preparation & Serving | 51 (17.6%) | 239 (82.4%) |
| Cleaning & Maintenance | 191 (77.6%) | 55 (22.4%) |
| Personal Care & Service | 54 (54.5%) | 45 (45.5%) |
| Total (Category) | 487 (42.3%) | 665 (57.7%) |
| Total (Overall) | 4,084 (52.1%) | 3,748 (47.8%) |
Sales and Office Occupations
The most common Sales and Office occupations in Appomattox County are Office & Administration (1,164 | 14.9%), and Sales & Related (808 | 10.3%).
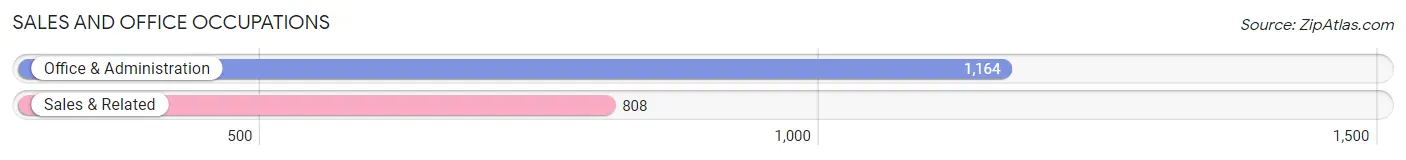
Sales and Office Occupations by Sex
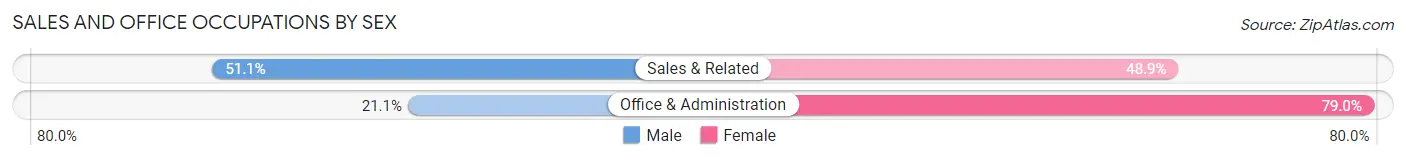
| Occupation | Male | Female |
| Sales & Related | 413 (51.1%) | 395 (48.9%) |
| Office & Administration | 245 (21.0%) | 919 (78.9%) |
| Total (Category) | 658 (33.4%) | 1,314 (66.6%) |
| Total (Overall) | 4,084 (52.1%) | 3,748 (47.8%) |
Natural Resources, Construction and Maintenance Occupations
The most common Natural Resources, Construction and Maintenance occupations in Appomattox County are Installation, Maintenance & Repair (483 | 6.2%), Construction & Extraction (472 | 6.0%), and Farming, Fishing & Forestry (28 | 0.4%).
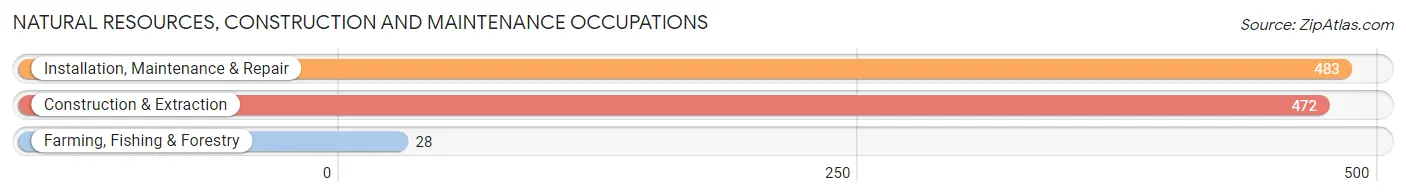
Natural Resources, Construction and Maintenance Occupations by Sex
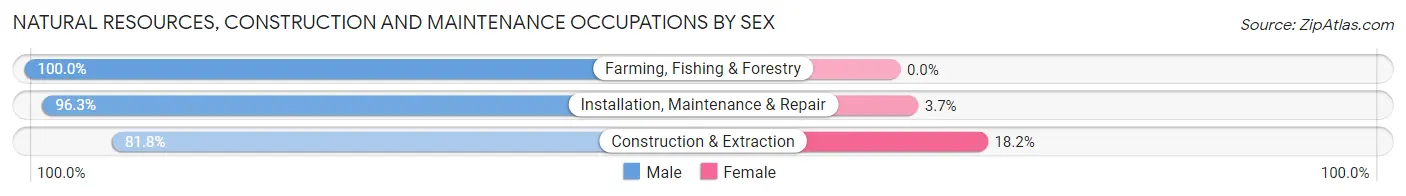
| Occupation | Male | Female |
| Farming, Fishing & Forestry | 28 (100.0%) | 0 (0.0%) |
| Construction & Extraction | 386 (81.8%) | 86 (18.2%) |
| Installation, Maintenance & Repair | 465 (96.3%) | 18 (3.7%) |
| Total (Category) | 879 (89.4%) | 104 (10.6%) |
| Total (Overall) | 4,084 (52.1%) | 3,748 (47.8%) |
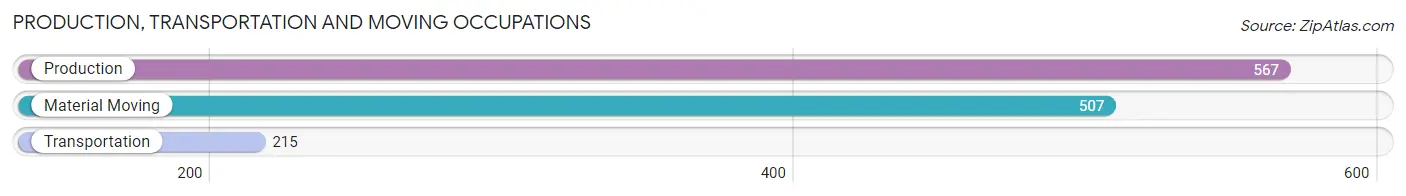
Production, Transportation and Moving Occupations
The most common Production, Transportation and Moving occupations in Appomattox County are Production (567 | 7.2%), Material Moving (507 | 6.5%), and Transportation (215 | 2.8%).
Production, Transportation and Moving Occupations by Sex
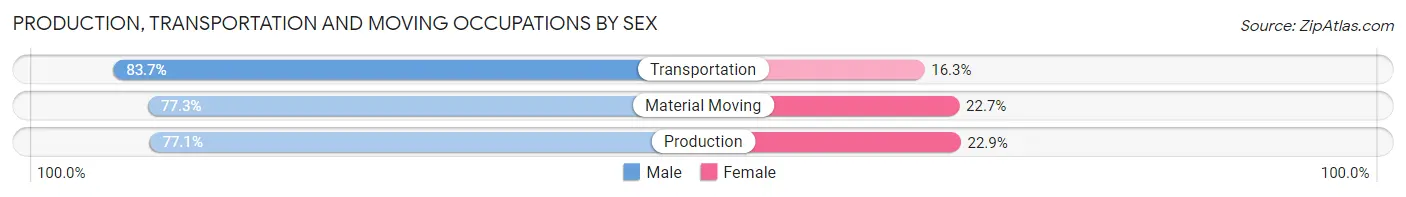
| Occupation | Male | Female |
| Production | 437 (77.1%) | 130 (22.9%) |
| Transportation | 180 (83.7%) | 35 (16.3%) |
| Material Moving | 392 (77.3%) | 115 (22.7%) |
| Total (Category) | 1,009 (78.3%) | 280 (21.7%) |
| Total (Overall) | 4,084 (52.1%) | 3,748 (47.8%) |
Employment Industries by Sex in Appomattox County
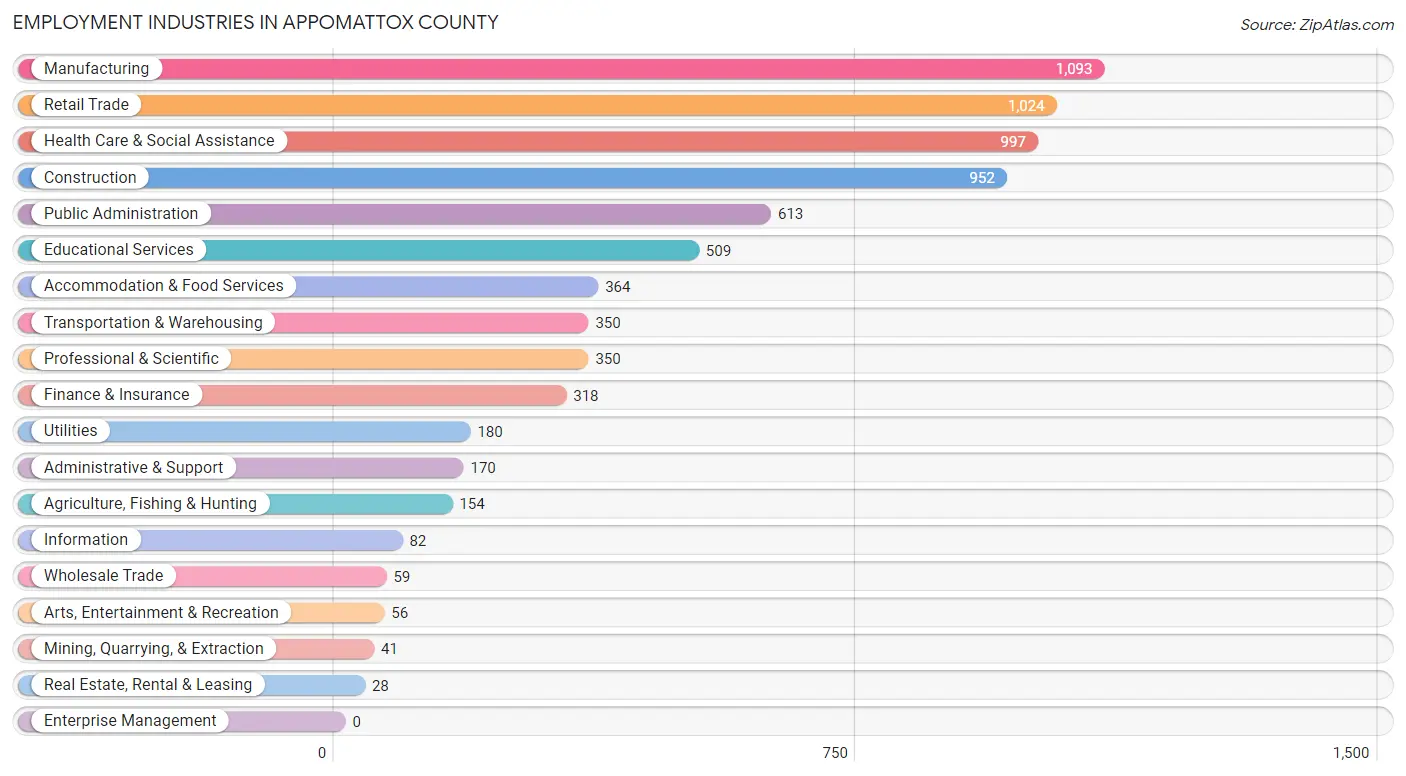
Employment Industries in Appomattox County
The major employment industries in Appomattox County include Manufacturing (1,093 | 14.0%), Retail Trade (1,024 | 13.1%), Health Care & Social Assistance (997 | 12.7%), Construction (952 | 12.2%), and Public Administration (613 | 7.8%).
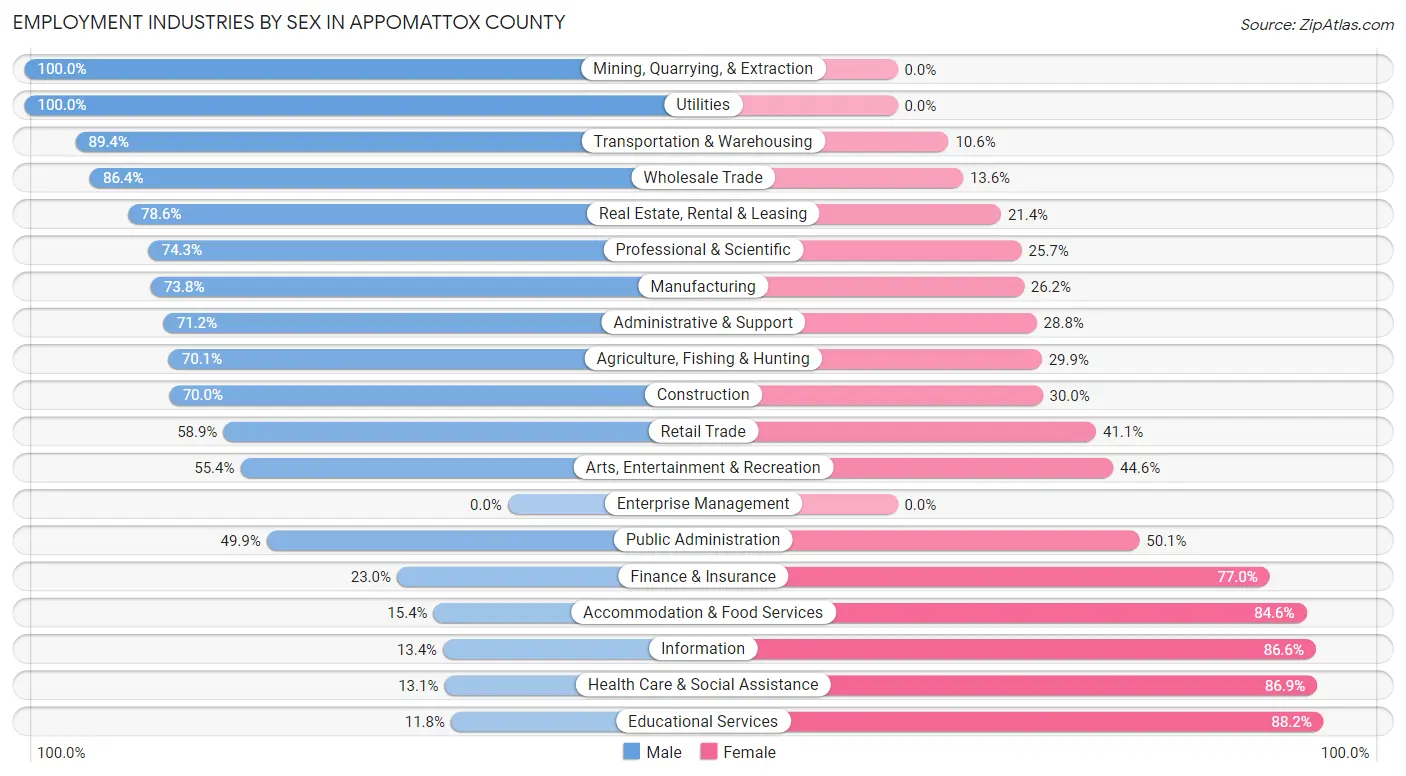
Employment Industries by Sex in Appomattox County
The Appomattox County industries that see more men than women are Mining, Quarrying, & Extraction (100.0%), Utilities (100.0%), and Transportation & Warehousing (89.4%), whereas the industries that tend to have a higher number of women are Educational Services (88.2%), Health Care & Social Assistance (86.9%), and Information (86.6%).
| Industry | Male | Female |
| Agriculture, Fishing & Hunting | 108 (70.1%) | 46 (29.9%) |
| Mining, Quarrying, & Extraction | 41 (100.0%) | 0 (0.0%) |
| Construction | 666 (70.0%) | 286 (30.0%) |
| Manufacturing | 807 (73.8%) | 286 (26.2%) |
| Wholesale Trade | 51 (86.4%) | 8 (13.6%) |
| Retail Trade | 603 (58.9%) | 421 (41.1%) |
| Transportation & Warehousing | 313 (89.4%) | 37 (10.6%) |
| Utilities | 180 (100.0%) | 0 (0.0%) |
| Information | 11 (13.4%) | 71 (86.6%) |
| Finance & Insurance | 73 (23.0%) | 245 (77.0%) |
| Real Estate, Rental & Leasing | 22 (78.6%) | 6 (21.4%) |
| Professional & Scientific | 260 (74.3%) | 90 (25.7%) |
| Enterprise Management | 0 (0.0%) | 0 (0.0%) |
| Administrative & Support | 121 (71.2%) | 49 (28.8%) |
| Educational Services | 60 (11.8%) | 449 (88.2%) |
| Health Care & Social Assistance | 131 (13.1%) | 866 (86.9%) |
| Arts, Entertainment & Recreation | 31 (55.4%) | 25 (44.6%) |
| Accommodation & Food Services | 56 (15.4%) | 308 (84.6%) |
| Public Administration | 306 (49.9%) | 307 (50.1%) |
| Total | 4,084 (52.1%) | 3,748 (47.8%) |
Education in Appomattox County
School Enrollment in Appomattox County
The most common levels of schooling among the 3,416 students in Appomattox County are elementary school (1,030 | 30.1%), high school (824 | 24.1%), and middle school (726 | 21.2%).
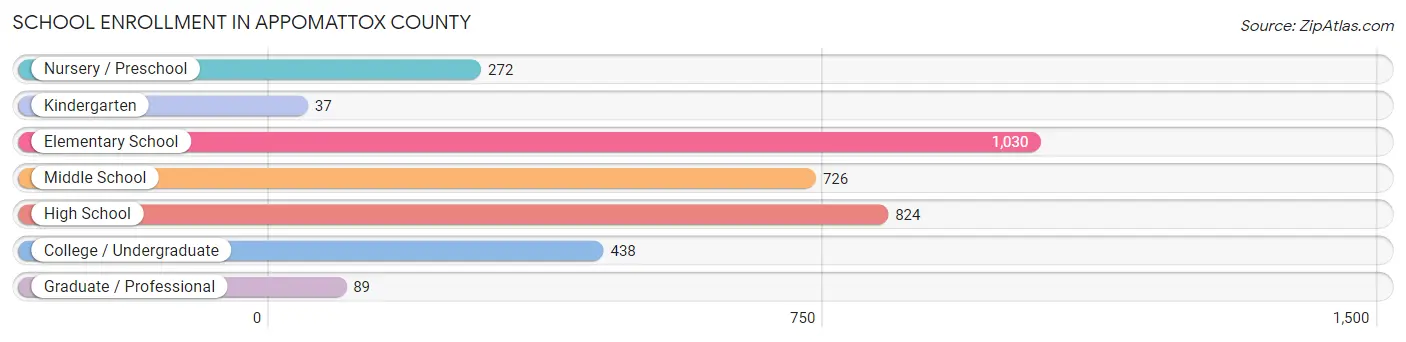
| School Level | # Students | % Students |
| Nursery / Preschool | 272 | 8.0% |
| Kindergarten | 37 | 1.1% |
| Elementary School | 1,030 | 30.1% |
| Middle School | 726 | 21.2% |
| High School | 824 | 24.1% |
| College / Undergraduate | 438 | 12.8% |
| Graduate / Professional | 89 | 2.6% |
| Total | 3,416 | 100.0% |
School Enrollment by Age by Funding Source in Appomattox County
Out of a total of 3,416 students who are enrolled in schools in Appomattox County, 670 (19.6%) attend a private institution, while the remaining 2,746 (80.4%) are enrolled in public schools. The age group of 3 to 4 year olds has the highest likelihood of being enrolled in private schools, with 147 (61.5% in the age bracket) enrolled. Conversely, the age group of 20 to 24 year olds has the lowest likelihood of being enrolled in a private school, with 236 (87.1% in the age bracket) attending a public institution.
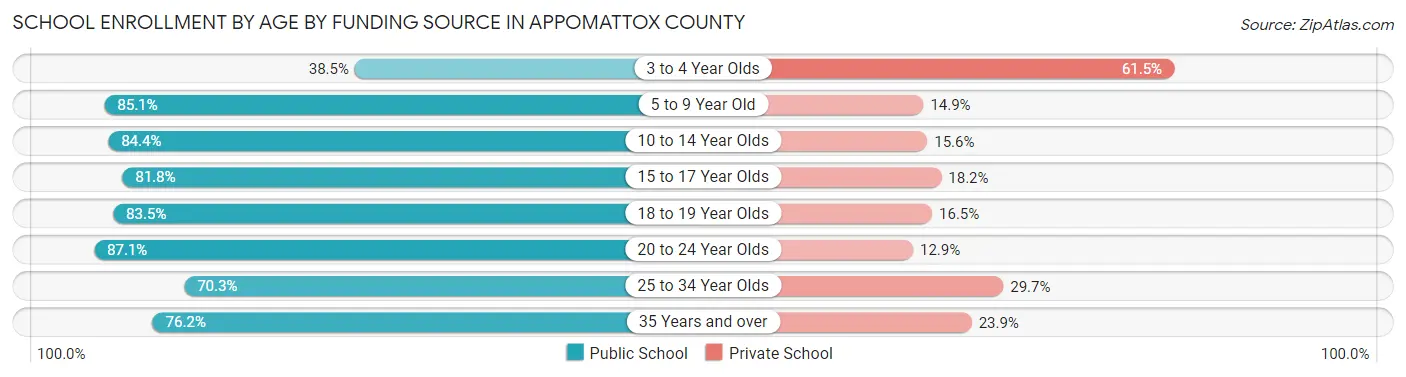
| Age Bracket | Public School | Private School |
| 3 to 4 Year Olds | 92 (38.5%) | 147 (61.5%) |
| 5 to 9 Year Old | 739 (85.1%) | 129 (14.9%) |
| 10 to 14 Year Olds | 856 (84.4%) | 158 (15.6%) |
| 15 to 17 Year Olds | 454 (81.8%) | 101 (18.2%) |
| 18 to 19 Year Olds | 208 (83.5%) | 41 (16.5%) |
| 20 to 24 Year Olds | 236 (87.1%) | 35 (12.9%) |
| 25 to 34 Year Olds | 78 (70.3%) | 33 (29.7%) |
| 35 Years and over | 83 (76.1%) | 26 (23.8%) |
| Total | 2,746 (80.4%) | 670 (19.6%) |
Educational Attainment by Field of Study in Appomattox County
Business (606 | 24.7%), education (313 | 12.8%), science & technology (250 | 10.2%), liberal arts & history (187 | 7.6%), and bio, nature & agricultural (182 | 7.4%) are the most common fields of study among 2,453 individuals in Appomattox County who have obtained a bachelor's degree or higher.
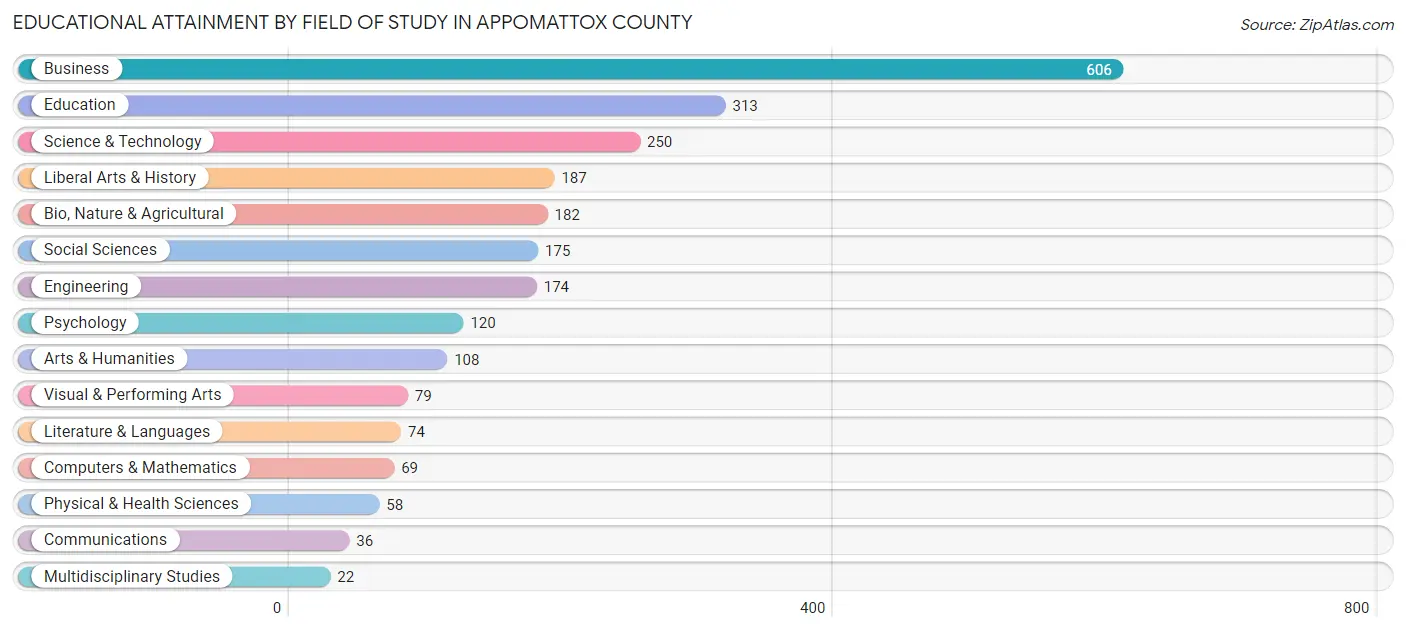
| Field of Study | # Graduates | % Graduates |
| Computers & Mathematics | 69 | 2.8% |
| Bio, Nature & Agricultural | 182 | 7.4% |
| Physical & Health Sciences | 58 | 2.4% |
| Psychology | 120 | 4.9% |
| Social Sciences | 175 | 7.1% |
| Engineering | 174 | 7.1% |
| Multidisciplinary Studies | 22 | 0.9% |
| Science & Technology | 250 | 10.2% |
| Business | 606 | 24.7% |
| Education | 313 | 12.8% |
| Literature & Languages | 74 | 3.0% |
| Liberal Arts & History | 187 | 7.6% |
| Visual & Performing Arts | 79 | 3.2% |
| Communications | 36 | 1.5% |
| Arts & Humanities | 108 | 4.4% |
| Total | 2,453 | 100.0% |
Transportation & Commute in Appomattox County
Vehicle Availability by Sex in Appomattox County
The most prevalent vehicle ownership categories in Appomattox County are males with 2 vehicles (1,346, accounting for 33.6%) and females with 2 vehicles (1,108, making up 37.4%).
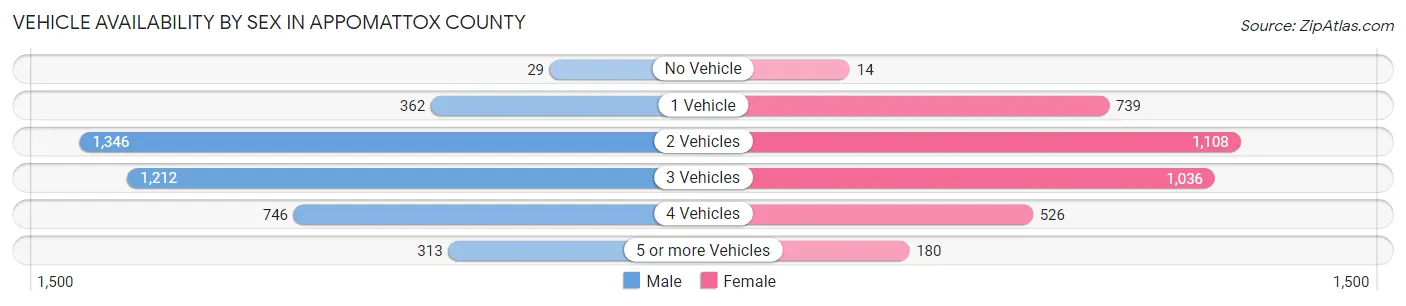
| Vehicles Available | Male | Female |
| No Vehicle | 29 (0.7%) | 14 (0.4%) |
| 1 Vehicle | 362 (9.0%) | 739 (20.5%) |
| 2 Vehicles | 1,346 (33.6%) | 1,108 (30.7%) |
| 3 Vehicles | 1,212 (30.2%) | 1,036 (28.7%) |
| 4 Vehicles | 746 (18.6%) | 526 (14.6%) |
| 5 or more Vehicles | 313 (7.8%) | 180 (5.0%) |
| Total | 4,008 (100.0%) | 3,603 (100.0%) |
Commute Time in Appomattox County
The most frequently occuring commute durations in Appomattox County are 30 to 34 minutes (1,333 commuters, 18.9%), 10 to 14 minutes (875 commuters, 12.4%), and 15 to 19 minutes (784 commuters, 11.1%).
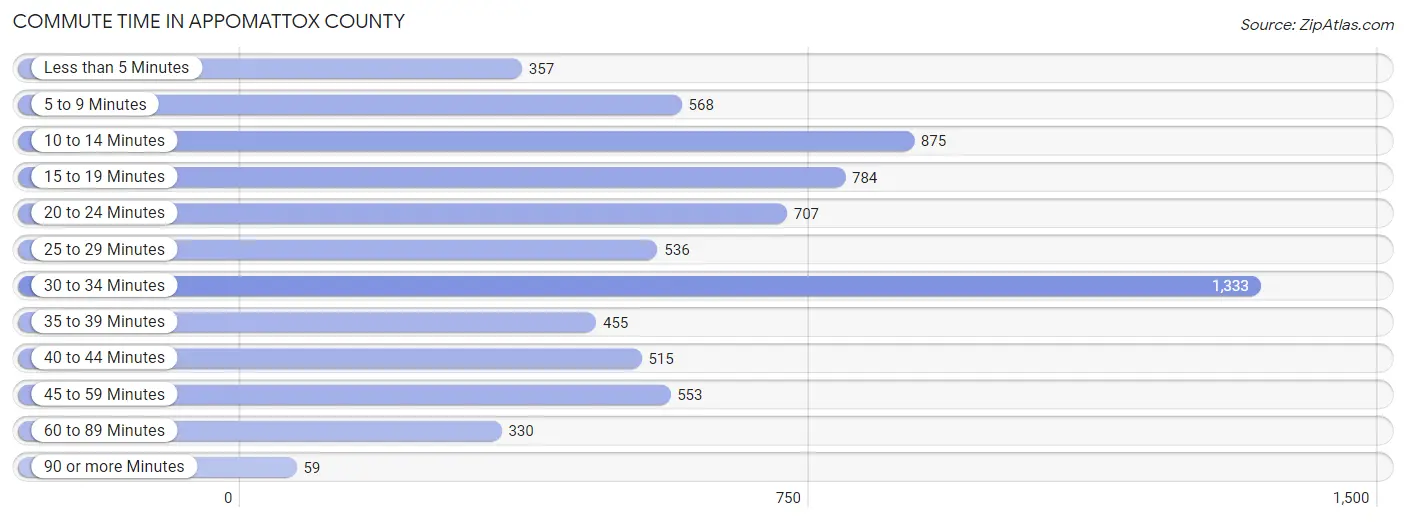
| Commute Time | # Commuters | % Commuters |
| Less than 5 Minutes | 357 | 5.1% |
| 5 to 9 Minutes | 568 | 8.0% |
| 10 to 14 Minutes | 875 | 12.4% |
| 15 to 19 Minutes | 784 | 11.1% |
| 20 to 24 Minutes | 707 | 10.0% |
| 25 to 29 Minutes | 536 | 7.6% |
| 30 to 34 Minutes | 1,333 | 18.9% |
| 35 to 39 Minutes | 455 | 6.4% |
| 40 to 44 Minutes | 515 | 7.3% |
| 45 to 59 Minutes | 553 | 7.8% |
| 60 to 89 Minutes | 330 | 4.7% |
| 90 or more Minutes | 59 | 0.8% |
Commute Time by Sex in Appomattox County
The most common commute times in Appomattox County are 30 to 34 minutes (810 commuters, 21.5%) for males and 10 to 14 minutes (534 commuters, 16.1%) for females.
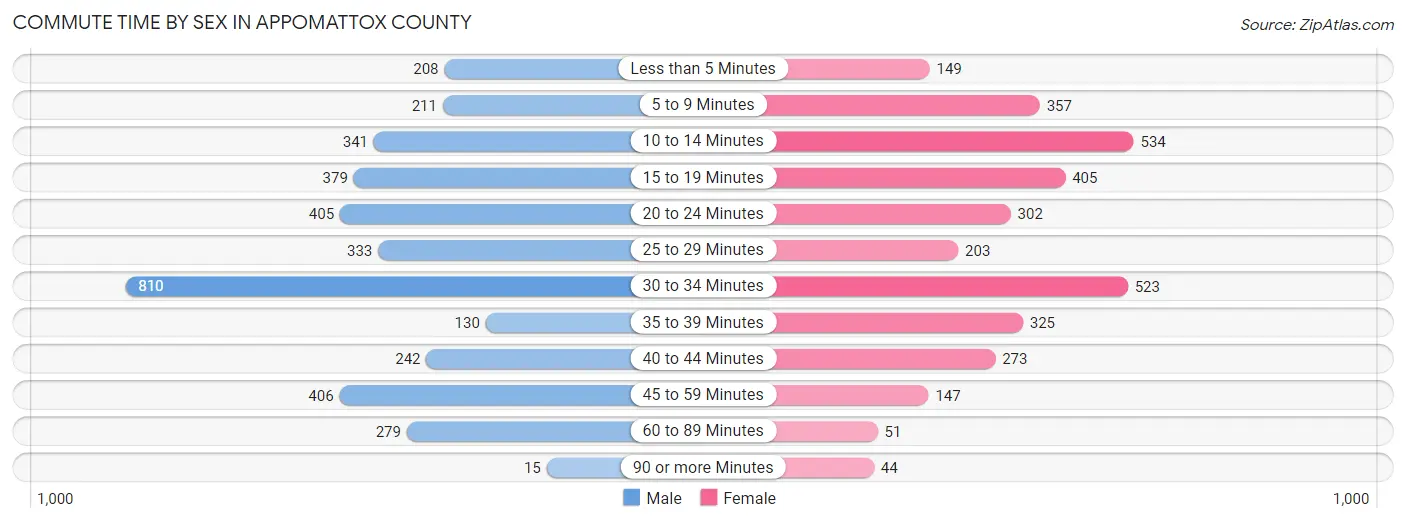
| Commute Time | Male | Female |
| Less than 5 Minutes | 208 (5.5%) | 149 (4.5%) |
| 5 to 9 Minutes | 211 (5.6%) | 357 (10.8%) |
| 10 to 14 Minutes | 341 (9.1%) | 534 (16.1%) |
| 15 to 19 Minutes | 379 (10.1%) | 405 (12.2%) |
| 20 to 24 Minutes | 405 (10.8%) | 302 (9.1%) |
| 25 to 29 Minutes | 333 (8.9%) | 203 (6.1%) |
| 30 to 34 Minutes | 810 (21.5%) | 523 (15.8%) |
| 35 to 39 Minutes | 130 (3.5%) | 325 (9.8%) |
| 40 to 44 Minutes | 242 (6.4%) | 273 (8.2%) |
| 45 to 59 Minutes | 406 (10.8%) | 147 (4.4%) |
| 60 to 89 Minutes | 279 (7.4%) | 51 (1.5%) |
| 90 or more Minutes | 15 (0.4%) | 44 (1.3%) |
Time of Departure to Work by Sex in Appomattox County
The most frequent times of departure to work in Appomattox County are 7:00 AM to 7:29 AM (592, 15.8%) for males and 7:30 AM to 7:59 AM (589, 17.8%) for females.
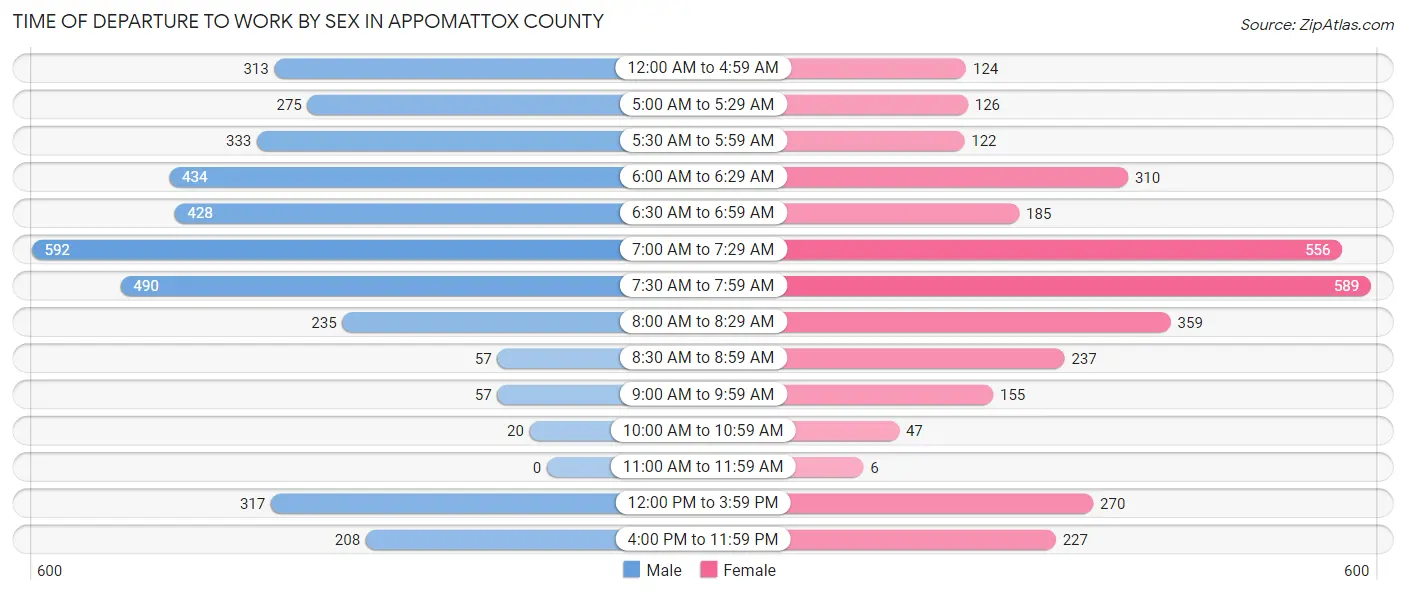
| Time of Departure | Male | Female |
| 12:00 AM to 4:59 AM | 313 (8.3%) | 124 (3.7%) |
| 5:00 AM to 5:29 AM | 275 (7.3%) | 126 (3.8%) |
| 5:30 AM to 5:59 AM | 333 (8.9%) | 122 (3.7%) |
| 6:00 AM to 6:29 AM | 434 (11.6%) | 310 (9.4%) |
| 6:30 AM to 6:59 AM | 428 (11.4%) | 185 (5.6%) |
| 7:00 AM to 7:29 AM | 592 (15.8%) | 556 (16.8%) |
| 7:30 AM to 7:59 AM | 490 (13.0%) | 589 (17.8%) |
| 8:00 AM to 8:29 AM | 235 (6.2%) | 359 (10.8%) |
| 8:30 AM to 8:59 AM | 57 (1.5%) | 237 (7.1%) |
| 9:00 AM to 9:59 AM | 57 (1.5%) | 155 (4.7%) |
| 10:00 AM to 10:59 AM | 20 (0.5%) | 47 (1.4%) |
| 11:00 AM to 11:59 AM | 0 (0.0%) | 6 (0.2%) |
| 12:00 PM to 3:59 PM | 317 (8.4%) | 270 (8.2%) |
| 4:00 PM to 11:59 PM | 208 (5.5%) | 227 (6.9%) |
| Total | 3,759 (100.0%) | 3,313 (100.0%) |
Housing Occupancy in Appomattox County
Occupancy by Ownership in Appomattox County
Of the total 6,535 dwellings in Appomattox County, owner-occupied units account for 5,083 (77.8%), while renter-occupied units make up 1,452 (22.2%).
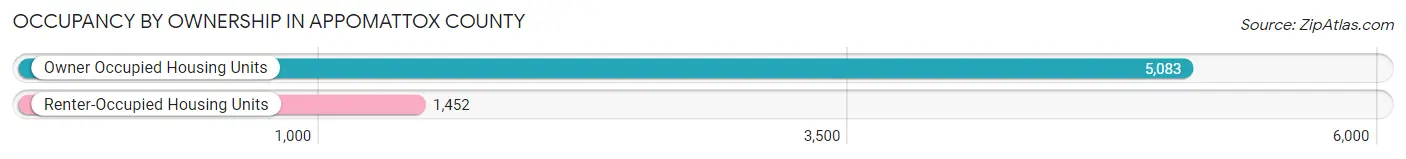
| Occupancy | # Housing Units | % Housing Units |
| Owner Occupied Housing Units | 5,083 | 77.8% |
| Renter-Occupied Housing Units | 1,452 | 22.2% |
| Total Occupied Housing Units | 6,535 | 100.0% |
Occupancy by Household Size in Appomattox County
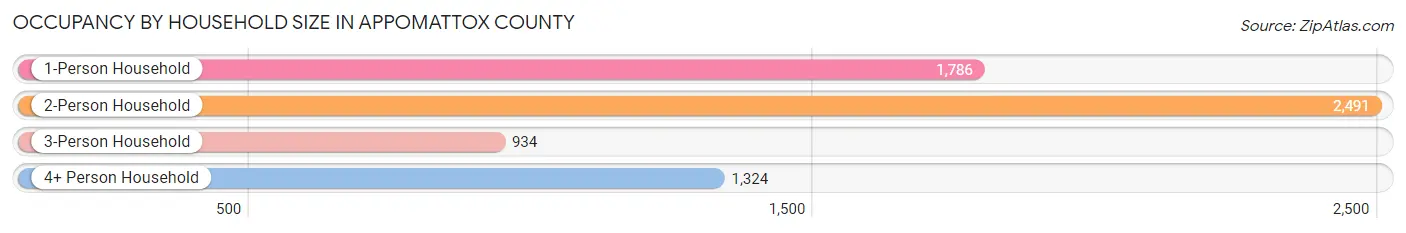
| Household Size | # Housing Units | % Housing Units |
| 1-Person Household | 1,786 | 27.3% |
| 2-Person Household | 2,491 | 38.1% |
| 3-Person Household | 934 | 14.3% |
| 4+ Person Household | 1,324 | 20.3% |
| Total Housing Units | 6,535 | 100.0% |
Occupancy by Ownership by Household Size in Appomattox County
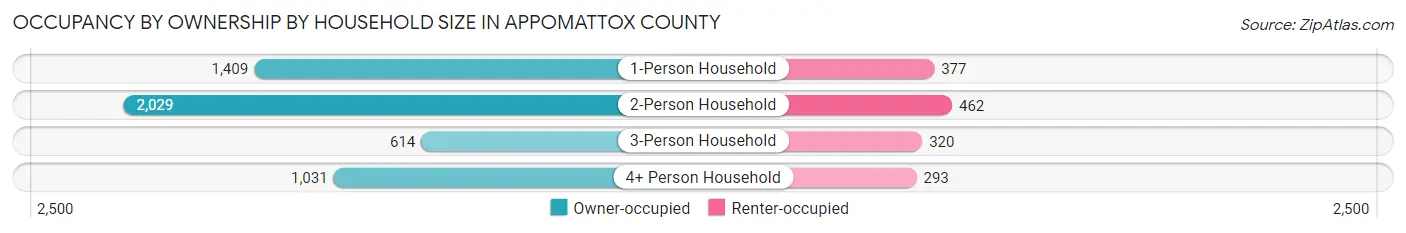
| Household Size | Owner-occupied | Renter-occupied |
| 1-Person Household | 1,409 (78.9%) | 377 (21.1%) |
| 2-Person Household | 2,029 (81.5%) | 462 (18.5%) |
| 3-Person Household | 614 (65.7%) | 320 (34.3%) |
| 4+ Person Household | 1,031 (77.9%) | 293 (22.1%) |
| Total Housing Units | 5,083 (77.8%) | 1,452 (22.2%) |
Occupancy by Educational Attainment in Appomattox County
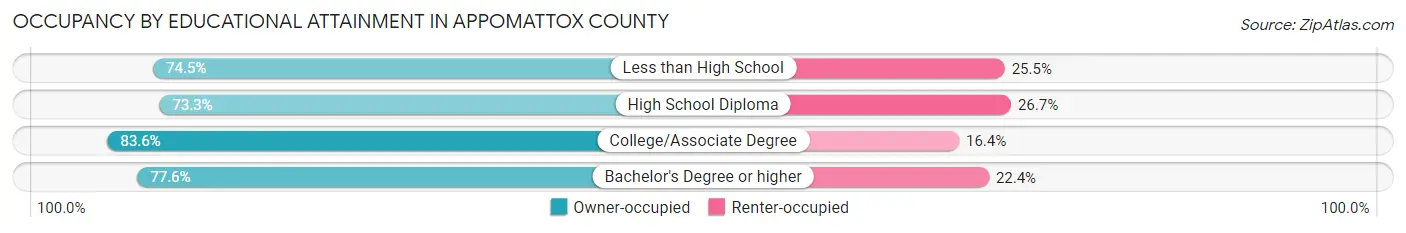
| Household Size | Owner-occupied | Renter-occupied |
| Less than High School | 453 (74.5%) | 155 (25.5%) |
| High School Diploma | 1,793 (73.3%) | 654 (26.7%) |
| College/Associate Degree | 1,903 (83.6%) | 374 (16.4%) |
| Bachelor's Degree or higher | 934 (77.6%) | 269 (22.4%) |
Occupancy by Age of Householder in Appomattox County
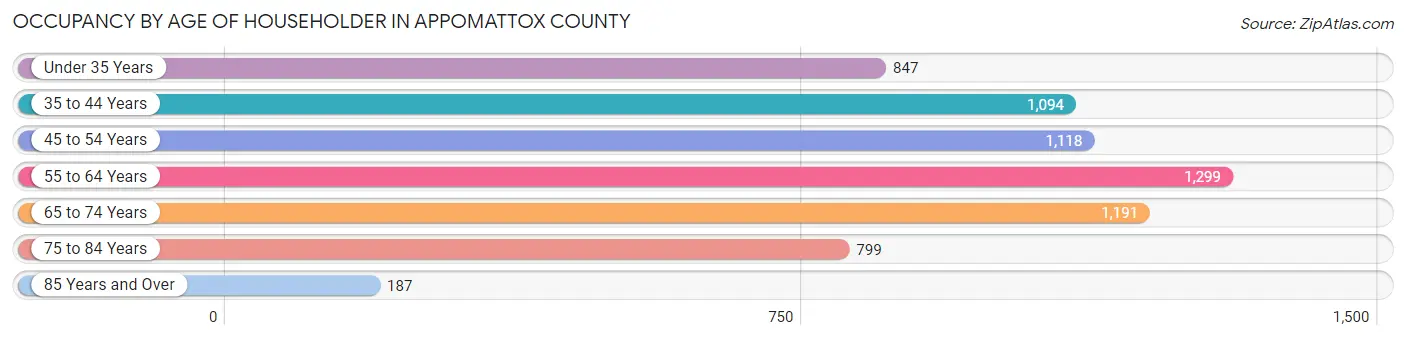
| Age Bracket | # Households | % Households |
| Under 35 Years | 847 | 13.0% |
| 35 to 44 Years | 1,094 | 16.7% |
| 45 to 54 Years | 1,118 | 17.1% |
| 55 to 64 Years | 1,299 | 19.9% |
| 65 to 74 Years | 1,191 | 18.2% |
| 75 to 84 Years | 799 | 12.2% |
| 85 Years and Over | 187 | 2.9% |
| Total | 6,535 | 100.0% |
Housing Finances in Appomattox County
Median Income by Occupancy in Appomattox County
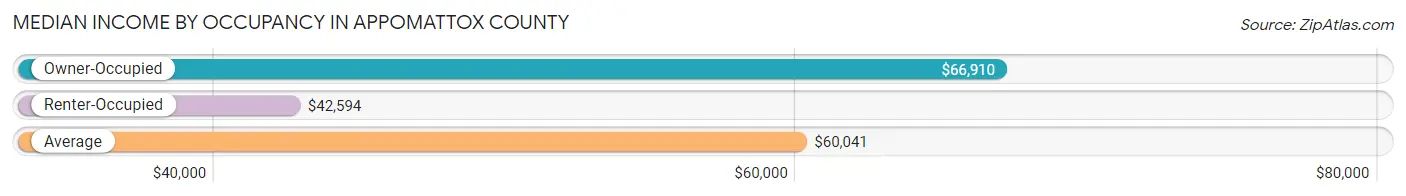
| Occupancy Type | # Households | Median Income |
| Owner-Occupied | 5,083 (77.8%) | $66,910 |
| Renter-Occupied | 1,452 (22.2%) | $42,594 |
| Average | 6,535 (100.0%) | $60,041 |
Occupancy by Householder Income Bracket in Appomattox County
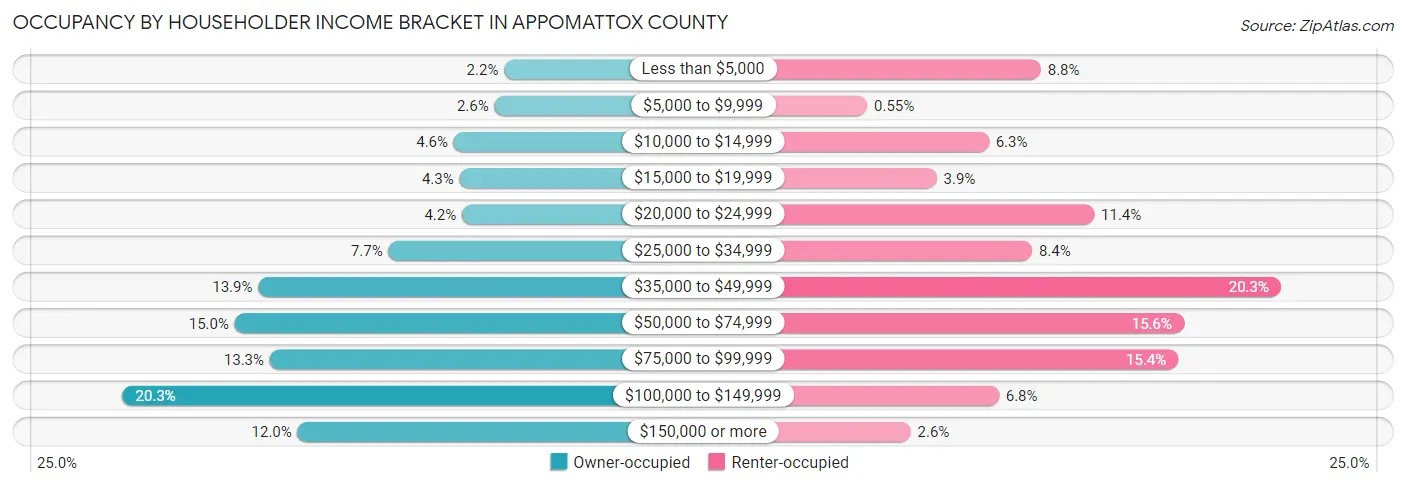
| Income Bracket | Owner-occupied | Renter-occupied |
| Less than $5,000 | 110 (2.2%) | 128 (8.8%) |
| $5,000 to $9,999 | 133 (2.6%) | 8 (0.5%) |
| $10,000 to $14,999 | 232 (4.6%) | 92 (6.3%) |
| $15,000 to $19,999 | 218 (4.3%) | 56 (3.9%) |
| $20,000 to $24,999 | 212 (4.2%) | 165 (11.4%) |
| $25,000 to $34,999 | 390 (7.7%) | 122 (8.4%) |
| $35,000 to $49,999 | 705 (13.9%) | 294 (20.3%) |
| $50,000 to $74,999 | 762 (15.0%) | 227 (15.6%) |
| $75,000 to $99,999 | 677 (13.3%) | 223 (15.4%) |
| $100,000 to $149,999 | 1,034 (20.3%) | 99 (6.8%) |
| $150,000 or more | 610 (12.0%) | 38 (2.6%) |
| Total | 5,083 (100.0%) | 1,452 (100.0%) |
Monthly Housing Cost Tiers in Appomattox County
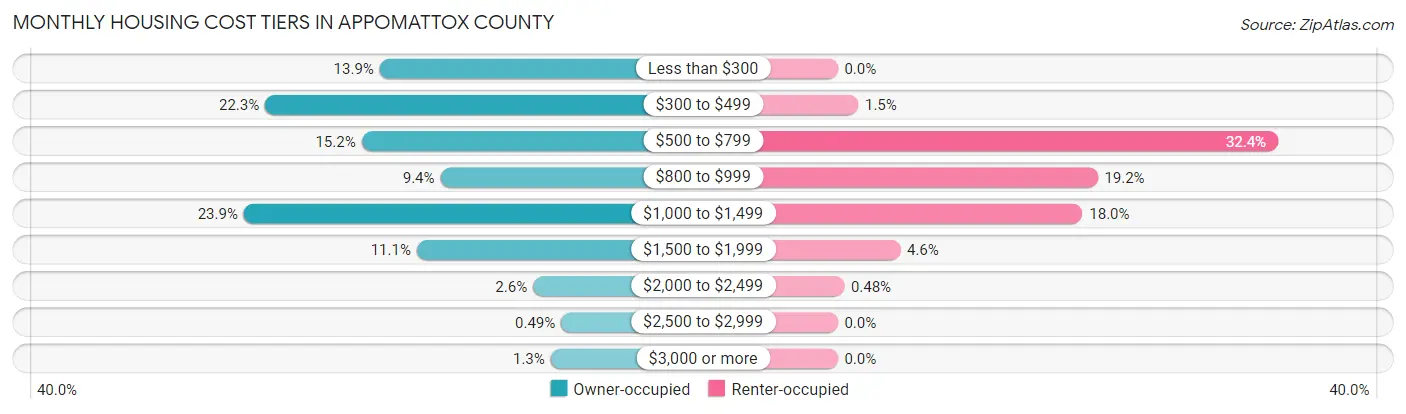
| Monthly Cost | Owner-occupied | Renter-occupied |
| Less than $300 | 704 (13.9%) | 0 (0.0%) |
| $300 to $499 | 1,133 (22.3%) | 22 (1.5%) |
| $500 to $799 | 772 (15.2%) | 471 (32.4%) |
| $800 to $999 | 477 (9.4%) | 278 (19.2%) |
| $1,000 to $1,499 | 1,213 (23.9%) | 262 (18.0%) |
| $1,500 to $1,999 | 565 (11.1%) | 67 (4.6%) |
| $2,000 to $2,499 | 130 (2.6%) | 7 (0.5%) |
| $2,500 to $2,999 | 25 (0.5%) | 0 (0.0%) |
| $3,000 or more | 64 (1.3%) | 0 (0.0%) |
| Total | 5,083 (100.0%) | 1,452 (100.0%) |
Physical Housing Characteristics in Appomattox County
Housing Structures in Appomattox County
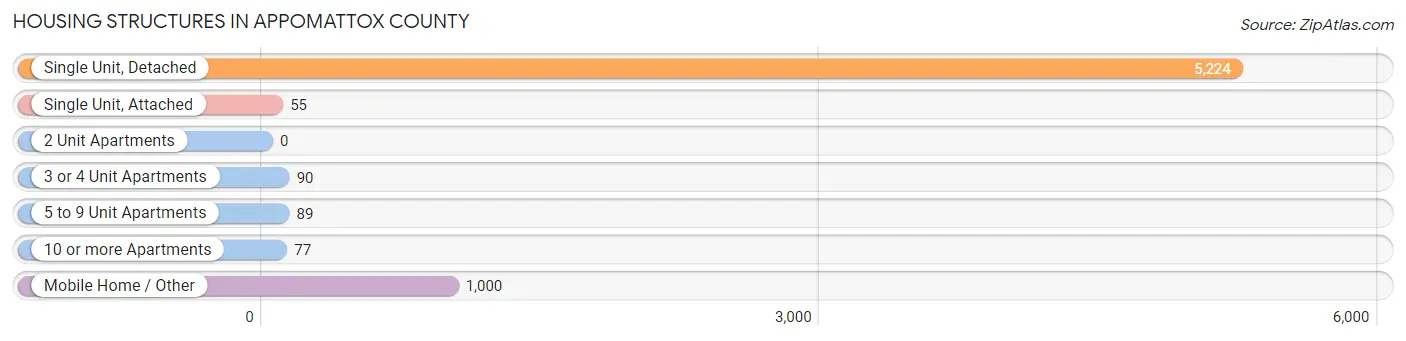
| Structure Type | # Housing Units | % Housing Units |
| Single Unit, Detached | 5,224 | 79.9% |
| Single Unit, Attached | 55 | 0.8% |
| 2 Unit Apartments | 0 | 0.0% |
| 3 or 4 Unit Apartments | 90 | 1.4% |
| 5 to 9 Unit Apartments | 89 | 1.4% |
| 10 or more Apartments | 77 | 1.2% |
| Mobile Home / Other | 1,000 | 15.3% |
| Total | 6,535 | 100.0% |
Housing Structures by Occupancy in Appomattox County
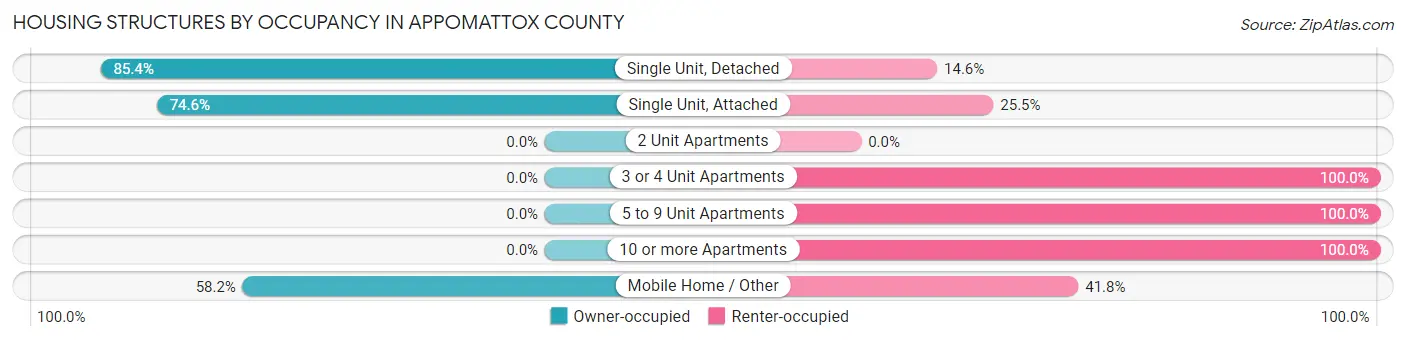
| Structure Type | Owner-occupied | Renter-occupied |
| Single Unit, Detached | 4,460 (85.4%) | 764 (14.6%) |
| Single Unit, Attached | 41 (74.6%) | 14 (25.5%) |
| 2 Unit Apartments | 0 (0.0%) | 0 (0.0%) |
| 3 or 4 Unit Apartments | 0 (0.0%) | 90 (100.0%) |
| 5 to 9 Unit Apartments | 0 (0.0%) | 89 (100.0%) |
| 10 or more Apartments | 0 (0.0%) | 77 (100.0%) |
| Mobile Home / Other | 582 (58.2%) | 418 (41.8%) |
| Total | 5,083 (77.8%) | 1,452 (22.2%) |
Housing Structures by Number of Rooms in Appomattox County
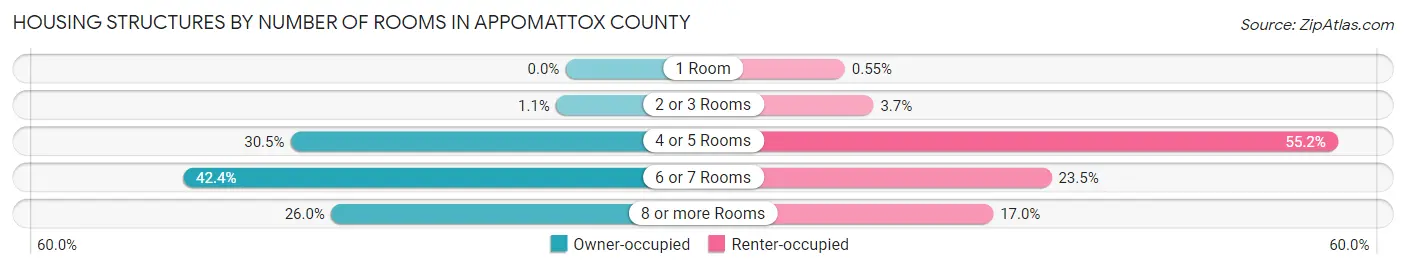
| Number of Rooms | Owner-occupied | Renter-occupied |
| 1 Room | 0 (0.0%) | 8 (0.5%) |
| 2 or 3 Rooms | 54 (1.1%) | 54 (3.7%) |
| 4 or 5 Rooms | 1,551 (30.5%) | 802 (55.2%) |
| 6 or 7 Rooms | 2,155 (42.4%) | 341 (23.5%) |
| 8 or more Rooms | 1,323 (26.0%) | 247 (17.0%) |
| Total | 5,083 (100.0%) | 1,452 (100.0%) |
Housing Structure by Heating Type in Appomattox County
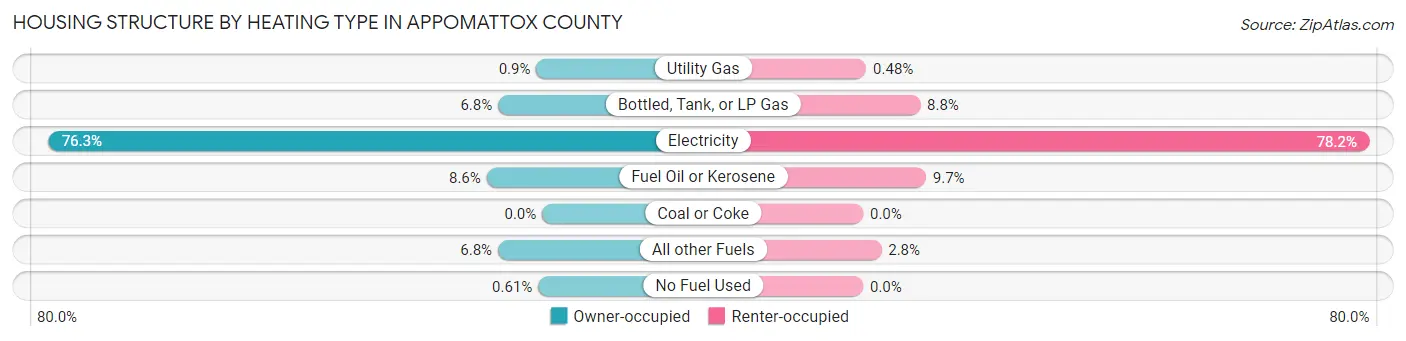
| Heating Type | Owner-occupied | Renter-occupied |
| Utility Gas | 46 (0.9%) | 7 (0.5%) |
| Bottled, Tank, or LP Gas | 346 (6.8%) | 128 (8.8%) |
| Electricity | 3,877 (76.3%) | 1,135 (78.2%) |
| Fuel Oil or Kerosene | 436 (8.6%) | 141 (9.7%) |
| Coal or Coke | 0 (0.0%) | 0 (0.0%) |
| All other Fuels | 347 (6.8%) | 41 (2.8%) |
| No Fuel Used | 31 (0.6%) | 0 (0.0%) |
| Total | 5,083 (100.0%) | 1,452 (100.0%) |
Household Vehicle Usage in Appomattox County
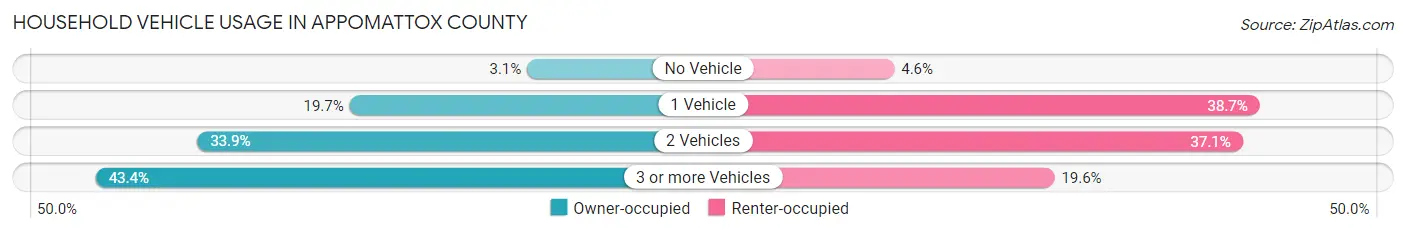
| Vehicles per Household | Owner-occupied | Renter-occupied |
| No Vehicle | 157 (3.1%) | 67 (4.6%) |
| 1 Vehicle | 1,000 (19.7%) | 562 (38.7%) |
| 2 Vehicles | 1,722 (33.9%) | 539 (37.1%) |
| 3 or more Vehicles | 2,204 (43.4%) | 284 (19.6%) |
| Total | 5,083 (100.0%) | 1,452 (100.0%) |
Real Estate & Mortgages in Appomattox County
Real Estate and Mortgage Overview in Appomattox County
| Characteristic | Without Mortgage | With Mortgage |
| Housing Units | 2,354 | 2,729 |
| Median Property Value | $151,400 | $203,200 |
| Median Household Income | $38,739 | $382 |
| Monthly Housing Costs | $384 | $64 |
| Real Estate Taxes | $867 | $75 |
Property Value by Mortgage Status in Appomattox County
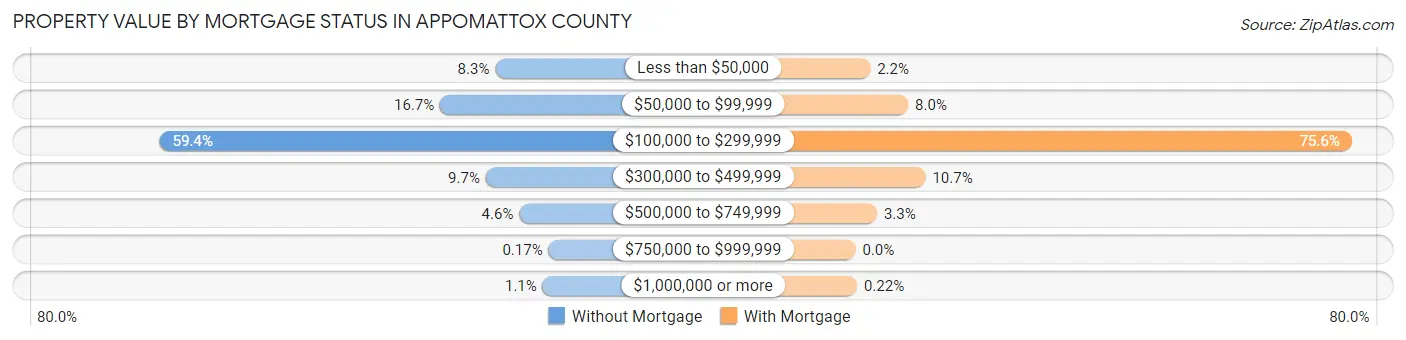
| Property Value | Without Mortgage | With Mortgage |
| Less than $50,000 | 195 (8.3%) | 61 (2.2%) |
| $50,000 to $99,999 | 393 (16.7%) | 219 (8.0%) |
| $100,000 to $299,999 | 1,399 (59.4%) | 2,063 (75.6%) |
| $300,000 to $499,999 | 229 (9.7%) | 291 (10.7%) |
| $500,000 to $749,999 | 109 (4.6%) | 89 (3.3%) |
| $750,000 to $999,999 | 4 (0.2%) | 0 (0.0%) |
| $1,000,000 or more | 25 (1.1%) | 6 (0.2%) |
| Total | 2,354 (100.0%) | 2,729 (100.0%) |
Household Income by Mortgage Status in Appomattox County
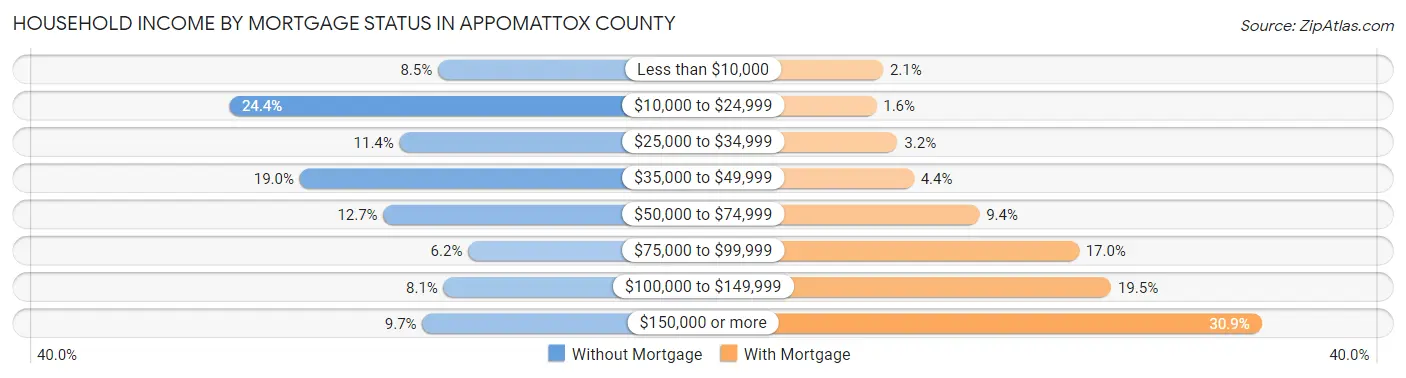
| Household Income | Without Mortgage | With Mortgage |
| Less than $10,000 | 200 (8.5%) | 57 (2.1%) |
| $10,000 to $24,999 | 575 (24.4%) | 43 (1.6%) |
| $25,000 to $34,999 | 269 (11.4%) | 87 (3.2%) |
| $35,000 to $49,999 | 448 (19.0%) | 121 (4.4%) |
| $50,000 to $74,999 | 298 (12.7%) | 257 (9.4%) |
| $75,000 to $99,999 | 146 (6.2%) | 464 (17.0%) |
| $100,000 to $149,999 | 190 (8.1%) | 531 (19.5%) |
| $150,000 or more | 228 (9.7%) | 844 (30.9%) |
| Total | 2,354 (100.0%) | 2,729 (100.0%) |
Property Value to Household Income Ratio in Appomattox County
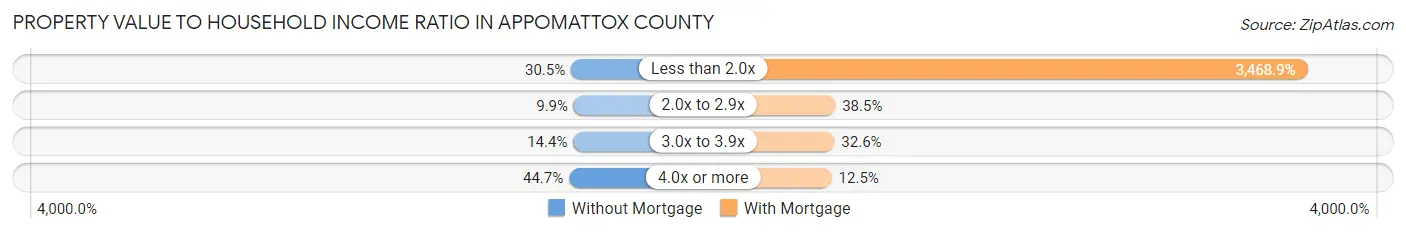
| Value-to-Income Ratio | Without Mortgage | With Mortgage |
| Less than 2.0x | 717 (30.5%) | 94,665 (3,468.8%) |
| 2.0x to 2.9x | 233 (9.9%) | 1,051 (38.5%) |
| 3.0x to 3.9x | 339 (14.4%) | 889 (32.6%) |
| 4.0x or more | 1,052 (44.7%) | 342 (12.5%) |
| Total | 2,354 (100.0%) | 2,729 (100.0%) |
Real Estate Taxes by Mortgage Status in Appomattox County
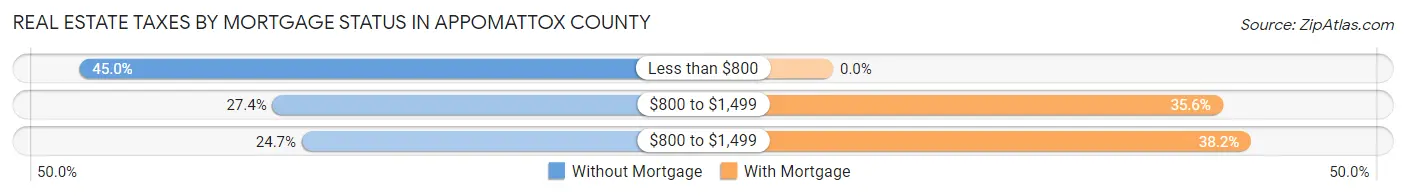
| Property Taxes | Without Mortgage | With Mortgage |
| Less than $800 | 1,059 (45.0%) | 0 (0.0%) |
| $800 to $1,499 | 644 (27.4%) | 971 (35.6%) |
| $800 to $1,499 | 581 (24.7%) | 1,042 (38.2%) |
| Total | 2,354 (100.0%) | 2,729 (100.0%) |
Health & Disability in Appomattox County
Health Insurance Coverage by Age in Appomattox County
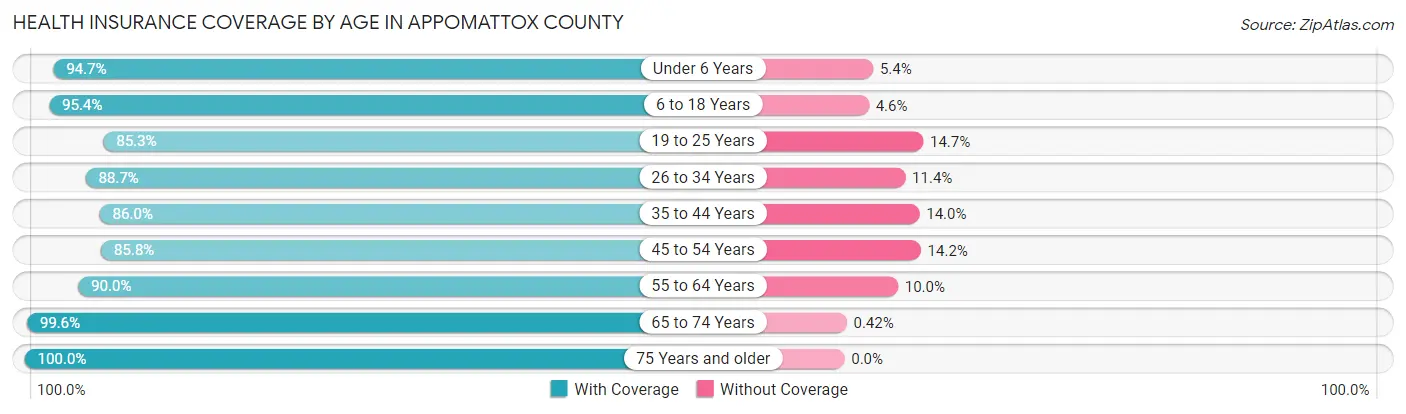
| Age Bracket | With Coverage | Without Coverage |
| Under 6 Years | 1,027 (94.7%) | 58 (5.3%) |
| 6 to 18 Years | 2,534 (95.4%) | 121 (4.6%) |
| 19 to 25 Years | 994 (85.3%) | 171 (14.7%) |
| 26 to 34 Years | 1,554 (88.6%) | 199 (11.4%) |
| 35 to 44 Years | 1,631 (86.0%) | 265 (14.0%) |
| 45 to 54 Years | 1,759 (85.8%) | 292 (14.2%) |
| 55 to 64 Years | 2,083 (90.0%) | 231 (10.0%) |
| 65 to 74 Years | 1,911 (99.6%) | 8 (0.4%) |
| 75 Years and older | 1,353 (100.0%) | 0 (0.0%) |
| Total | 14,846 (91.7%) | 1,345 (8.3%) |
Health Insurance Coverage by Citizenship Status in Appomattox County
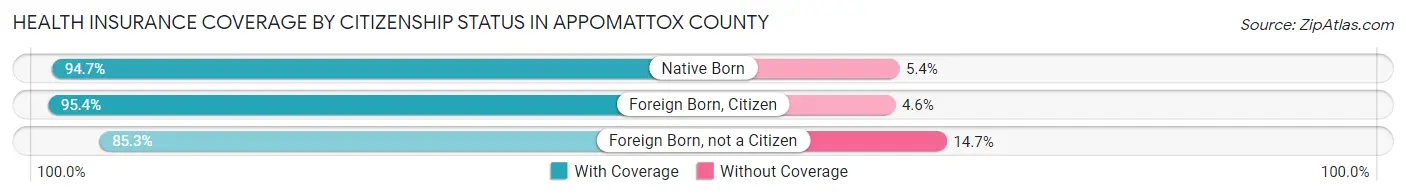
| Citizenship Status | With Coverage | Without Coverage |
| Native Born | 1,027 (94.7%) | 58 (5.3%) |
| Foreign Born, Citizen | 2,534 (95.4%) | 121 (4.6%) |
| Foreign Born, not a Citizen | 994 (85.3%) | 171 (14.7%) |
Health Insurance Coverage by Household Income in Appomattox County
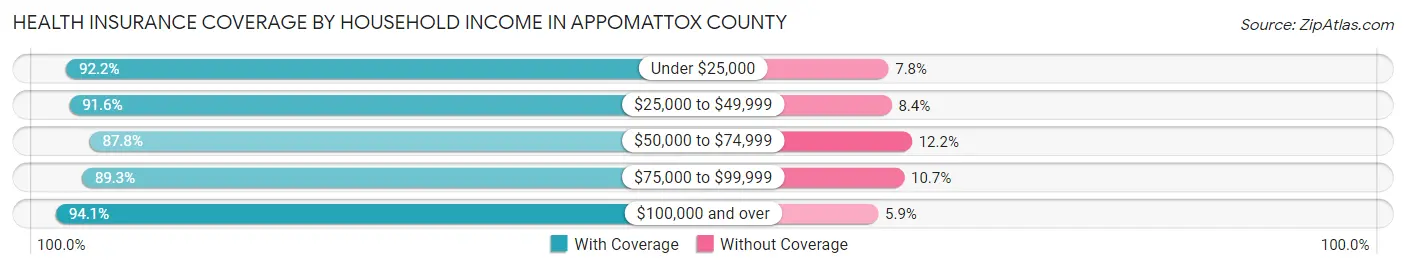
| Household Income | With Coverage | Without Coverage |
| Under $25,000 | 2,337 (92.2%) | 197 (7.8%) |
| $25,000 to $49,999 | 2,881 (91.6%) | 263 (8.4%) |
| $50,000 to $74,999 | 1,927 (87.8%) | 267 (12.2%) |
| $75,000 to $99,999 | 2,415 (89.3%) | 290 (10.7%) |
| $100,000 and over | 5,269 (94.1%) | 328 (5.9%) |
Public vs Private Health Insurance Coverage by Age in Appomattox County
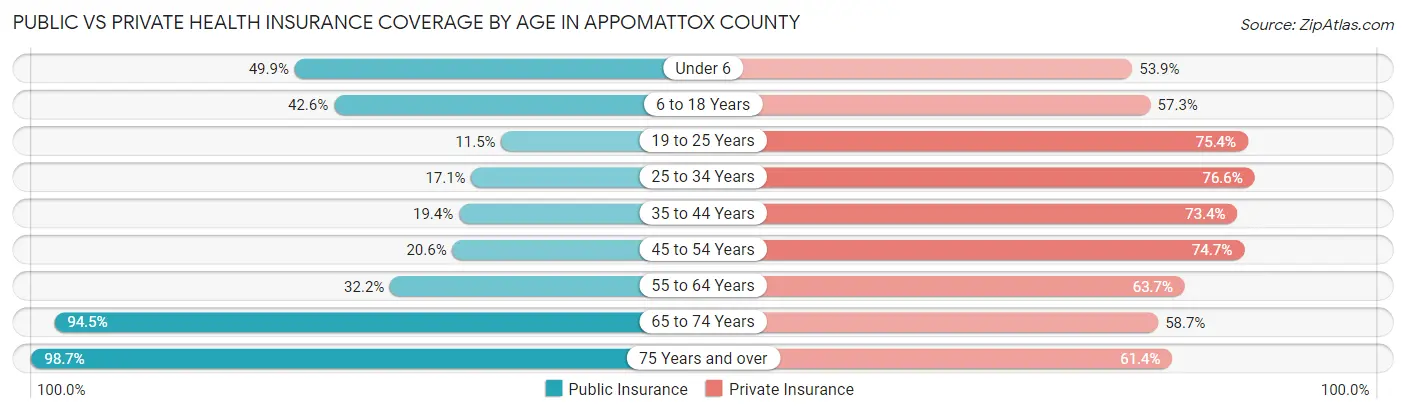
| Age Bracket | Public Insurance | Private Insurance |
| Under 6 | 541 (49.9%) | 585 (53.9%) |
| 6 to 18 Years | 1,130 (42.6%) | 1,522 (57.3%) |
| 19 to 25 Years | 134 (11.5%) | 878 (75.4%) |
| 25 to 34 Years | 299 (17.1%) | 1,343 (76.6%) |
| 35 to 44 Years | 367 (19.4%) | 1,392 (73.4%) |
| 45 to 54 Years | 422 (20.6%) | 1,531 (74.7%) |
| 55 to 64 Years | 744 (32.2%) | 1,473 (63.7%) |
| 65 to 74 Years | 1,813 (94.5%) | 1,127 (58.7%) |
| 75 Years and over | 1,336 (98.7%) | 830 (61.4%) |
| Total | 6,786 (41.9%) | 10,681 (66.0%) |
Disability Status by Sex by Age in Appomattox County
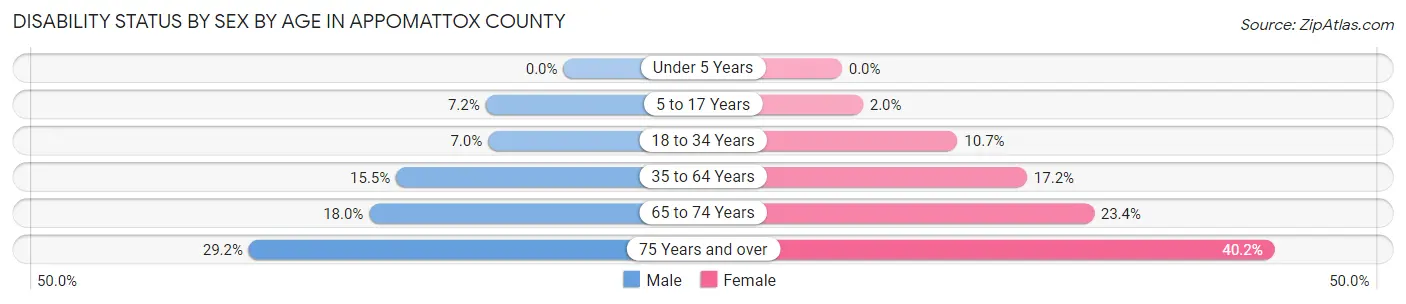
| Age Bracket | Male | Female |
| Under 5 Years | 0 (0.0%) | 0 (0.0%) |
| 5 to 17 Years | 91 (7.2%) | 25 (1.9%) |
| 18 to 34 Years | 104 (7.0%) | 174 (10.7%) |
| 35 to 64 Years | 491 (15.5%) | 532 (17.2%) |
| 65 to 74 Years | 164 (18.0%) | 236 (23.4%) |
| 75 Years and over | 174 (29.2%) | 304 (40.2%) |
Disability Class by Sex by Age in Appomattox County
Disability Class: Hearing Difficulty
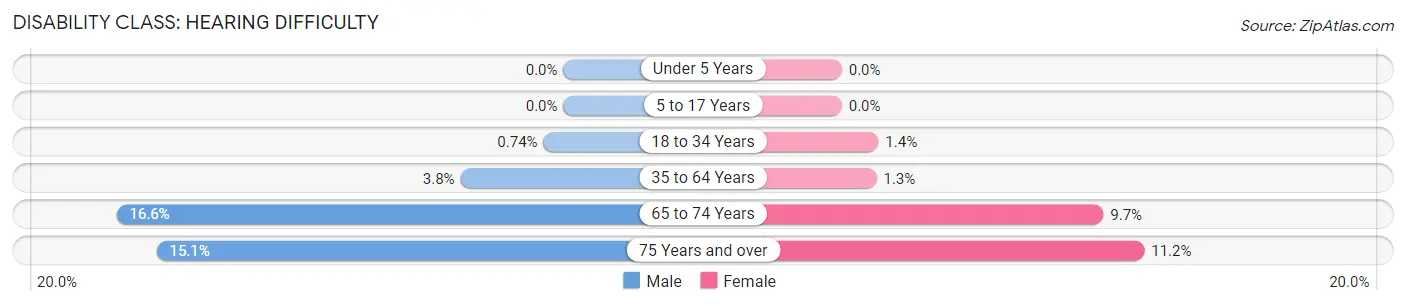
| Age Bracket | Male | Female |
| Under 5 Years | 0 (0.0%) | 0 (0.0%) |
| 5 to 17 Years | 0 (0.0%) | 0 (0.0%) |
| 18 to 34 Years | 11 (0.7%) | 22 (1.4%) |
| 35 to 64 Years | 121 (3.8%) | 40 (1.3%) |
| 65 to 74 Years | 151 (16.6%) | 98 (9.7%) |
| 75 Years and over | 90 (15.1%) | 85 (11.2%) |
Disability Class: Vision Difficulty
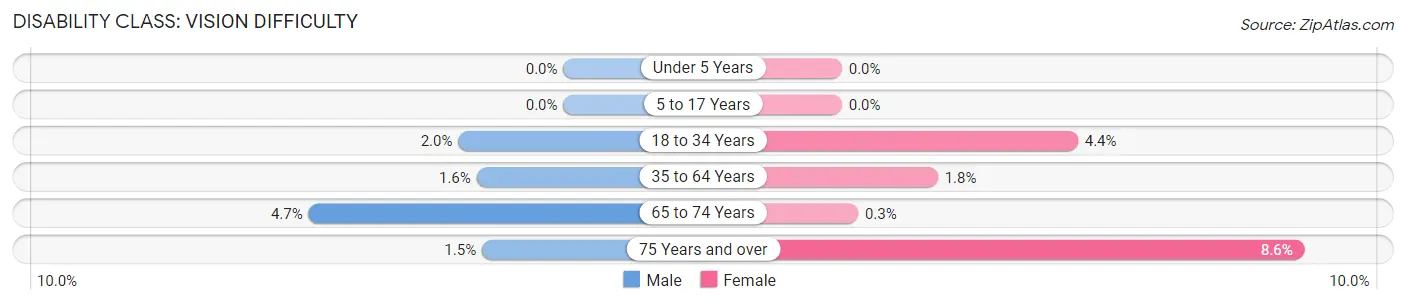
| Age Bracket | Male | Female |
| Under 5 Years | 0 (0.0%) | 0 (0.0%) |
| 5 to 17 Years | 0 (0.0%) | 0 (0.0%) |
| 18 to 34 Years | 29 (1.9%) | 71 (4.4%) |
| 35 to 64 Years | 51 (1.6%) | 55 (1.8%) |
| 65 to 74 Years | 43 (4.7%) | 3 (0.3%) |
| 75 Years and over | 9 (1.5%) | 65 (8.6%) |
Disability Class: Cognitive Difficulty
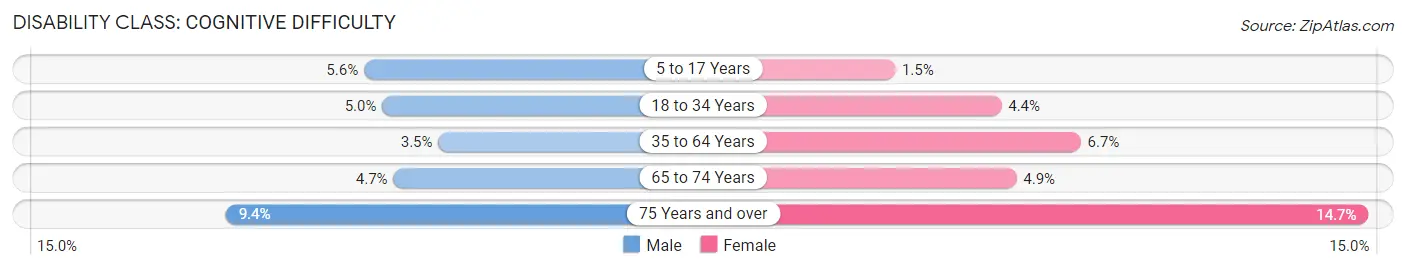
| Age Bracket | Male | Female |
| 5 to 17 Years | 70 (5.6%) | 19 (1.5%) |
| 18 to 34 Years | 75 (5.0%) | 72 (4.4%) |
| 35 to 64 Years | 110 (3.5%) | 206 (6.7%) |
| 65 to 74 Years | 43 (4.7%) | 49 (4.9%) |
| 75 Years and over | 56 (9.4%) | 111 (14.7%) |
Disability Class: Ambulatory Difficulty
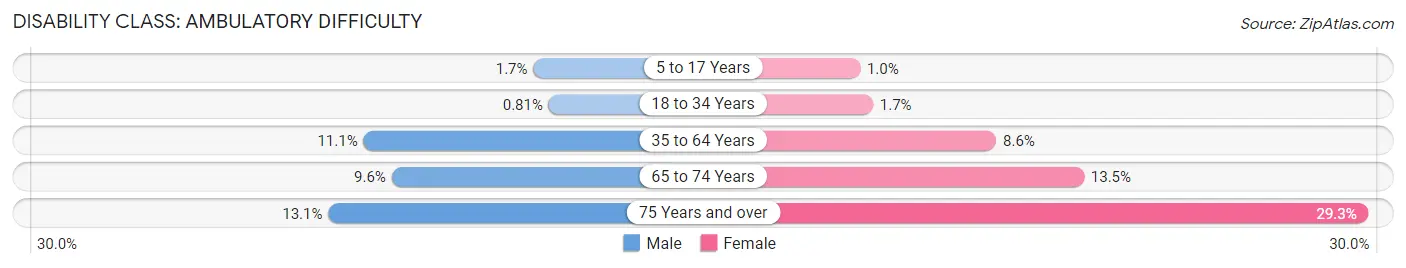
| Age Bracket | Male | Female |
| 5 to 17 Years | 21 (1.7%) | 13 (1.0%) |
| 18 to 34 Years | 12 (0.8%) | 28 (1.7%) |
| 35 to 64 Years | 352 (11.1%) | 266 (8.6%) |
| 65 to 74 Years | 87 (9.6%) | 136 (13.5%) |
| 75 Years and over | 78 (13.1%) | 222 (29.3%) |
Disability Class: Self-Care Difficulty
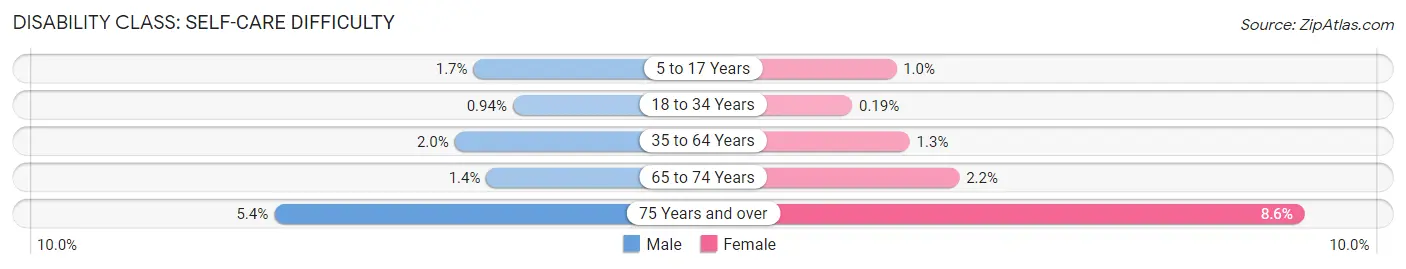
| Age Bracket | Male | Female |
| 5 to 17 Years | 21 (1.7%) | 13 (1.0%) |
| 18 to 34 Years | 14 (0.9%) | 3 (0.2%) |
| 35 to 64 Years | 64 (2.0%) | 39 (1.3%) |
| 65 to 74 Years | 13 (1.4%) | 22 (2.2%) |
| 75 Years and over | 32 (5.4%) | 65 (8.6%) |
Technology Access in Appomattox County
Computing Device Access in Appomattox County
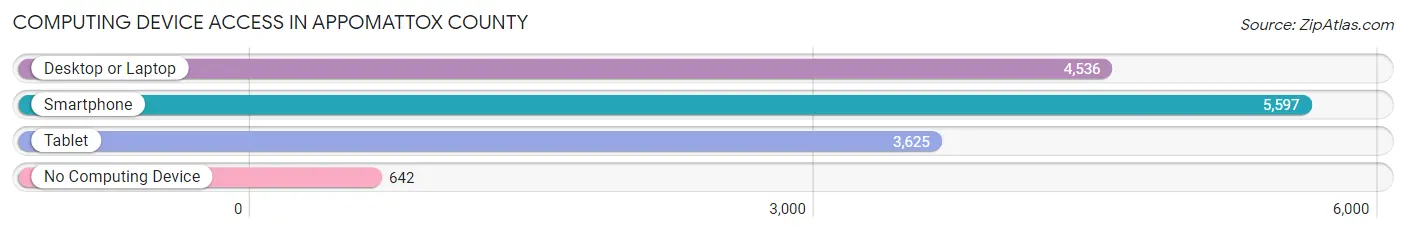
| Device Type | # Households | % Households |
| Desktop or Laptop | 4,536 | 69.4% |
| Smartphone | 5,597 | 85.7% |
| Tablet | 3,625 | 55.5% |
| No Computing Device | 642 | 9.8% |
| Total | 6,535 | 100.0% |
Internet Access in Appomattox County
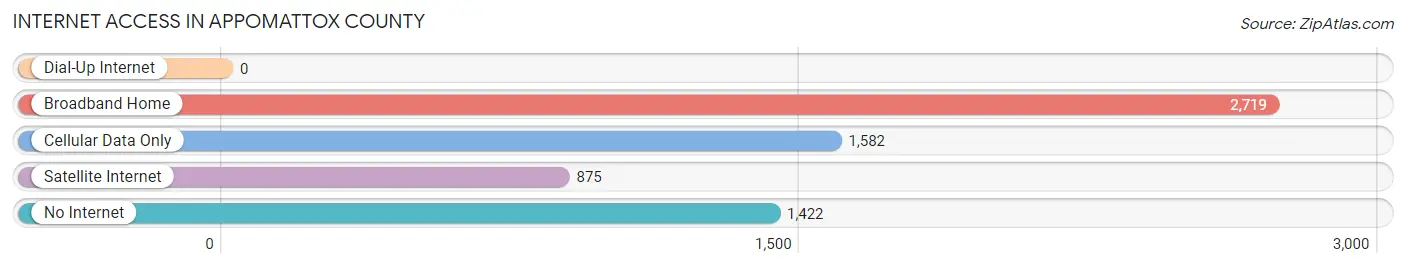
| Internet Type | # Households | % Households |
| Dial-Up Internet | 0 | 0.0% |
| Broadband Home | 2,719 | 41.6% |
| Cellular Data Only | 1,582 | 24.2% |
| Satellite Internet | 875 | 13.4% |
| No Internet | 1,422 | 21.8% |
| Total | 6,535 | 100.0% |
Appomattox County Summary
Appomattox County is located in the south-central part of the Commonwealth of Virginia. It is bordered by Buckingham County to the north, Prince Edward County to the east, Charlotte County to the south, and Campbell County to the west. The county seat is Appomattox, and the county is part of the Lynchburg Metropolitan Statistical Area.
History
Appomattox County was formed in 1845 from parts of Buckingham, Prince Edward, and Campbell counties. It was named for the Appomattox River, which flows through the county. The river was named for the Appomattox Indians, who were a sub-tribe of the Powhatan Confederacy.
The county was the site of the Battle of Appomattox Court House, which took place on April 9, 1865. This battle marked the end of the American Civil War, as Confederate General Robert E. Lee surrendered to Union General Ulysses S. Grant. The Appomattox Court House National Historical Park is located in the county and preserves the site of the battle.
Geography
Appomattox County covers an area of 437 square miles. It is located in the Piedmont region of Virginia, and is characterized by rolling hills and valleys. The Appomattox River flows through the county, and is joined by several other streams, including the Buffalo River, the Little Buffalo River, and the Falling River.
The county is mostly rural, with the majority of the land being used for agricultural purposes. The largest town in the county is Appomattox, which is the county seat. Other towns include Evergreen, Clover Hill, and Prospect.
Economy
The economy of Appomattox County is largely based on agriculture. The county is home to several large farms, which produce a variety of crops, including corn, soybeans, wheat, and hay. Livestock production is also important, with beef cattle, dairy cows, and hogs being raised in the county.
The county is also home to several manufacturing companies, which produce a variety of products, including furniture, textiles, and automotive parts. The county is also home to several retail stores, restaurants, and other businesses.
Demographics
As of the 2010 census, Appomattox County had a population of 15,030. The population was 87.3% White, 9.3% Black or African American, 0.5% Native American, 0.3% Asian, 0.1% Pacific Islander, 1.2% from other races, and 1.4% from two or more races. Hispanic or Latino of any race were 2.7% of the population.
The median household income in the county was $41,945, and the median family income was $50,945. The per capita income was $20,945. About 11.3% of the population was below the poverty line.
Appomattox County is served by the Appomattox County Public Schools system, which consists of four elementary schools, one middle school, and one high school. The county is also home to several private schools, including Appomattox Christian Academy and Appomattox Christian School.
Common Questions
What is Per Capita Income in Appomattox County?
Per Capita income in Appomattox County is $31,654.
What is the Median Family Income in Appomattox County?
Median Family Income in Appomattox County is $77,972.
What is the Median Household income in Appomattox County?
Median Household Income in Appomattox County is $60,041.
What is Income or Wage Gap in Appomattox County?
Income or Wage Gap in Appomattox County is 34.6%.
Women in Appomattox County earn 65.4 cents for every dollar earned by a man.
What is Family Income Deficit in Appomattox County?
Family Income Deficit in Appomattox County is $11,271.
Families that are below poverty line in Appomattox County earn $11,271 less on average than the poverty threshold level.
What is Inequality or Gini Index in Appomattox County?
Inequality or Gini Index in Appomattox County is 0.42.
What is the Total Population of Appomattox County?
Total Population of Appomattox County is 16,253.
What is the Total Male Population of Appomattox County?
Total Male Population of Appomattox County is 7,910.
What is the Total Female Population of Appomattox County?
Total Female Population of Appomattox County is 8,343.
What is the Ratio of Males per 100 Females in Appomattox County?
There are 94.81 Males per 100 Females in Appomattox County.
What is the Ratio of Females per 100 Males in Appomattox County?
There are 105.47 Females per 100 Males in Appomattox County.
What is the Median Population Age in Appomattox County?
Median Population Age in Appomattox County is 43.1 Years.
What is the Average Family Size in Appomattox County
Average Family Size in Appomattox County is 3.0 People.
What is the Average Household Size in Appomattox County
Average Household Size in Appomattox County is 2.5 People.
How Large is the Labor Force in Appomattox County?
There are 8,121 People in the Labor Forcein in Appomattox County.
What is the Percentage of People in the Labor Force in Appomattox County?
62.1% of People are in the Labor Force in Appomattox County.
What is the Unemployment Rate in Appomattox County?
Unemployment Rate in Appomattox County is 3.5%.