Amherst County, VA Map & Demographics
Amherst County Map
Amherst County Overview
$34,137
PER CAPITA INCOME
$85,267
AVG FAMILY INCOME
$64,454
AVG HOUSEHOLD INCOME
31.2%
WAGE / INCOME GAP [ % ]
68.8¢/ $1
WAGE / INCOME GAP [ $ ]
$10,730
FAMILY INCOME DEFICIT
0.45
INEQUALITY / GINI INDEX
31,426
TOTAL POPULATION
14,973
MALE POPULATION
16,453
FEMALE POPULATION
91.00
MALES / 100 FEMALES
109.88
FEMALES / 100 MALES
43.9
MEDIAN AGE
3.0
AVG FAMILY SIZE
2.4
AVG HOUSEHOLD SIZE
15,682
LABOR FORCE [ PEOPLE ]
60.7%
PERCENT IN LABOR FORCE
4.5%
UNEMPLOYMENT RATE
Amherst County Area Codes
Income in Amherst County
Income Overview in Amherst County
Per Capita Income in Amherst County is $34,137, while median incomes of families and households are $85,267 and $64,454 respectively.
| Characteristic | Number | Measure |
| Per Capita Income | 31,426 | $34,137 |
| Median Family Income | 7,994 | $85,267 |
| Mean Family Income | 7,994 | $101,278 |
| Median Household Income | 12,615 | $64,454 |
| Mean Household Income | 12,615 | $84,089 |
| Income Deficit | 7,994 | $10,730 |
| Wage / Income Gap (%) | 31,426 | 31.16% |
| Wage / Income Gap ($) | 31,426 | 68.84¢ per $1 |
| Gini / Inequality Index | 31,426 | 0.45 |
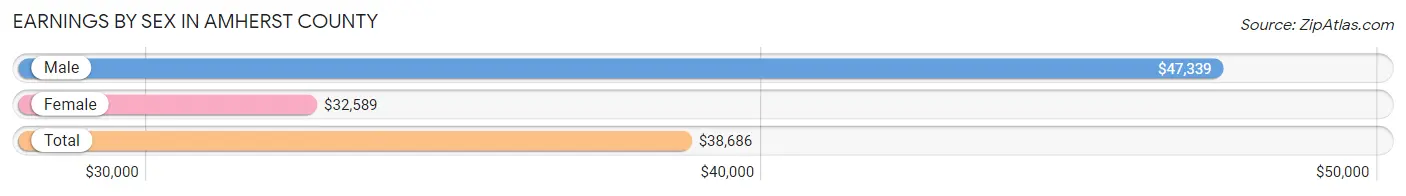
Earnings by Sex in Amherst County
Average Earnings in Amherst County are $38,686, $47,339 for men and $32,589 for women, a difference of 31.2%.
| Sex | Number | Average Earnings |
| Male | 8,112 (49.9%) | $47,339 |
| Female | 8,155 (50.1%) | $32,589 |
| Total | 16,267 (100.0%) | $38,686 |
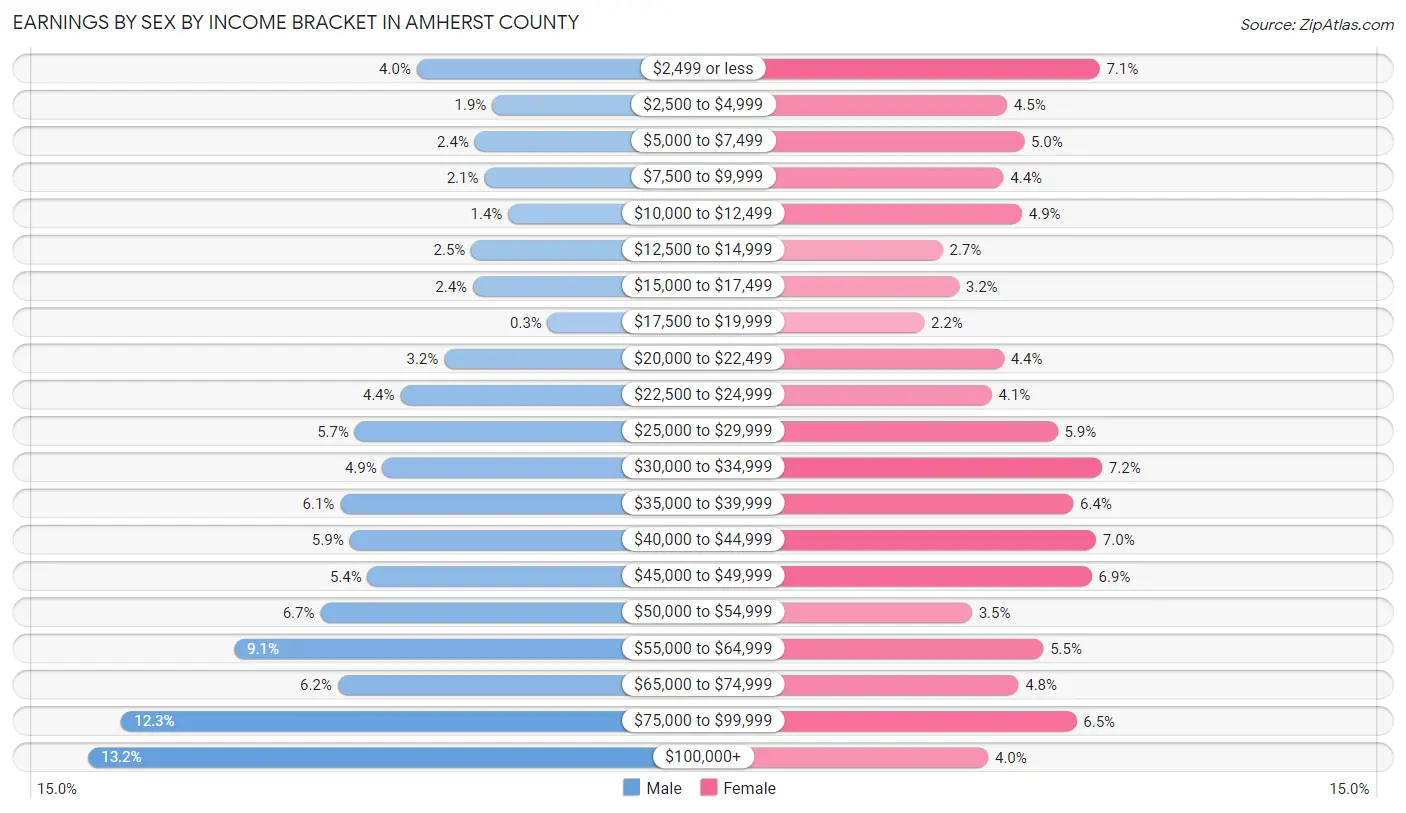
Earnings by Sex by Income Bracket in Amherst County
The most common earnings brackets in Amherst County are $100,000+ for men (1,072 | 13.2%) and $30,000 to $34,999 for women (585 | 7.2%).
| Income | Male | Female |
| $2,499 or less | 323 (4.0%) | 579 (7.1%) |
| $2,500 to $4,999 | 151 (1.9%) | 367 (4.5%) |
| $5,000 to $7,499 | 191 (2.4%) | 406 (5.0%) |
| $7,500 to $9,999 | 169 (2.1%) | 359 (4.4%) |
| $10,000 to $12,499 | 114 (1.4%) | 401 (4.9%) |
| $12,500 to $14,999 | 199 (2.5%) | 219 (2.7%) |
| $15,000 to $17,499 | 195 (2.4%) | 257 (3.2%) |
| $17,500 to $19,999 | 24 (0.3%) | 177 (2.2%) |
| $20,000 to $22,499 | 260 (3.2%) | 360 (4.4%) |
| $22,500 to $24,999 | 360 (4.4%) | 332 (4.1%) |
| $25,000 to $29,999 | 464 (5.7%) | 483 (5.9%) |
| $30,000 to $34,999 | 401 (4.9%) | 585 (7.2%) |
| $35,000 to $39,999 | 497 (6.1%) | 519 (6.4%) |
| $40,000 to $44,999 | 476 (5.9%) | 571 (7.0%) |
| $45,000 to $49,999 | 435 (5.4%) | 561 (6.9%) |
| $50,000 to $54,999 | 543 (6.7%) | 286 (3.5%) |
| $55,000 to $64,999 | 739 (9.1%) | 450 (5.5%) |
| $65,000 to $74,999 | 503 (6.2%) | 393 (4.8%) |
| $75,000 to $99,999 | 996 (12.3%) | 526 (6.5%) |
| $100,000+ | 1,072 (13.2%) | 324 (4.0%) |
| Total | 8,112 (100.0%) | 8,155 (100.0%) |
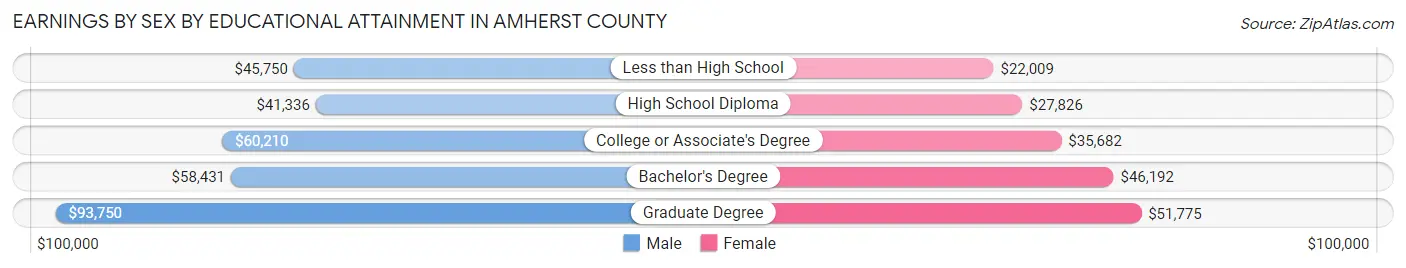
Earnings by Sex by Educational Attainment in Amherst County
Average earnings in Amherst County are $51,187 for men and $36,133 for women, a difference of 29.4%. Men with an educational attainment of graduate degree enjoy the highest average annual earnings of $93,750, while those with high school diploma education earn the least with $41,336. Women with an educational attainment of graduate degree earn the most with the average annual earnings of $51,775, while those with less than high school education have the smallest earnings of $22,009.
| Educational Attainment | Male Income | Female Income |
| Less than High School | $45,750 | $22,009 |
| High School Diploma | $41,336 | $27,826 |
| College or Associate's Degree | $60,210 | $35,682 |
| Bachelor's Degree | $58,431 | $46,192 |
| Graduate Degree | $93,750 | $51,775 |
| Total | $51,187 | $36,133 |
Family Income in Amherst County
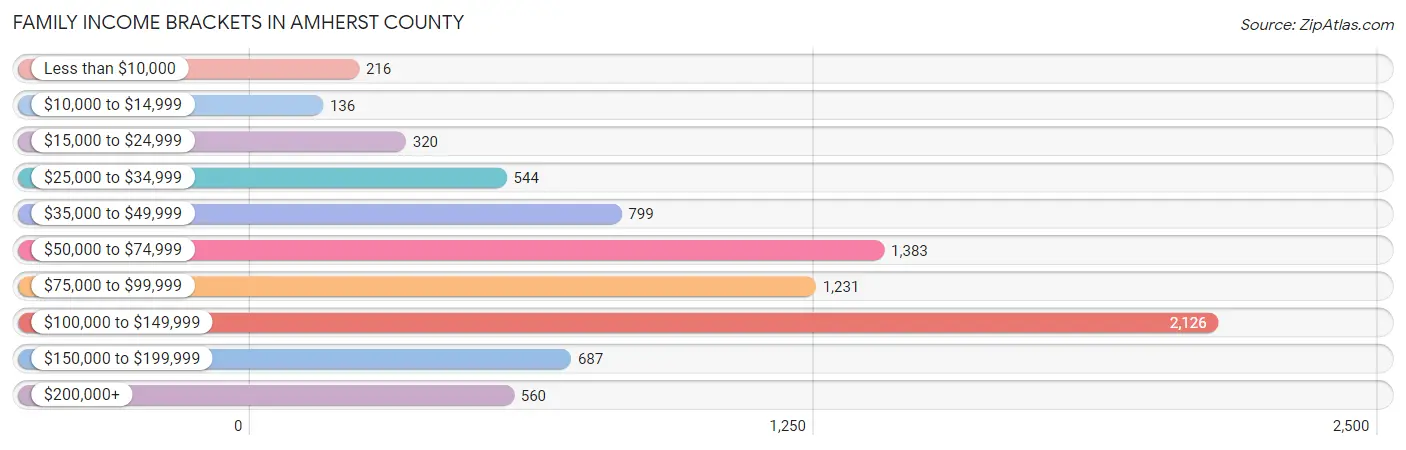
Family Income Brackets in Amherst County
According to the Amherst County family income data, there are 2,126 families falling into the $100,000 to $149,999 income range, which is the most common income bracket and makes up 26.6% of all families. Conversely, the $10,000 to $14,999 income bracket is the least frequent group with only 136 families (1.7%) belonging to this category.
| Income Bracket | # Families | % Families |
| Less than $10,000 | 216 | 2.7% |
| $10,000 to $14,999 | 136 | 1.7% |
| $15,000 to $24,999 | 320 | 4.0% |
| $25,000 to $34,999 | 544 | 6.8% |
| $35,000 to $49,999 | 799 | 10.0% |
| $50,000 to $74,999 | 1,383 | 17.3% |
| $75,000 to $99,999 | 1,231 | 15.4% |
| $100,000 to $149,999 | 2,126 | 26.6% |
| $150,000 to $199,999 | 687 | 8.6% |
| $200,000+ | 560 | 7.0% |
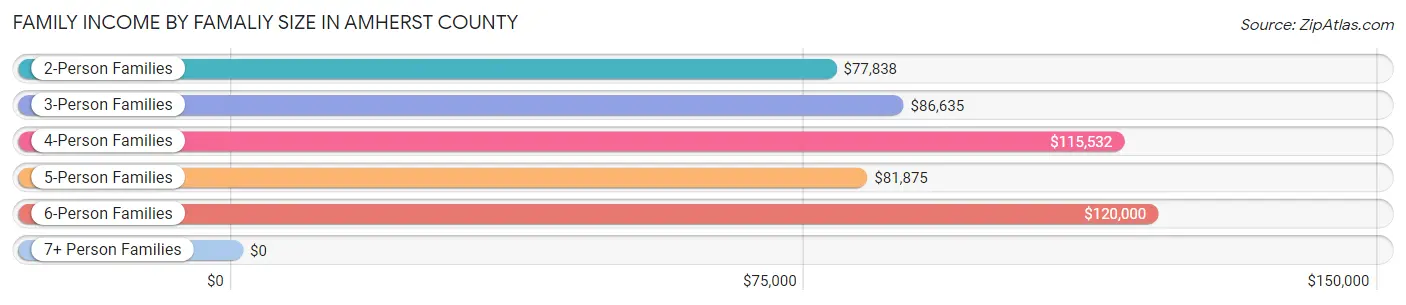
Family Income by Famaliy Size in Amherst County
6-person families (236 | 2.9%) account for the highest median family income in Amherst County with $120,000 per family, while 2-person families (4,199 | 52.5%) have the highest median income of $38,919 per family member.
| Income Bracket | # Families | Median Income |
| 2-Person Families | 4,199 (52.5%) | $77,838 |
| 3-Person Families | 1,459 (18.2%) | $86,635 |
| 4-Person Families | 1,504 (18.8%) | $115,532 |
| 5-Person Families | 487 (6.1%) | $81,875 |
| 6-Person Families | 236 (2.9%) | $120,000 |
| 7+ Person Families | 109 (1.4%) | $0 |
| Total | 7,994 (100.0%) | $85,267 |
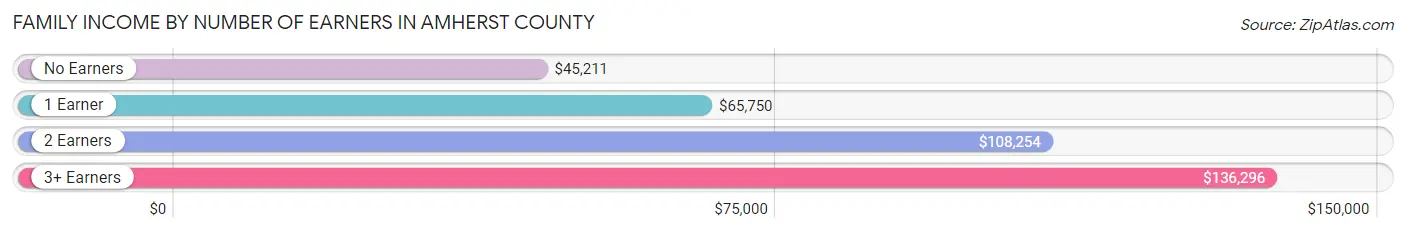
Family Income by Number of Earners in Amherst County
The median family income in Amherst County is $85,267, with families comprising 3+ earners (1,006) having the highest median family income of $136,296, while families with no earners (1,520) have the lowest median family income of $45,211, accounting for 12.6% and 19.0% of families, respectively.
| Number of Earners | # Families | Median Income |
| No Earners | 1,520 (19.0%) | $45,211 |
| 1 Earner | 2,416 (30.2%) | $65,750 |
| 2 Earners | 3,052 (38.2%) | $108,254 |
| 3+ Earners | 1,006 (12.6%) | $136,296 |
| Total | 7,994 (100.0%) | $85,267 |
Household Income in Amherst County
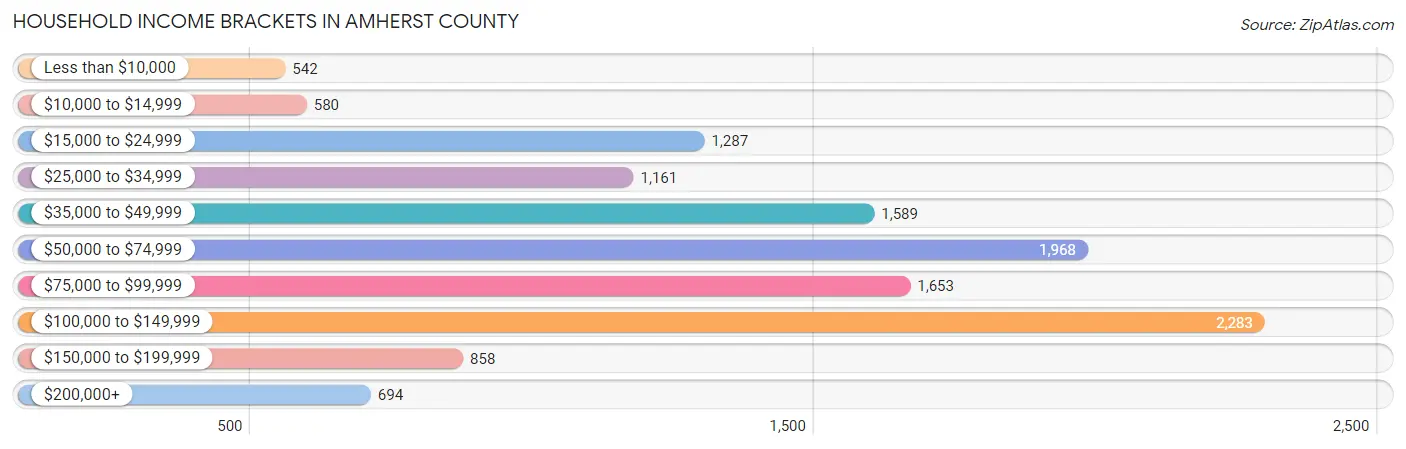
Household Income Brackets in Amherst County
With 2,283 households falling in the category, the $100,000 to $149,999 income range is the most frequent in Amherst County, accounting for 18.1% of all households. In contrast, only 542 households (4.3%) fall into the less than $10,000 income bracket, making it the least populous group.
| Income Bracket | # Households | % Households |
| Less than $10,000 | 542 | 4.3% |
| $10,000 to $14,999 | 580 | 4.6% |
| $15,000 to $24,999 | 1,287 | 10.2% |
| $25,000 to $34,999 | 1,161 | 9.2% |
| $35,000 to $49,999 | 1,589 | 12.6% |
| $50,000 to $74,999 | 1,968 | 15.6% |
| $75,000 to $99,999 | 1,653 | 13.1% |
| $100,000 to $149,999 | 2,283 | 18.1% |
| $150,000 to $199,999 | 858 | 6.8% |
| $200,000+ | 694 | 5.5% |
Household Income by Householder Age in Amherst County
The median household income in Amherst County is $64,454, with the highest median household income of $78,758 found in the 45 to 64 years age bracket for the primary householder. A total of 4,691 households (37.2%) fall into this category. Meanwhile, the 65+ years age bracket for the primary householder has the lowest median household income of $44,094, with 4,280 households (33.9%) in this group.
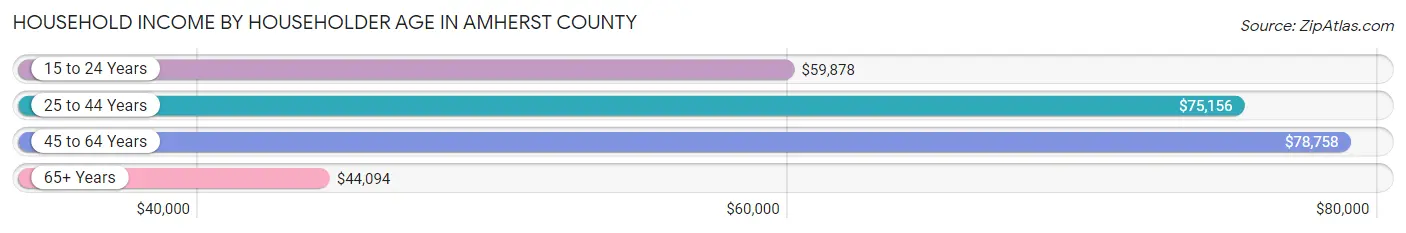
| Income Bracket | # Households | Median Income |
| 15 to 24 Years | 262 (2.1%) | $59,878 |
| 25 to 44 Years | 3,382 (26.8%) | $75,156 |
| 45 to 64 Years | 4,691 (37.2%) | $78,758 |
| 65+ Years | 4,280 (33.9%) | $44,094 |
| Total | 12,615 (100.0%) | $64,454 |
Poverty in Amherst County
Income Below Poverty by Sex and Age in Amherst County
With 9.7% poverty level for males and 12.8% for females among the residents of Amherst County, 16 and 17 year old males and 18 to 24 year old females are the most vulnerable to poverty, with 53 males (17.4%) and 317 females (27.0%) in their respective age groups living below the poverty level.
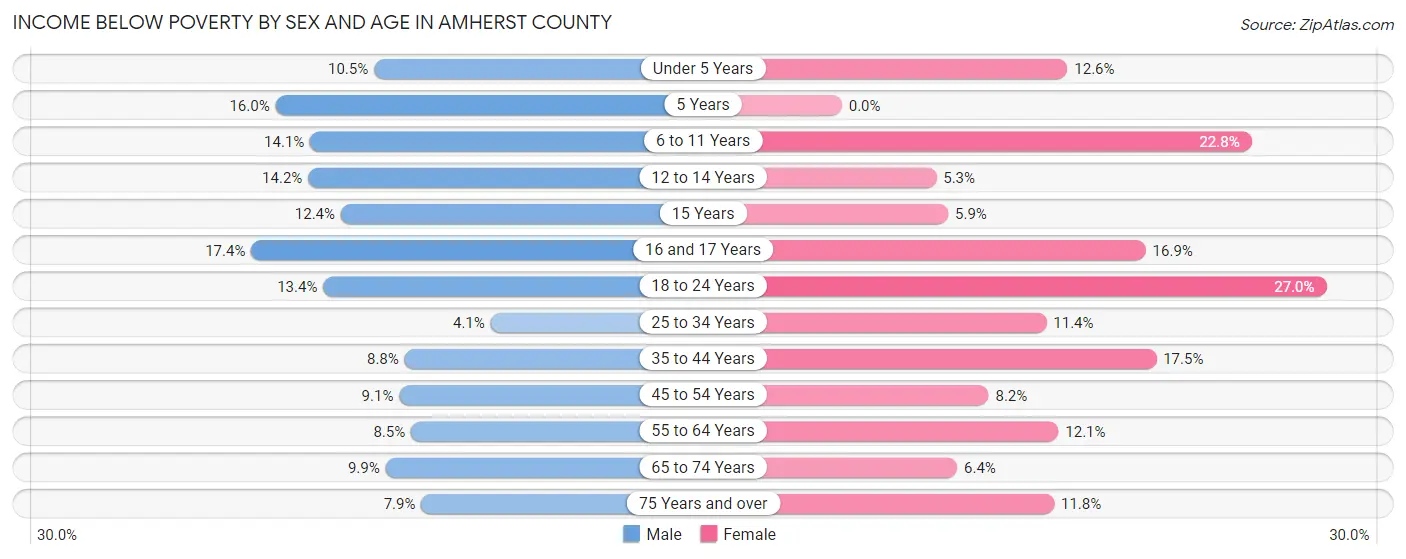
| Age Bracket | Male | Female |
| Under 5 Years | 86 (10.5%) | 105 (12.6%) |
| 5 Years | 25 (16.0%) | 0 (0.0%) |
| 6 to 11 Years | 144 (14.1%) | 213 (22.8%) |
| 12 to 14 Years | 84 (14.2%) | 29 (5.3%) |
| 15 Years | 29 (12.4%) | 9 (5.9%) |
| 16 and 17 Years | 53 (17.4%) | 56 (16.9%) |
| 18 to 24 Years | 163 (13.4%) | 317 (27.0%) |
| 25 to 34 Years | 70 (4.1%) | 183 (11.4%) |
| 35 to 44 Years | 155 (8.8%) | 321 (17.5%) |
| 45 to 54 Years | 166 (9.1%) | 165 (8.2%) |
| 55 to 64 Years | 195 (8.5%) | 298 (12.1%) |
| 65 to 74 Years | 176 (9.9%) | 128 (6.4%) |
| 75 Years and over | 88 (7.9%) | 194 (11.8%) |
| Total | 1,434 (9.7%) | 2,018 (12.8%) |
Income Above Poverty by Sex and Age in Amherst County
According to the poverty statistics in Amherst County, males aged 25 to 34 years and females aged 5 years are the age groups that are most secure financially, with 96.0% of males and 100.0% of females in these age groups living above the poverty line.
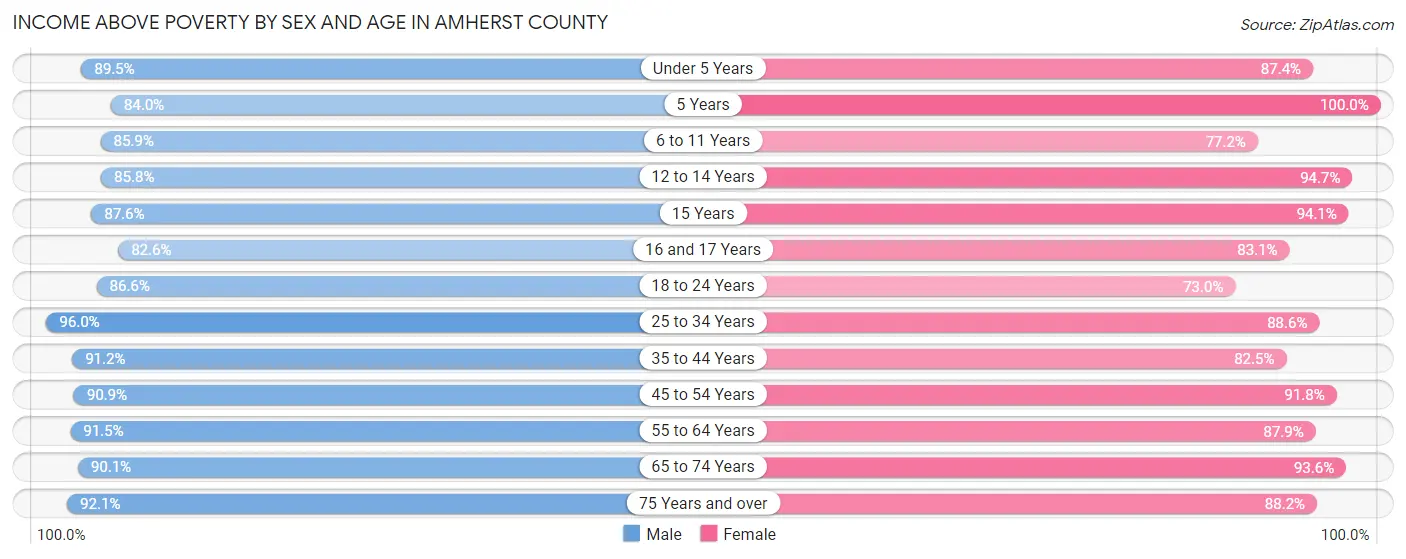
| Age Bracket | Male | Female |
| Under 5 Years | 730 (89.5%) | 731 (87.4%) |
| 5 Years | 131 (84.0%) | 195 (100.0%) |
| 6 to 11 Years | 877 (85.9%) | 721 (77.2%) |
| 12 to 14 Years | 507 (85.8%) | 522 (94.7%) |
| 15 Years | 205 (87.6%) | 143 (94.1%) |
| 16 and 17 Years | 252 (82.6%) | 275 (83.1%) |
| 18 to 24 Years | 1,056 (86.6%) | 858 (73.0%) |
| 25 to 34 Years | 1,659 (96.0%) | 1,423 (88.6%) |
| 35 to 44 Years | 1,599 (91.2%) | 1,512 (82.5%) |
| 45 to 54 Years | 1,651 (90.9%) | 1,855 (91.8%) |
| 55 to 64 Years | 2,105 (91.5%) | 2,174 (87.9%) |
| 65 to 74 Years | 1,602 (90.1%) | 1,867 (93.6%) |
| 75 Years and over | 1,025 (92.1%) | 1,447 (88.2%) |
| Total | 13,399 (90.3%) | 13,723 (87.2%) |
Income Below Poverty Among Married-Couple Families in Amherst County
The poverty statistics for married-couple families in Amherst County show that 4.2% or 251 of the total 6,039 families live below the poverty line. Families with 3 or 4 children have the highest poverty rate of 23.7%, comprising of 84 families. On the other hand, families with 5 or more children have the lowest poverty rate of 0.0%, which includes 0 families.
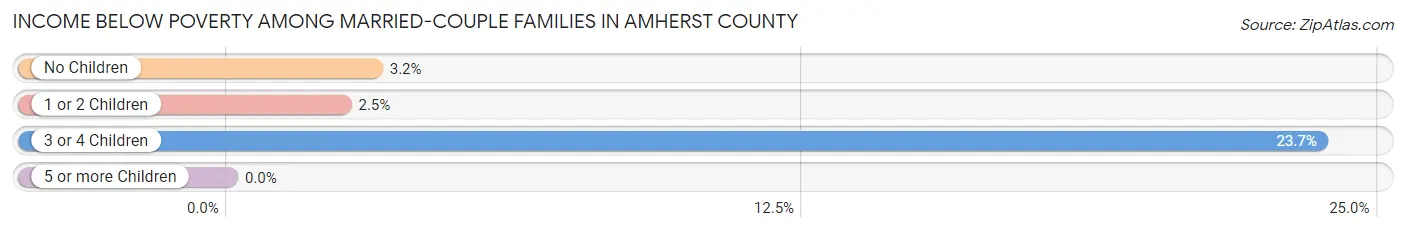
| Children | Above Poverty | Below Poverty |
| No Children | 3,879 (96.9%) | 126 (3.2%) |
| 1 or 2 Children | 1,618 (97.5%) | 41 (2.5%) |
| 3 or 4 Children | 270 (76.3%) | 84 (23.7%) |
| 5 or more Children | 21 (100.0%) | 0 (0.0%) |
| Total | 5,788 (95.8%) | 251 (4.2%) |
Income Below Poverty Among Single-Parent Households in Amherst County
According to the poverty data in Amherst County, 19.6% or 120 single-father households and 15.0% or 202 single-mother households are living below the poverty line. Among single-father households, those with 1 or 2 children have the highest poverty rate, with 73 households (34.1%) experiencing poverty. Likewise, among single-mother households, those with 1 or 2 children have the highest poverty rate, with 130 households (24.8%) falling below the poverty line.
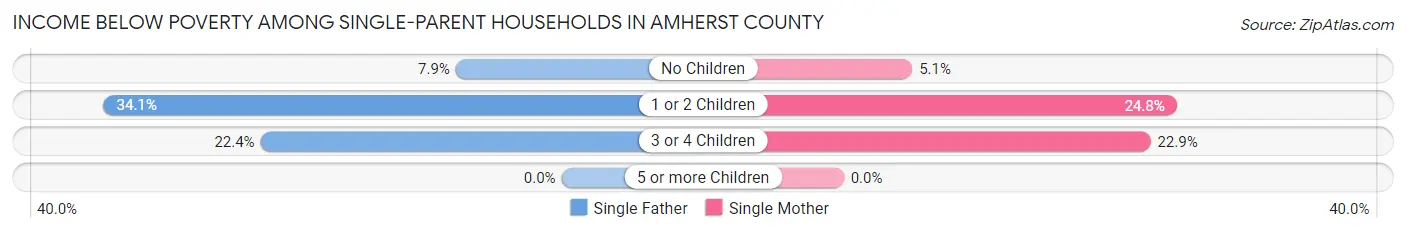
| Children | Single Father | Single Mother |
| No Children | 23 (7.9%) | 32 (5.1%) |
| 1 or 2 Children | 73 (34.1%) | 130 (24.8%) |
| 3 or 4 Children | 24 (22.4%) | 40 (22.9%) |
| 5 or more Children | 0 (0.0%) | 0 (0.0%) |
| Total | 120 (19.6%) | 202 (15.0%) |
Income Below Poverty Among Married-Couple vs Single-Parent Households in Amherst County
The poverty data for Amherst County shows that 251 of the married-couple family households (4.2%) and 322 of the single-parent households (16.5%) are living below the poverty level. Within the married-couple family households, those with 3 or 4 children have the highest poverty rate, with 84 households (23.7%) falling below the poverty line. Among the single-parent households, those with 1 or 2 children have the highest poverty rate, with 203 household (27.5%) living below poverty.
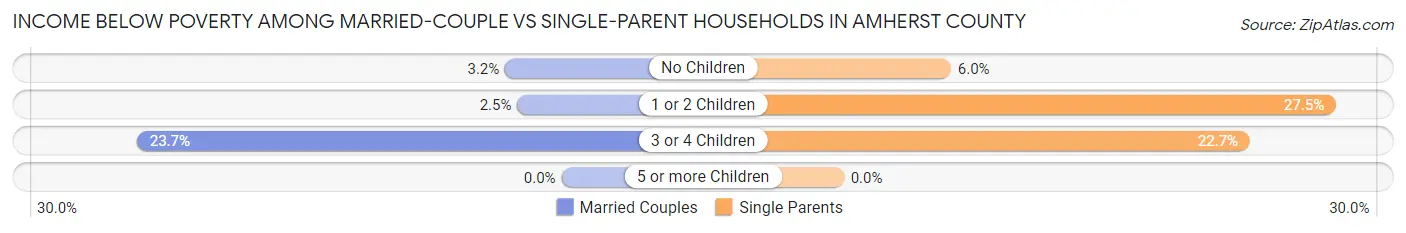
| Children | Married-Couple Families | Single-Parent Households |
| No Children | 126 (3.2%) | 55 (6.0%) |
| 1 or 2 Children | 41 (2.5%) | 203 (27.5%) |
| 3 or 4 Children | 84 (23.7%) | 64 (22.7%) |
| 5 or more Children | 0 (0.0%) | 0 (0.0%) |
| Total | 251 (4.2%) | 322 (16.5%) |
Race in Amherst County
The most populous races in Amherst County are White / Caucasian (23,551 | 74.9%), Black / African American (5,726 | 18.2%), and Two or more Races (1,108 | 3.5%).
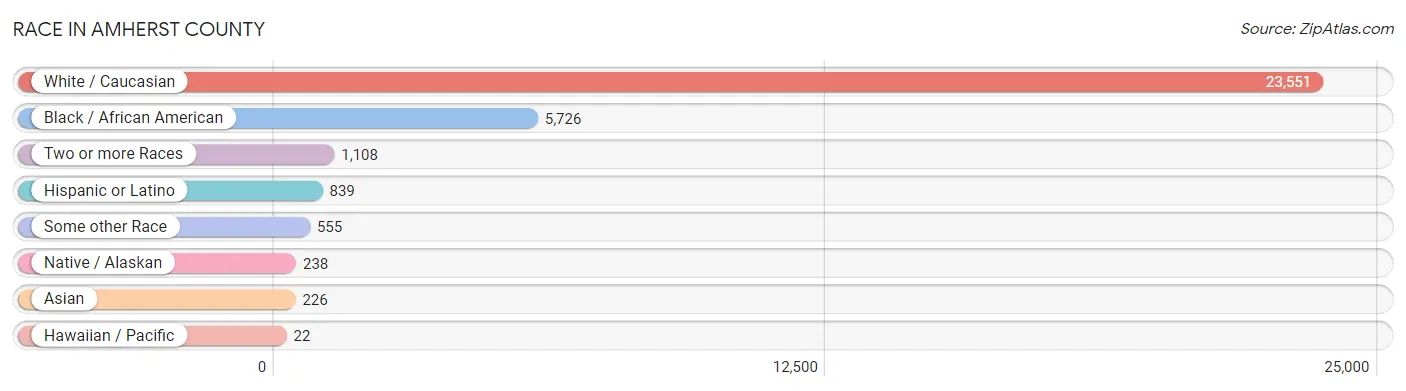
| Race | # Population | % Population |
| Asian | 226 | 0.7% |
| Black / African American | 5,726 | 18.2% |
| Hawaiian / Pacific | 22 | 0.1% |
| Hispanic or Latino | 839 | 2.7% |
| Native / Alaskan | 238 | 0.8% |
| White / Caucasian | 23,551 | 74.9% |
| Two or more Races | 1,108 | 3.5% |
| Some other Race | 555 | 1.8% |
| Total | 31,426 | 100.0% |
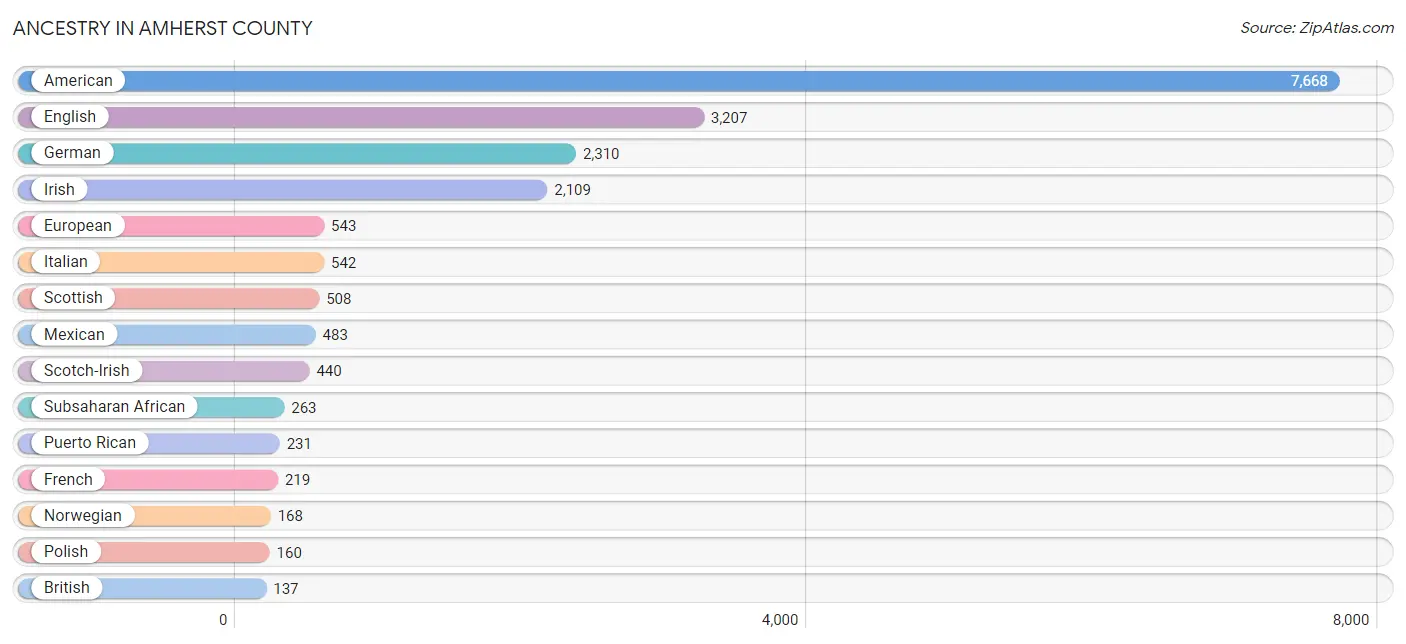
Ancestry in Amherst County
The most populous ancestries reported in Amherst County are American (7,668 | 24.4%), English (3,207 | 10.2%), German (2,310 | 7.3%), Irish (2,109 | 6.7%), and European (543 | 1.7%), together accounting for 50.4% of all Amherst County residents.
| Ancestry | # Population | % Population |
| African | 132 | 0.4% |
| American | 7,668 | 24.4% |
| Arab | 18 | 0.1% |
| Austrian | 27 | 0.1% |
| British | 137 | 0.4% |
| Bulgarian | 8 | 0.0% |
| Burmese | 22 | 0.1% |
| Cajun | 7 | 0.0% |
| Canadian | 5 | 0.0% |
| Central American | 56 | 0.2% |
| Cherokee | 34 | 0.1% |
| Chippewa | 7 | 0.0% |
| Costa Rican | 21 | 0.1% |
| Croatian | 6 | 0.0% |
| Czechoslovakian | 8 | 0.0% |
| Danish | 65 | 0.2% |
| Dutch | 129 | 0.4% |
| Eastern European | 75 | 0.2% |
| English | 3,207 | 10.2% |
| European | 543 | 1.7% |
| Filipino | 14 | 0.0% |
| Finnish | 4 | 0.0% |
| French | 219 | 0.7% |
| French Canadian | 49 | 0.2% |
| German | 2,310 | 7.3% |
| Ghanaian | 119 | 0.4% |
| Greek | 17 | 0.1% |
| Honduran | 15 | 0.1% |
| Hungarian | 50 | 0.2% |
| Indian (Asian) | 27 | 0.1% |
| Irish | 2,109 | 6.7% |
| Italian | 542 | 1.7% |
| Jamaican | 12 | 0.0% |
| Korean | 63 | 0.2% |
| Lebanese | 13 | 0.0% |
| Lithuanian | 15 | 0.1% |
| Mexican | 483 | 1.5% |
| Native Hawaiian | 33 | 0.1% |
| Nicaraguan | 14 | 0.0% |
| Nigerian | 12 | 0.0% |
| Northern European | 34 | 0.1% |
| Norwegian | 168 | 0.5% |
| Pakistani | 10 | 0.0% |
| Panamanian | 6 | 0.0% |
| Polish | 160 | 0.5% |
| Puerto Rican | 231 | 0.7% |
| Russian | 28 | 0.1% |
| Samoan | 14 | 0.0% |
| Scandinavian | 52 | 0.2% |
| Scotch-Irish | 440 | 1.4% |
| Scottish | 508 | 1.6% |
| Serbian | 1 | 0.0% |
| Slovak | 59 | 0.2% |
| Spaniard | 15 | 0.1% |
| Sri Lankan | 40 | 0.1% |
| Subsaharan African | 263 | 0.8% |
| Swedish | 116 | 0.4% |
| Swiss | 36 | 0.1% |
| Syrian | 5 | 0.0% |
| Thai | 112 | 0.4% |
| Trinidadian and Tobagonian | 5 | 0.0% |
| Ukrainian | 17 | 0.1% |
| Vietnamese | 3 | 0.0% |
| Welsh | 54 | 0.2% | View All 64 Rows |
Immigrants in Amherst County
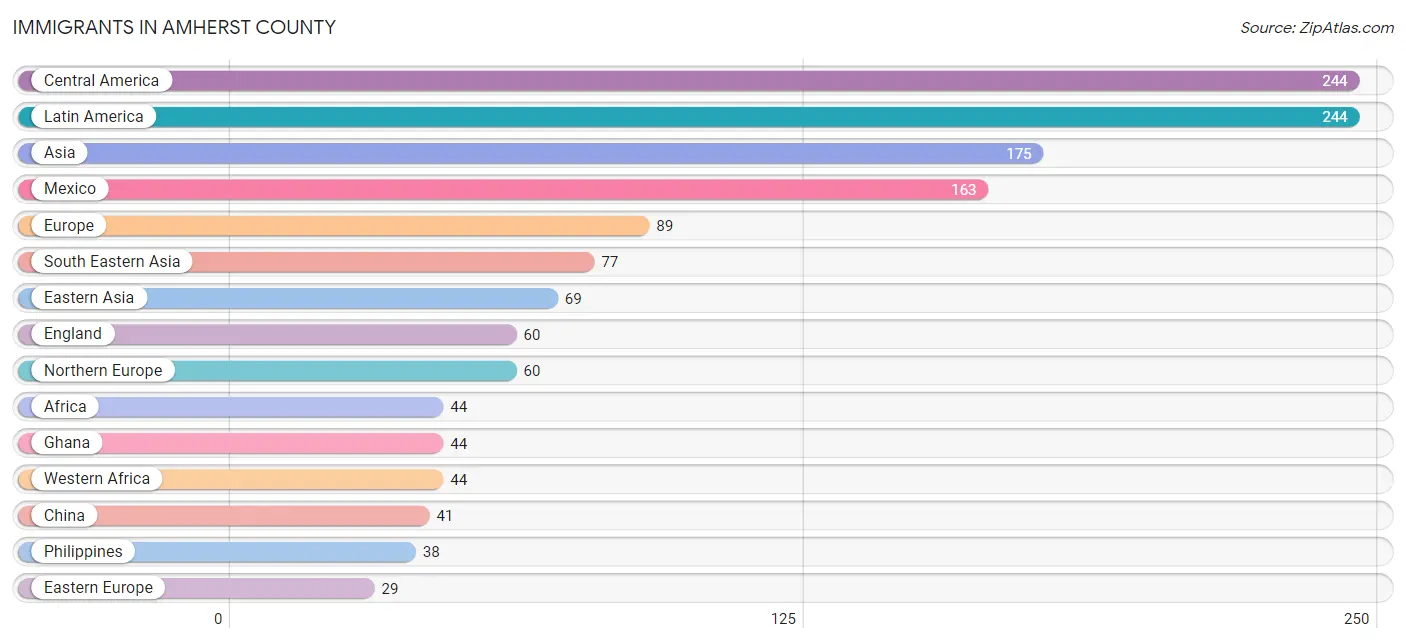
The most numerous immigrant groups reported in Amherst County came from Central America (244 | 0.8%), Latin America (244 | 0.8%), Asia (175 | 0.6%), Mexico (163 | 0.5%), and Europe (89 | 0.3%), together accounting for 2.9% of all Amherst County residents.
| Immigration Origin | # Population | % Population |
| Africa | 44 | 0.1% |
| Asia | 175 | 0.6% |
| Bangladesh | 3 | 0.0% |
| Bulgaria | 8 | 0.0% |
| Canada | 10 | 0.0% |
| Central America | 244 | 0.8% |
| China | 41 | 0.1% |
| Costa Rica | 21 | 0.1% |
| Eastern Asia | 69 | 0.2% |
| Eastern Europe | 29 | 0.1% |
| El Salvador | 24 | 0.1% |
| England | 60 | 0.2% |
| Europe | 89 | 0.3% |
| Ghana | 44 | 0.1% |
| Guatemala | 24 | 0.1% |
| Honduras | 12 | 0.0% |
| Hong Kong | 4 | 0.0% |
| India | 26 | 0.1% |
| Japan | 19 | 0.1% |
| Korea | 9 | 0.0% |
| Latin America | 244 | 0.8% |
| Mexico | 163 | 0.5% |
| Northern Europe | 60 | 0.2% |
| Oceania | 14 | 0.0% |
| Philippines | 38 | 0.1% |
| Poland | 8 | 0.0% |
| Russia | 13 | 0.0% |
| South Central Asia | 29 | 0.1% |
| South Eastern Asia | 77 | 0.3% |
| Taiwan | 14 | 0.0% |
| Vietnam | 26 | 0.1% |
| Western Africa | 44 | 0.1% | View All 32 Rows |
Sex and Age in Amherst County
Sex and Age in Amherst County
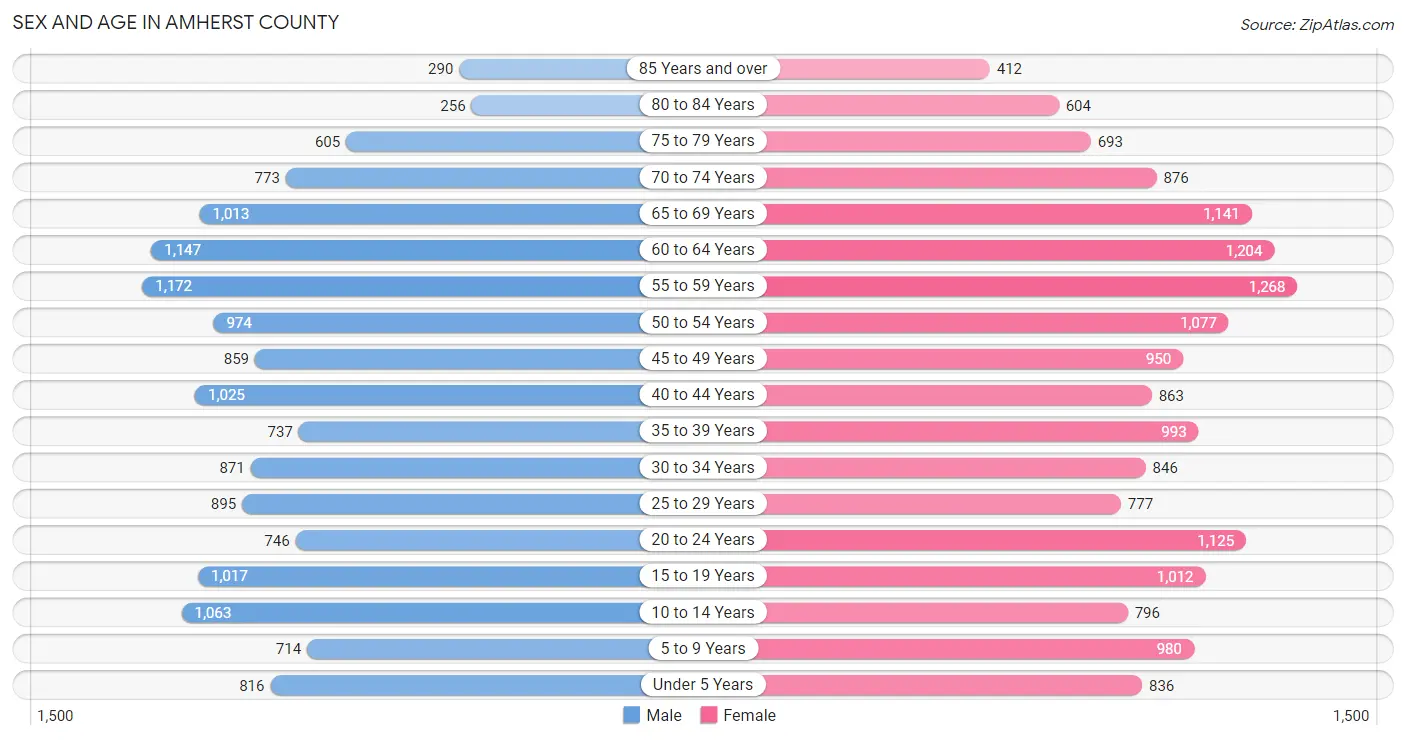
The most populous age groups in Amherst County are 55 to 59 Years (1,172 | 7.8%) for men and 55 to 59 Years (1,268 | 7.7%) for women.
| Age Bracket | Male | Female |
| Under 5 Years | 816 (5.4%) | 836 (5.1%) |
| 5 to 9 Years | 714 (4.8%) | 980 (6.0%) |
| 10 to 14 Years | 1,063 (7.1%) | 796 (4.8%) |
| 15 to 19 Years | 1,017 (6.8%) | 1,012 (6.1%) |
| 20 to 24 Years | 746 (5.0%) | 1,125 (6.8%) |
| 25 to 29 Years | 895 (6.0%) | 777 (4.7%) |
| 30 to 34 Years | 871 (5.8%) | 846 (5.1%) |
| 35 to 39 Years | 737 (4.9%) | 993 (6.0%) |
| 40 to 44 Years | 1,025 (6.9%) | 863 (5.2%) |
| 45 to 49 Years | 859 (5.7%) | 950 (5.8%) |
| 50 to 54 Years | 974 (6.5%) | 1,077 (6.6%) |
| 55 to 59 Years | 1,172 (7.8%) | 1,268 (7.7%) |
| 60 to 64 Years | 1,147 (7.7%) | 1,204 (7.3%) |
| 65 to 69 Years | 1,013 (6.8%) | 1,141 (6.9%) |
| 70 to 74 Years | 773 (5.2%) | 876 (5.3%) |
| 75 to 79 Years | 605 (4.0%) | 693 (4.2%) |
| 80 to 84 Years | 256 (1.7%) | 604 (3.7%) |
| 85 Years and over | 290 (1.9%) | 412 (2.5%) |
| Total | 14,973 (100.0%) | 16,453 (100.0%) |
Families and Households in Amherst County
Median Family Size in Amherst County
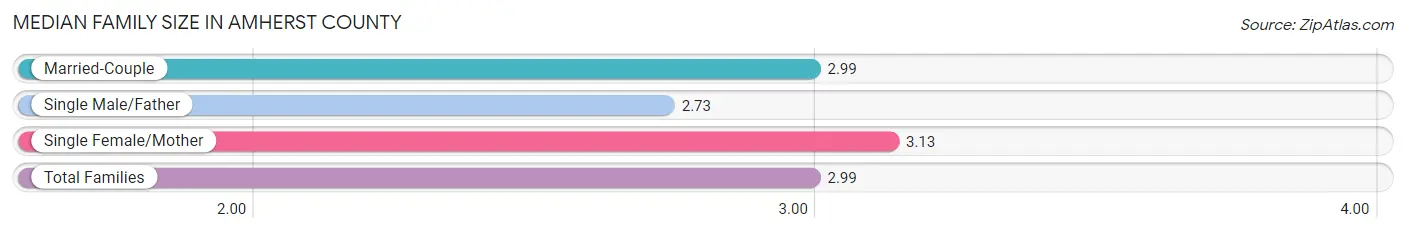
The median family size in Amherst County is 2.99 persons per family, with single female/mother families (1,342 | 16.8%) accounting for the largest median family size of 3.13 persons per family. On the other hand, single male/father families (613 | 7.7%) represent the smallest median family size with 2.73 persons per family.
| Family Type | # Families | Family Size |
| Married-Couple | 6,039 (75.5%) | 2.99 |
| Single Male/Father | 613 (7.7%) | 2.73 |
| Single Female/Mother | 1,342 (16.8%) | 3.13 |
| Total Families | 7,994 (100.0%) | 2.99 |
Median Household Size in Amherst County
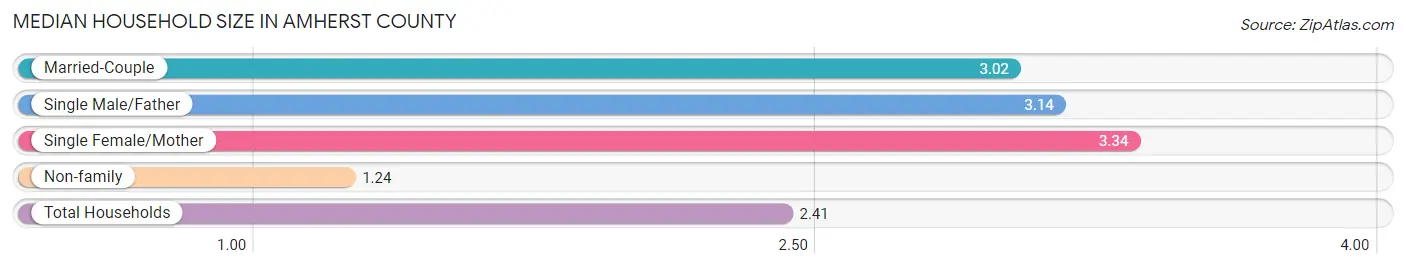
The median household size in Amherst County is 2.41 persons per household, with single female/mother households (1,342 | 10.6%) accounting for the largest median household size of 3.34 persons per household. non-family households (4,621 | 36.6%) represent the smallest median household size with 1.24 persons per household.
| Household Type | # Households | Household Size |
| Married-Couple | 6,039 (47.9%) | 3.02 |
| Single Male/Father | 613 (4.9%) | 3.14 |
| Single Female/Mother | 1,342 (10.6%) | 3.34 |
| Non-family | 4,621 (36.6%) | 1.24 |
| Total Households | 12,615 (100.0%) | 2.41 |
Household Size by Marriage Status in Amherst County
Out of a total of 12,615 households in Amherst County, 7,994 (63.4%) are family households, while 4,621 (36.6%) are nonfamily households. The most numerous type of family households are 2-person households, comprising 3,861, and the most common type of nonfamily households are 1-person households, comprising 3,662.
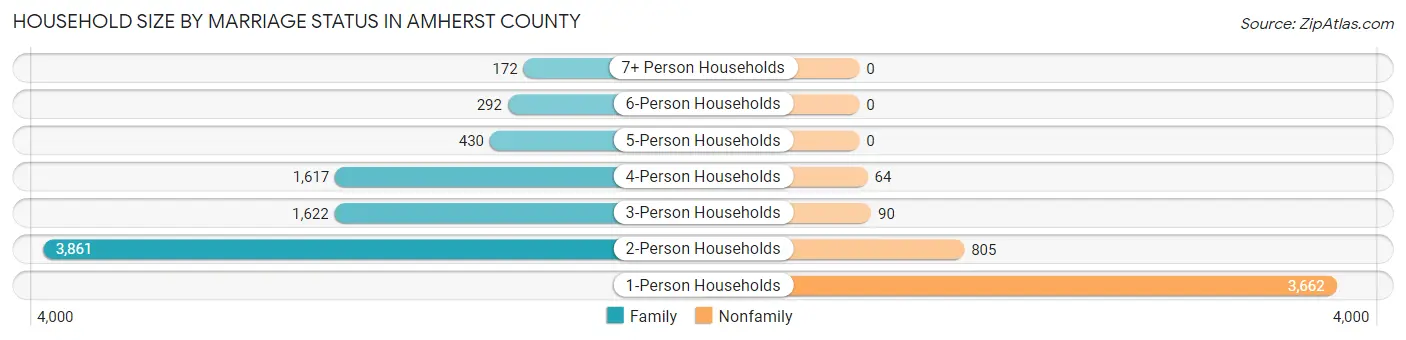
| Household Size | Family Households | Nonfamily Households |
| 1-Person Households | - | 3,662 (29.0%) |
| 2-Person Households | 3,861 (30.6%) | 805 (6.4%) |
| 3-Person Households | 1,622 (12.9%) | 90 (0.7%) |
| 4-Person Households | 1,617 (12.8%) | 64 (0.5%) |
| 5-Person Households | 430 (3.4%) | 0 (0.0%) |
| 6-Person Households | 292 (2.3%) | 0 (0.0%) |
| 7+ Person Households | 172 (1.4%) | 0 (0.0%) |
| Total | 7,994 (63.4%) | 4,621 (36.6%) |
Female Fertility in Amherst County
Fertility by Age in Amherst County
Average fertility rate in Amherst County is 35.0 births per 1,000 women. Women in the age bracket of 20 to 34 years have the highest fertility rate with 66.0 births per 1,000 women. Women in the age bracket of 20 to 34 years acount for 77.7% of all women with births.
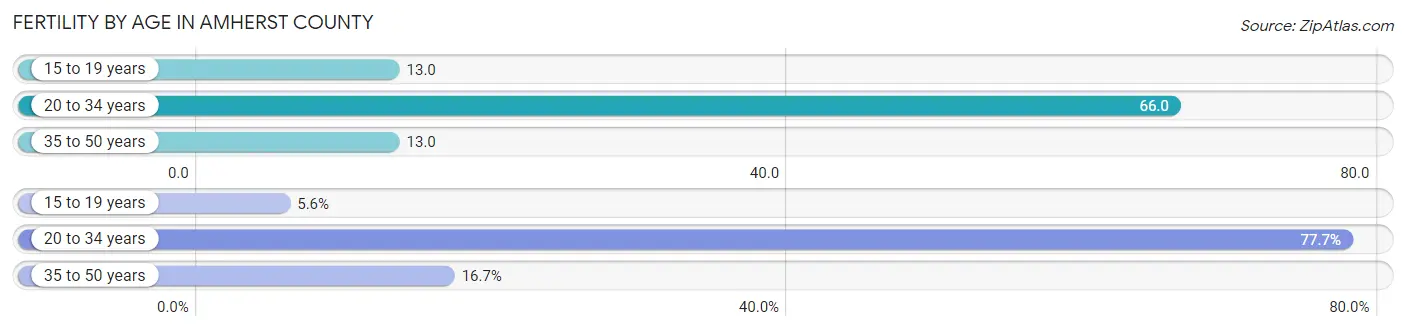
| Age Bracket | Women with Births | Births / 1,000 Women |
| 15 to 19 years | 13 (5.6%) | 13.0 |
| 20 to 34 years | 181 (77.7%) | 66.0 |
| 35 to 50 years | 39 (16.7%) | 13.0 |
| Total | 233 (100.0%) | 35.0 |
Fertility by Age by Marriage Status in Amherst County
53.6% of women with births (233) in Amherst County are married. The highest percentage of unmarried women with births falls into 15 to 19 years age bracket with 100.0% of them unmarried at the time of birth, while the lowest percentage of unmarried women with births belong to 35 to 50 years age bracket with 35.9% of them unmarried.
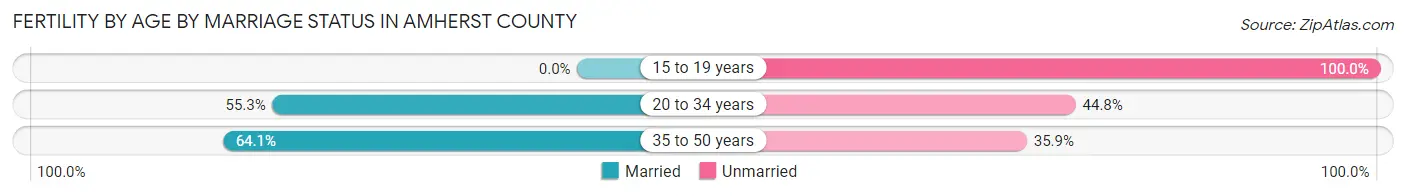
| Age Bracket | Married | Unmarried |
| 15 to 19 years | 0 (0.0%) | 13 (100.0%) |
| 20 to 34 years | 100 (55.2%) | 81 (44.8%) |
| 35 to 50 years | 25 (64.1%) | 14 (35.9%) |
| Total | 125 (53.6%) | 108 (46.4%) |
Fertility by Education in Amherst County
Average fertility rate in Amherst County is 35.0 births per 1,000 women. Women with the education attainment of high school diploma have the highest fertility rate of 47.0 births per 1,000 women, while women with the education attainment of less than high school have the lowest fertility at 9.0 births per 1,000 women. Women with the education attainment of high school diploma represent 39.5% of all women with births.
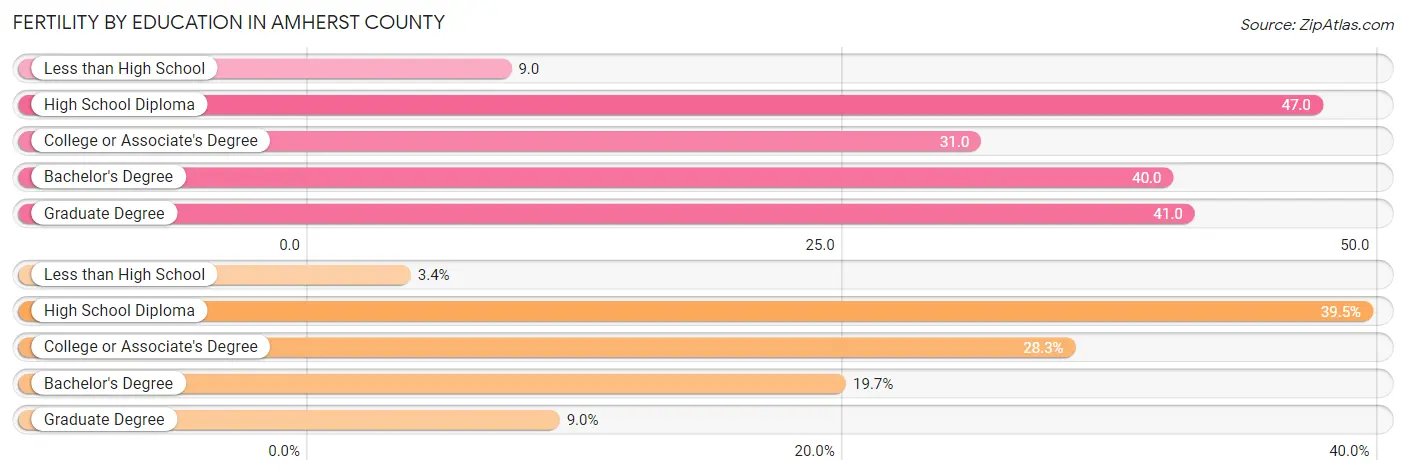
| Educational Attainment | Women with Births | Births / 1,000 Women |
| Less than High School | 8 (3.4%) | 9.0 |
| High School Diploma | 92 (39.5%) | 47.0 |
| College or Associate's Degree | 66 (28.3%) | 31.0 |
| Bachelor's Degree | 46 (19.7%) | 40.0 |
| Graduate Degree | 21 (9.0%) | 41.0 |
| Total | 233 (100.0%) | 35.0 |
Fertility by Education by Marriage Status in Amherst County
46.4% of women with births in Amherst County are unmarried. Women with the educational attainment of less than high school are most likely to be married with 100.0% of them married at childbirth, while women with the educational attainment of high school diploma are least likely to be married with 81.5% of them unmarried at childbirth.
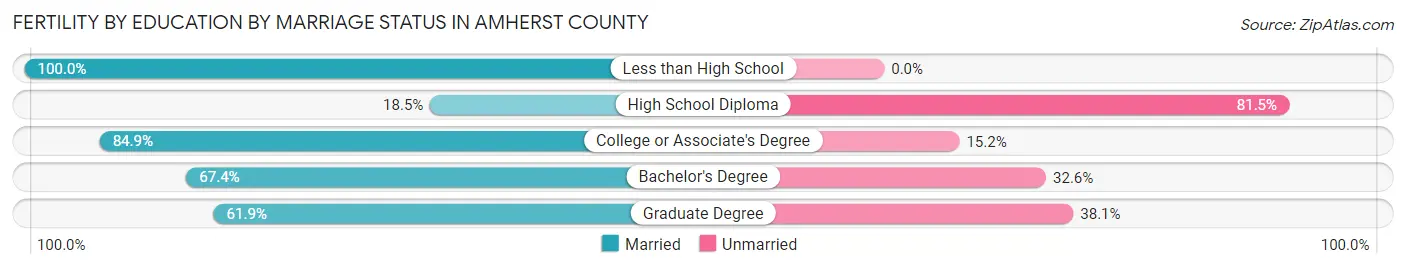
| Educational Attainment | Married | Unmarried |
| Less than High School | 8 (100.0%) | 0 (0.0%) |
| High School Diploma | 17 (18.5%) | 75 (81.5%) |
| College or Associate's Degree | 56 (84.9%) | 10 (15.1%) |
| Bachelor's Degree | 31 (67.4%) | 15 (32.6%) |
| Graduate Degree | 13 (61.9%) | 8 (38.1%) |
| Total | 125 (53.6%) | 108 (46.4%) |
Employment Characteristics in Amherst County
Employment by Class of Employer in Amherst County
Among the 14,609 employed individuals in Amherst County, private company employees (9,494 | 65.0%), not-for-profit organizations (1,417 | 9.7%), and local government employees (1,275 | 8.7%) make up the most common classes of employment.
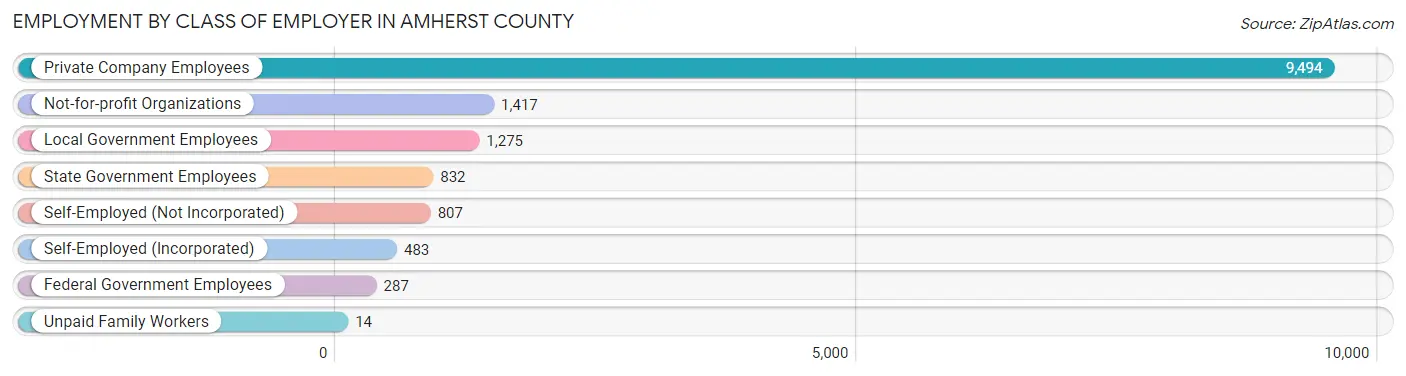
| Employer Class | # Employees | % Employees |
| Private Company Employees | 9,494 | 65.0% |
| Self-Employed (Incorporated) | 483 | 3.3% |
| Self-Employed (Not Incorporated) | 807 | 5.5% |
| Not-for-profit Organizations | 1,417 | 9.7% |
| Local Government Employees | 1,275 | 8.7% |
| State Government Employees | 832 | 5.7% |
| Federal Government Employees | 287 | 2.0% |
| Unpaid Family Workers | 14 | 0.1% |
| Total | 14,609 | 100.0% |
Employment Status by Age in Amherst County
According to the labor force statistics for Amherst County, out of the total population over 16 years of age (25,835), 60.7% or 15,682 individuals are in the labor force, with 4.5% or 706 of them unemployed. The age group with the highest labor force participation rate is 35 to 44 years, with 87.3% or 3,159 individuals in the labor force. Within the labor force, the 20 to 24 years age range has the highest percentage of unemployed individuals, with 7.7% or 98 of them being unemployed.
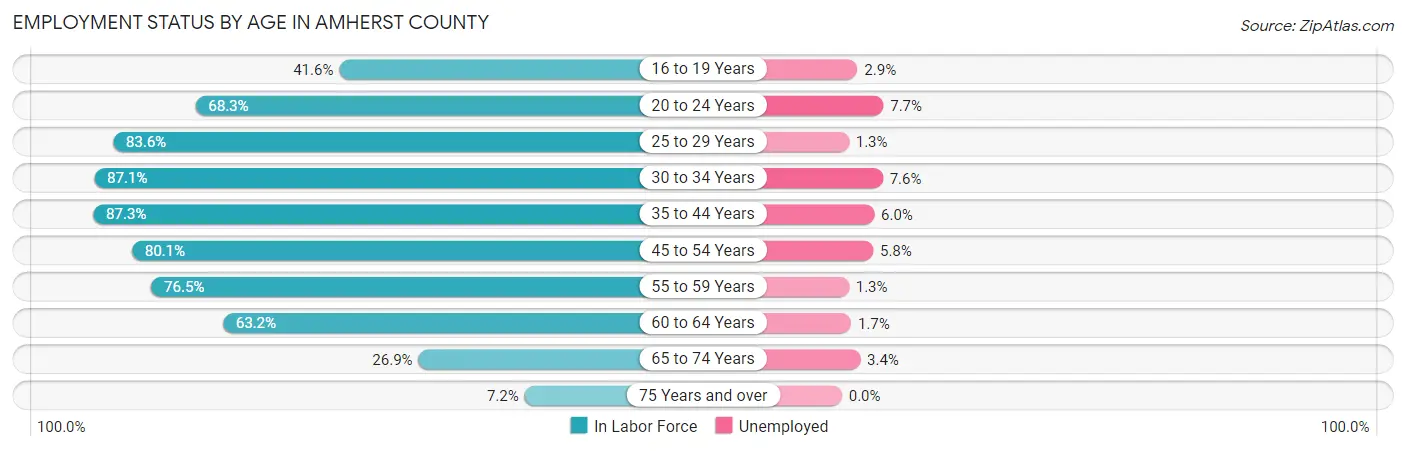
| Age Bracket | In Labor Force | Unemployed |
| 16 to 19 Years | 683 (41.6%) | 20 (2.9%) |
| 20 to 24 Years | 1,278 (68.3%) | 98 (7.7%) |
| 25 to 29 Years | 1,398 (83.6%) | 18 (1.3%) |
| 30 to 34 Years | 1,496 (87.1%) | 114 (7.6%) |
| 35 to 44 Years | 3,159 (87.3%) | 190 (6.0%) |
| 45 to 54 Years | 3,092 (80.1%) | 179 (5.8%) |
| 55 to 59 Years | 1,867 (76.5%) | 24 (1.3%) |
| 60 to 64 Years | 1,486 (63.2%) | 25 (1.7%) |
| 65 to 74 Years | 1,023 (26.9%) | 35 (3.4%) |
| 75 Years and over | 206 (7.2%) | 0 (0.0%) |
| Total | 15,682 (60.7%) | 706 (4.5%) |
Employment Status by Educational Attainment in Amherst County
According to labor force statistics for Amherst County, 79.8% of individuals (12,495) out of the total population between 25 and 64 years of age (15,658) are in the labor force, with 4.4% or 550 of them being unemployed. The group with the highest labor force participation rate are those with the educational attainment of bachelor's degree or higher, with 85.7% or 3,209 individuals in the labor force. Within the labor force, individuals with less than high school education have the highest percentage of unemployment, with 11.9% or 107 of them being unemployed.
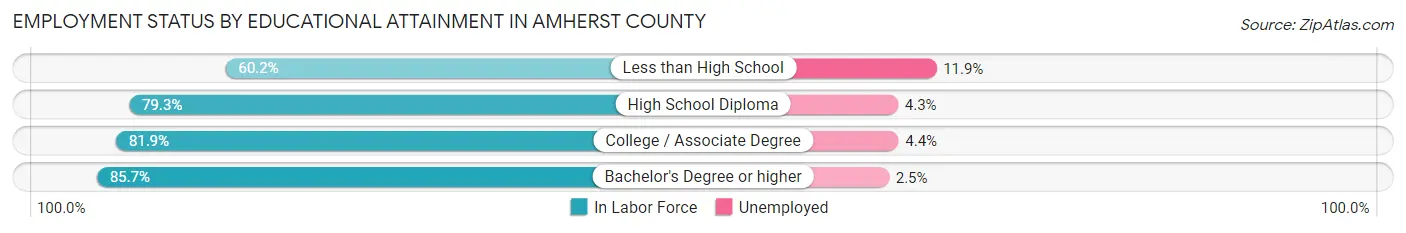
| Educational Attainment | In Labor Force | Unemployed |
| Less than High School | 896 (60.2%) | 177 (11.9%) |
| High School Diploma | 4,634 (79.3%) | 251 (4.3%) |
| College / Associate Degree | 3,752 (81.9%) | 202 (4.4%) |
| Bachelor's Degree or higher | 3,209 (85.7%) | 94 (2.5%) |
| Total | 12,495 (79.8%) | 689 (4.4%) |
Employment Occupations by Sex in Amherst County
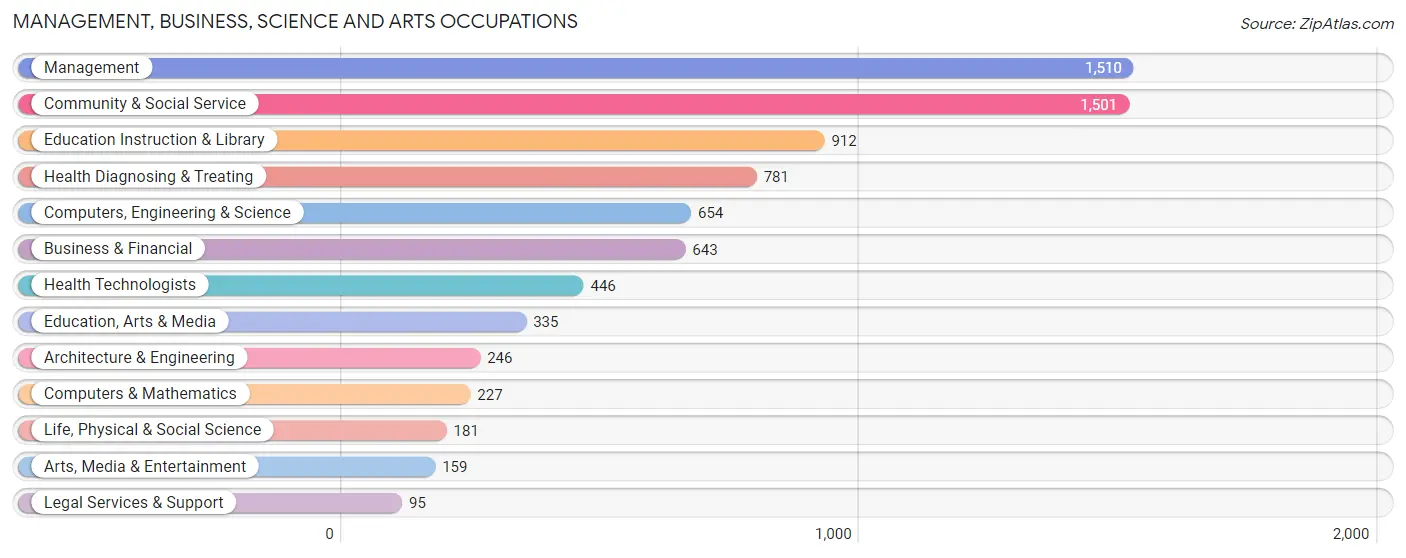
Management, Business, Science and Arts Occupations
The most common Management, Business, Science and Arts occupations in Amherst County are Management (1,510 | 10.1%), Community & Social Service (1,501 | 10.0%), Education Instruction & Library (912 | 6.1%), Health Diagnosing & Treating (781 | 5.2%), and Computers, Engineering & Science (654 | 4.4%).
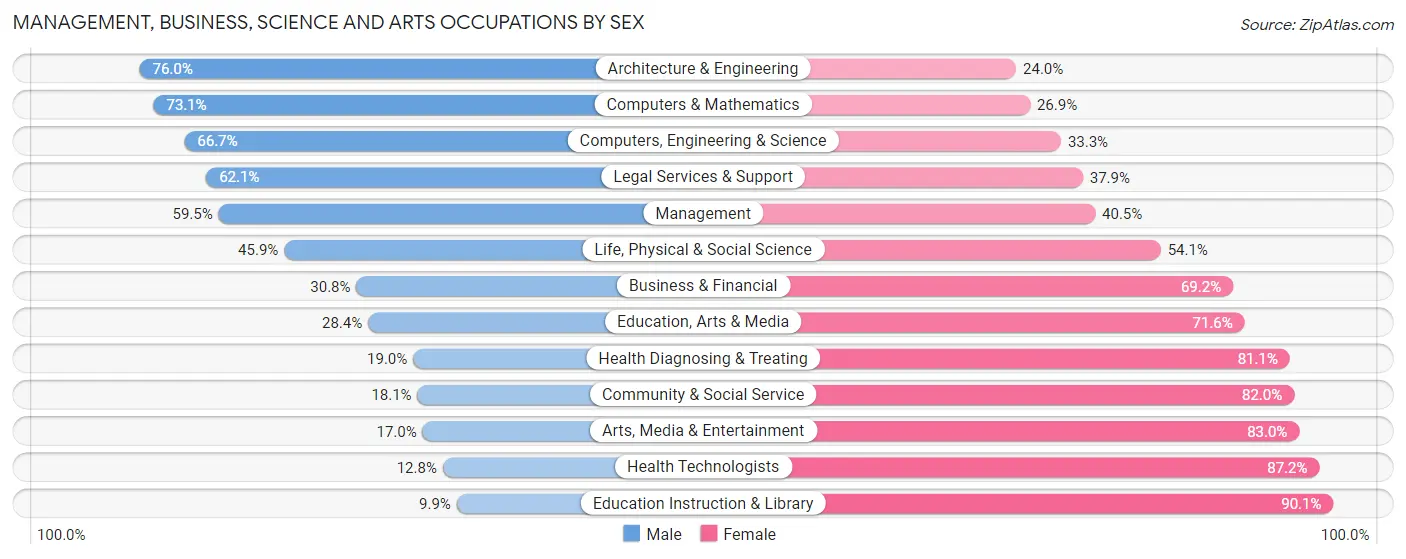
Management, Business, Science and Arts Occupations by Sex
Within the Management, Business, Science and Arts occupations in Amherst County, the most male-oriented occupations are Architecture & Engineering (76.0%), Computers & Mathematics (73.1%), and Computers, Engineering & Science (66.7%), while the most female-oriented occupations are Education Instruction & Library (90.1%), Health Technologists (87.2%), and Arts, Media & Entertainment (83.0%).
| Occupation | Male | Female |
| Management | 899 (59.5%) | 611 (40.5%) |
| Business & Financial | 198 (30.8%) | 445 (69.2%) |
| Computers, Engineering & Science | 436 (66.7%) | 218 (33.3%) |
| Computers & Mathematics | 166 (73.1%) | 61 (26.9%) |
| Architecture & Engineering | 187 (76.0%) | 59 (24.0%) |
| Life, Physical & Social Science | 83 (45.9%) | 98 (54.1%) |
| Community & Social Service | 271 (18.0%) | 1,230 (82.0%) |
| Education, Arts & Media | 95 (28.4%) | 240 (71.6%) |
| Legal Services & Support | 59 (62.1%) | 36 (37.9%) |
| Education Instruction & Library | 90 (9.9%) | 822 (90.1%) |
| Arts, Media & Entertainment | 27 (17.0%) | 132 (83.0%) |
| Health Diagnosing & Treating | 148 (19.0%) | 633 (81.0%) |
| Health Technologists | 57 (12.8%) | 389 (87.2%) |
| Total (Category) | 1,952 (38.4%) | 3,137 (61.6%) |
| Total (Overall) | 7,712 (51.5%) | 7,266 (48.5%) |
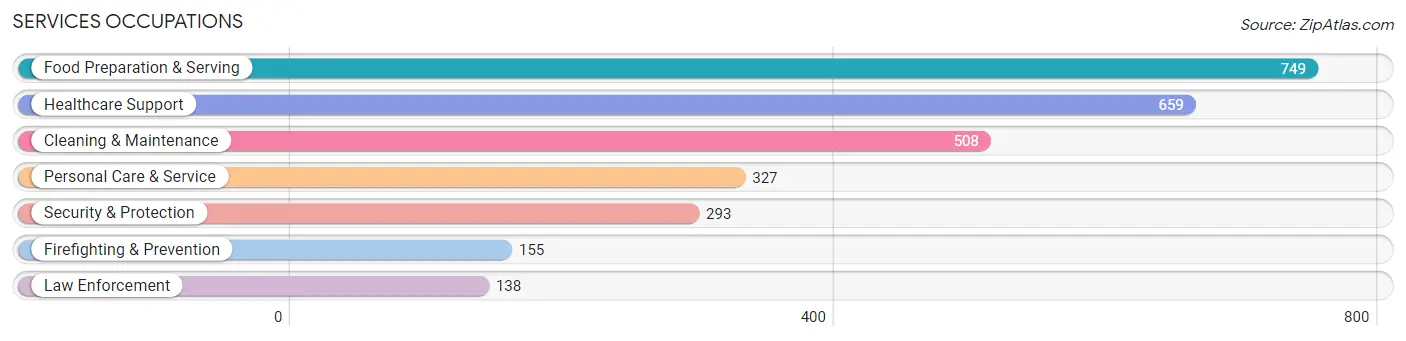
Services Occupations
The most common Services occupations in Amherst County are Food Preparation & Serving (749 | 5.0%), Healthcare Support (659 | 4.4%), Cleaning & Maintenance (508 | 3.4%), Personal Care & Service (327 | 2.2%), and Security & Protection (293 | 2.0%).
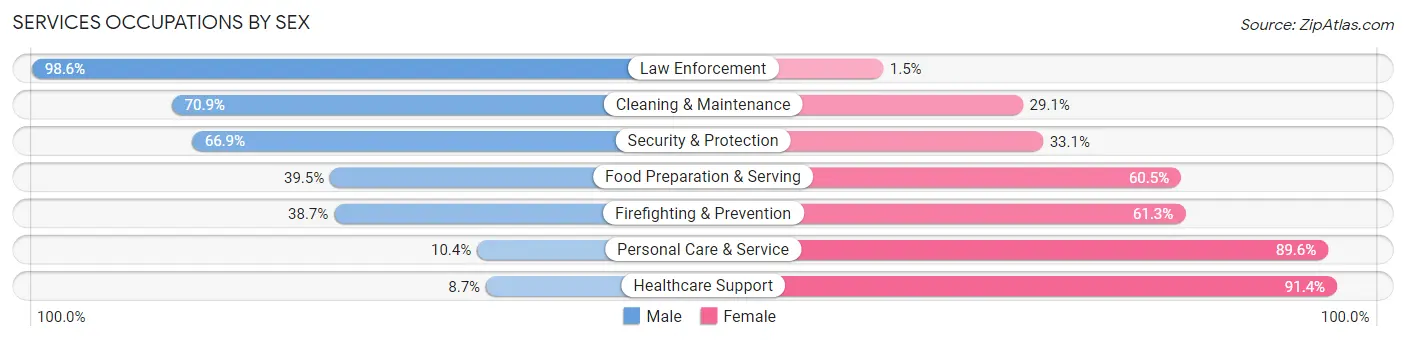
Services Occupations by Sex
Within the Services occupations in Amherst County, the most male-oriented occupations are Law Enforcement (98.6%), Cleaning & Maintenance (70.9%), and Security & Protection (66.9%), while the most female-oriented occupations are Healthcare Support (91.3%), Personal Care & Service (89.6%), and Firefighting & Prevention (61.3%).
| Occupation | Male | Female |
| Healthcare Support | 57 (8.6%) | 602 (91.3%) |
| Security & Protection | 196 (66.9%) | 97 (33.1%) |
| Firefighting & Prevention | 60 (38.7%) | 95 (61.3%) |
| Law Enforcement | 136 (98.6%) | 2 (1.5%) |
| Food Preparation & Serving | 296 (39.5%) | 453 (60.5%) |
| Cleaning & Maintenance | 360 (70.9%) | 148 (29.1%) |
| Personal Care & Service | 34 (10.4%) | 293 (89.6%) |
| Total (Category) | 943 (37.2%) | 1,593 (62.8%) |
| Total (Overall) | 7,712 (51.5%) | 7,266 (48.5%) |
Sales and Office Occupations
The most common Sales and Office occupations in Amherst County are Office & Administration (1,581 | 10.6%), and Sales & Related (1,349 | 9.0%).

Sales and Office Occupations by Sex

| Occupation | Male | Female |
| Sales & Related | 498 (36.9%) | 851 (63.1%) |
| Office & Administration | 265 (16.8%) | 1,316 (83.2%) |
| Total (Category) | 763 (26.0%) | 2,167 (74.0%) |
| Total (Overall) | 7,712 (51.5%) | 7,266 (48.5%) |
Natural Resources, Construction and Maintenance Occupations
The most common Natural Resources, Construction and Maintenance occupations in Amherst County are Installation, Maintenance & Repair (819 | 5.5%), Construction & Extraction (811 | 5.4%), and Farming, Fishing & Forestry (79 | 0.5%).

Natural Resources, Construction and Maintenance Occupations by Sex
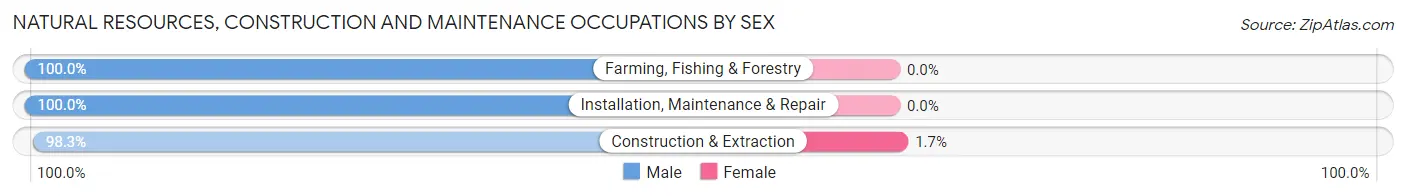
| Occupation | Male | Female |
| Farming, Fishing & Forestry | 79 (100.0%) | 0 (0.0%) |
| Construction & Extraction | 797 (98.3%) | 14 (1.7%) |
| Installation, Maintenance & Repair | 819 (100.0%) | 0 (0.0%) |
| Total (Category) | 1,695 (99.2%) | 14 (0.8%) |
| Total (Overall) | 7,712 (51.5%) | 7,266 (48.5%) |
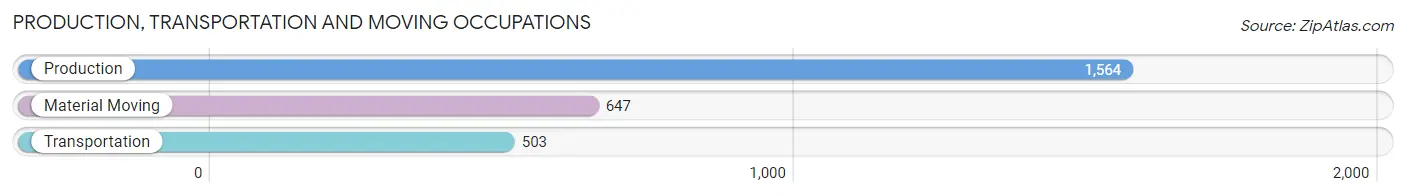
Production, Transportation and Moving Occupations
The most common Production, Transportation and Moving occupations in Amherst County are Production (1,564 | 10.4%), Material Moving (647 | 4.3%), and Transportation (503 | 3.4%).
Production, Transportation and Moving Occupations by Sex
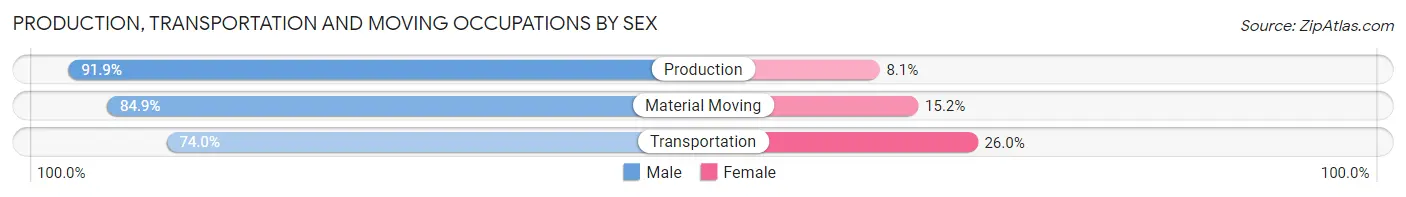
| Occupation | Male | Female |
| Production | 1,438 (91.9%) | 126 (8.1%) |
| Transportation | 372 (74.0%) | 131 (26.0%) |
| Material Moving | 549 (84.9%) | 98 (15.1%) |
| Total (Category) | 2,359 (86.9%) | 355 (13.1%) |
| Total (Overall) | 7,712 (51.5%) | 7,266 (48.5%) |
Employment Industries by Sex in Amherst County
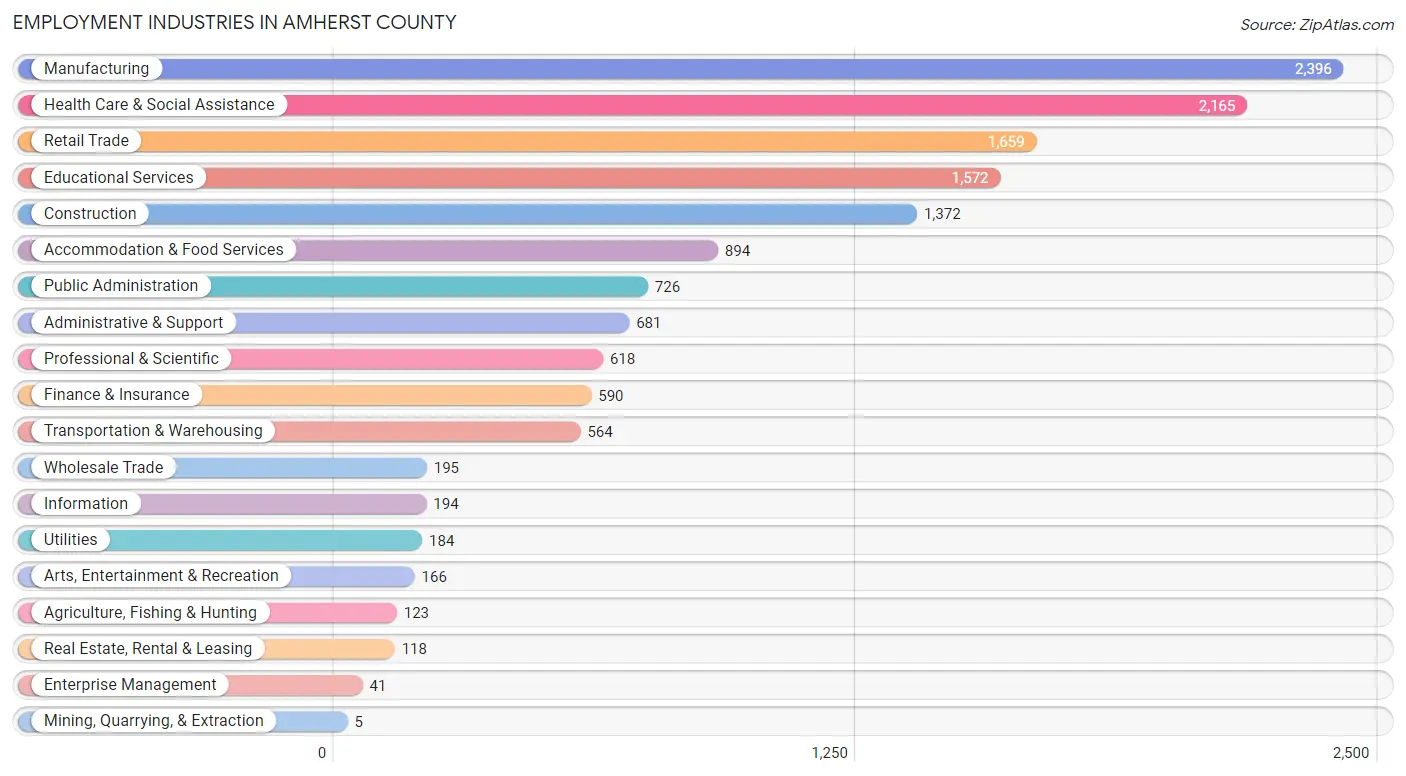
Employment Industries in Amherst County
The major employment industries in Amherst County include Manufacturing (2,396 | 16.0%), Health Care & Social Assistance (2,165 | 14.4%), Retail Trade (1,659 | 11.1%), Educational Services (1,572 | 10.5%), and Construction (1,372 | 9.2%).
Employment Industries by Sex in Amherst County
The Amherst County industries that see more men than women are Mining, Quarrying, & Extraction (100.0%), Construction (94.2%), and Utilities (87.0%), whereas the industries that tend to have a higher number of women are Enterprise Management (100.0%), Finance & Insurance (89.1%), and Health Care & Social Assistance (80.7%).
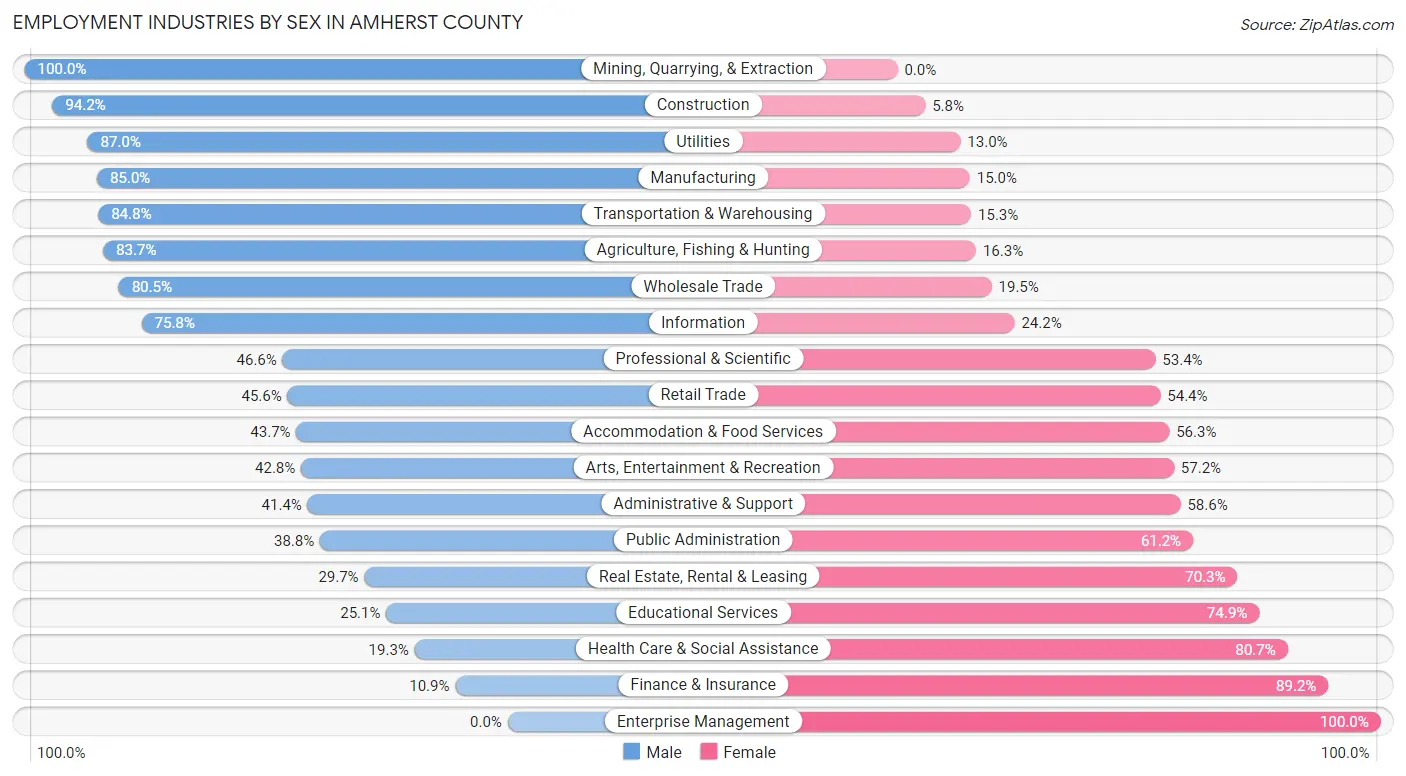
| Industry | Male | Female |
| Agriculture, Fishing & Hunting | 103 (83.7%) | 20 (16.3%) |
| Mining, Quarrying, & Extraction | 5 (100.0%) | 0 (0.0%) |
| Construction | 1,293 (94.2%) | 79 (5.8%) |
| Manufacturing | 2,037 (85.0%) | 359 (15.0%) |
| Wholesale Trade | 157 (80.5%) | 38 (19.5%) |
| Retail Trade | 756 (45.6%) | 903 (54.4%) |
| Transportation & Warehousing | 478 (84.8%) | 86 (15.2%) |
| Utilities | 160 (87.0%) | 24 (13.0%) |
| Information | 147 (75.8%) | 47 (24.2%) |
| Finance & Insurance | 64 (10.8%) | 526 (89.1%) |
| Real Estate, Rental & Leasing | 35 (29.7%) | 83 (70.3%) |
| Professional & Scientific | 288 (46.6%) | 330 (53.4%) |
| Enterprise Management | 0 (0.0%) | 41 (100.0%) |
| Administrative & Support | 282 (41.4%) | 399 (58.6%) |
| Educational Services | 395 (25.1%) | 1,177 (74.9%) |
| Health Care & Social Assistance | 417 (19.3%) | 1,748 (80.7%) |
| Arts, Entertainment & Recreation | 71 (42.8%) | 95 (57.2%) |
| Accommodation & Food Services | 391 (43.7%) | 503 (56.3%) |
| Public Administration | 282 (38.8%) | 444 (61.2%) |
| Total | 7,712 (51.5%) | 7,266 (48.5%) |
Education in Amherst County
School Enrollment in Amherst County
The most common levels of schooling among the 6,301 students in Amherst County are middle school (1,530 | 24.3%), college / undergraduate (1,371 | 21.8%), and high school (1,233 | 19.6%).
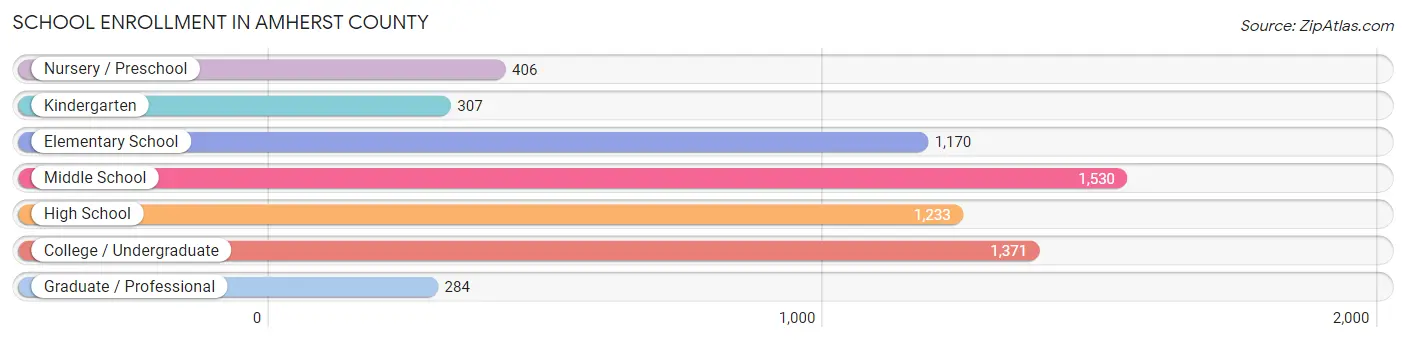
| School Level | # Students | % Students |
| Nursery / Preschool | 406 | 6.4% |
| Kindergarten | 307 | 4.9% |
| Elementary School | 1,170 | 18.6% |
| Middle School | 1,530 | 24.3% |
| High School | 1,233 | 19.6% |
| College / Undergraduate | 1,371 | 21.8% |
| Graduate / Professional | 284 | 4.5% |
| Total | 6,301 | 100.0% |
School Enrollment by Age by Funding Source in Amherst County
Out of a total of 6,301 students who are enrolled in schools in Amherst County, 1,670 (26.5%) attend a private institution, while the remaining 4,631 (73.5%) are enrolled in public schools. The age group of 3 to 4 year olds has the highest likelihood of being enrolled in private schools, with 156 (45.6% in the age bracket) enrolled. Conversely, the age group of 10 to 14 year olds has the lowest likelihood of being enrolled in a private school, with 1,499 (86.6% in the age bracket) attending a public institution.
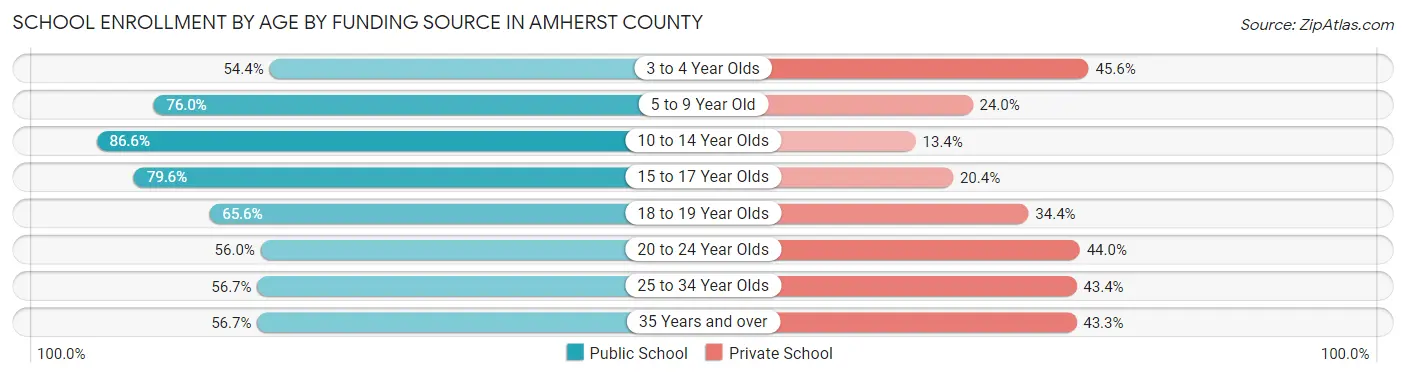
| Age Bracket | Public School | Private School |
| 3 to 4 Year Olds | 186 (54.4%) | 156 (45.6%) |
| 5 to 9 Year Old | 1,099 (76.0%) | 347 (24.0%) |
| 10 to 14 Year Olds | 1,499 (86.6%) | 232 (13.4%) |
| 15 to 17 Year Olds | 755 (79.6%) | 193 (20.4%) |
| 18 to 19 Year Olds | 427 (65.6%) | 224 (34.4%) |
| 20 to 24 Year Olds | 381 (56.0%) | 299 (44.0%) |
| 25 to 34 Year Olds | 149 (56.7%) | 114 (43.3%) |
| 35 Years and over | 136 (56.7%) | 104 (43.3%) |
| Total | 4,631 (73.5%) | 1,670 (26.5%) |
Educational Attainment by Field of Study in Amherst County
Business (1,001 | 19.1%), education (883 | 16.8%), science & technology (584 | 11.1%), arts & humanities (377 | 7.2%), and social sciences (354 | 6.7%) are the most common fields of study among 5,249 individuals in Amherst County who have obtained a bachelor's degree or higher.
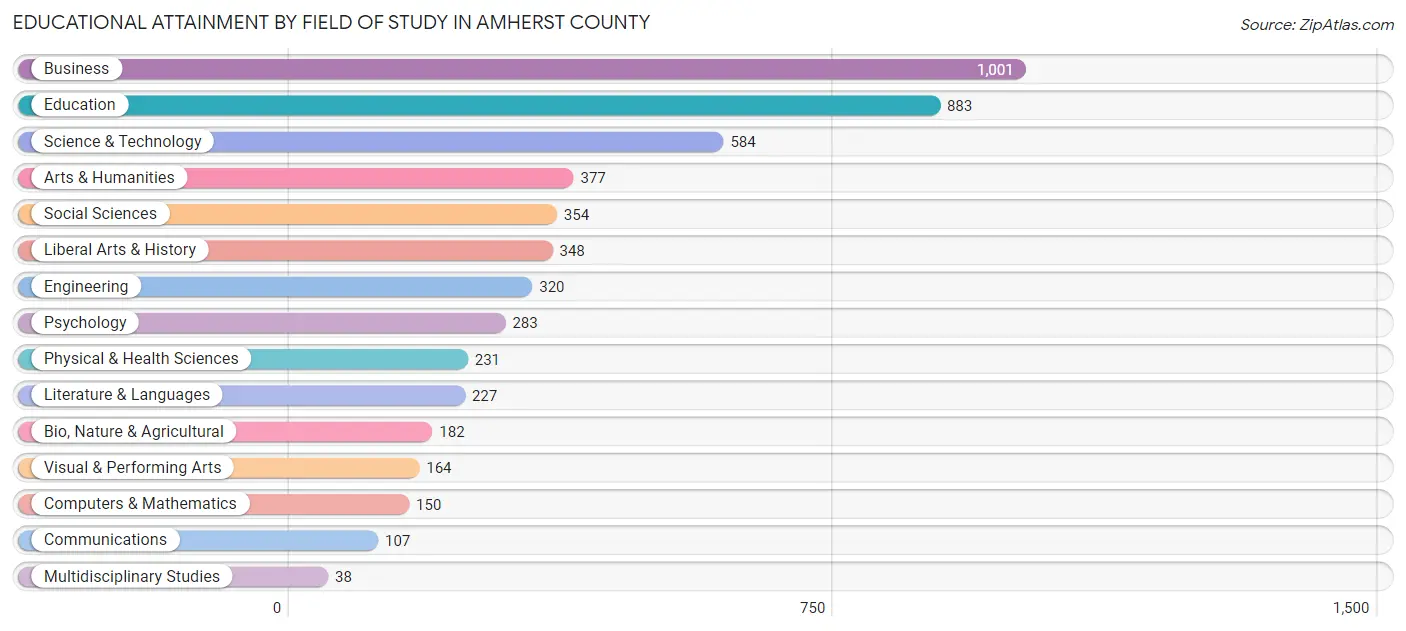
| Field of Study | # Graduates | % Graduates |
| Computers & Mathematics | 150 | 2.9% |
| Bio, Nature & Agricultural | 182 | 3.5% |
| Physical & Health Sciences | 231 | 4.4% |
| Psychology | 283 | 5.4% |
| Social Sciences | 354 | 6.7% |
| Engineering | 320 | 6.1% |
| Multidisciplinary Studies | 38 | 0.7% |
| Science & Technology | 584 | 11.1% |
| Business | 1,001 | 19.1% |
| Education | 883 | 16.8% |
| Literature & Languages | 227 | 4.3% |
| Liberal Arts & History | 348 | 6.6% |
| Visual & Performing Arts | 164 | 3.1% |
| Communications | 107 | 2.0% |
| Arts & Humanities | 377 | 7.2% |
| Total | 5,249 | 100.0% |
Transportation & Commute in Amherst County
Vehicle Availability by Sex in Amherst County
The most prevalent vehicle ownership categories in Amherst County are males with 2 vehicles (2,647, accounting for 35.4%) and females with 2 vehicles (2,211, making up 38.2%).
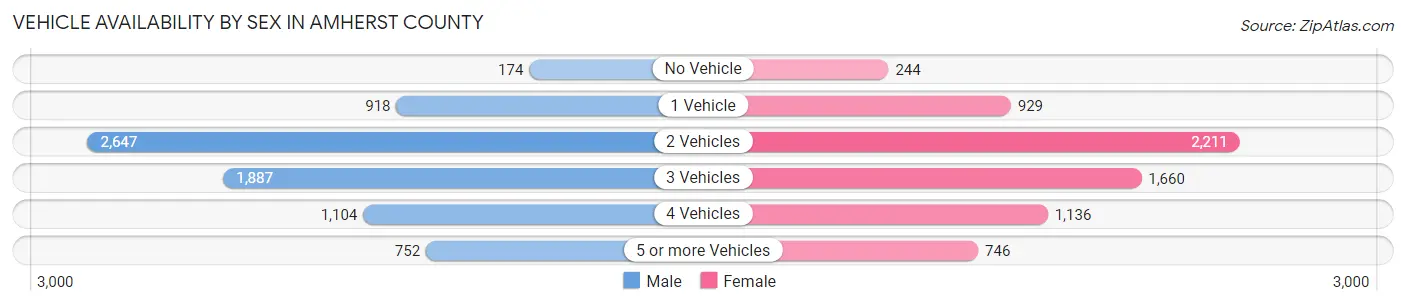
| Vehicles Available | Male | Female |
| No Vehicle | 174 (2.3%) | 244 (3.5%) |
| 1 Vehicle | 918 (12.3%) | 929 (13.4%) |
| 2 Vehicles | 2,647 (35.4%) | 2,211 (31.9%) |
| 3 Vehicles | 1,887 (25.2%) | 1,660 (24.0%) |
| 4 Vehicles | 1,104 (14.8%) | 1,136 (16.4%) |
| 5 or more Vehicles | 752 (10.1%) | 746 (10.8%) |
| Total | 7,482 (100.0%) | 6,926 (100.0%) |
Commute Time in Amherst County
The most frequently occuring commute durations in Amherst County are 20 to 24 minutes (2,726 commuters, 20.3%), 15 to 19 minutes (2,147 commuters, 16.0%), and 30 to 34 minutes (1,725 commuters, 12.8%).
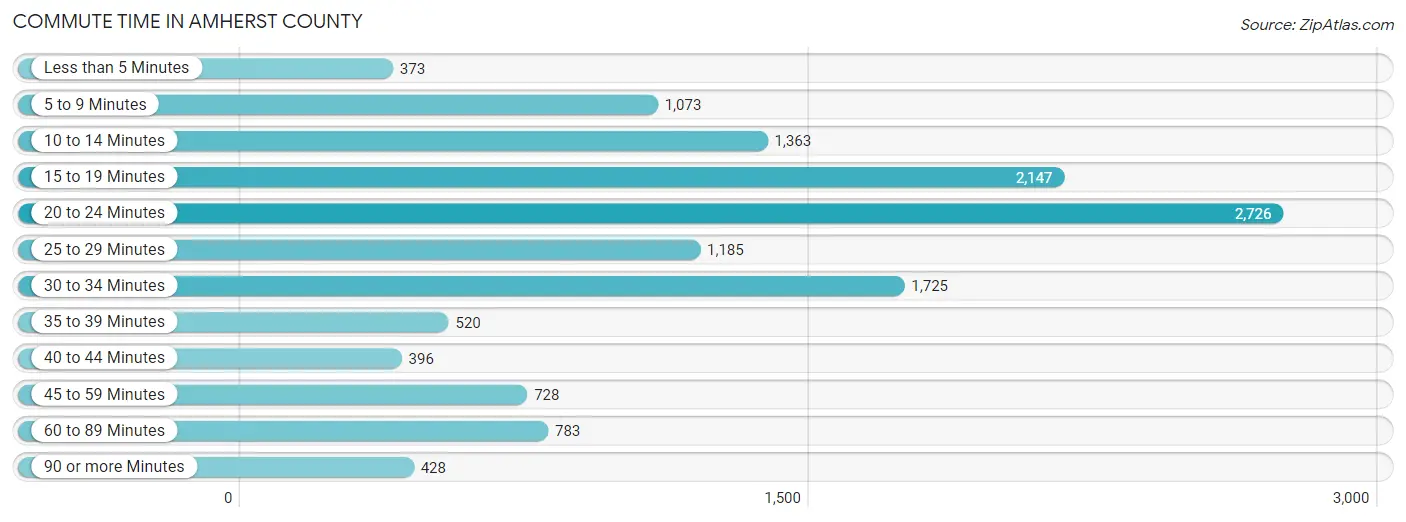
| Commute Time | # Commuters | % Commuters |
| Less than 5 Minutes | 373 | 2.8% |
| 5 to 9 Minutes | 1,073 | 8.0% |
| 10 to 14 Minutes | 1,363 | 10.1% |
| 15 to 19 Minutes | 2,147 | 16.0% |
| 20 to 24 Minutes | 2,726 | 20.3% |
| 25 to 29 Minutes | 1,185 | 8.8% |
| 30 to 34 Minutes | 1,725 | 12.8% |
| 35 to 39 Minutes | 520 | 3.9% |
| 40 to 44 Minutes | 396 | 2.9% |
| 45 to 59 Minutes | 728 | 5.4% |
| 60 to 89 Minutes | 783 | 5.8% |
| 90 or more Minutes | 428 | 3.2% |
Commute Time by Sex in Amherst County
The most common commute times in Amherst County are 20 to 24 minutes (1,533 commuters, 21.8%) for males and 20 to 24 minutes (1,193 commuters, 18.6%) for females.
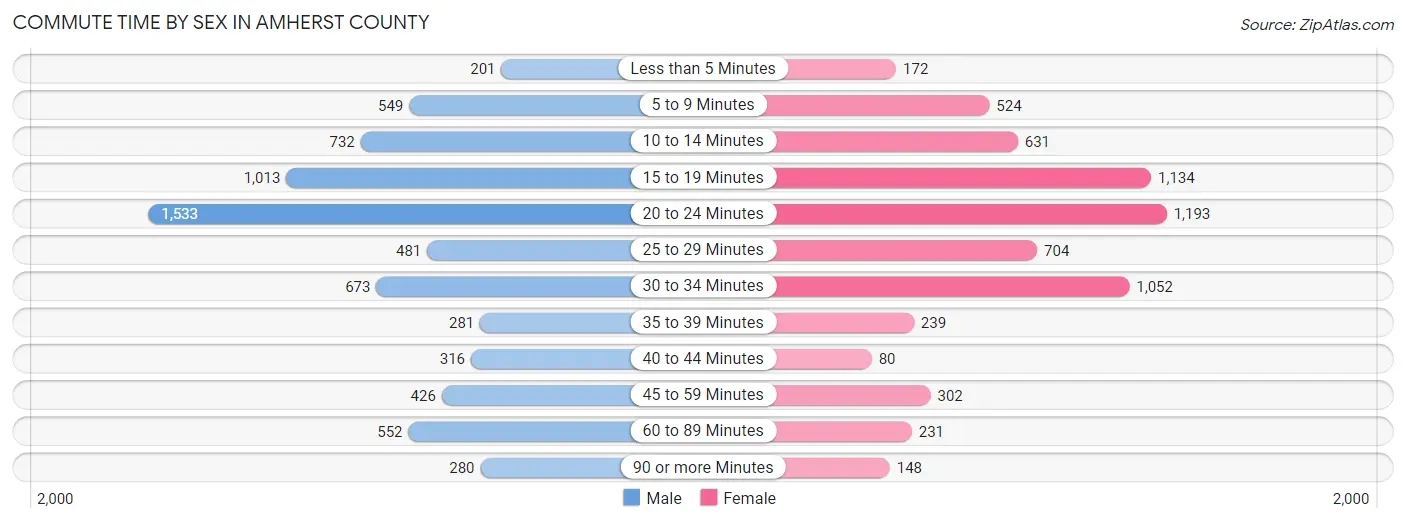
| Commute Time | Male | Female |
| Less than 5 Minutes | 201 (2.9%) | 172 (2.7%) |
| 5 to 9 Minutes | 549 (7.8%) | 524 (8.2%) |
| 10 to 14 Minutes | 732 (10.4%) | 631 (9.8%) |
| 15 to 19 Minutes | 1,013 (14.4%) | 1,134 (17.7%) |
| 20 to 24 Minutes | 1,533 (21.8%) | 1,193 (18.6%) |
| 25 to 29 Minutes | 481 (6.8%) | 704 (11.0%) |
| 30 to 34 Minutes | 673 (9.6%) | 1,052 (16.4%) |
| 35 to 39 Minutes | 281 (4.0%) | 239 (3.7%) |
| 40 to 44 Minutes | 316 (4.5%) | 80 (1.3%) |
| 45 to 59 Minutes | 426 (6.0%) | 302 (4.7%) |
| 60 to 89 Minutes | 552 (7.8%) | 231 (3.6%) |
| 90 or more Minutes | 280 (4.0%) | 148 (2.3%) |
Time of Departure to Work by Sex in Amherst County
The most frequent times of departure to work in Amherst County are 6:30 AM to 6:59 AM (904, 12.9%) for males and 7:30 AM to 7:59 AM (1,020, 15.9%) for females.
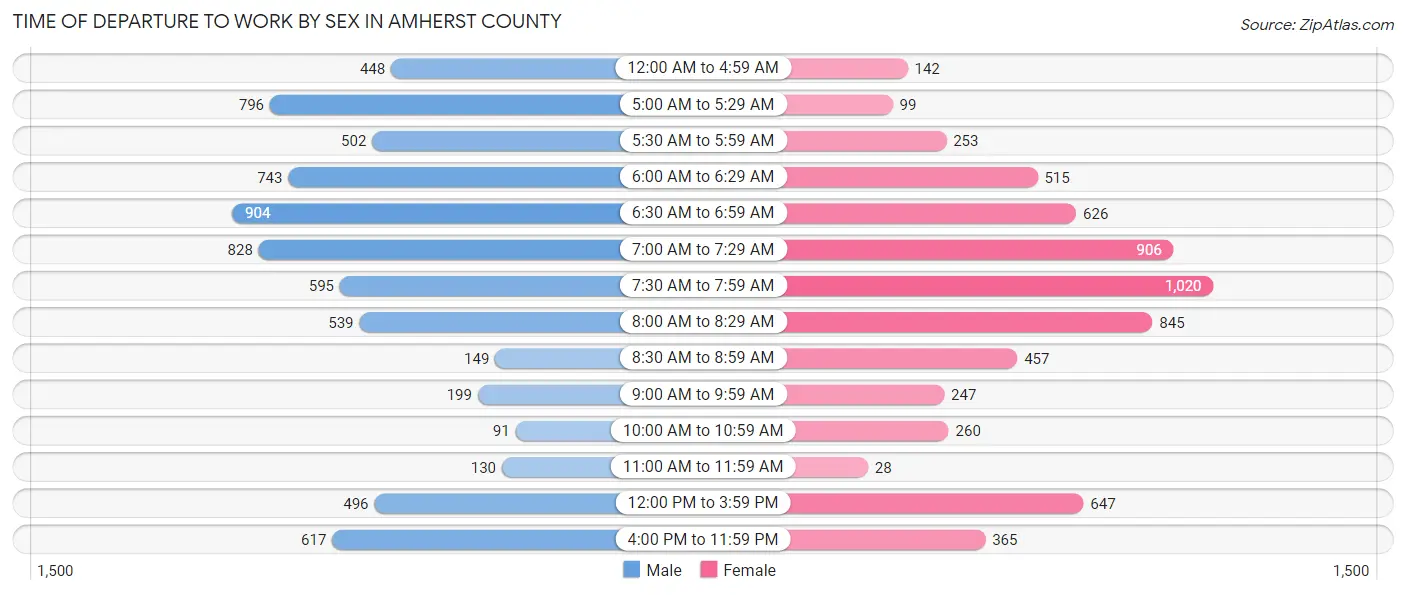
| Time of Departure | Male | Female |
| 12:00 AM to 4:59 AM | 448 (6.4%) | 142 (2.2%) |
| 5:00 AM to 5:29 AM | 796 (11.3%) | 99 (1.5%) |
| 5:30 AM to 5:59 AM | 502 (7.1%) | 253 (4.0%) |
| 6:00 AM to 6:29 AM | 743 (10.6%) | 515 (8.0%) |
| 6:30 AM to 6:59 AM | 904 (12.9%) | 626 (9.8%) |
| 7:00 AM to 7:29 AM | 828 (11.8%) | 906 (14.1%) |
| 7:30 AM to 7:59 AM | 595 (8.5%) | 1,020 (15.9%) |
| 8:00 AM to 8:29 AM | 539 (7.7%) | 845 (13.2%) |
| 8:30 AM to 8:59 AM | 149 (2.1%) | 457 (7.1%) |
| 9:00 AM to 9:59 AM | 199 (2.8%) | 247 (3.8%) |
| 10:00 AM to 10:59 AM | 91 (1.3%) | 260 (4.1%) |
| 11:00 AM to 11:59 AM | 130 (1.8%) | 28 (0.4%) |
| 12:00 PM to 3:59 PM | 496 (7.0%) | 647 (10.1%) |
| 4:00 PM to 11:59 PM | 617 (8.8%) | 365 (5.7%) |
| Total | 7,037 (100.0%) | 6,410 (100.0%) |
Housing Occupancy in Amherst County
Occupancy by Ownership in Amherst County
Of the total 12,615 dwellings in Amherst County, owner-occupied units account for 9,550 (75.7%), while renter-occupied units make up 3,065 (24.3%).
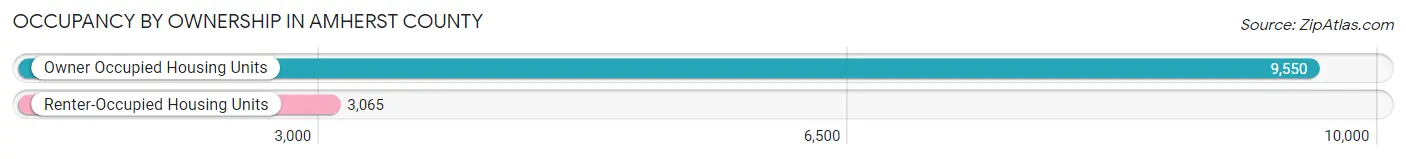
| Occupancy | # Housing Units | % Housing Units |
| Owner Occupied Housing Units | 9,550 | 75.7% |
| Renter-Occupied Housing Units | 3,065 | 24.3% |
| Total Occupied Housing Units | 12,615 | 100.0% |
Occupancy by Household Size in Amherst County
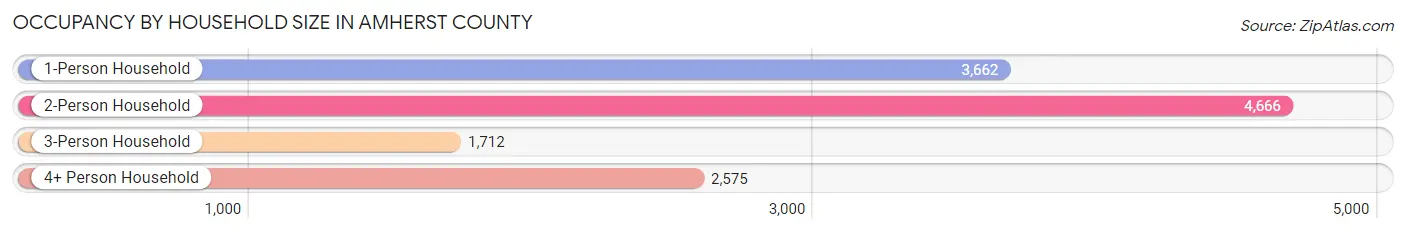
| Household Size | # Housing Units | % Housing Units |
| 1-Person Household | 3,662 | 29.0% |
| 2-Person Household | 4,666 | 37.0% |
| 3-Person Household | 1,712 | 13.6% |
| 4+ Person Household | 2,575 | 20.4% |
| Total Housing Units | 12,615 | 100.0% |
Occupancy by Ownership by Household Size in Amherst County
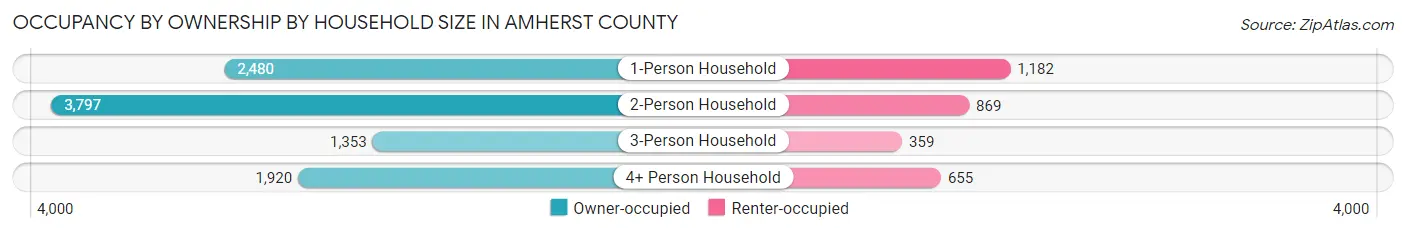
| Household Size | Owner-occupied | Renter-occupied |
| 1-Person Household | 2,480 (67.7%) | 1,182 (32.3%) |
| 2-Person Household | 3,797 (81.4%) | 869 (18.6%) |
| 3-Person Household | 1,353 (79.0%) | 359 (21.0%) |
| 4+ Person Household | 1,920 (74.6%) | 655 (25.4%) |
| Total Housing Units | 9,550 (75.7%) | 3,065 (24.3%) |
Occupancy by Educational Attainment in Amherst County
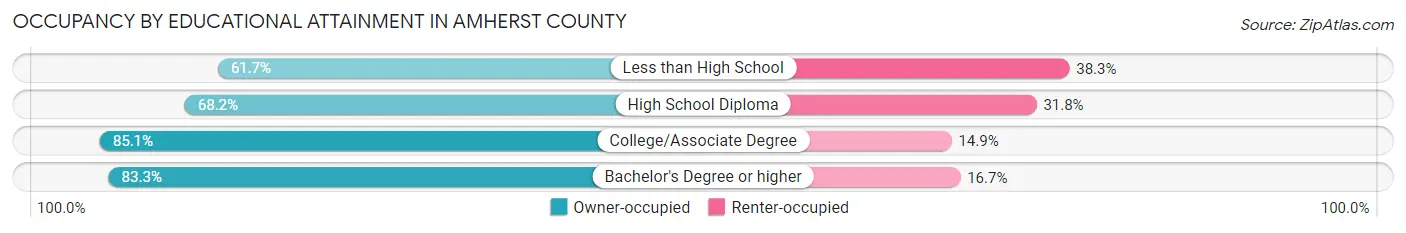
| Household Size | Owner-occupied | Renter-occupied |
| Less than High School | 843 (61.7%) | 523 (38.3%) |
| High School Diploma | 3,288 (68.2%) | 1,532 (31.8%) |
| College/Associate Degree | 3,019 (85.1%) | 530 (14.9%) |
| Bachelor's Degree or higher | 2,400 (83.3%) | 480 (16.7%) |
Occupancy by Age of Householder in Amherst County
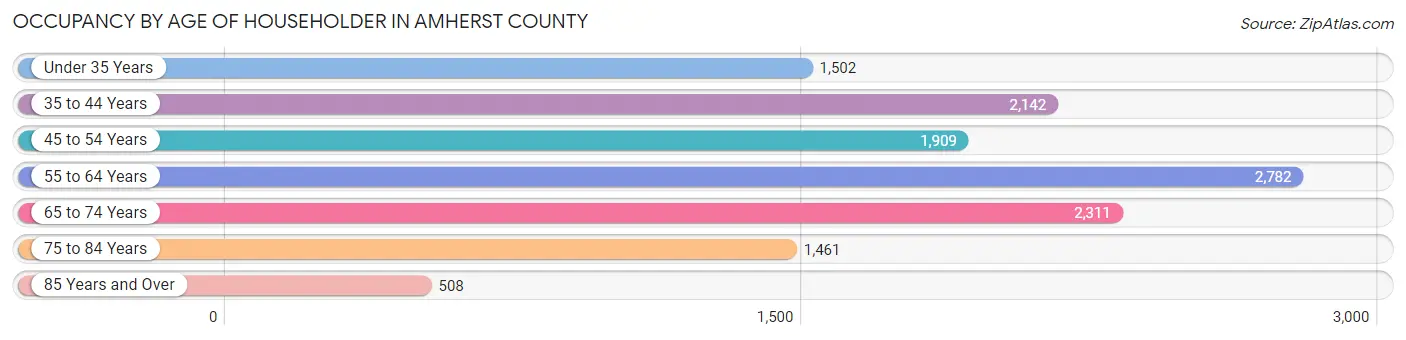
| Age Bracket | # Households | % Households |
| Under 35 Years | 1,502 | 11.9% |
| 35 to 44 Years | 2,142 | 17.0% |
| 45 to 54 Years | 1,909 | 15.1% |
| 55 to 64 Years | 2,782 | 22.1% |
| 65 to 74 Years | 2,311 | 18.3% |
| 75 to 84 Years | 1,461 | 11.6% |
| 85 Years and Over | 508 | 4.0% |
| Total | 12,615 | 100.0% |
Housing Finances in Amherst County
Median Income by Occupancy in Amherst County
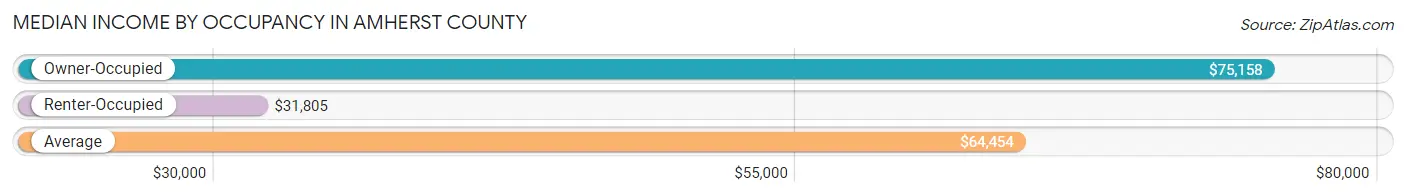
| Occupancy Type | # Households | Median Income |
| Owner-Occupied | 9,550 (75.7%) | $75,158 |
| Renter-Occupied | 3,065 (24.3%) | $31,805 |
| Average | 12,615 (100.0%) | $64,454 |
Occupancy by Householder Income Bracket in Amherst County
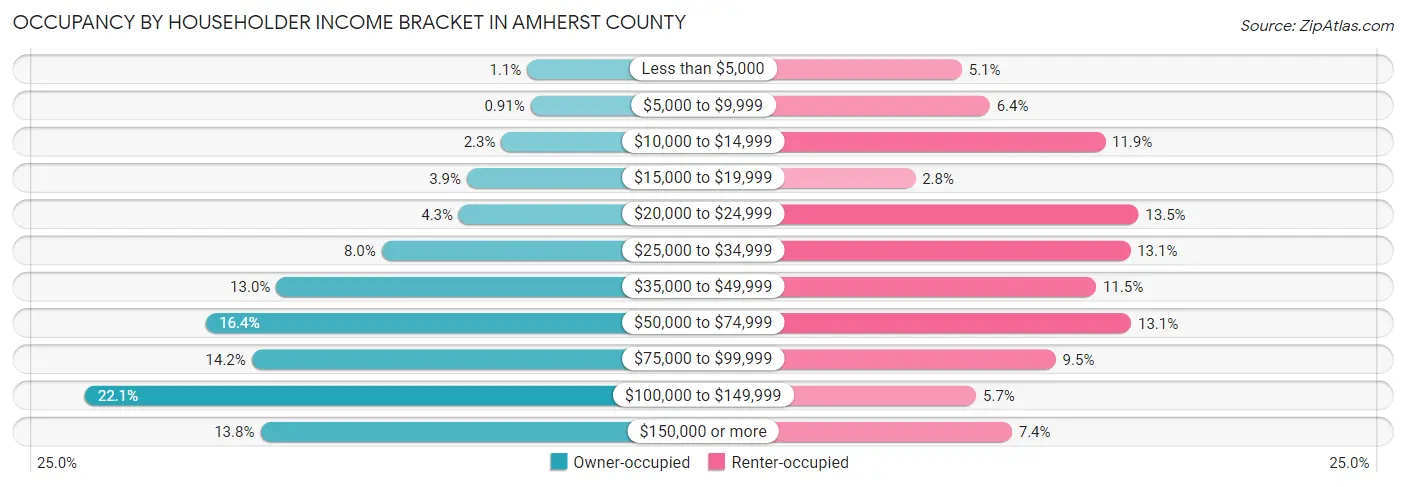
| Income Bracket | Owner-occupied | Renter-occupied |
| Less than $5,000 | 102 (1.1%) | 155 (5.1%) |
| $5,000 to $9,999 | 87 (0.9%) | 196 (6.4%) |
| $10,000 to $14,999 | 220 (2.3%) | 364 (11.9%) |
| $15,000 to $19,999 | 376 (3.9%) | 87 (2.8%) |
| $20,000 to $24,999 | 413 (4.3%) | 413 (13.5%) |
| $25,000 to $34,999 | 764 (8.0%) | 401 (13.1%) |
| $35,000 to $49,999 | 1,243 (13.0%) | 351 (11.5%) |
| $50,000 to $74,999 | 1,561 (16.4%) | 402 (13.1%) |
| $75,000 to $99,999 | 1,355 (14.2%) | 292 (9.5%) |
| $100,000 to $149,999 | 2,113 (22.1%) | 176 (5.7%) |
| $150,000 or more | 1,316 (13.8%) | 228 (7.4%) |
| Total | 9,550 (100.0%) | 3,065 (100.0%) |
Monthly Housing Cost Tiers in Amherst County
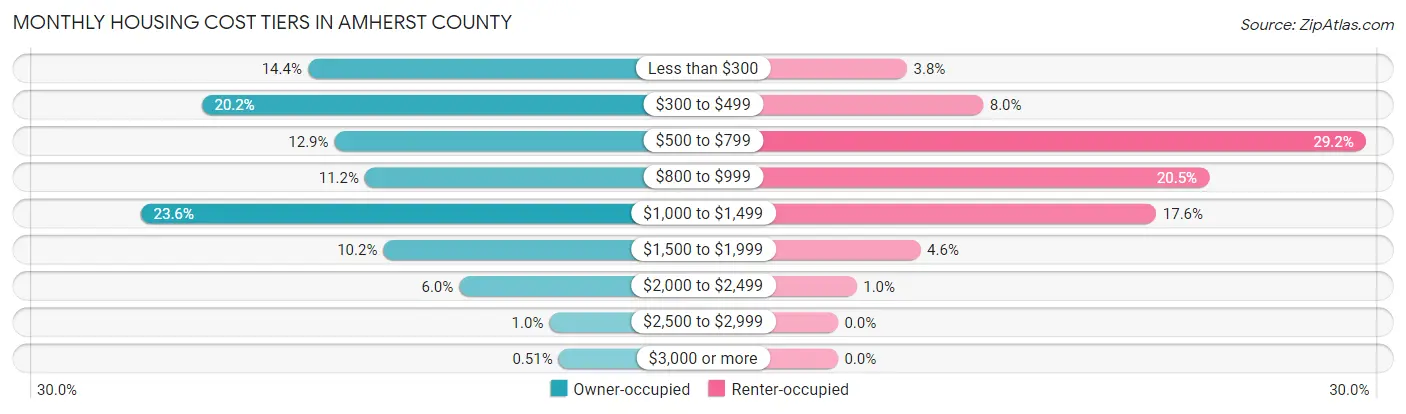
| Monthly Cost | Owner-occupied | Renter-occupied |
| Less than $300 | 1,371 (14.4%) | 117 (3.8%) |
| $300 to $499 | 1,932 (20.2%) | 246 (8.0%) |
| $500 to $799 | 1,231 (12.9%) | 894 (29.2%) |
| $800 to $999 | 1,071 (11.2%) | 629 (20.5%) |
| $1,000 to $1,499 | 2,253 (23.6%) | 539 (17.6%) |
| $1,500 to $1,999 | 973 (10.2%) | 140 (4.6%) |
| $2,000 to $2,499 | 573 (6.0%) | 32 (1.0%) |
| $2,500 to $2,999 | 97 (1.0%) | 0 (0.0%) |
| $3,000 or more | 49 (0.5%) | 0 (0.0%) |
| Total | 9,550 (100.0%) | 3,065 (100.0%) |
Physical Housing Characteristics in Amherst County
Housing Structures in Amherst County
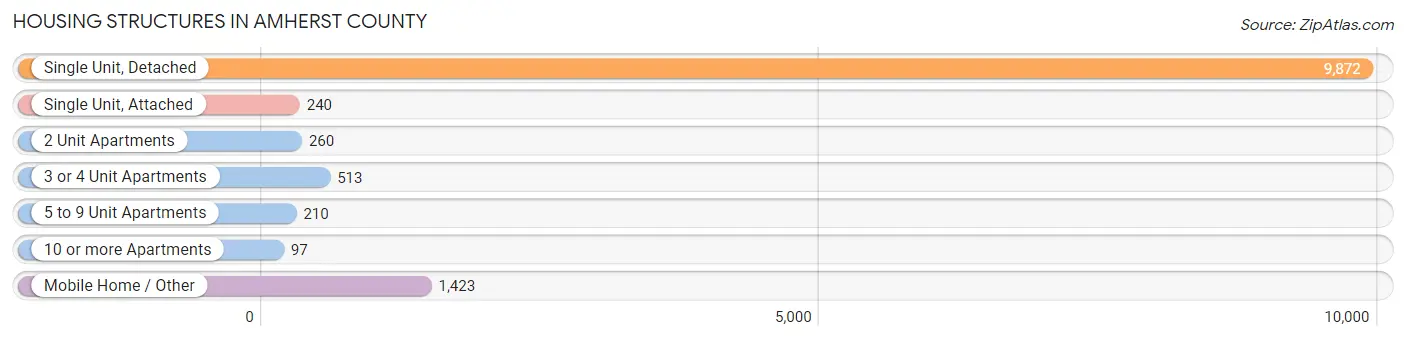
| Structure Type | # Housing Units | % Housing Units |
| Single Unit, Detached | 9,872 | 78.3% |
| Single Unit, Attached | 240 | 1.9% |
| 2 Unit Apartments | 260 | 2.1% |
| 3 or 4 Unit Apartments | 513 | 4.1% |
| 5 to 9 Unit Apartments | 210 | 1.7% |
| 10 or more Apartments | 97 | 0.8% |
| Mobile Home / Other | 1,423 | 11.3% |
| Total | 12,615 | 100.0% |
Housing Structures by Occupancy in Amherst County
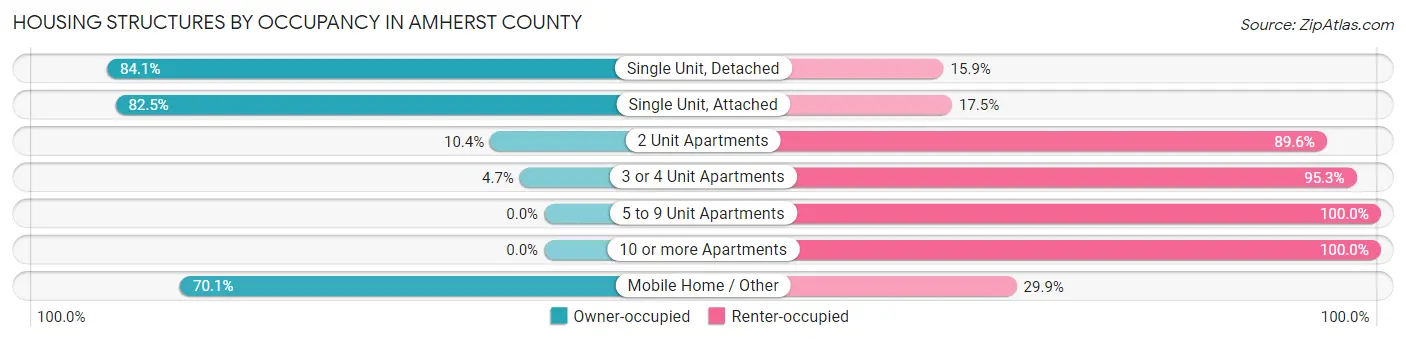
| Structure Type | Owner-occupied | Renter-occupied |
| Single Unit, Detached | 8,304 (84.1%) | 1,568 (15.9%) |
| Single Unit, Attached | 198 (82.5%) | 42 (17.5%) |
| 2 Unit Apartments | 27 (10.4%) | 233 (89.6%) |
| 3 or 4 Unit Apartments | 24 (4.7%) | 489 (95.3%) |
| 5 to 9 Unit Apartments | 0 (0.0%) | 210 (100.0%) |
| 10 or more Apartments | 0 (0.0%) | 97 (100.0%) |
| Mobile Home / Other | 997 (70.1%) | 426 (29.9%) |
| Total | 9,550 (75.7%) | 3,065 (24.3%) |
Housing Structures by Number of Rooms in Amherst County
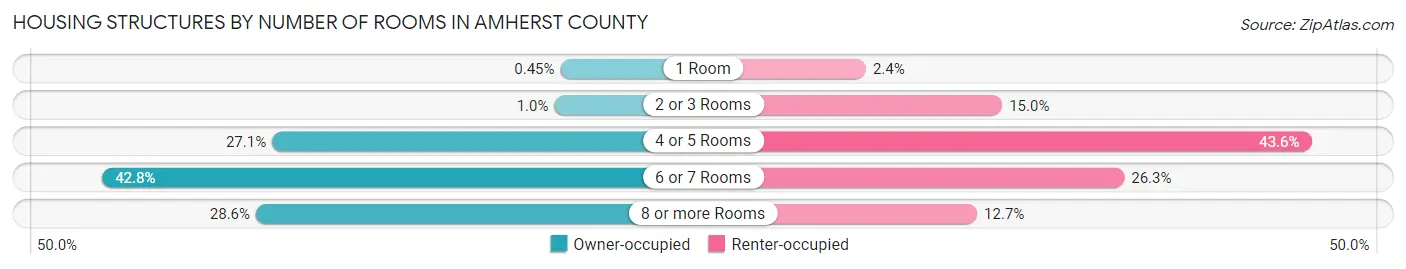
| Number of Rooms | Owner-occupied | Renter-occupied |
| 1 Room | 43 (0.4%) | 74 (2.4%) |
| 2 or 3 Rooms | 96 (1.0%) | 460 (15.0%) |
| 4 or 5 Rooms | 2,590 (27.1%) | 1,336 (43.6%) |
| 6 or 7 Rooms | 4,089 (42.8%) | 806 (26.3%) |
| 8 or more Rooms | 2,732 (28.6%) | 389 (12.7%) |
| Total | 9,550 (100.0%) | 3,065 (100.0%) |
Housing Structure by Heating Type in Amherst County
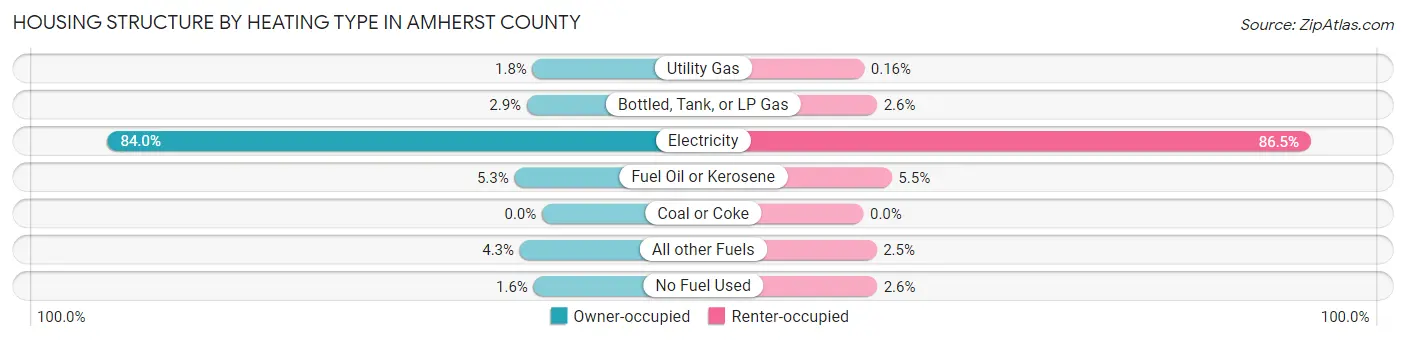
| Heating Type | Owner-occupied | Renter-occupied |
| Utility Gas | 174 (1.8%) | 5 (0.2%) |
| Bottled, Tank, or LP Gas | 281 (2.9%) | 81 (2.6%) |
| Electricity | 8,019 (84.0%) | 2,652 (86.5%) |
| Fuel Oil or Kerosene | 509 (5.3%) | 168 (5.5%) |
| Coal or Coke | 0 (0.0%) | 0 (0.0%) |
| All other Fuels | 411 (4.3%) | 78 (2.5%) |
| No Fuel Used | 156 (1.6%) | 81 (2.6%) |
| Total | 9,550 (100.0%) | 3,065 (100.0%) |
Household Vehicle Usage in Amherst County
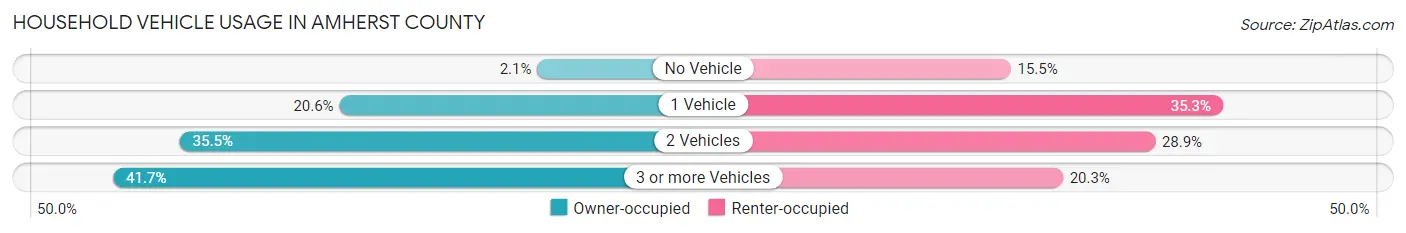
| Vehicles per Household | Owner-occupied | Renter-occupied |
| No Vehicle | 204 (2.1%) | 474 (15.5%) |
| 1 Vehicle | 1,968 (20.6%) | 1,081 (35.3%) |
| 2 Vehicles | 3,392 (35.5%) | 887 (28.9%) |
| 3 or more Vehicles | 3,986 (41.7%) | 623 (20.3%) |
| Total | 9,550 (100.0%) | 3,065 (100.0%) |
Real Estate & Mortgages in Amherst County
Real Estate and Mortgage Overview in Amherst County
| Characteristic | Without Mortgage | With Mortgage |
| Housing Units | 4,011 | 5,539 |
| Median Property Value | $165,400 | $189,600 |
| Median Household Income | $48,913 | $1,079 |
| Monthly Housing Costs | $367 | $49 |
| Real Estate Taxes | $856 | $125 |
Property Value by Mortgage Status in Amherst County
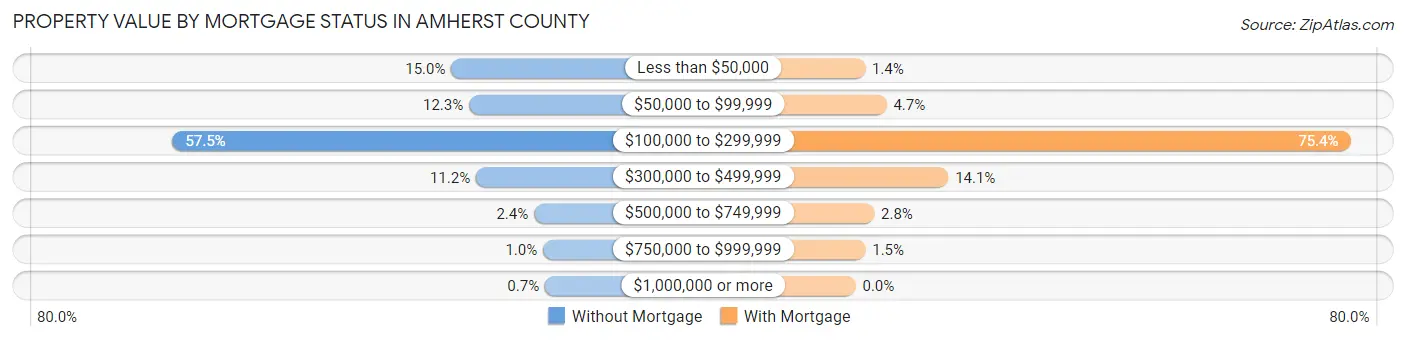
| Property Value | Without Mortgage | With Mortgage |
| Less than $50,000 | 601 (15.0%) | 80 (1.4%) |
| $50,000 to $99,999 | 492 (12.3%) | 261 (4.7%) |
| $100,000 to $299,999 | 2,305 (57.5%) | 4,177 (75.4%) |
| $300,000 to $499,999 | 450 (11.2%) | 782 (14.1%) |
| $500,000 to $749,999 | 95 (2.4%) | 157 (2.8%) |
| $750,000 to $999,999 | 40 (1.0%) | 82 (1.5%) |
| $1,000,000 or more | 28 (0.7%) | 0 (0.0%) |
| Total | 4,011 (100.0%) | 5,539 (100.0%) |
Household Income by Mortgage Status in Amherst County
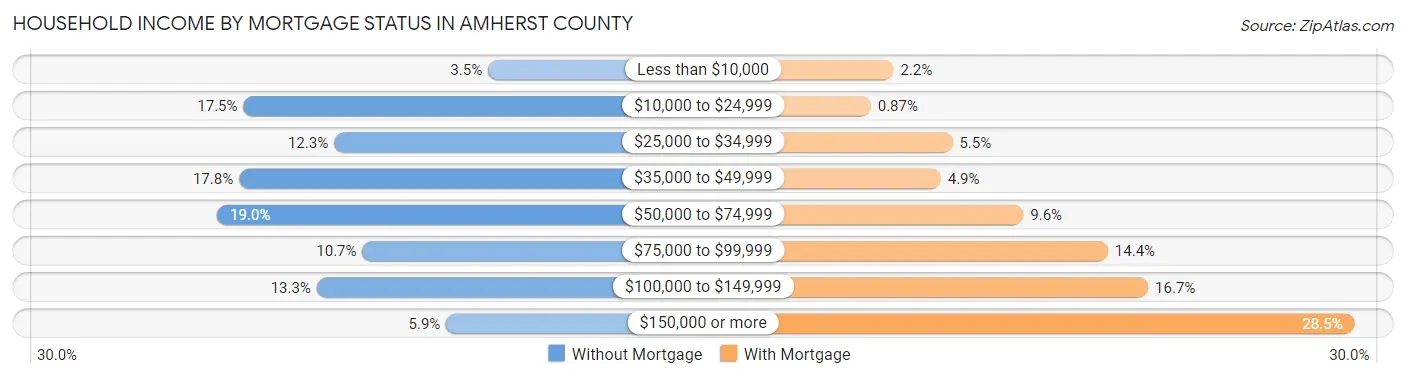
| Household Income | Without Mortgage | With Mortgage |
| Less than $10,000 | 141 (3.5%) | 120 (2.2%) |
| $10,000 to $24,999 | 702 (17.5%) | 48 (0.9%) |
| $25,000 to $34,999 | 494 (12.3%) | 307 (5.5%) |
| $35,000 to $49,999 | 712 (17.7%) | 270 (4.9%) |
| $50,000 to $74,999 | 762 (19.0%) | 531 (9.6%) |
| $75,000 to $99,999 | 429 (10.7%) | 799 (14.4%) |
| $100,000 to $149,999 | 534 (13.3%) | 926 (16.7%) |
| $150,000 or more | 237 (5.9%) | 1,579 (28.5%) |
| Total | 4,011 (100.0%) | 5,539 (100.0%) |
Property Value to Household Income Ratio in Amherst County
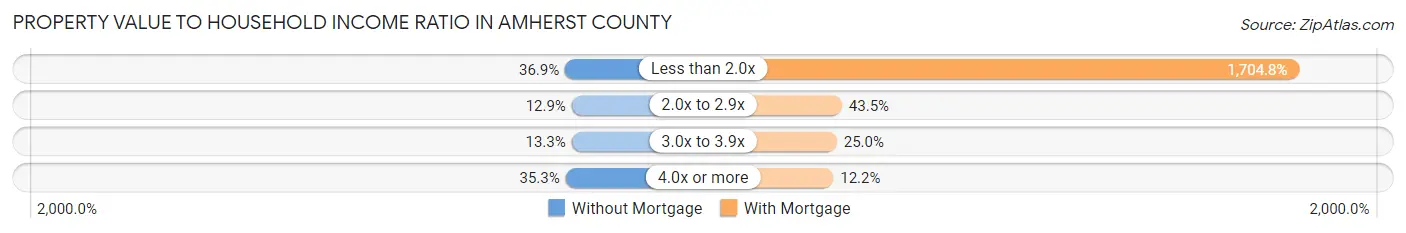
| Value-to-Income Ratio | Without Mortgage | With Mortgage |
| Less than 2.0x | 1,481 (36.9%) | 94,430 (1,704.8%) |
| 2.0x to 2.9x | 517 (12.9%) | 2,411 (43.5%) |
| 3.0x to 3.9x | 535 (13.3%) | 1,387 (25.0%) |
| 4.0x or more | 1,416 (35.3%) | 673 (12.1%) |
| Total | 4,011 (100.0%) | 5,539 (100.0%) |
Real Estate Taxes by Mortgage Status in Amherst County
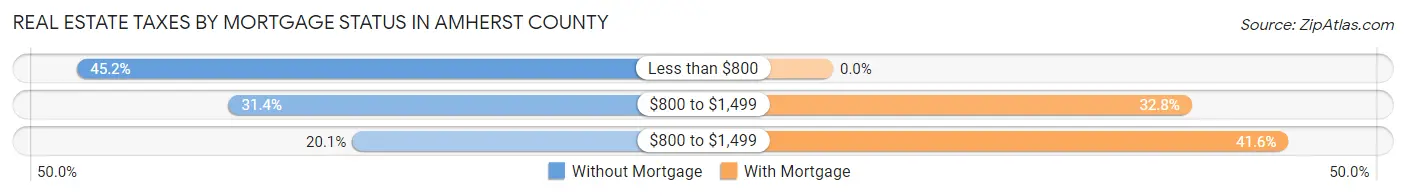
| Property Taxes | Without Mortgage | With Mortgage |
| Less than $800 | 1,812 (45.2%) | 0 (0.0%) |
| $800 to $1,499 | 1,258 (31.4%) | 1,814 (32.8%) |
| $800 to $1,499 | 806 (20.1%) | 2,303 (41.6%) |
| Total | 4,011 (100.0%) | 5,539 (100.0%) |
Health & Disability in Amherst County
Health Insurance Coverage by Age in Amherst County
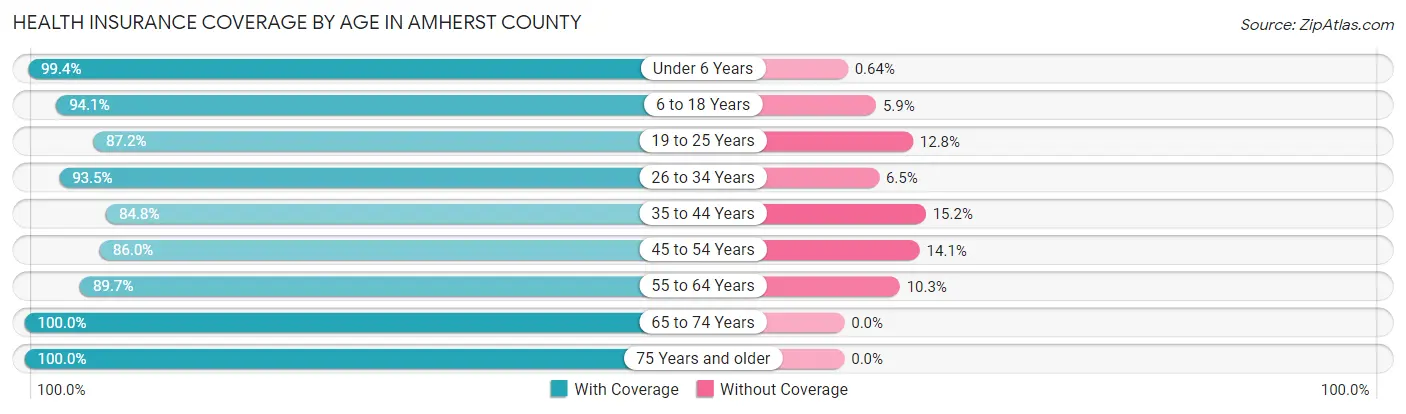
| Age Bracket | With Coverage | Without Coverage |
| Under 6 Years | 2,011 (99.4%) | 13 (0.6%) |
| 6 to 18 Years | 4,363 (94.1%) | 274 (5.9%) |
| 19 to 25 Years | 2,428 (87.2%) | 356 (12.8%) |
| 26 to 34 Years | 2,810 (93.5%) | 194 (6.5%) |
| 35 to 44 Years | 3,042 (84.8%) | 545 (15.2%) |
| 45 to 54 Years | 3,298 (86.0%) | 539 (14.1%) |
| 55 to 64 Years | 4,279 (89.7%) | 493 (10.3%) |
| 65 to 74 Years | 3,773 (100.0%) | 0 (0.0%) |
| 75 Years and older | 2,754 (100.0%) | 0 (0.0%) |
| Total | 28,758 (92.3%) | 2,414 (7.7%) |
Health Insurance Coverage by Citizenship Status in Amherst County
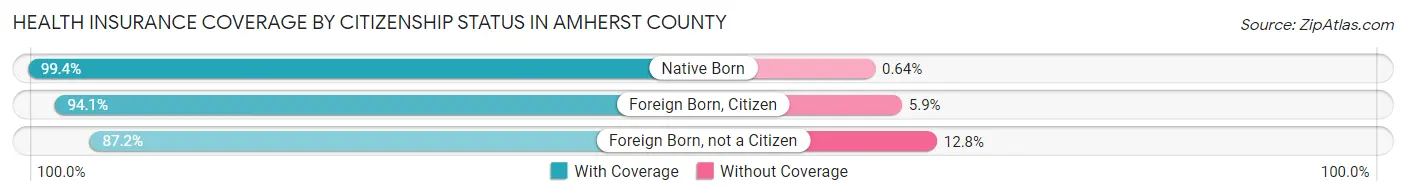
| Citizenship Status | With Coverage | Without Coverage |
| Native Born | 2,011 (99.4%) | 13 (0.6%) |
| Foreign Born, Citizen | 4,363 (94.1%) | 274 (5.9%) |
| Foreign Born, not a Citizen | 2,428 (87.2%) | 356 (12.8%) |
Health Insurance Coverage by Household Income in Amherst County
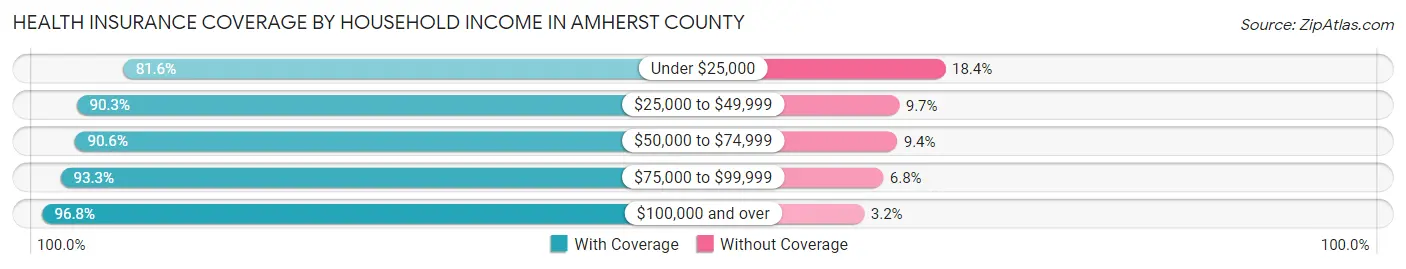
| Household Income | With Coverage | Without Coverage |
| Under $25,000 | 3,083 (81.6%) | 695 (18.4%) |
| $25,000 to $49,999 | 4,942 (90.3%) | 533 (9.7%) |
| $50,000 to $74,999 | 4,121 (90.6%) | 426 (9.4%) |
| $75,000 to $99,999 | 3,980 (93.2%) | 288 (6.8%) |
| $100,000 and over | 11,911 (96.8%) | 392 (3.2%) |
Public vs Private Health Insurance Coverage by Age in Amherst County
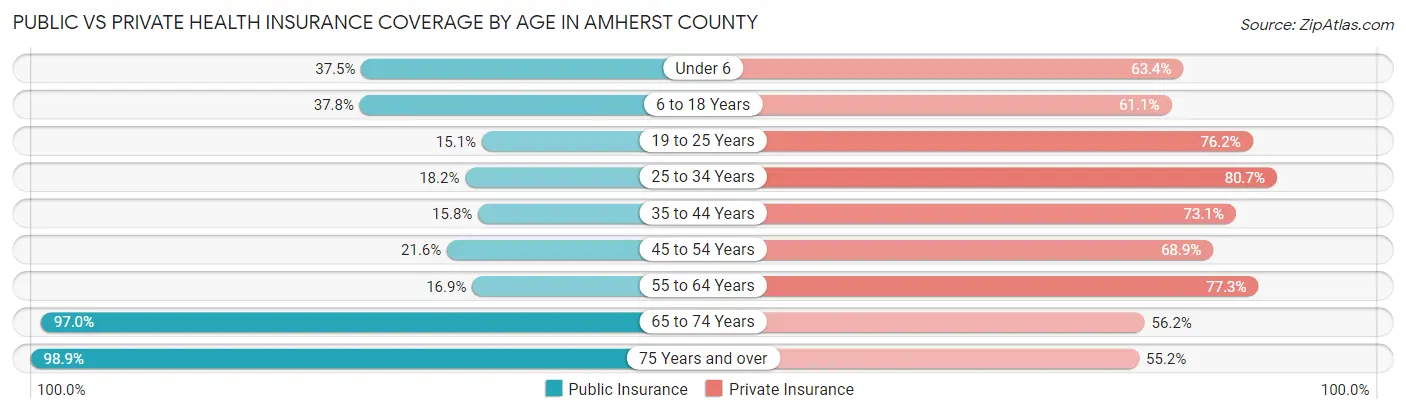
| Age Bracket | Public Insurance | Private Insurance |
| Under 6 | 759 (37.5%) | 1,283 (63.4%) |
| 6 to 18 Years | 1,752 (37.8%) | 2,835 (61.1%) |
| 19 to 25 Years | 421 (15.1%) | 2,122 (76.2%) |
| 25 to 34 Years | 547 (18.2%) | 2,425 (80.7%) |
| 35 to 44 Years | 567 (15.8%) | 2,622 (73.1%) |
| 45 to 54 Years | 828 (21.6%) | 2,645 (68.9%) |
| 55 to 64 Years | 807 (16.9%) | 3,689 (77.3%) |
| 65 to 74 Years | 3,659 (97.0%) | 2,121 (56.2%) |
| 75 Years and over | 2,723 (98.9%) | 1,520 (55.2%) |
| Total | 12,063 (38.7%) | 21,262 (68.2%) |
Disability Status by Sex by Age in Amherst County
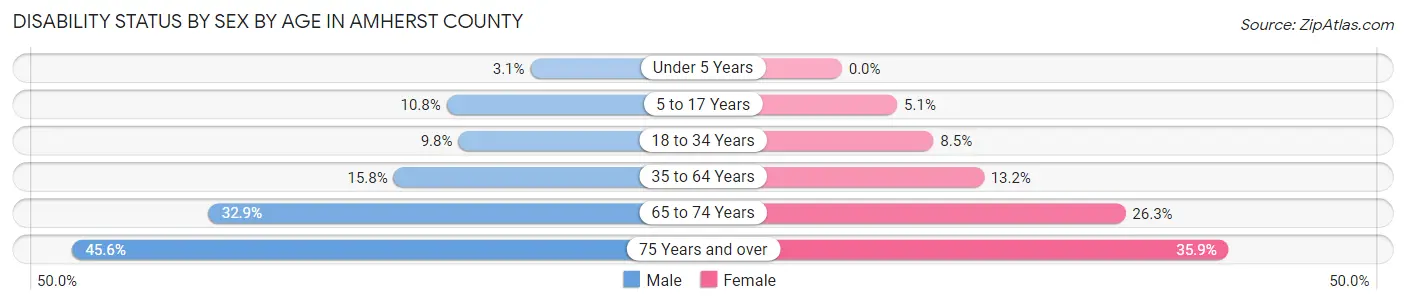
| Age Bracket | Male | Female |
| Under 5 Years | 25 (3.1%) | 0 (0.0%) |
| 5 to 17 Years | 251 (10.8%) | 116 (5.1%) |
| 18 to 34 Years | 288 (9.8%) | 278 (8.5%) |
| 35 to 64 Years | 925 (15.8%) | 833 (13.2%) |
| 65 to 74 Years | 585 (32.9%) | 525 (26.3%) |
| 75 Years and over | 507 (45.6%) | 589 (35.9%) |
Disability Class by Sex by Age in Amherst County
Disability Class: Hearing Difficulty

| Age Bracket | Male | Female |
| Under 5 Years | 25 (3.1%) | 0 (0.0%) |
| 5 to 17 Years | 0 (0.0%) | 0 (0.0%) |
| 18 to 34 Years | 0 (0.0%) | 0 (0.0%) |
| 35 to 64 Years | 263 (4.5%) | 140 (2.2%) |
| 65 to 74 Years | 243 (13.7%) | 138 (6.9%) |
| 75 Years and over | 332 (29.8%) | 215 (13.1%) |
Disability Class: Vision Difficulty
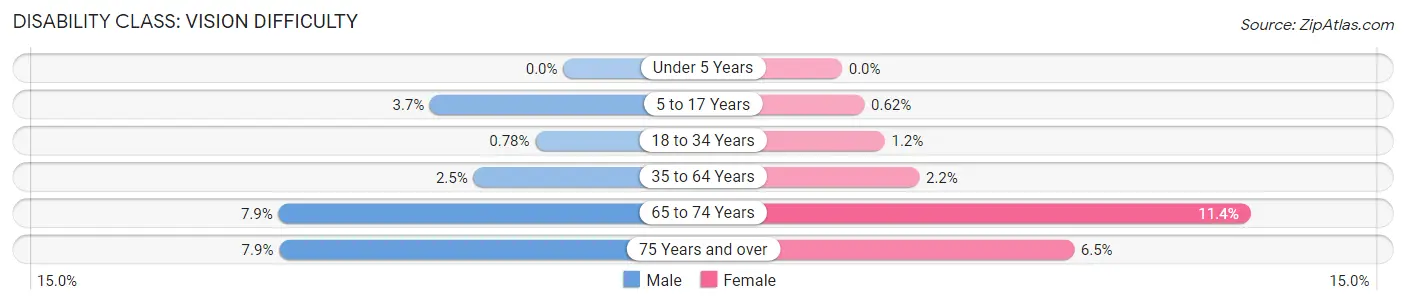
| Age Bracket | Male | Female |
| Under 5 Years | 0 (0.0%) | 0 (0.0%) |
| 5 to 17 Years | 86 (3.7%) | 14 (0.6%) |
| 18 to 34 Years | 23 (0.8%) | 39 (1.2%) |
| 35 to 64 Years | 147 (2.5%) | 136 (2.1%) |
| 65 to 74 Years | 141 (7.9%) | 227 (11.4%) |
| 75 Years and over | 88 (7.9%) | 106 (6.5%) |
Disability Class: Cognitive Difficulty
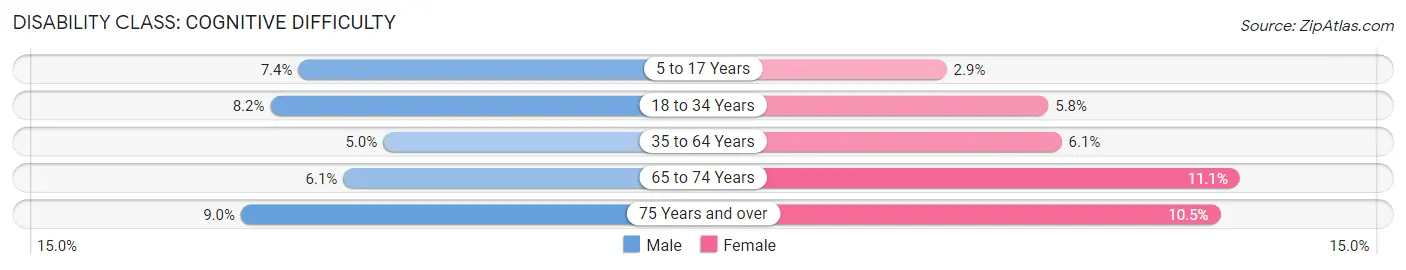
| Age Bracket | Male | Female |
| 5 to 17 Years | 171 (7.4%) | 66 (2.9%) |
| 18 to 34 Years | 241 (8.2%) | 188 (5.8%) |
| 35 to 64 Years | 295 (5.0%) | 387 (6.1%) |
| 65 to 74 Years | 109 (6.1%) | 221 (11.1%) |
| 75 Years and over | 100 (9.0%) | 173 (10.5%) |
Disability Class: Ambulatory Difficulty
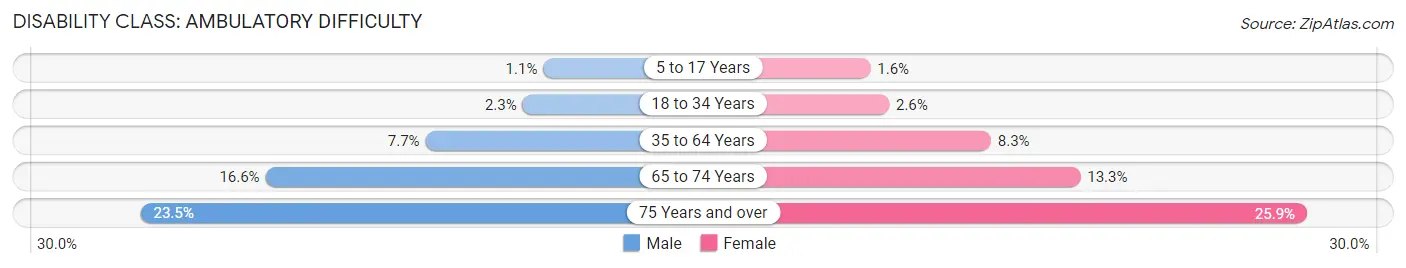
| Age Bracket | Male | Female |
| 5 to 17 Years | 26 (1.1%) | 36 (1.6%) |
| 18 to 34 Years | 67 (2.3%) | 86 (2.6%) |
| 35 to 64 Years | 451 (7.7%) | 525 (8.3%) |
| 65 to 74 Years | 295 (16.6%) | 265 (13.3%) |
| 75 Years and over | 262 (23.5%) | 425 (25.9%) |
Disability Class: Self-Care Difficulty
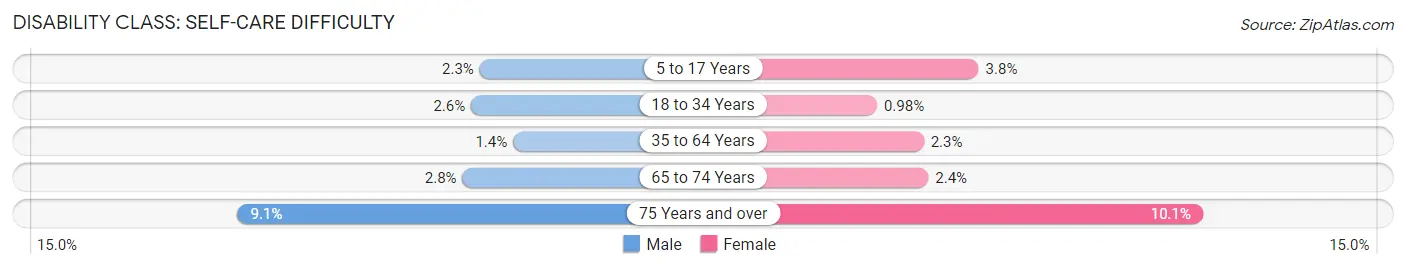
| Age Bracket | Male | Female |
| 5 to 17 Years | 54 (2.3%) | 86 (3.8%) |
| 18 to 34 Years | 76 (2.6%) | 32 (1.0%) |
| 35 to 64 Years | 82 (1.4%) | 144 (2.3%) |
| 65 to 74 Years | 50 (2.8%) | 48 (2.4%) |
| 75 Years and over | 101 (9.1%) | 165 (10.1%) |
Technology Access in Amherst County
Computing Device Access in Amherst County
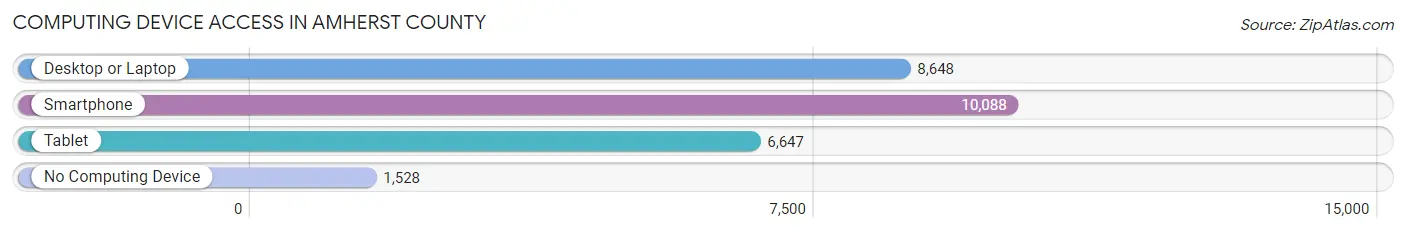
| Device Type | # Households | % Households |
| Desktop or Laptop | 8,648 | 68.5% |
| Smartphone | 10,088 | 80.0% |
| Tablet | 6,647 | 52.7% |
| No Computing Device | 1,528 | 12.1% |
| Total | 12,615 | 100.0% |
Internet Access in Amherst County
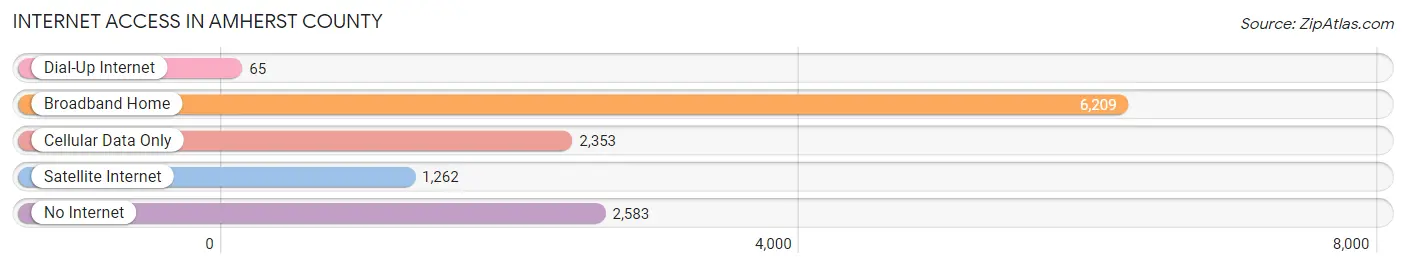
| Internet Type | # Households | % Households |
| Dial-Up Internet | 65 | 0.5% |
| Broadband Home | 6,209 | 49.2% |
| Cellular Data Only | 2,353 | 18.6% |
| Satellite Internet | 1,262 | 10.0% |
| No Internet | 2,583 | 20.5% |
| Total | 12,615 | 100.0% |
Amherst County Summary
Amherst County, Virginia is located in the central part of the state, in the foothills of the Blue Ridge Mountains. It is bordered by Nelson County to the north, Appomattox County to the east, Campbell County to the south, and Bedford County to the west. The county seat is Amherst, and the county is part of the Lynchburg Metropolitan Statistical Area.
History
Amherst County was formed in 1761 from parts of Albemarle County. It was named for Lord Jeffrey Amherst, a British general who served in the French and Indian War. The county was home to many prominent families, including the Cabells, the Harrisons, and the Randolphs.
During the American Revolution, Amherst County was a hotbed of activity. The county was the site of the Battle of Lynchburg, a major battle of the war. After the war, the county was home to many prominent figures, including Thomas Jefferson, James Madison, and James Monroe.
Geography
Amherst County covers an area of 441 square miles. The terrain is mostly rolling hills, with the Blue Ridge Mountains to the east. The James River forms the northern border of the county, and the Appomattox River forms the southern border. The county is home to several state parks, including James River State Park and Appomattox-Buckingham State Park.
Economy
The economy of Amherst County is largely based on agriculture. The county is home to several large farms, and the main crops are corn, soybeans, and wheat. The county is also home to several manufacturing companies, including a furniture factory and a paper mill.
Demographics
As of the 2010 census, Amherst County had a population of 32,353. The population is mostly white (90.2%), with African Americans making up 6.2% of the population. The median household income is $45,837, and the median home value is $164,400.
Amherst County is home to several colleges and universities, including the University of Lynchburg and Liberty University. The county is also home to several historic sites, including the Appomattox Court House National Historical Park.
Amherst County is a rural county with a rich history and a diverse economy. It is home to many prominent families, and it is a popular destination for outdoor recreation. The county is a great place to live, work, and raise a family.
Common Questions
What is Per Capita Income in Amherst County?
Per Capita income in Amherst County is $34,137.
What is the Median Family Income in Amherst County?
Median Family Income in Amherst County is $85,267.
What is the Median Household income in Amherst County?
Median Household Income in Amherst County is $64,454.
What is Income or Wage Gap in Amherst County?
Income or Wage Gap in Amherst County is 31.2%.
Women in Amherst County earn 68.8 cents for every dollar earned by a man.
What is Family Income Deficit in Amherst County?
Family Income Deficit in Amherst County is $10,730.
Families that are below poverty line in Amherst County earn $10,730 less on average than the poverty threshold level.
What is Inequality or Gini Index in Amherst County?
Inequality or Gini Index in Amherst County is 0.45.
What is the Total Population of Amherst County?
Total Population of Amherst County is 31,426.
What is the Total Male Population of Amherst County?
Total Male Population of Amherst County is 14,973.
What is the Total Female Population of Amherst County?
Total Female Population of Amherst County is 16,453.
What is the Ratio of Males per 100 Females in Amherst County?
There are 91.00 Males per 100 Females in Amherst County.
What is the Ratio of Females per 100 Males in Amherst County?
There are 109.88 Females per 100 Males in Amherst County.
What is the Median Population Age in Amherst County?
Median Population Age in Amherst County is 43.9 Years.
What is the Average Family Size in Amherst County
Average Family Size in Amherst County is 3.0 People.
What is the Average Household Size in Amherst County
Average Household Size in Amherst County is 2.4 People.
How Large is the Labor Force in Amherst County?
There are 15,682 People in the Labor Forcein in Amherst County.
What is the Percentage of People in the Labor Force in Amherst County?
60.7% of People are in the Labor Force in Amherst County.
What is the Unemployment Rate in Amherst County?
Unemployment Rate in Amherst County is 4.5%.