Amelia County, VA Map & Demographics
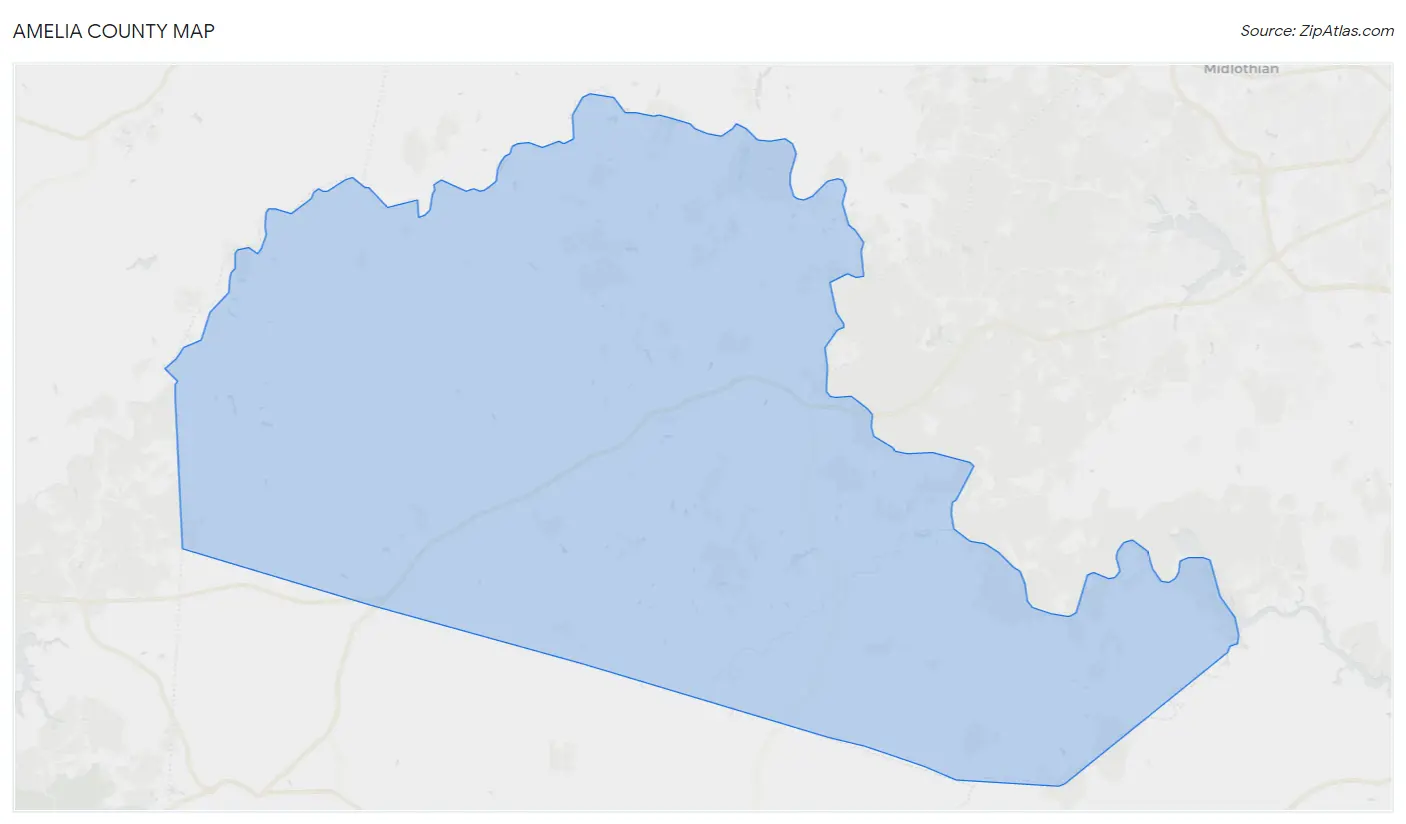
Amelia County Map
Amelia County Overview
$34,122
PER CAPITA INCOME
$85,575
AVG FAMILY INCOME
$63,438
AVG HOUSEHOLD INCOME
35.0%
WAGE / INCOME GAP [ % ]
65.0¢/ $1
WAGE / INCOME GAP [ $ ]
$9,080
FAMILY INCOME DEFICIT
0.43
INEQUALITY / GINI INDEX
13,309
TOTAL POPULATION
6,531
MALE POPULATION
6,778
FEMALE POPULATION
96.36
MALES / 100 FEMALES
103.78
FEMALES / 100 MALES
45.1
MEDIAN AGE
3.0
AVG FAMILY SIZE
2.5
AVG HOUSEHOLD SIZE
6,617
LABOR FORCE [ PEOPLE ]
61.0%
PERCENT IN LABOR FORCE
4.1%
UNEMPLOYMENT RATE
Amelia County Area Codes
Income in Amelia County
Income Overview in Amelia County
Per Capita Income in Amelia County is $34,122, while median incomes of families and households are $85,575 and $63,438 respectively.
| Characteristic | Number | Measure |
| Per Capita Income | 13,309 | $34,122 |
| Median Family Income | 3,715 | $85,575 |
| Mean Family Income | 3,715 | $100,034 |
| Median Household Income | 5,258 | $63,438 |
| Mean Household Income | 5,258 | $83,253 |
| Income Deficit | 3,715 | $9,080 |
| Wage / Income Gap (%) | 13,309 | 34.97% |
| Wage / Income Gap ($) | 13,309 | 65.03¢ per $1 |
| Gini / Inequality Index | 13,309 | 0.43 |
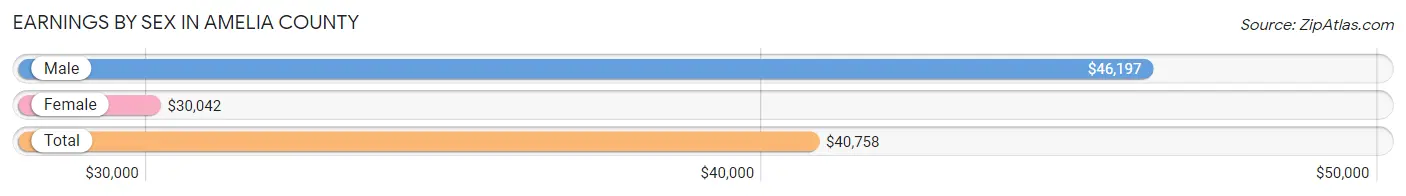
Earnings by Sex in Amelia County
Average Earnings in Amelia County are $40,758, $46,197 for men and $30,042 for women, a difference of 35.0%.
| Sex | Number | Average Earnings |
| Male | 3,770 (54.2%) | $46,197 |
| Female | 3,191 (45.8%) | $30,042 |
| Total | 6,961 (100.0%) | $40,758 |
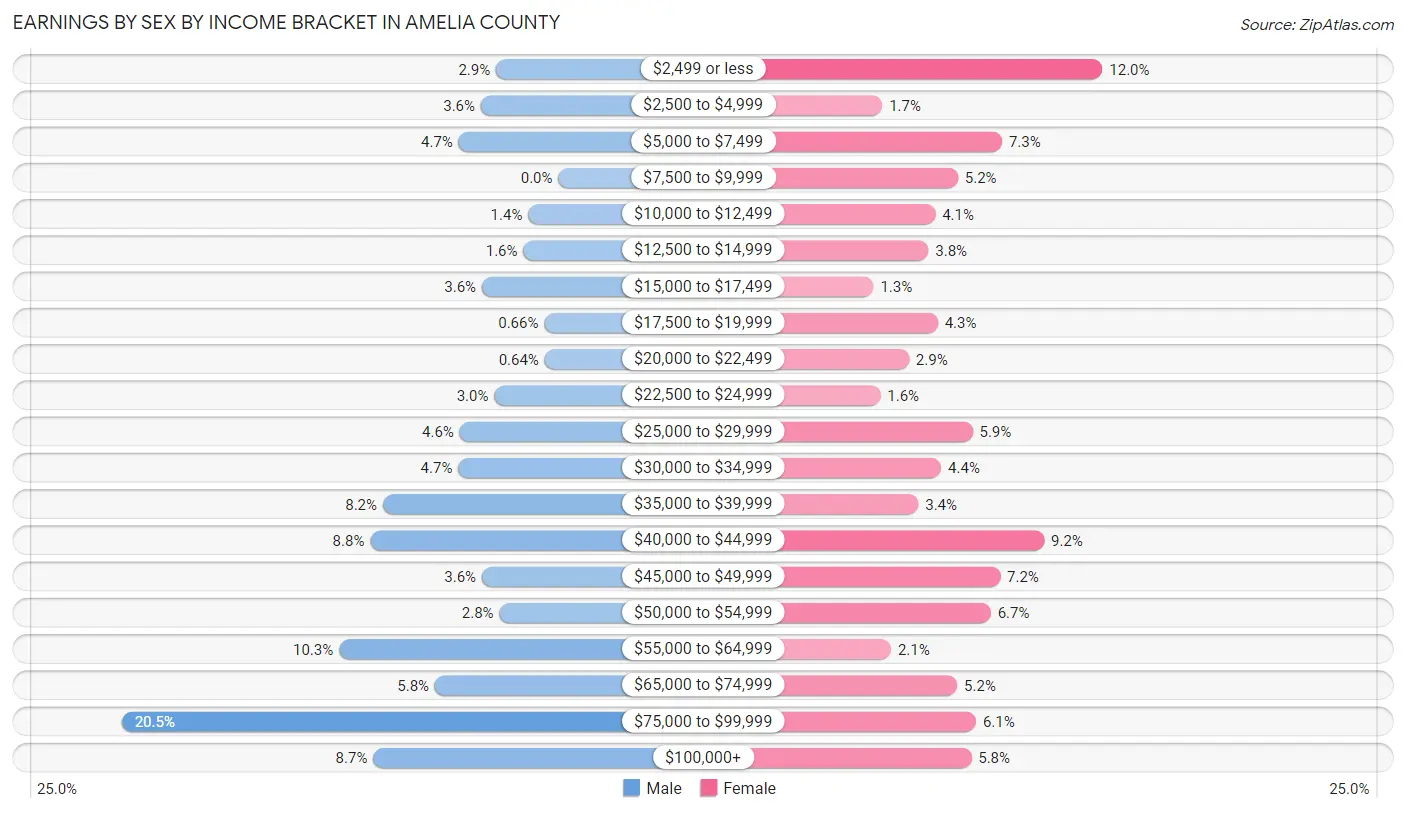
Earnings by Sex by Income Bracket in Amelia County
The most common earnings brackets in Amelia County are $75,000 to $99,999 for men (771 | 20.4%) and $2,499 or less for women (382 | 12.0%).
| Income | Male | Female |
| $2,499 or less | 110 (2.9%) | 382 (12.0%) |
| $2,500 to $4,999 | 137 (3.6%) | 53 (1.7%) |
| $5,000 to $7,499 | 176 (4.7%) | 232 (7.3%) |
| $7,500 to $9,999 | 0 (0.0%) | 166 (5.2%) |
| $10,000 to $12,499 | 53 (1.4%) | 132 (4.1%) |
| $12,500 to $14,999 | 62 (1.6%) | 122 (3.8%) |
| $15,000 to $17,499 | 135 (3.6%) | 40 (1.3%) |
| $17,500 to $19,999 | 25 (0.7%) | 136 (4.3%) |
| $20,000 to $22,499 | 24 (0.6%) | 93 (2.9%) |
| $22,500 to $24,999 | 113 (3.0%) | 50 (1.6%) |
| $25,000 to $29,999 | 174 (4.6%) | 188 (5.9%) |
| $30,000 to $34,999 | 177 (4.7%) | 141 (4.4%) |
| $35,000 to $39,999 | 310 (8.2%) | 107 (3.4%) |
| $40,000 to $44,999 | 332 (8.8%) | 295 (9.2%) |
| $45,000 to $49,999 | 135 (3.6%) | 229 (7.2%) |
| $50,000 to $54,999 | 104 (2.8%) | 215 (6.7%) |
| $55,000 to $64,999 | 387 (10.3%) | 66 (2.1%) |
| $65,000 to $74,999 | 218 (5.8%) | 165 (5.2%) |
| $75,000 to $99,999 | 771 (20.4%) | 193 (6.0%) |
| $100,000+ | 327 (8.7%) | 186 (5.8%) |
| Total | 3,770 (100.0%) | 3,191 (100.0%) |
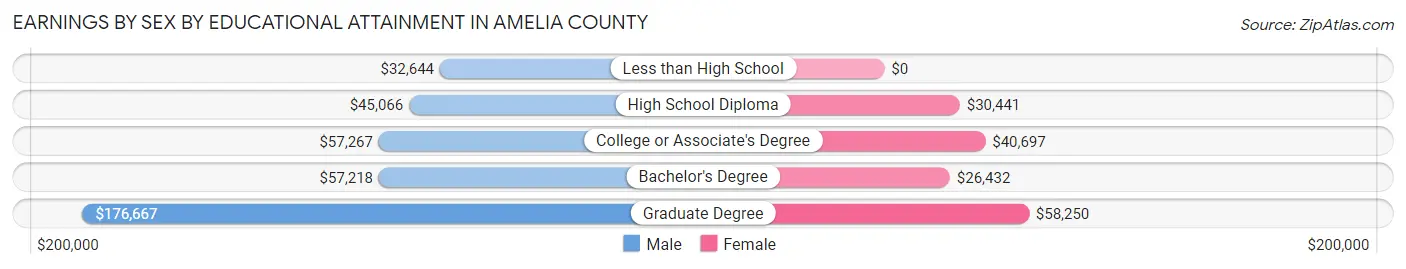
Earnings by Sex by Educational Attainment in Amelia County
Average earnings in Amelia County are $50,433 for men and $40,132 for women, a difference of 20.4%. Men with an educational attainment of graduate degree enjoy the highest average annual earnings of $176,667, while those with less than high school education earn the least with $32,644. Women with an educational attainment of graduate degree earn the most with the average annual earnings of $58,250, while those with bachelor's degree education have the smallest earnings of $26,432.
| Educational Attainment | Male Income | Female Income |
| Less than High School | $32,644 | $0 |
| High School Diploma | $45,066 | $30,441 |
| College or Associate's Degree | $57,267 | $40,697 |
| Bachelor's Degree | $57,218 | $26,432 |
| Graduate Degree | $176,667 | $58,250 |
| Total | $50,433 | $40,132 |
Family Income in Amelia County
Family Income Brackets in Amelia County
According to the Amelia County family income data, there are 895 families falling into the $75,000 to $99,999 income range, which is the most common income bracket and makes up 24.1% of all families. Conversely, the $10,000 to $14,999 income bracket is the least frequent group with only 11 families (0.3%) belonging to this category.
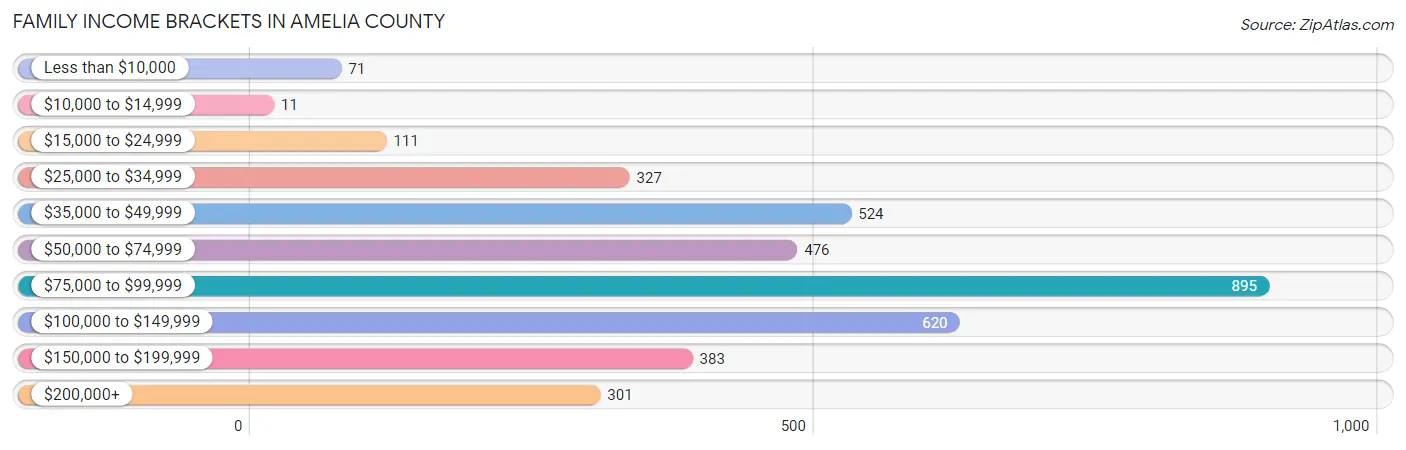
| Income Bracket | # Families | % Families |
| Less than $10,000 | 71 | 1.9% |
| $10,000 to $14,999 | 11 | 0.3% |
| $15,000 to $24,999 | 111 | 3.0% |
| $25,000 to $34,999 | 327 | 8.8% |
| $35,000 to $49,999 | 524 | 14.1% |
| $50,000 to $74,999 | 476 | 12.8% |
| $75,000 to $99,999 | 895 | 24.1% |
| $100,000 to $149,999 | 620 | 16.7% |
| $150,000 to $199,999 | 383 | 10.3% |
| $200,000+ | 301 | 8.1% |
Family Income by Famaliy Size in Amelia County
5-person families (245 | 6.6%) account for the highest median family income in Amelia County with $121,927 per family, while 2-person families (1,887 | 50.8%) have the highest median income of $42,966 per family member.
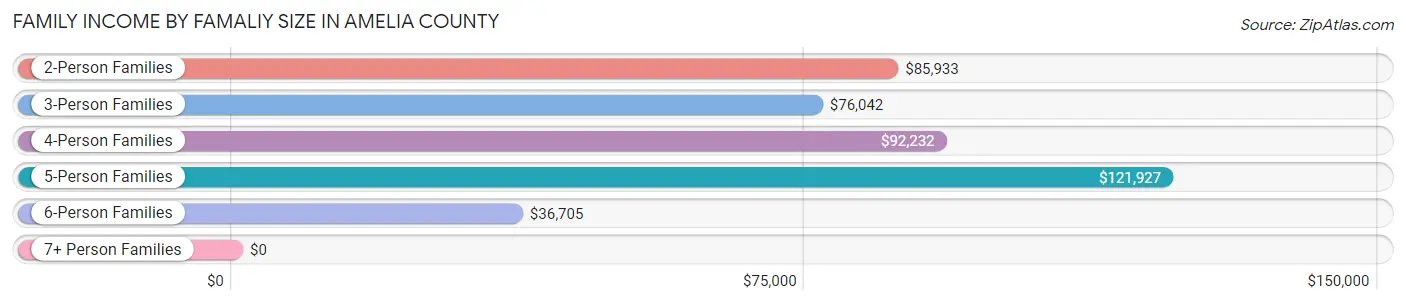
| Income Bracket | # Families | Median Income |
| 2-Person Families | 1,887 (50.8%) | $85,933 |
| 3-Person Families | 683 (18.4%) | $76,042 |
| 4-Person Families | 620 (16.7%) | $92,232 |
| 5-Person Families | 245 (6.6%) | $121,927 |
| 6-Person Families | 106 (2.9%) | $36,705 |
| 7+ Person Families | 174 (4.7%) | $0 |
| Total | 3,715 (100.0%) | $85,575 |
Family Income by Number of Earners in Amelia County
The median family income in Amelia County is $85,575, with families comprising 3+ earners (311) having the highest median family income of $163,162, while families with 1 earner (777) have the lowest median family income of $47,936, accounting for 8.4% and 20.9% of families, respectively.
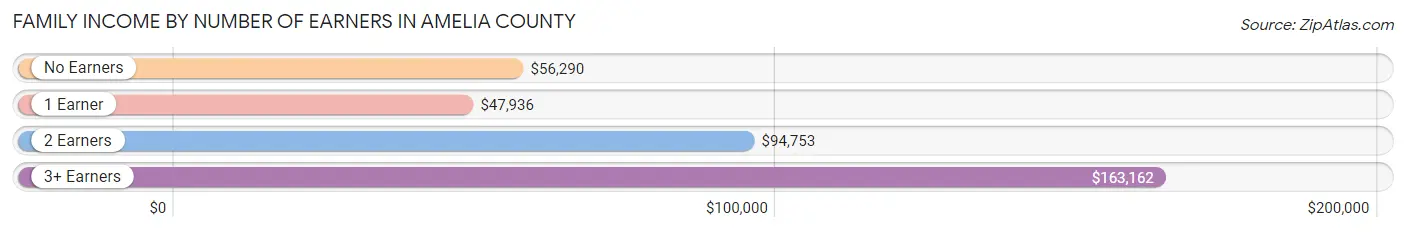
| Number of Earners | # Families | Median Income |
| No Earners | 844 (22.7%) | $56,290 |
| 1 Earner | 777 (20.9%) | $47,936 |
| 2 Earners | 1,783 (48.0%) | $94,753 |
| 3+ Earners | 311 (8.4%) | $163,162 |
| Total | 3,715 (100.0%) | $85,575 |
Household Income in Amelia County
Household Income Brackets in Amelia County
With 1,078 households falling in the category, the $75,000 to $99,999 income range is the most frequent in Amelia County, accounting for 20.5% of all households. In contrast, only 116 households (2.2%) fall into the $10,000 to $14,999 income bracket, making it the least populous group.
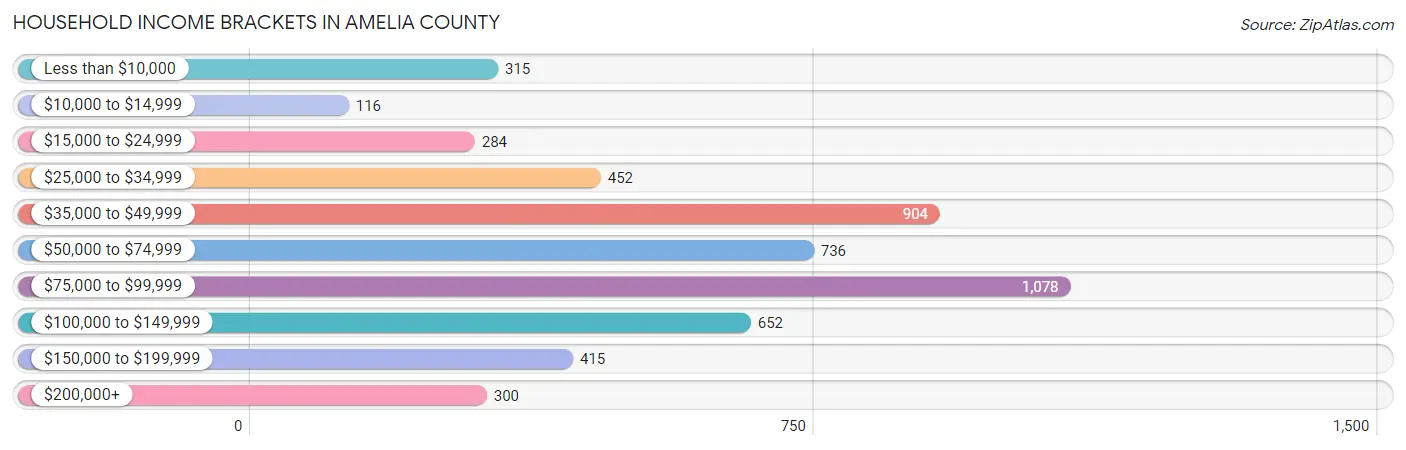
| Income Bracket | # Households | % Households |
| Less than $10,000 | 315 | 6.0% |
| $10,000 to $14,999 | 116 | 2.2% |
| $15,000 to $24,999 | 284 | 5.4% |
| $25,000 to $34,999 | 452 | 8.6% |
| $35,000 to $49,999 | 904 | 17.2% |
| $50,000 to $74,999 | 736 | 14.0% |
| $75,000 to $99,999 | 1,078 | 20.5% |
| $100,000 to $149,999 | 652 | 12.4% |
| $150,000 to $199,999 | 415 | 7.9% |
| $200,000+ | 300 | 5.7% |
Household Income by Householder Age in Amelia County
The median household income in Amelia County is $63,438, with the highest median household income of $83,000 found in the 25 to 44 years age bracket for the primary householder. A total of 1,502 households (28.6%) fall into this category. Meanwhile, the 15 to 24 years age bracket for the primary householder has the lowest median household income of $0, with 86 households (1.6%) in this group.
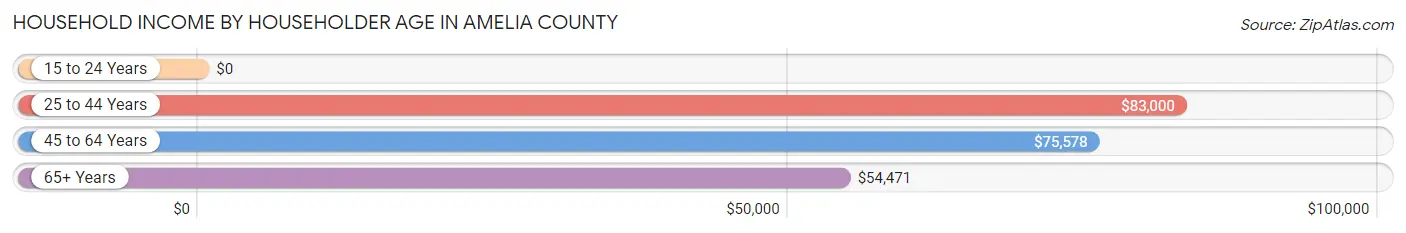
| Income Bracket | # Households | Median Income |
| 15 to 24 Years | 86 (1.6%) | $0 |
| 25 to 44 Years | 1,502 (28.6%) | $83,000 |
| 45 to 64 Years | 1,911 (36.3%) | $75,578 |
| 65+ Years | 1,759 (33.5%) | $54,471 |
| Total | 5,258 (100.0%) | $63,438 |
Poverty in Amelia County
Income Below Poverty by Sex and Age in Amelia County
With 11.6% poverty level for males and 10.7% for females among the residents of Amelia County, 5 year old males and 5 year old females are the most vulnerable to poverty, with 41 males (56.2%) and 34 females (58.6%) in their respective age groups living below the poverty level.
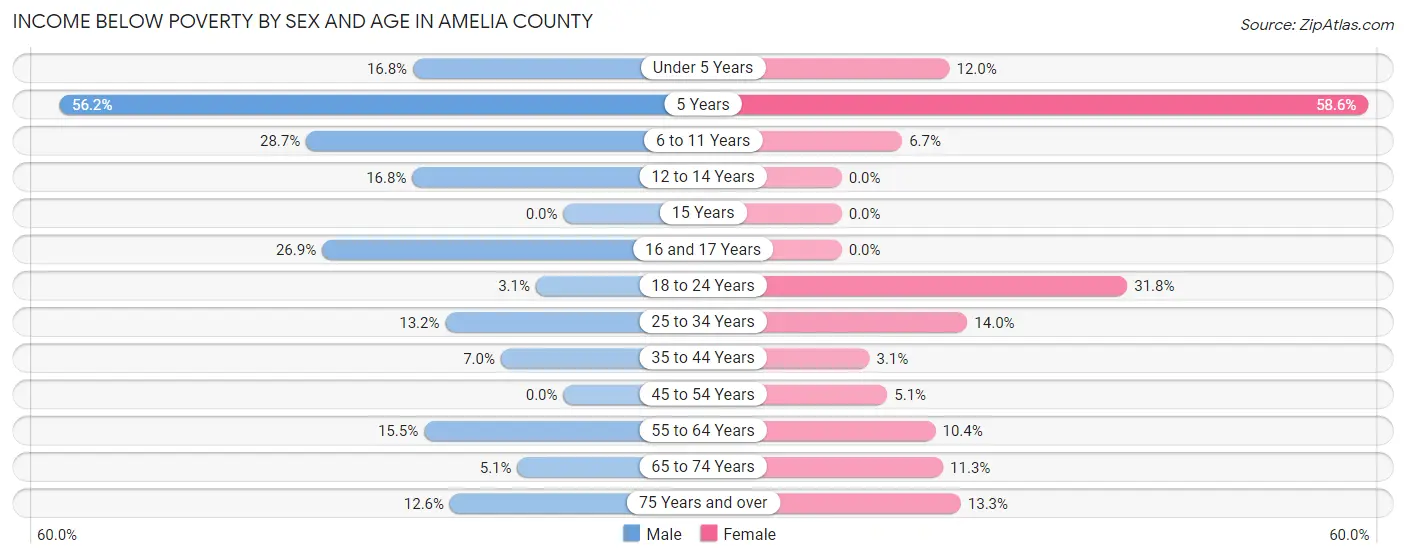
| Age Bracket | Male | Female |
| Under 5 Years | 67 (16.8%) | 39 (12.0%) |
| 5 Years | 41 (56.2%) | 34 (58.6%) |
| 6 to 11 Years | 94 (28.7%) | 33 (6.7%) |
| 12 to 14 Years | 68 (16.8%) | 0 (0.0%) |
| 15 Years | 0 (0.0%) | 0 (0.0%) |
| 16 and 17 Years | 25 (26.9%) | 0 (0.0%) |
| 18 to 24 Years | 7 (3.1%) | 166 (31.8%) |
| 25 to 34 Years | 124 (13.2%) | 96 (14.0%) |
| 35 to 44 Years | 53 (7.0%) | 23 (3.1%) |
| 45 to 54 Years | 0 (0.0%) | 44 (5.1%) |
| 55 to 64 Years | 171 (15.5%) | 114 (10.4%) |
| 65 to 74 Years | 35 (5.1%) | 72 (11.3%) |
| 75 Years and over | 67 (12.6%) | 96 (13.3%) |
| Total | 752 (11.6%) | 717 (10.7%) |
Income Above Poverty by Sex and Age in Amelia County
According to the poverty statistics in Amelia County, males aged 15 years and females aged 12 to 14 years are the age groups that are most secure financially, with 100.0% of males and 100.0% of females in these age groups living above the poverty line.
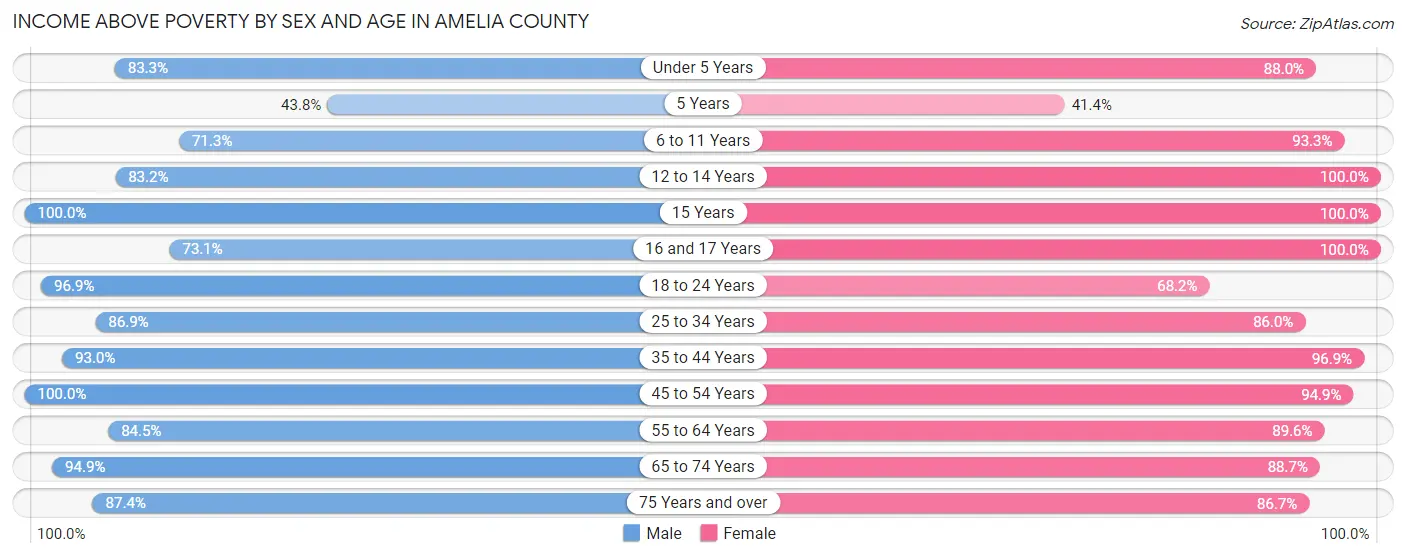
| Age Bracket | Male | Female |
| Under 5 Years | 333 (83.3%) | 286 (88.0%) |
| 5 Years | 32 (43.8%) | 24 (41.4%) |
| 6 to 11 Years | 234 (71.3%) | 457 (93.3%) |
| 12 to 14 Years | 336 (83.2%) | 180 (100.0%) |
| 15 Years | 29 (100.0%) | 167 (100.0%) |
| 16 and 17 Years | 68 (73.1%) | 204 (100.0%) |
| 18 to 24 Years | 221 (96.9%) | 356 (68.2%) |
| 25 to 34 Years | 819 (86.9%) | 590 (86.0%) |
| 35 to 44 Years | 707 (93.0%) | 722 (96.9%) |
| 45 to 54 Years | 929 (100.0%) | 823 (94.9%) |
| 55 to 64 Years | 931 (84.5%) | 978 (89.6%) |
| 65 to 74 Years | 649 (94.9%) | 566 (88.7%) |
| 75 Years and over | 463 (87.4%) | 628 (86.7%) |
| Total | 5,751 (88.4%) | 5,981 (89.3%) |
Income Below Poverty Among Married-Couple Families in Amelia County
The poverty statistics for married-couple families in Amelia County show that 6.0% or 193 of the total 3,210 families live below the poverty line. Families with 3 or 4 children have the highest poverty rate of 39.8%, comprising of 86 families. On the other hand, families with 5 or more children have the lowest poverty rate of 0.0%, which includes 0 families.

| Children | Above Poverty | Below Poverty |
| No Children | 1,711 (94.6%) | 98 (5.4%) |
| 1 or 2 Children | 1,044 (99.2%) | 9 (0.9%) |
| 3 or 4 Children | 130 (60.2%) | 86 (39.8%) |
| 5 or more Children | 132 (100.0%) | 0 (0.0%) |
| Total | 3,017 (94.0%) | 193 (6.0%) |
Income Below Poverty Among Single-Parent Households in Amelia County
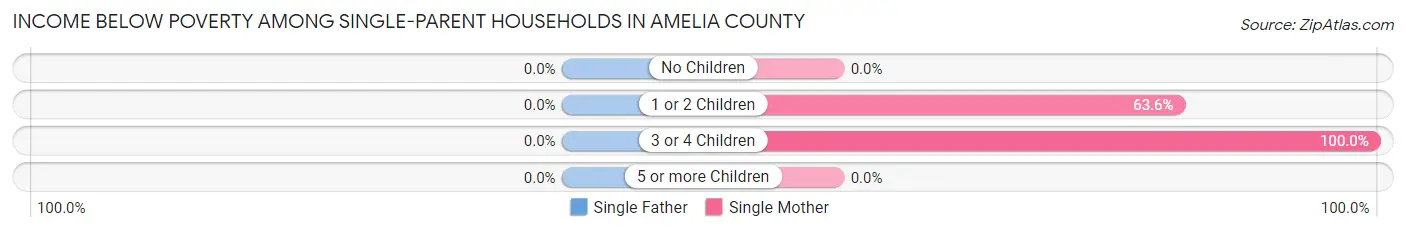
| Children | Single Father | Single Mother |
| No Children | 0 (0.0%) | 0 (0.0%) |
| 1 or 2 Children | 0 (0.0%) | 28 (63.6%) |
| 3 or 4 Children | 0 (0.0%) | 23 (100.0%) |
| 5 or more Children | 0 (0.0%) | 0 (0.0%) |
| Total | 0 (0.0%) | 51 (16.6%) |
Income Below Poverty Among Married-Couple vs Single-Parent Households in Amelia County
The poverty data for Amelia County shows that 193 of the married-couple family households (6.0%) and 51 of the single-parent households (10.1%) are living below the poverty level. Within the married-couple family households, those with 3 or 4 children have the highest poverty rate, with 86 households (39.8%) falling below the poverty line. Among the single-parent households, those with 3 or 4 children have the highest poverty rate, with 23 household (100.0%) living below poverty.
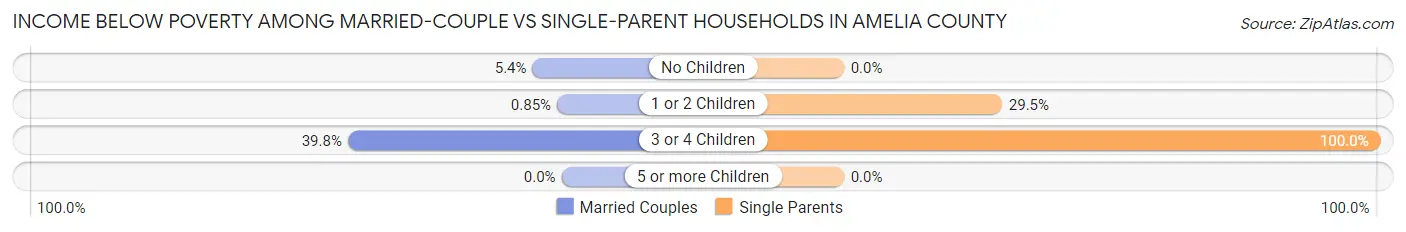
| Children | Married-Couple Families | Single-Parent Households |
| No Children | 98 (5.4%) | 0 (0.0%) |
| 1 or 2 Children | 9 (0.9%) | 28 (29.5%) |
| 3 or 4 Children | 86 (39.8%) | 23 (100.0%) |
| 5 or more Children | 0 (0.0%) | 0 (0.0%) |
| Total | 193 (6.0%) | 51 (10.1%) |
Race in Amelia County
The most populous races in Amelia County are White / Caucasian (9,928 | 74.6%), Black / African American (2,679 | 20.1%), and Two or more Races (701 | 5.3%).
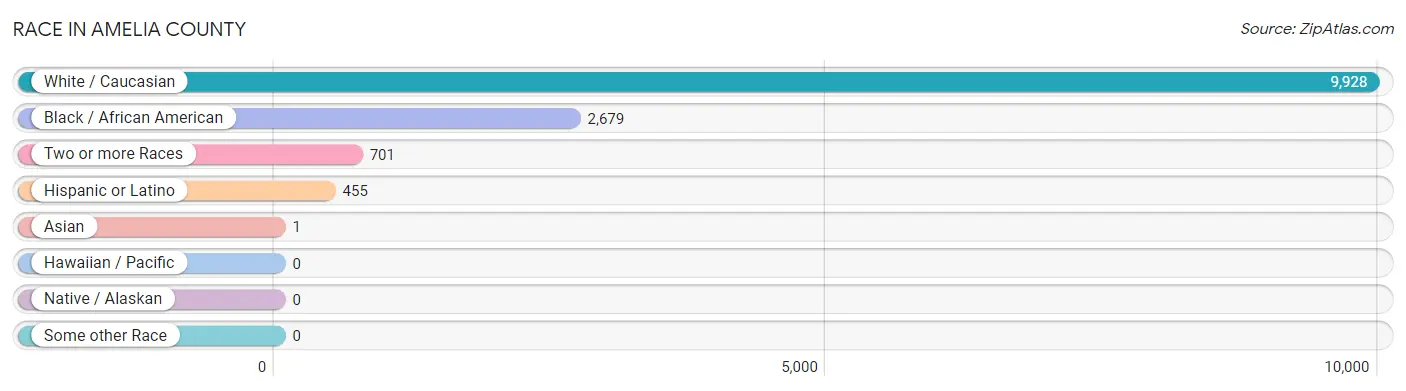
| Race | # Population | % Population |
| Asian | 1 | 0.0% |
| Black / African American | 2,679 | 20.1% |
| Hawaiian / Pacific | 0 | 0.0% |
| Hispanic or Latino | 455 | 3.4% |
| Native / Alaskan | 0 | 0.0% |
| White / Caucasian | 9,928 | 74.6% |
| Two or more Races | 701 | 5.3% |
| Some other Race | 0 | 0.0% |
| Total | 13,309 | 100.0% |
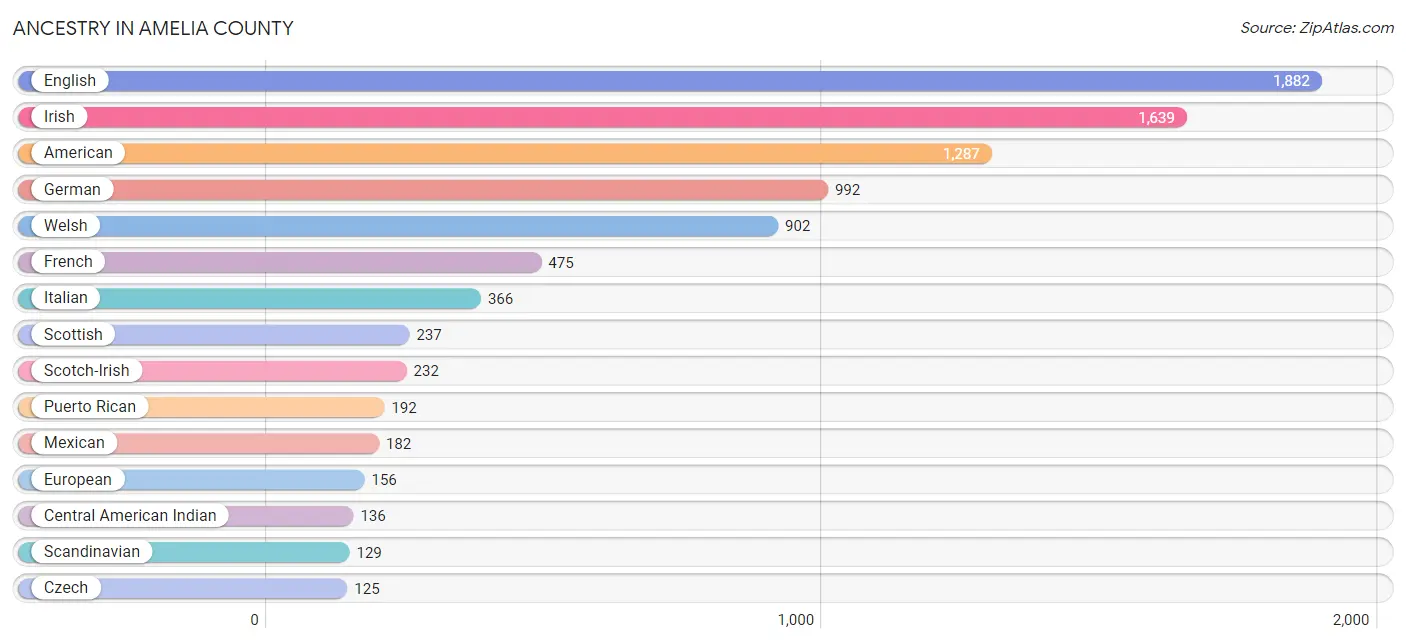
Ancestry in Amelia County
The most populous ancestries reported in Amelia County are English (1,882 | 14.1%), Irish (1,639 | 12.3%), American (1,287 | 9.7%), German (992 | 7.4%), and Welsh (902 | 6.8%), together accounting for 50.4% of all Amelia County residents.
| Ancestry | # Population | % Population |
| African | 20 | 0.2% |
| American | 1,287 | 9.7% |
| Bolivian | 47 | 0.4% |
| British | 42 | 0.3% |
| Burmese | 90 | 0.7% |
| Canadian | 26 | 0.2% |
| Central American Indian | 136 | 1.0% |
| Cherokee | 38 | 0.3% |
| Colombian | 34 | 0.3% |
| Czech | 125 | 0.9% |
| Dutch | 20 | 0.2% |
| English | 1,882 | 14.1% |
| European | 156 | 1.2% |
| French | 475 | 3.6% |
| German | 992 | 7.4% |
| Guyanese | 25 | 0.2% |
| Irish | 1,639 | 12.3% |
| Italian | 366 | 2.8% |
| Mexican | 182 | 1.4% |
| Polish | 9 | 0.1% |
| Portuguese | 90 | 0.7% |
| Puerto Rican | 192 | 1.4% |
| Romanian | 36 | 0.3% |
| Russian | 29 | 0.2% |
| Scandinavian | 129 | 1.0% |
| Scotch-Irish | 232 | 1.7% |
| Scottish | 237 | 1.8% |
| Slavic | 16 | 0.1% |
| Slovak | 18 | 0.1% |
| Slovene | 18 | 0.1% |
| South American | 81 | 0.6% |
| Sri Lankan | 1 | 0.0% |
| Subsaharan African | 20 | 0.2% |
| Swedish | 40 | 0.3% |
| Swiss | 17 | 0.1% |
| Welsh | 902 | 6.8% | View All 36 Rows |
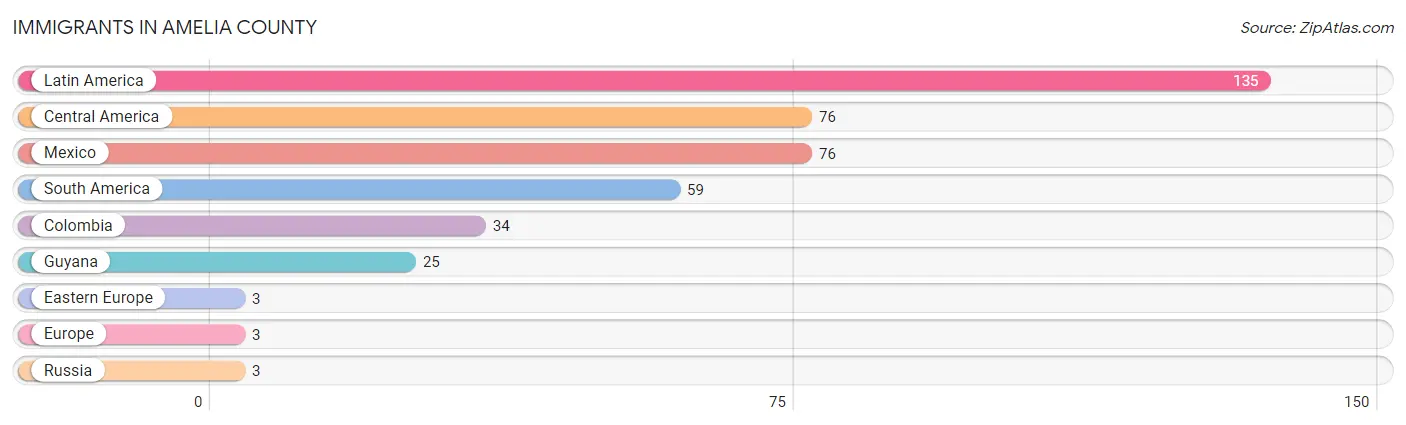
Immigrants in Amelia County
The most numerous immigrant groups reported in Amelia County came from Latin America (135 | 1.0%), Central America (76 | 0.6%), Mexico (76 | 0.6%), South America (59 | 0.4%), and Colombia (34 | 0.3%), together accounting for 2.9% of all Amelia County residents.
| Immigration Origin | # Population | % Population |
| Central America | 76 | 0.6% |
| Colombia | 34 | 0.3% |
| Eastern Europe | 3 | 0.0% |
| Europe | 3 | 0.0% |
| Guyana | 25 | 0.2% |
| Latin America | 135 | 1.0% |
| Mexico | 76 | 0.6% |
| Russia | 3 | 0.0% |
| South America | 59 | 0.4% | View All 9 Rows |
Sex and Age in Amelia County
Sex and Age in Amelia County
The most populous age groups in Amelia County are 55 to 59 Years (724 | 11.1%) for men and 15 to 19 Years (606 | 8.9%) for women.
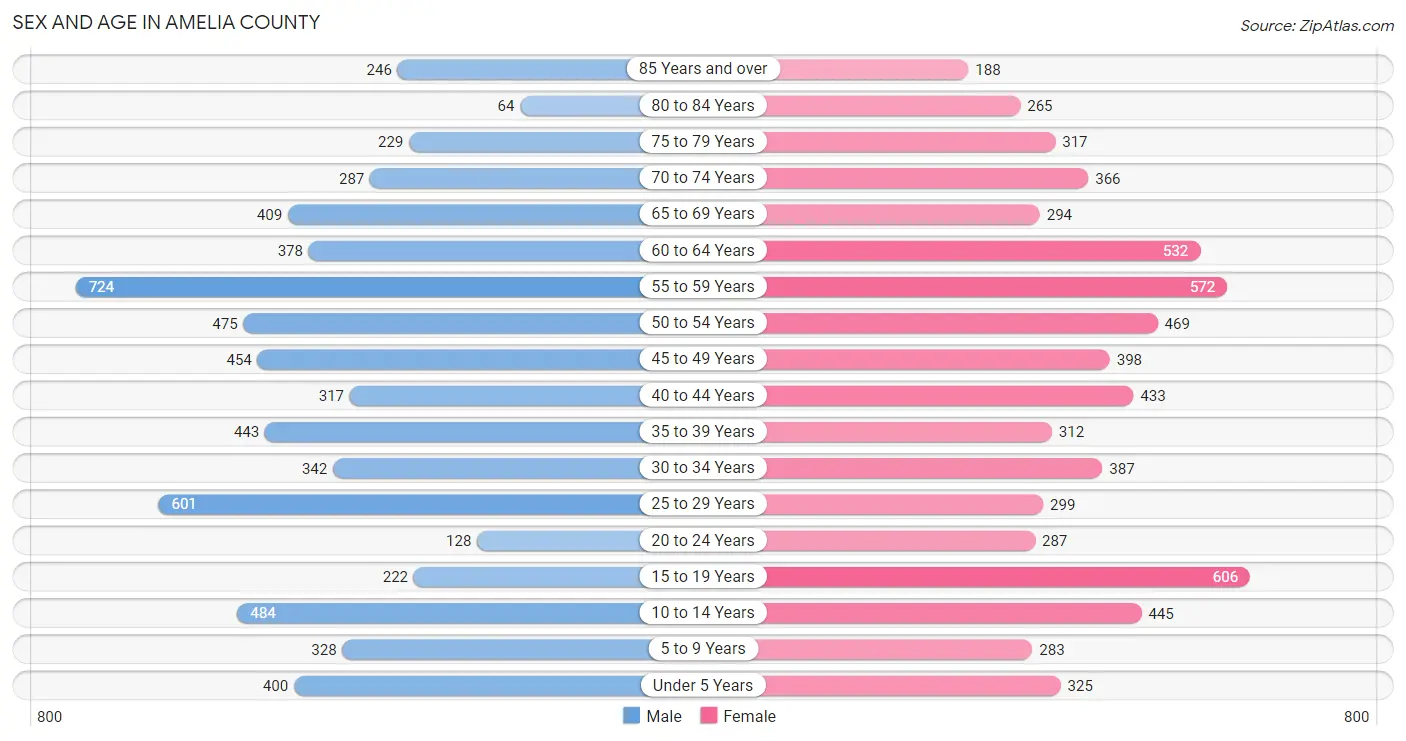
| Age Bracket | Male | Female |
| Under 5 Years | 400 (6.1%) | 325 (4.8%) |
| 5 to 9 Years | 328 (5.0%) | 283 (4.2%) |
| 10 to 14 Years | 484 (7.4%) | 445 (6.6%) |
| 15 to 19 Years | 222 (3.4%) | 606 (8.9%) |
| 20 to 24 Years | 128 (2.0%) | 287 (4.2%) |
| 25 to 29 Years | 601 (9.2%) | 299 (4.4%) |
| 30 to 34 Years | 342 (5.2%) | 387 (5.7%) |
| 35 to 39 Years | 443 (6.8%) | 312 (4.6%) |
| 40 to 44 Years | 317 (4.9%) | 433 (6.4%) |
| 45 to 49 Years | 454 (7.0%) | 398 (5.9%) |
| 50 to 54 Years | 475 (7.3%) | 469 (6.9%) |
| 55 to 59 Years | 724 (11.1%) | 572 (8.4%) |
| 60 to 64 Years | 378 (5.8%) | 532 (7.9%) |
| 65 to 69 Years | 409 (6.3%) | 294 (4.3%) |
| 70 to 74 Years | 287 (4.4%) | 366 (5.4%) |
| 75 to 79 Years | 229 (3.5%) | 317 (4.7%) |
| 80 to 84 Years | 64 (1.0%) | 265 (3.9%) |
| 85 Years and over | 246 (3.8%) | 188 (2.8%) |
| Total | 6,531 (100.0%) | 6,778 (100.0%) |
Families and Households in Amelia County
Median Family Size in Amelia County
The median family size in Amelia County is 3.05 persons per family, with married-couple families (3,210 | 86.4%) accounting for the largest median family size of 3.09 persons per family. On the other hand, single male/father families (198 | 5.3%) represent the smallest median family size with 2.63 persons per family.
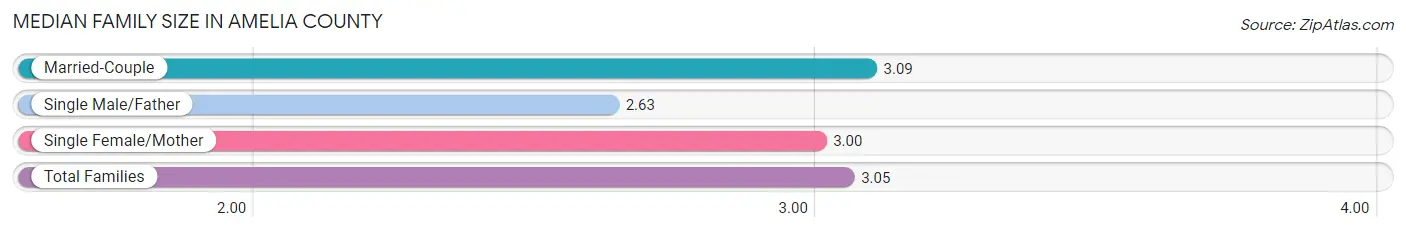
| Family Type | # Families | Family Size |
| Married-Couple | 3,210 (86.4%) | 3.09 |
| Single Male/Father | 198 (5.3%) | 2.63 |
| Single Female/Mother | 307 (8.3%) | 3.00 |
| Total Families | 3,715 (100.0%) | 3.05 |
Median Household Size in Amelia County
The median household size in Amelia County is 2.51 persons per household, with married-couple households (3,210 | 61.1%) accounting for the largest median household size of 3.09 persons per household. non-family households (1,543 | 29.3%) represent the smallest median household size with 1.14 persons per household.
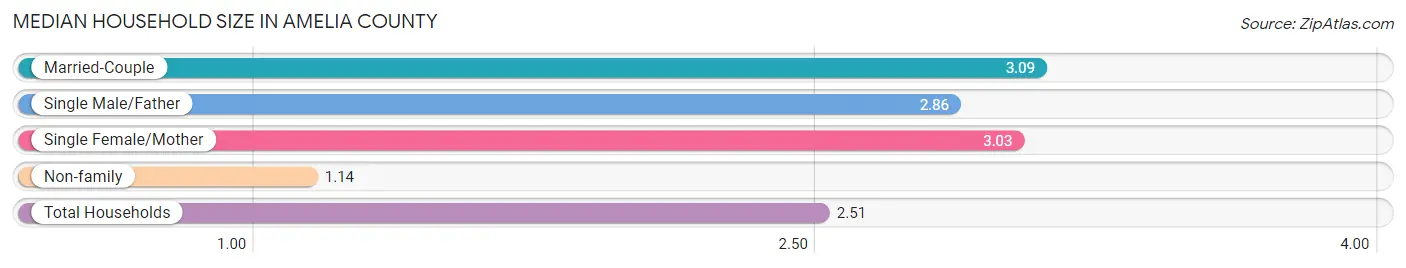
| Household Type | # Households | Household Size |
| Married-Couple | 3,210 (61.1%) | 3.09 |
| Single Male/Father | 198 (3.8%) | 2.86 |
| Single Female/Mother | 307 (5.8%) | 3.03 |
| Non-family | 1,543 (29.3%) | 1.14 |
| Total Households | 5,258 (100.0%) | 2.51 |
Household Size by Marriage Status in Amelia County
Out of a total of 5,258 households in Amelia County, 3,715 (70.7%) are family households, while 1,543 (29.3%) are nonfamily households. The most numerous type of family households are 2-person households, comprising 1,829, and the most common type of nonfamily households are 1-person households, comprising 1,321.
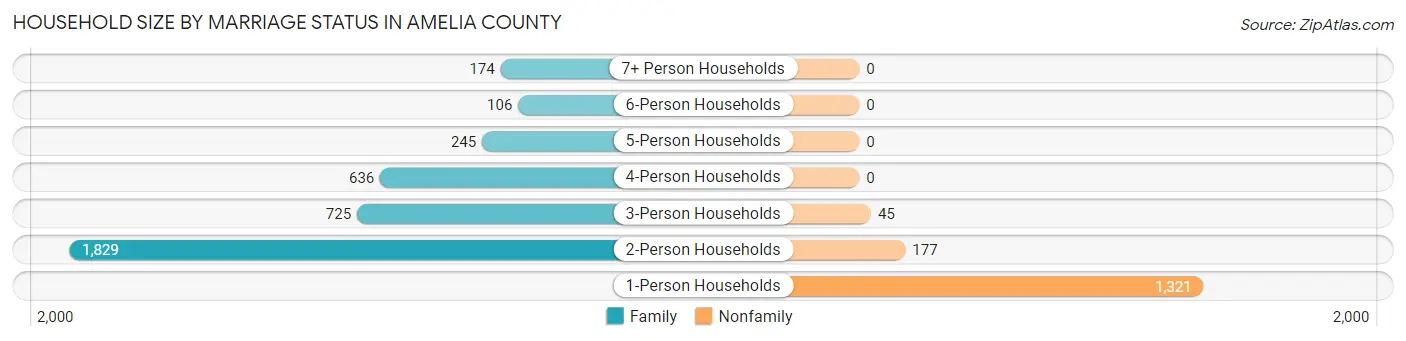
| Household Size | Family Households | Nonfamily Households |
| 1-Person Households | - | 1,321 (25.1%) |
| 2-Person Households | 1,829 (34.8%) | 177 (3.4%) |
| 3-Person Households | 725 (13.8%) | 45 (0.9%) |
| 4-Person Households | 636 (12.1%) | 0 (0.0%) |
| 5-Person Households | 245 (4.7%) | 0 (0.0%) |
| 6-Person Households | 106 (2.0%) | 0 (0.0%) |
| 7+ Person Households | 174 (3.3%) | 0 (0.0%) |
| Total | 3,715 (70.7%) | 1,543 (29.3%) |
Female Fertility in Amelia County
Fertility by Age in Amelia County
| Age Bracket | Women with Births | Births / 1,000 Women |
| 15 to 19 years | 0 (0.0%) | 0.0 |
| 20 to 34 years | 0 (0.0%) | 0.0 |
| 35 to 50 years | 0 (0.0%) | 0.0 |
| Total | 0 (0.0%) | 0.0 |
Fertility by Age by Marriage Status in Amelia County
| Age Bracket | Married | Unmarried |
| 15 to 19 years | 0 (0.0%) | 0 (0.0%) |
| 20 to 34 years | 0 (0.0%) | 0 (0.0%) |
| 35 to 50 years | 0 (0.0%) | 0 (0.0%) |
| Total | 0 (0.0%) | 0 (0.0%) |
Fertility by Education in Amelia County
| Educational Attainment | Women with Births | Births / 1,000 Women |
| Less than High School | 0 (0.0%) | 0.0 |
| High School Diploma | 0 (0.0%) | 0.0 |
| College or Associate's Degree | 0 (0.0%) | 0.0 |
| Bachelor's Degree | 0 (0.0%) | 0.0 |
| Graduate Degree | 0 (0.0%) | 0.0 |
| Total | 0 (0.0%) | 0.0 |
Fertility by Education by Marriage Status in Amelia County
| Educational Attainment | Married | Unmarried |
| Less than High School | 0 (0.0%) | 0 (0.0%) |
| High School Diploma | 0 (0.0%) | 0 (0.0%) |
| College or Associate's Degree | 0 (0.0%) | 0 (0.0%) |
| Bachelor's Degree | 0 (0.0%) | 0 (0.0%) |
| Graduate Degree | 0 (0.0%) | 0 (0.0%) |
| Total | 0 (0.0%) | 0 (0.0%) |
Employment Characteristics in Amelia County
Employment by Class of Employer in Amelia County
Among the 6,079 employed individuals in Amelia County, private company employees (3,924 | 64.5%), local government employees (606 | 10.0%), and self-employed (not incorporated) (430 | 7.1%) make up the most common classes of employment.
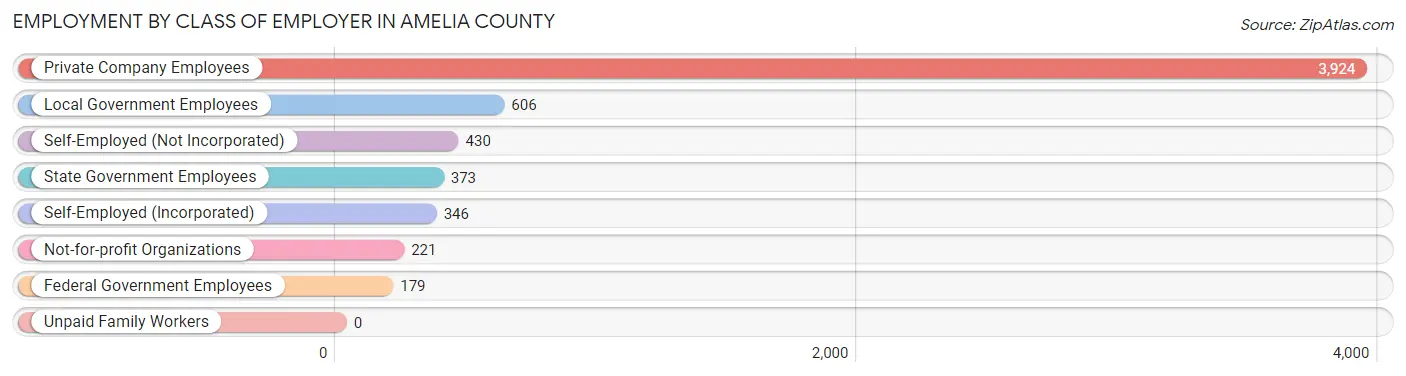
| Employer Class | # Employees | % Employees |
| Private Company Employees | 3,924 | 64.5% |
| Self-Employed (Incorporated) | 346 | 5.7% |
| Self-Employed (Not Incorporated) | 430 | 7.1% |
| Not-for-profit Organizations | 221 | 3.6% |
| Local Government Employees | 606 | 10.0% |
| State Government Employees | 373 | 6.1% |
| Federal Government Employees | 179 | 2.9% |
| Unpaid Family Workers | 0 | 0.0% |
| Total | 6,079 | 100.0% |
Employment Status by Age in Amelia County
According to the labor force statistics for Amelia County, out of the total population over 16 years of age (10,848), 61.0% or 6,617 individuals are in the labor force, with 4.1% or 271 of them unemployed. The age group with the highest labor force participation rate is 20 to 24 years, with 94.9% or 394 individuals in the labor force. Within the labor force, the 20 to 24 years age range has the highest percentage of unemployed individuals, with 17.8% or 70 of them being unemployed.
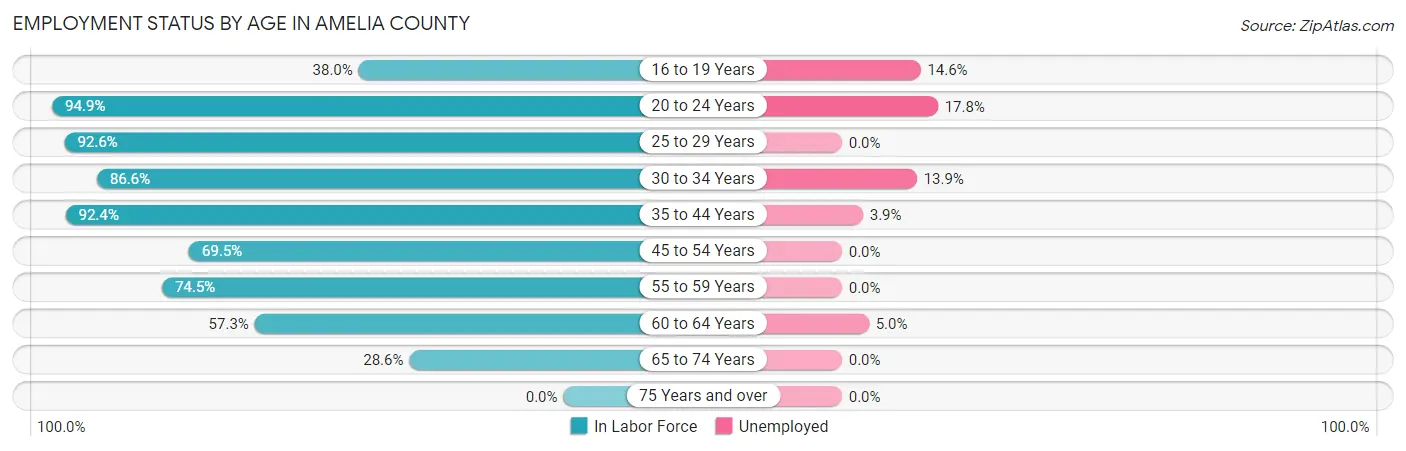
| Age Bracket | In Labor Force | Unemployed |
| 16 to 19 Years | 240 (38.0%) | 35 (14.6%) |
| 20 to 24 Years | 394 (94.9%) | 70 (17.8%) |
| 25 to 29 Years | 833 (92.6%) | 0 (0.0%) |
| 30 to 34 Years | 631 (86.6%) | 88 (13.9%) |
| 35 to 44 Years | 1,391 (92.4%) | 54 (3.9%) |
| 45 to 54 Years | 1,248 (69.5%) | 0 (0.0%) |
| 55 to 59 Years | 966 (74.5%) | 0 (0.0%) |
| 60 to 64 Years | 521 (57.3%) | 26 (5.0%) |
| 65 to 74 Years | 388 (28.6%) | 0 (0.0%) |
| 75 Years and over | 0 (0.0%) | 0 (0.0%) |
| Total | 6,617 (61.0%) | 271 (4.1%) |
Employment Status by Educational Attainment in Amelia County
According to labor force statistics for Amelia County, 78.3% of individuals (5,587) out of the total population between 25 and 64 years of age (7,136) are in the labor force, with 3.0% or 168 of them being unemployed. The group with the highest labor force participation rate are those with the educational attainment of college / associate degree, with 84.4% or 1,458 individuals in the labor force. Within the labor force, individuals with bachelor's degree or higher education have the highest percentage of unemployment, with 4.6% or 48 of them being unemployed.
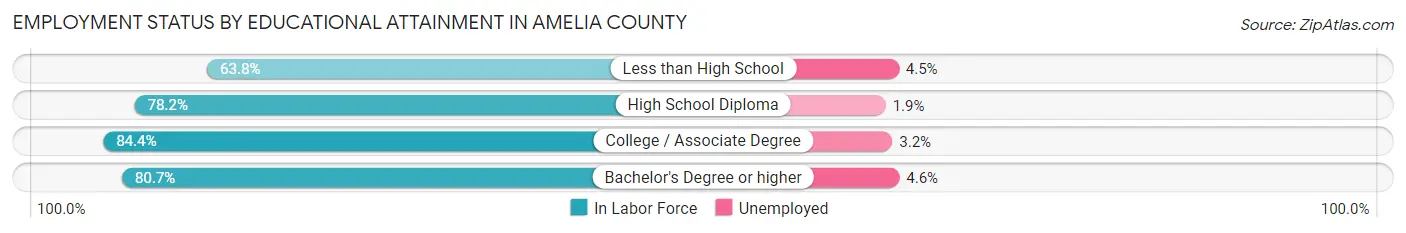
| Educational Attainment | In Labor Force | Unemployed |
| Less than High School | 577 (63.8%) | 41 (4.5%) |
| High School Diploma | 2,502 (78.2%) | 61 (1.9%) |
| College / Associate Degree | 1,458 (84.4%) | 55 (3.2%) |
| Bachelor's Degree or higher | 1,053 (80.7%) | 60 (4.6%) |
| Total | 5,587 (78.3%) | 214 (3.0%) |
Employment Occupations by Sex in Amelia County
Management, Business, Science and Arts Occupations
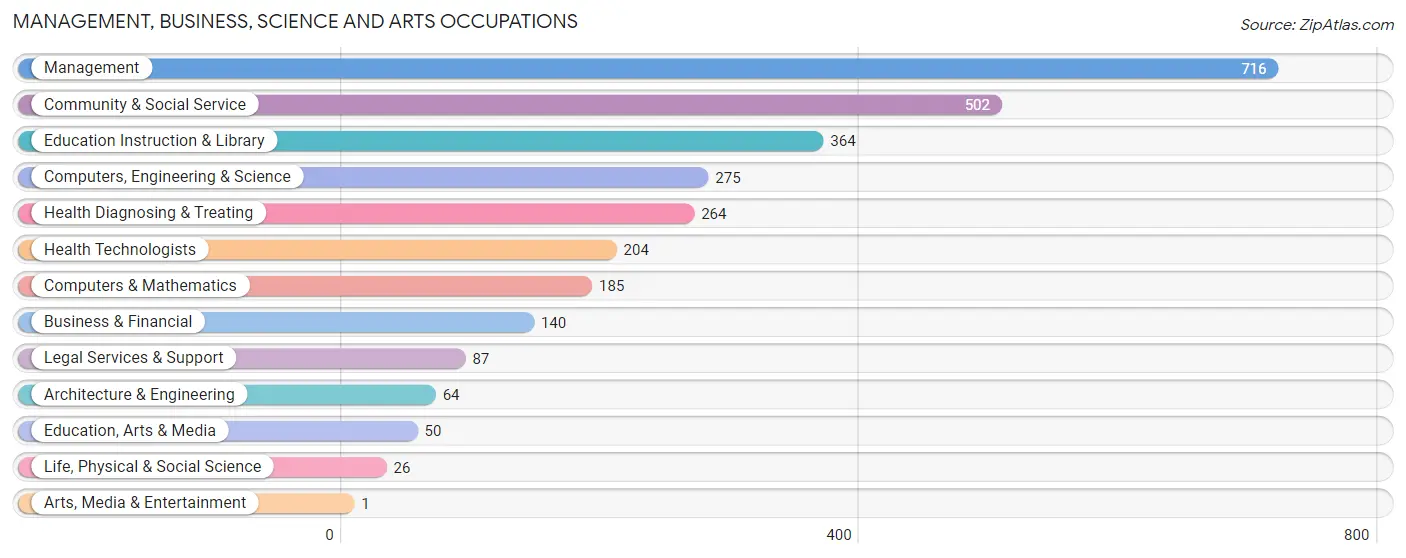
The most common Management, Business, Science and Arts occupations in Amelia County are Management (716 | 11.3%), Community & Social Service (502 | 7.9%), Education Instruction & Library (364 | 5.7%), Computers, Engineering & Science (275 | 4.3%), and Health Diagnosing & Treating (264 | 4.2%).
Management, Business, Science and Arts Occupations by Sex
Within the Management, Business, Science and Arts occupations in Amelia County, the most male-oriented occupations are Arts, Media & Entertainment (100.0%), Computers & Mathematics (89.7%), and Computers, Engineering & Science (69.1%), while the most female-oriented occupations are Legal Services & Support (100.0%), Education Instruction & Library (100.0%), and Health Technologists (97.1%).
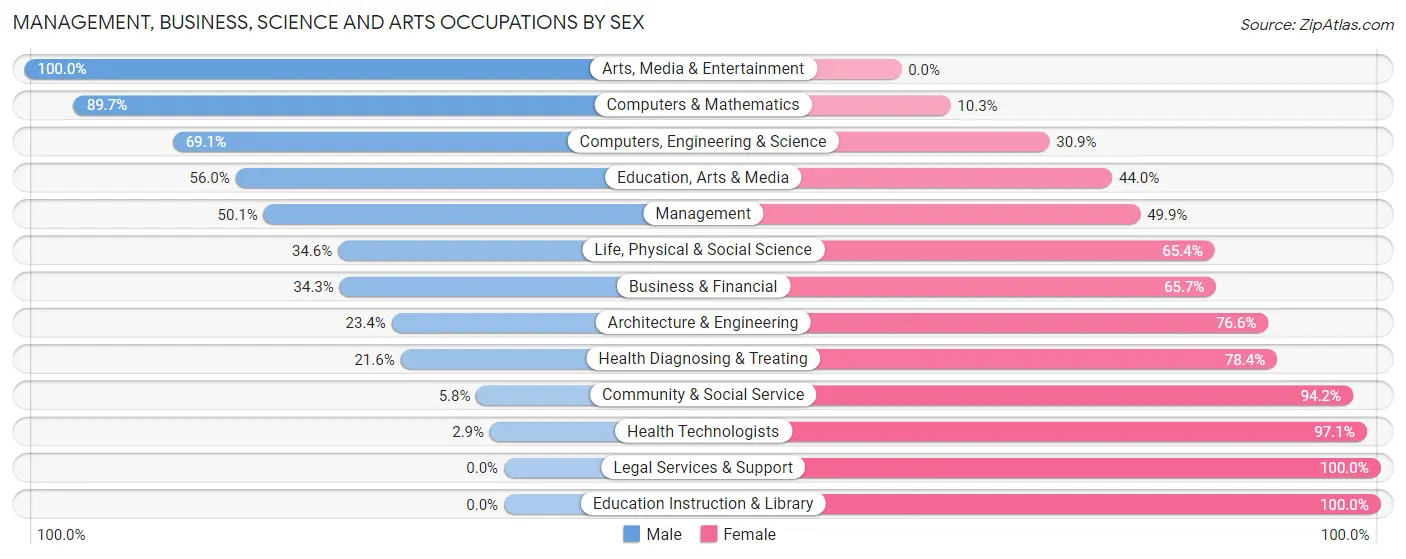
| Occupation | Male | Female |
| Management | 359 (50.1%) | 357 (49.9%) |
| Business & Financial | 48 (34.3%) | 92 (65.7%) |
| Computers, Engineering & Science | 190 (69.1%) | 85 (30.9%) |
| Computers & Mathematics | 166 (89.7%) | 19 (10.3%) |
| Architecture & Engineering | 15 (23.4%) | 49 (76.6%) |
| Life, Physical & Social Science | 9 (34.6%) | 17 (65.4%) |
| Community & Social Service | 29 (5.8%) | 473 (94.2%) |
| Education, Arts & Media | 28 (56.0%) | 22 (44.0%) |
| Legal Services & Support | 0 (0.0%) | 87 (100.0%) |
| Education Instruction & Library | 0 (0.0%) | 364 (100.0%) |
| Arts, Media & Entertainment | 1 (100.0%) | 0 (0.0%) |
| Health Diagnosing & Treating | 57 (21.6%) | 207 (78.4%) |
| Health Technologists | 6 (2.9%) | 198 (97.1%) |
| Total (Category) | 683 (36.0%) | 1,214 (64.0%) |
| Total (Overall) | 3,481 (54.9%) | 2,859 (45.1%) |
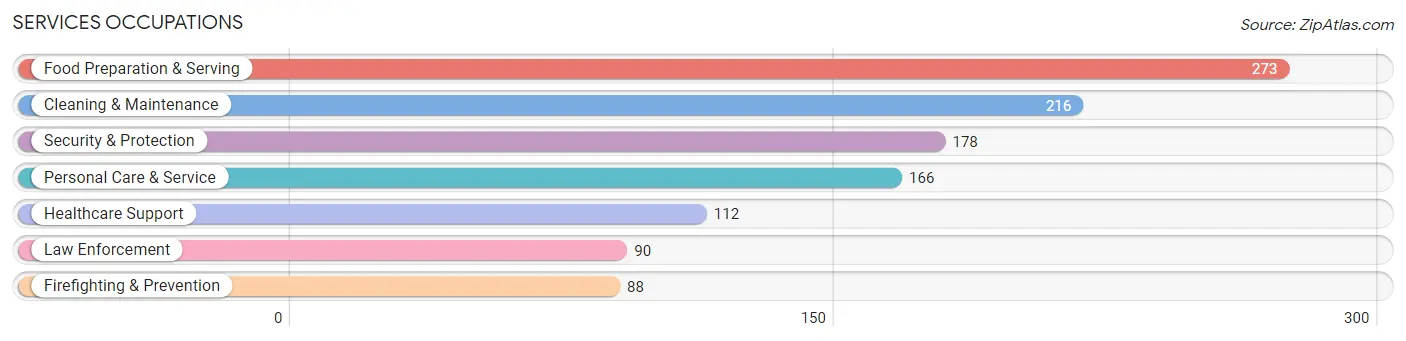
Services Occupations
The most common Services occupations in Amelia County are Food Preparation & Serving (273 | 4.3%), Cleaning & Maintenance (216 | 3.4%), Security & Protection (178 | 2.8%), Personal Care & Service (166 | 2.6%), and Healthcare Support (112 | 1.8%).
Services Occupations by Sex
Within the Services occupations in Amelia County, the most male-oriented occupations are Firefighting & Prevention (100.0%), Security & Protection (88.2%), and Law Enforcement (76.7%), while the most female-oriented occupations are Healthcare Support (100.0%), Personal Care & Service (100.0%), and Cleaning & Maintenance (56.5%).
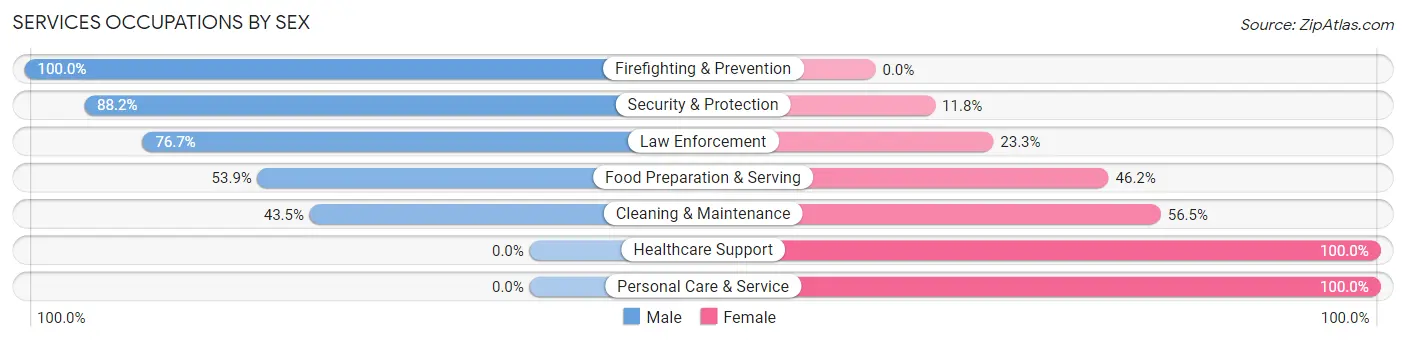
| Occupation | Male | Female |
| Healthcare Support | 0 (0.0%) | 112 (100.0%) |
| Security & Protection | 157 (88.2%) | 21 (11.8%) |
| Firefighting & Prevention | 88 (100.0%) | 0 (0.0%) |
| Law Enforcement | 69 (76.7%) | 21 (23.3%) |
| Food Preparation & Serving | 147 (53.8%) | 126 (46.2%) |
| Cleaning & Maintenance | 94 (43.5%) | 122 (56.5%) |
| Personal Care & Service | 0 (0.0%) | 166 (100.0%) |
| Total (Category) | 398 (42.1%) | 547 (57.9%) |
| Total (Overall) | 3,481 (54.9%) | 2,859 (45.1%) |
Sales and Office Occupations
The most common Sales and Office occupations in Amelia County are Office & Administration (601 | 9.5%), and Sales & Related (542 | 8.6%).

Sales and Office Occupations by Sex

| Occupation | Male | Female |
| Sales & Related | 302 (55.7%) | 240 (44.3%) |
| Office & Administration | 56 (9.3%) | 545 (90.7%) |
| Total (Category) | 358 (31.3%) | 785 (68.7%) |
| Total (Overall) | 3,481 (54.9%) | 2,859 (45.1%) |
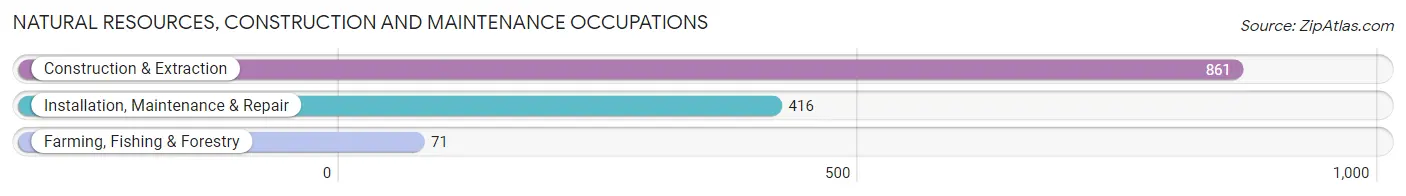
Natural Resources, Construction and Maintenance Occupations
The most common Natural Resources, Construction and Maintenance occupations in Amelia County are Construction & Extraction (861 | 13.6%), Installation, Maintenance & Repair (416 | 6.6%), and Farming, Fishing & Forestry (71 | 1.1%).
Natural Resources, Construction and Maintenance Occupations by Sex

| Occupation | Male | Female |
| Farming, Fishing & Forestry | 71 (100.0%) | 0 (0.0%) |
| Construction & Extraction | 853 (99.1%) | 8 (0.9%) |
| Installation, Maintenance & Repair | 346 (83.2%) | 70 (16.8%) |
| Total (Category) | 1,270 (94.2%) | 78 (5.8%) |
| Total (Overall) | 3,481 (54.9%) | 2,859 (45.1%) |
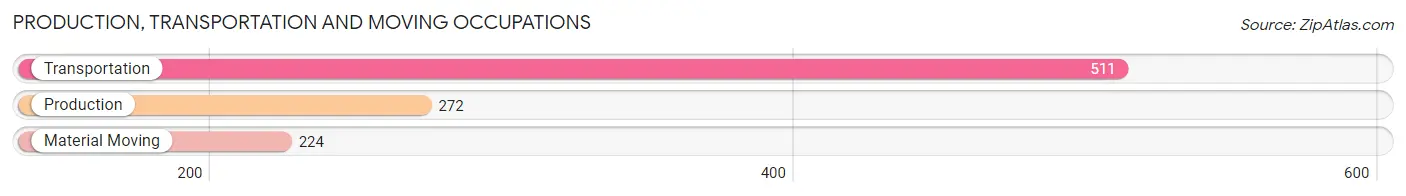
Production, Transportation and Moving Occupations
The most common Production, Transportation and Moving occupations in Amelia County are Transportation (511 | 8.1%), Production (272 | 4.3%), and Material Moving (224 | 3.5%).
Production, Transportation and Moving Occupations by Sex
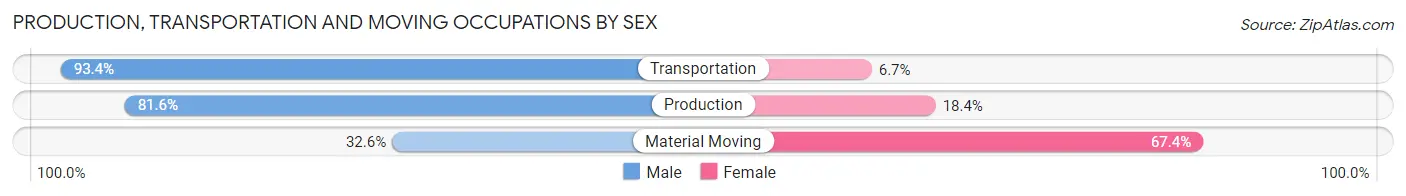
| Occupation | Male | Female |
| Production | 222 (81.6%) | 50 (18.4%) |
| Transportation | 477 (93.3%) | 34 (6.7%) |
| Material Moving | 73 (32.6%) | 151 (67.4%) |
| Total (Category) | 772 (76.7%) | 235 (23.3%) |
| Total (Overall) | 3,481 (54.9%) | 2,859 (45.1%) |
Employment Industries by Sex in Amelia County
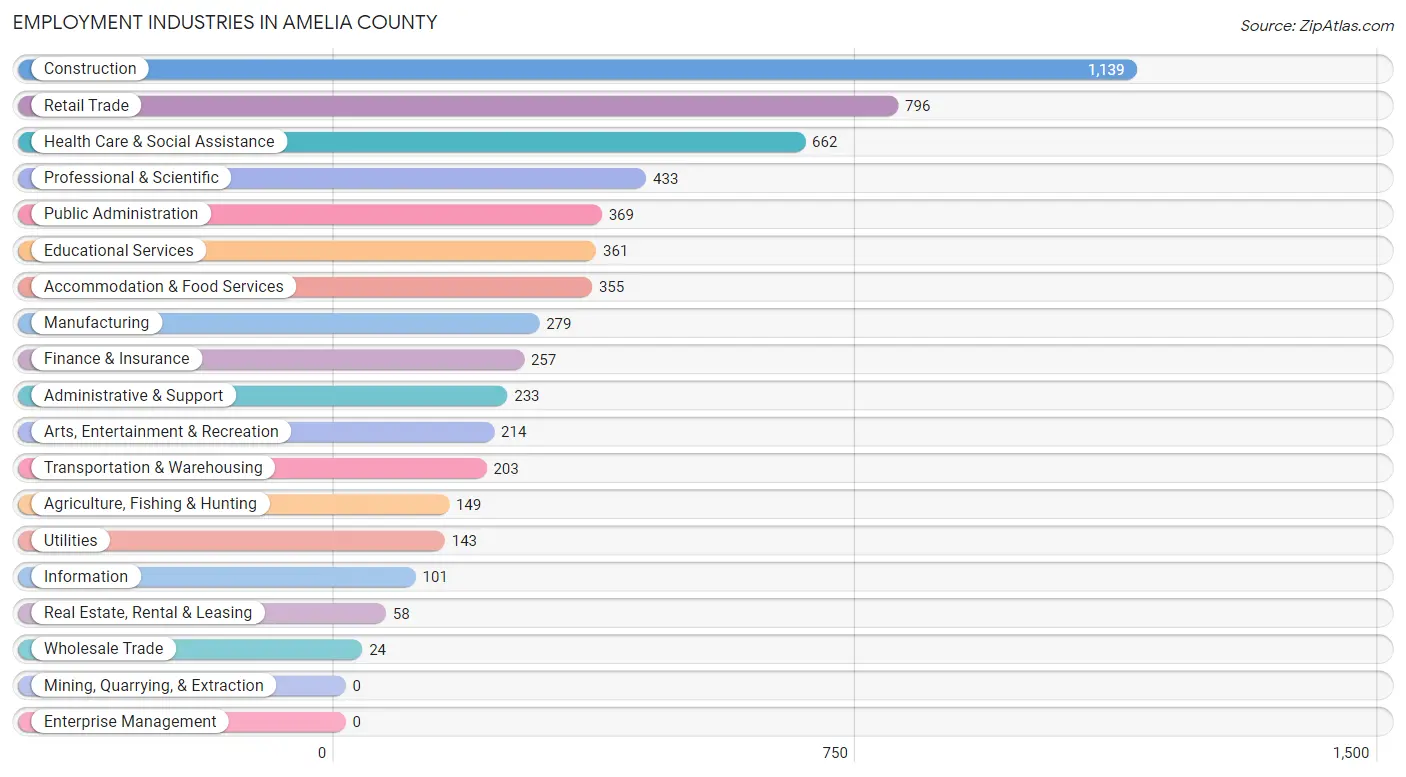
Employment Industries in Amelia County
The major employment industries in Amelia County include Construction (1,139 | 18.0%), Retail Trade (796 | 12.6%), Health Care & Social Assistance (662 | 10.4%), Professional & Scientific (433 | 6.8%), and Public Administration (369 | 5.8%).
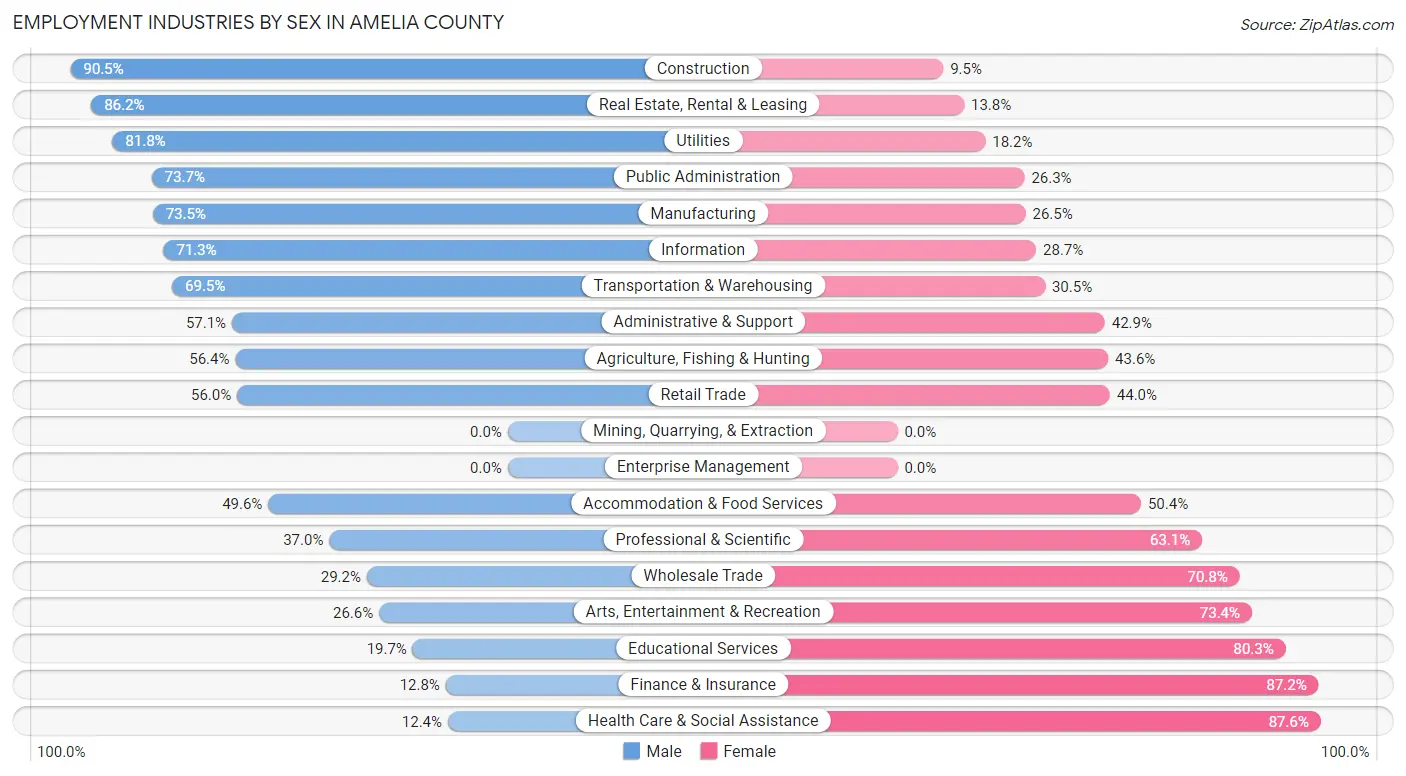
Employment Industries by Sex in Amelia County
The Amelia County industries that see more men than women are Construction (90.5%), Real Estate, Rental & Leasing (86.2%), and Utilities (81.8%), whereas the industries that tend to have a higher number of women are Health Care & Social Assistance (87.6%), Finance & Insurance (87.2%), and Educational Services (80.3%).
| Industry | Male | Female |
| Agriculture, Fishing & Hunting | 84 (56.4%) | 65 (43.6%) |
| Mining, Quarrying, & Extraction | 0 (0.0%) | 0 (0.0%) |
| Construction | 1,031 (90.5%) | 108 (9.5%) |
| Manufacturing | 205 (73.5%) | 74 (26.5%) |
| Wholesale Trade | 7 (29.2%) | 17 (70.8%) |
| Retail Trade | 446 (56.0%) | 350 (44.0%) |
| Transportation & Warehousing | 141 (69.5%) | 62 (30.5%) |
| Utilities | 117 (81.8%) | 26 (18.2%) |
| Information | 72 (71.3%) | 29 (28.7%) |
| Finance & Insurance | 33 (12.8%) | 224 (87.2%) |
| Real Estate, Rental & Leasing | 50 (86.2%) | 8 (13.8%) |
| Professional & Scientific | 160 (36.9%) | 273 (63.0%) |
| Enterprise Management | 0 (0.0%) | 0 (0.0%) |
| Administrative & Support | 133 (57.1%) | 100 (42.9%) |
| Educational Services | 71 (19.7%) | 290 (80.3%) |
| Health Care & Social Assistance | 82 (12.4%) | 580 (87.6%) |
| Arts, Entertainment & Recreation | 57 (26.6%) | 157 (73.4%) |
| Accommodation & Food Services | 176 (49.6%) | 179 (50.4%) |
| Public Administration | 272 (73.7%) | 97 (26.3%) |
| Total | 3,481 (54.9%) | 2,859 (45.1%) |
Education in Amelia County
School Enrollment in Amelia County
The most common levels of schooling among the 2,628 students in Amelia County are middle school (800 | 30.4%), high school (778 | 29.6%), and elementary school (357 | 13.6%).
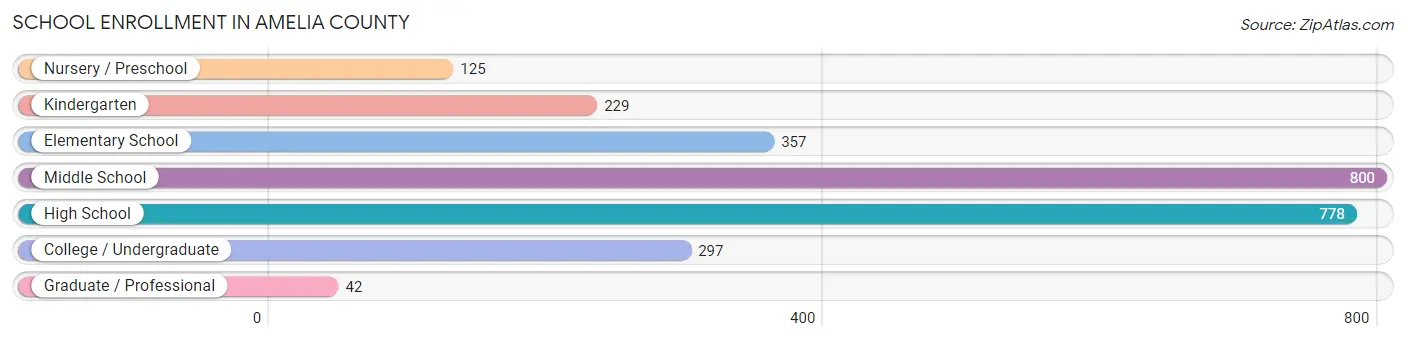
| School Level | # Students | % Students |
| Nursery / Preschool | 125 | 4.8% |
| Kindergarten | 229 | 8.7% |
| Elementary School | 357 | 13.6% |
| Middle School | 800 | 30.4% |
| High School | 778 | 29.6% |
| College / Undergraduate | 297 | 11.3% |
| Graduate / Professional | 42 | 1.6% |
| Total | 2,628 | 100.0% |
School Enrollment by Age by Funding Source in Amelia County
Out of a total of 2,628 students who are enrolled in schools in Amelia County, 423 (16.1%) attend a private institution, while the remaining 2,205 (83.9%) are enrolled in public schools. The age group of 25 to 34 year olds has the highest likelihood of being enrolled in private schools, with 47 (70.2% in the age bracket) enrolled. Conversely, the age group of 18 to 19 year olds has the lowest likelihood of being enrolled in a private school, with 259 (100.0% in the age bracket) attending a public institution.
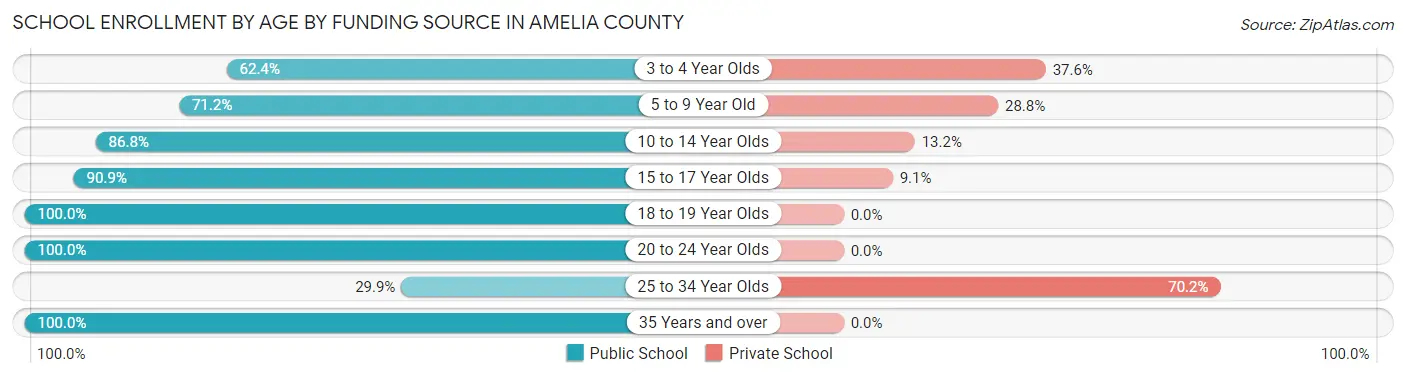
| Age Bracket | Public School | Private School |
| 3 to 4 Year Olds | 58 (62.4%) | 35 (37.6%) |
| 5 to 9 Year Old | 426 (71.2%) | 172 (28.8%) |
| 10 to 14 Year Olds | 806 (86.8%) | 123 (13.2%) |
| 15 to 17 Year Olds | 448 (90.9%) | 45 (9.1%) |
| 18 to 19 Year Olds | 259 (100.0%) | 0 (0.0%) |
| 20 to 24 Year Olds | 147 (100.0%) | 0 (0.0%) |
| 25 to 34 Year Olds | 20 (29.8%) | 47 (70.2%) |
| 35 Years and over | 42 (100.0%) | 0 (0.0%) |
| Total | 2,205 (83.9%) | 423 (16.1%) |
Educational Attainment by Field of Study in Amelia County
Business (385 | 20.6%), arts & humanities (225 | 12.0%), education (168 | 9.0%), science & technology (160 | 8.6%), and liberal arts & history (146 | 7.8%) are the most common fields of study among 1,870 individuals in Amelia County who have obtained a bachelor's degree or higher.
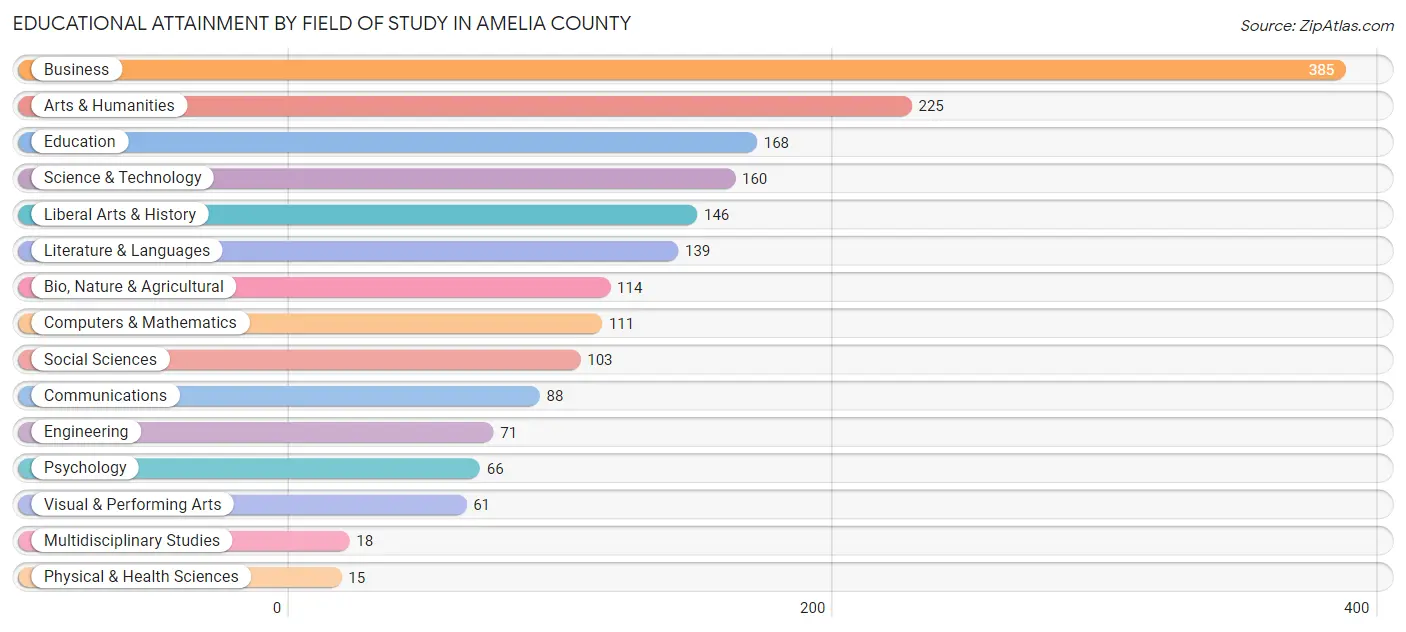
| Field of Study | # Graduates | % Graduates |
| Computers & Mathematics | 111 | 5.9% |
| Bio, Nature & Agricultural | 114 | 6.1% |
| Physical & Health Sciences | 15 | 0.8% |
| Psychology | 66 | 3.5% |
| Social Sciences | 103 | 5.5% |
| Engineering | 71 | 3.8% |
| Multidisciplinary Studies | 18 | 1.0% |
| Science & Technology | 160 | 8.6% |
| Business | 385 | 20.6% |
| Education | 168 | 9.0% |
| Literature & Languages | 139 | 7.4% |
| Liberal Arts & History | 146 | 7.8% |
| Visual & Performing Arts | 61 | 3.3% |
| Communications | 88 | 4.7% |
| Arts & Humanities | 225 | 12.0% |
| Total | 1,870 | 100.0% |
Transportation & Commute in Amelia County
Vehicle Availability by Sex in Amelia County
The most prevalent vehicle ownership categories in Amelia County are males with 2 vehicles (1,191, accounting for 36.5%) and females with 2 vehicles (778, making up 42.3%).
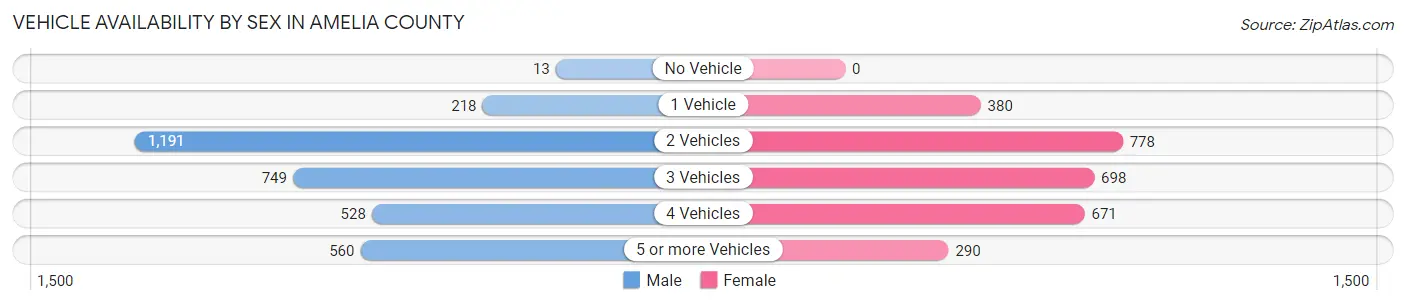
| Vehicles Available | Male | Female |
| No Vehicle | 13 (0.4%) | 0 (0.0%) |
| 1 Vehicle | 218 (6.7%) | 380 (13.5%) |
| 2 Vehicles | 1,191 (36.5%) | 778 (27.6%) |
| 3 Vehicles | 749 (23.0%) | 698 (24.8%) |
| 4 Vehicles | 528 (16.2%) | 671 (23.8%) |
| 5 or more Vehicles | 560 (17.2%) | 290 (10.3%) |
| Total | 3,259 (100.0%) | 2,817 (100.0%) |
Commute Time in Amelia County
The most frequently occuring commute durations in Amelia County are 45 to 59 minutes (1,498 commuters, 27.1%), 30 to 34 minutes (775 commuters, 14.0%), and 60 to 89 minutes (710 commuters, 12.9%).
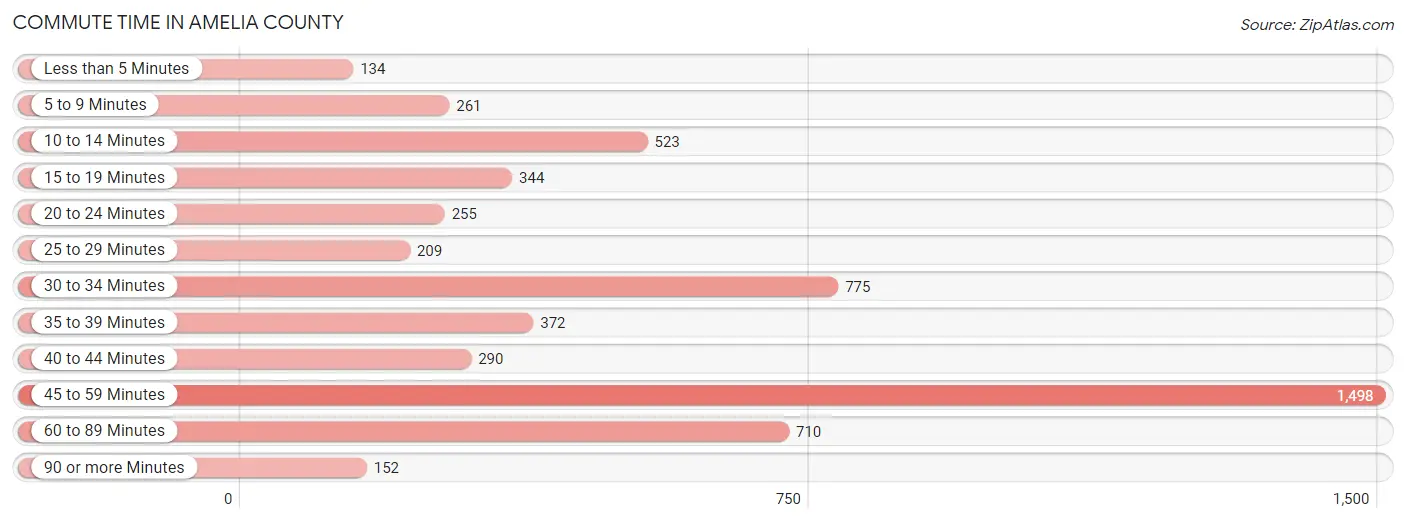
| Commute Time | # Commuters | % Commuters |
| Less than 5 Minutes | 134 | 2.4% |
| 5 to 9 Minutes | 261 | 4.7% |
| 10 to 14 Minutes | 523 | 9.5% |
| 15 to 19 Minutes | 344 | 6.2% |
| 20 to 24 Minutes | 255 | 4.6% |
| 25 to 29 Minutes | 209 | 3.8% |
| 30 to 34 Minutes | 775 | 14.0% |
| 35 to 39 Minutes | 372 | 6.7% |
| 40 to 44 Minutes | 290 | 5.2% |
| 45 to 59 Minutes | 1,498 | 27.1% |
| 60 to 89 Minutes | 710 | 12.9% |
| 90 or more Minutes | 152 | 2.8% |
Commute Time by Sex in Amelia County
The most common commute times in Amelia County are 45 to 59 minutes (741 commuters, 24.2%) for males and 45 to 59 minutes (757 commuters, 30.7%) for females.
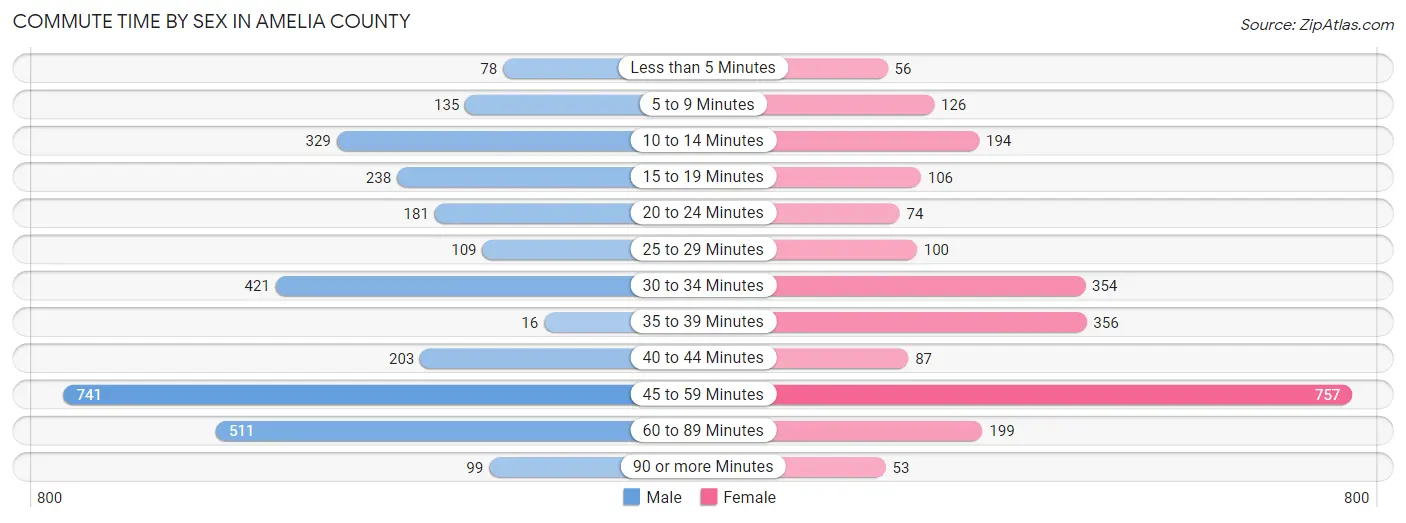
| Commute Time | Male | Female |
| Less than 5 Minutes | 78 (2.5%) | 56 (2.3%) |
| 5 to 9 Minutes | 135 (4.4%) | 126 (5.1%) |
| 10 to 14 Minutes | 329 (10.7%) | 194 (7.9%) |
| 15 to 19 Minutes | 238 (7.8%) | 106 (4.3%) |
| 20 to 24 Minutes | 181 (5.9%) | 74 (3.0%) |
| 25 to 29 Minutes | 109 (3.6%) | 100 (4.1%) |
| 30 to 34 Minutes | 421 (13.8%) | 354 (14.4%) |
| 35 to 39 Minutes | 16 (0.5%) | 356 (14.5%) |
| 40 to 44 Minutes | 203 (6.6%) | 87 (3.5%) |
| 45 to 59 Minutes | 741 (24.2%) | 757 (30.7%) |
| 60 to 89 Minutes | 511 (16.7%) | 199 (8.1%) |
| 90 or more Minutes | 99 (3.2%) | 53 (2.1%) |
Time of Departure to Work by Sex in Amelia County
The most frequent times of departure to work in Amelia County are 5:30 AM to 5:59 AM (562, 18.4%) for males and 7:00 AM to 7:29 AM (444, 18.0%) for females.
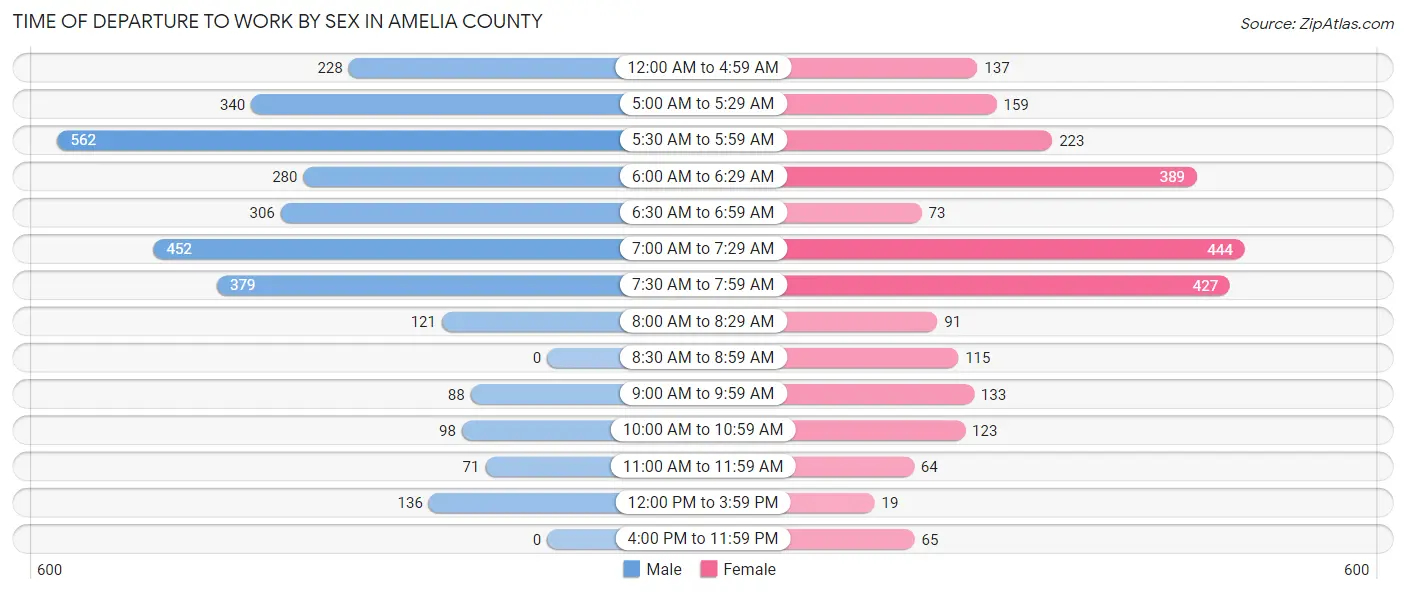
| Time of Departure | Male | Female |
| 12:00 AM to 4:59 AM | 228 (7.4%) | 137 (5.6%) |
| 5:00 AM to 5:29 AM | 340 (11.1%) | 159 (6.5%) |
| 5:30 AM to 5:59 AM | 562 (18.4%) | 223 (9.1%) |
| 6:00 AM to 6:29 AM | 280 (9.1%) | 389 (15.8%) |
| 6:30 AM to 6:59 AM | 306 (10.0%) | 73 (3.0%) |
| 7:00 AM to 7:29 AM | 452 (14.8%) | 444 (18.0%) |
| 7:30 AM to 7:59 AM | 379 (12.4%) | 427 (17.3%) |
| 8:00 AM to 8:29 AM | 121 (4.0%) | 91 (3.7%) |
| 8:30 AM to 8:59 AM | 0 (0.0%) | 115 (4.7%) |
| 9:00 AM to 9:59 AM | 88 (2.9%) | 133 (5.4%) |
| 10:00 AM to 10:59 AM | 98 (3.2%) | 123 (5.0%) |
| 11:00 AM to 11:59 AM | 71 (2.3%) | 64 (2.6%) |
| 12:00 PM to 3:59 PM | 136 (4.4%) | 19 (0.8%) |
| 4:00 PM to 11:59 PM | 0 (0.0%) | 65 (2.6%) |
| Total | 3,061 (100.0%) | 2,462 (100.0%) |
Housing Occupancy in Amelia County
Occupancy by Ownership in Amelia County
Of the total 5,258 dwellings in Amelia County, owner-occupied units account for 4,438 (84.4%), while renter-occupied units make up 820 (15.6%).
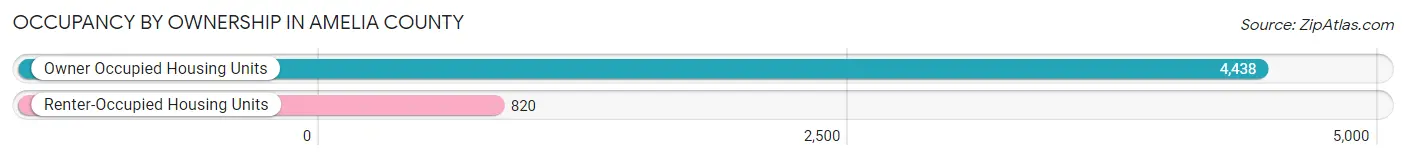
| Occupancy | # Housing Units | % Housing Units |
| Owner Occupied Housing Units | 4,438 | 84.4% |
| Renter-Occupied Housing Units | 820 | 15.6% |
| Total Occupied Housing Units | 5,258 | 100.0% |
Occupancy by Household Size in Amelia County
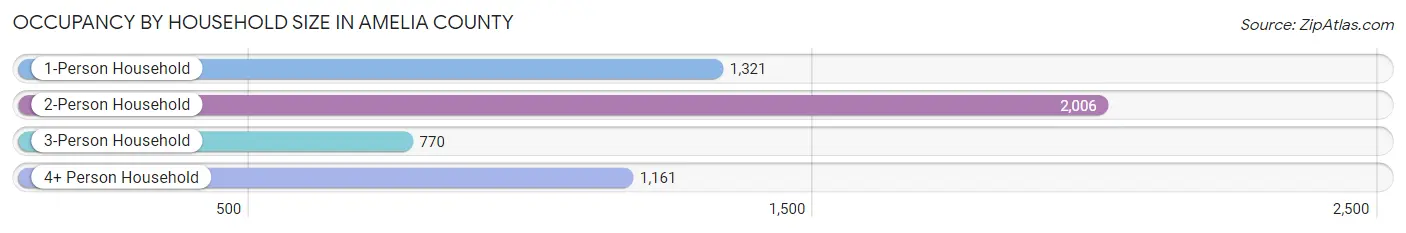
| Household Size | # Housing Units | % Housing Units |
| 1-Person Household | 1,321 | 25.1% |
| 2-Person Household | 2,006 | 38.2% |
| 3-Person Household | 770 | 14.6% |
| 4+ Person Household | 1,161 | 22.1% |
| Total Housing Units | 5,258 | 100.0% |
Occupancy by Ownership by Household Size in Amelia County
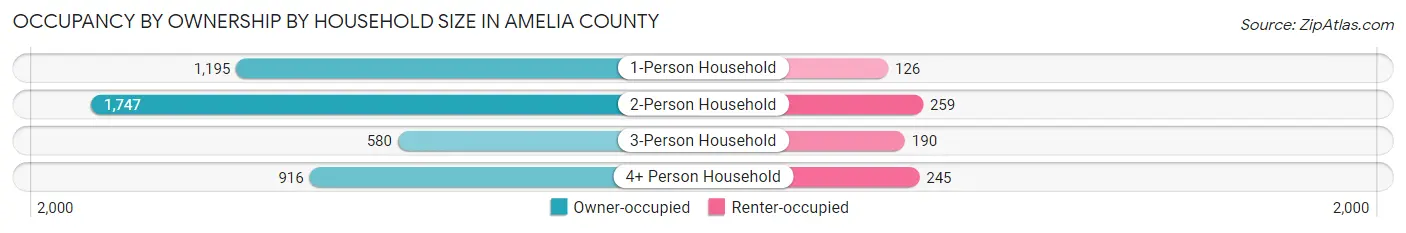
| Household Size | Owner-occupied | Renter-occupied |
| 1-Person Household | 1,195 (90.5%) | 126 (9.5%) |
| 2-Person Household | 1,747 (87.1%) | 259 (12.9%) |
| 3-Person Household | 580 (75.3%) | 190 (24.7%) |
| 4+ Person Household | 916 (78.9%) | 245 (21.1%) |
| Total Housing Units | 4,438 (84.4%) | 820 (15.6%) |
Occupancy by Educational Attainment in Amelia County
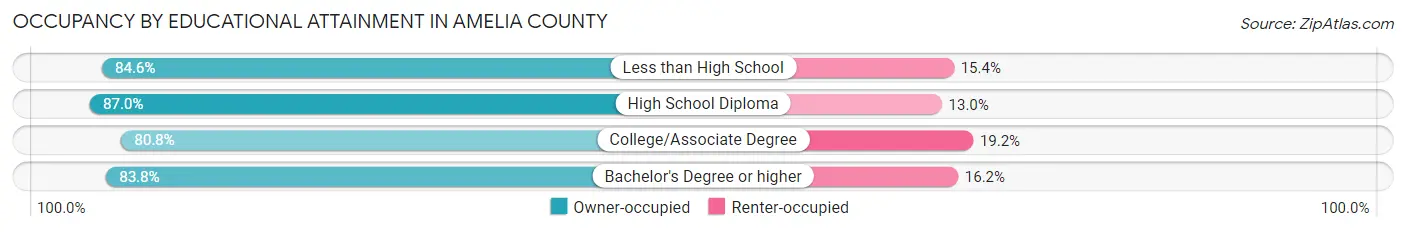
| Household Size | Owner-occupied | Renter-occupied |
| Less than High School | 572 (84.6%) | 104 (15.4%) |
| High School Diploma | 1,825 (87.0%) | 272 (13.0%) |
| College/Associate Degree | 1,120 (80.8%) | 266 (19.2%) |
| Bachelor's Degree or higher | 921 (83.8%) | 178 (16.2%) |
Occupancy by Age of Householder in Amelia County
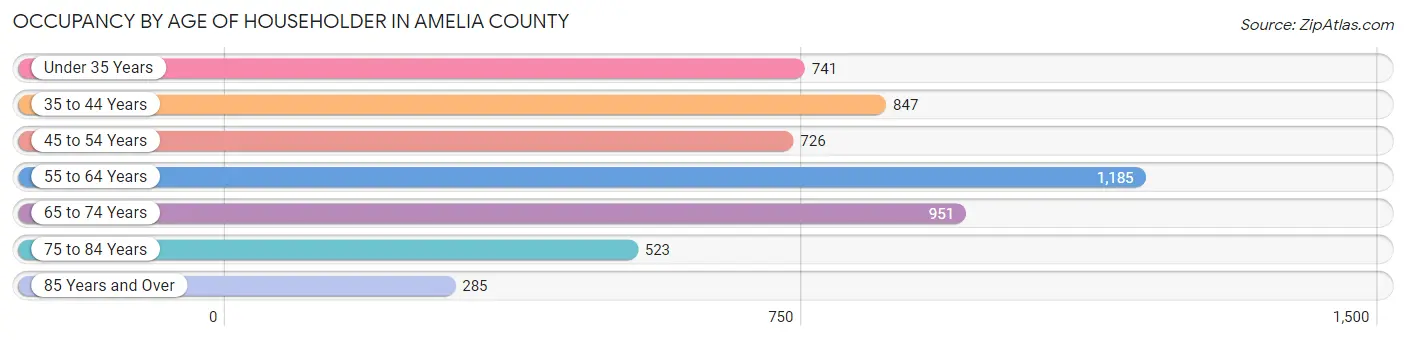
| Age Bracket | # Households | % Households |
| Under 35 Years | 741 | 14.1% |
| 35 to 44 Years | 847 | 16.1% |
| 45 to 54 Years | 726 | 13.8% |
| 55 to 64 Years | 1,185 | 22.5% |
| 65 to 74 Years | 951 | 18.1% |
| 75 to 84 Years | 523 | 10.0% |
| 85 Years and Over | 285 | 5.4% |
| Total | 5,258 | 100.0% |
Housing Finances in Amelia County
Median Income by Occupancy in Amelia County
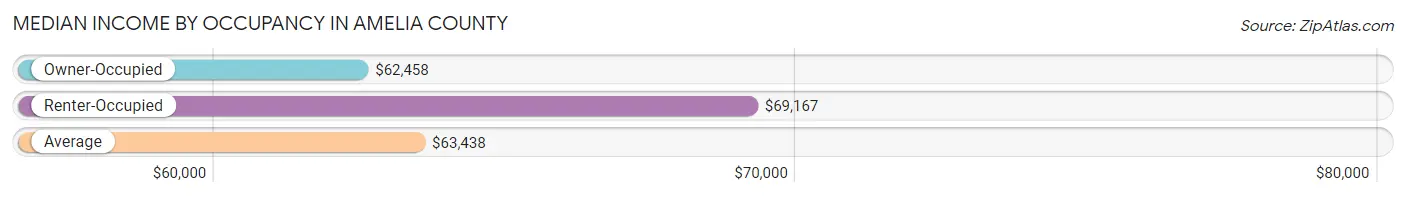
| Occupancy Type | # Households | Median Income |
| Owner-Occupied | 4,438 (84.4%) | $62,458 |
| Renter-Occupied | 820 (15.6%) | $69,167 |
| Average | 5,258 (100.0%) | $63,438 |
Occupancy by Householder Income Bracket in Amelia County
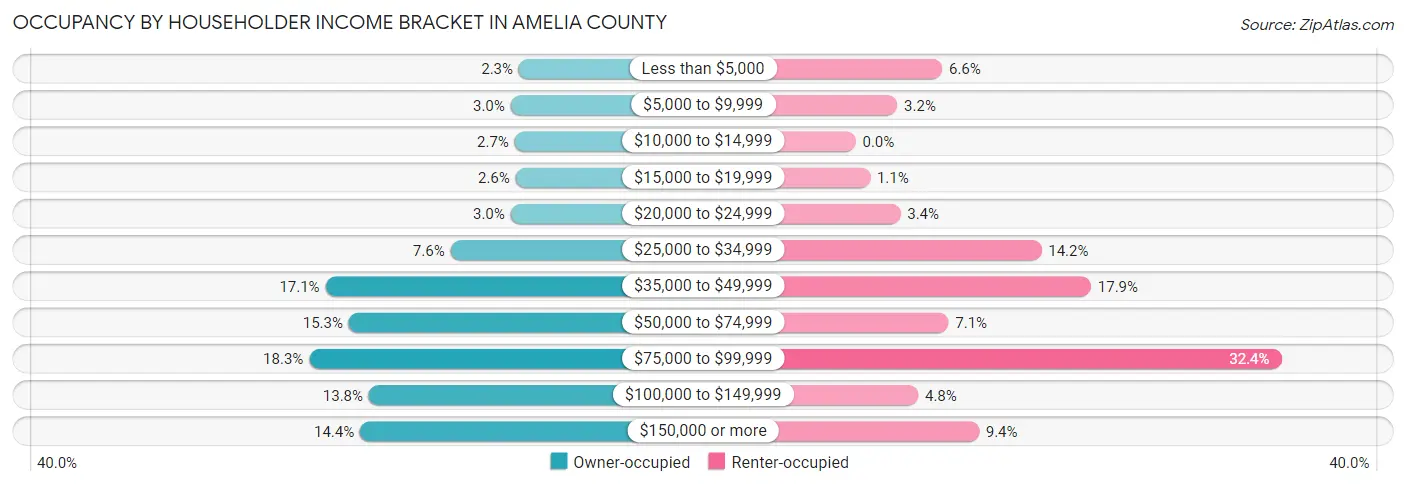
| Income Bracket | Owner-occupied | Renter-occupied |
| Less than $5,000 | 104 (2.3%) | 54 (6.6%) |
| $5,000 to $9,999 | 132 (3.0%) | 26 (3.2%) |
| $10,000 to $14,999 | 118 (2.7%) | 0 (0.0%) |
| $15,000 to $19,999 | 115 (2.6%) | 9 (1.1%) |
| $20,000 to $24,999 | 132 (3.0%) | 28 (3.4%) |
| $25,000 to $34,999 | 335 (7.5%) | 116 (14.1%) |
| $35,000 to $49,999 | 758 (17.1%) | 147 (17.9%) |
| $50,000 to $74,999 | 679 (15.3%) | 58 (7.1%) |
| $75,000 to $99,999 | 813 (18.3%) | 266 (32.4%) |
| $100,000 to $149,999 | 611 (13.8%) | 39 (4.8%) |
| $150,000 or more | 641 (14.4%) | 77 (9.4%) |
| Total | 4,438 (100.0%) | 820 (100.0%) |
Monthly Housing Cost Tiers in Amelia County
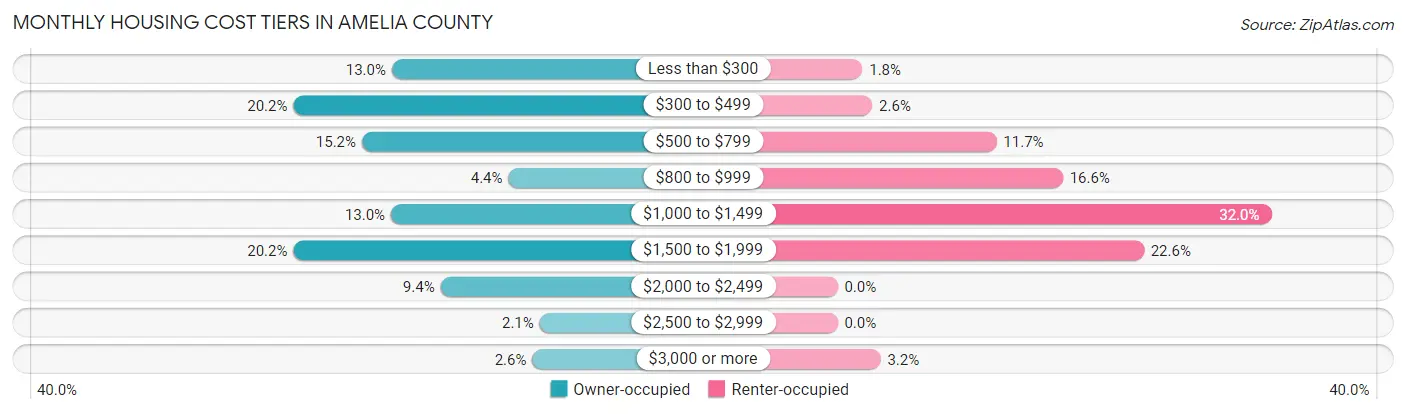
| Monthly Cost | Owner-occupied | Renter-occupied |
| Less than $300 | 575 (13.0%) | 15 (1.8%) |
| $300 to $499 | 897 (20.2%) | 21 (2.6%) |
| $500 to $799 | 673 (15.2%) | 96 (11.7%) |
| $800 to $999 | 194 (4.4%) | 136 (16.6%) |
| $1,000 to $1,499 | 578 (13.0%) | 262 (32.0%) |
| $1,500 to $1,999 | 897 (20.2%) | 185 (22.6%) |
| $2,000 to $2,499 | 416 (9.4%) | 0 (0.0%) |
| $2,500 to $2,999 | 92 (2.1%) | 0 (0.0%) |
| $3,000 or more | 116 (2.6%) | 26 (3.2%) |
| Total | 4,438 (100.0%) | 820 (100.0%) |
Physical Housing Characteristics in Amelia County
Housing Structures in Amelia County
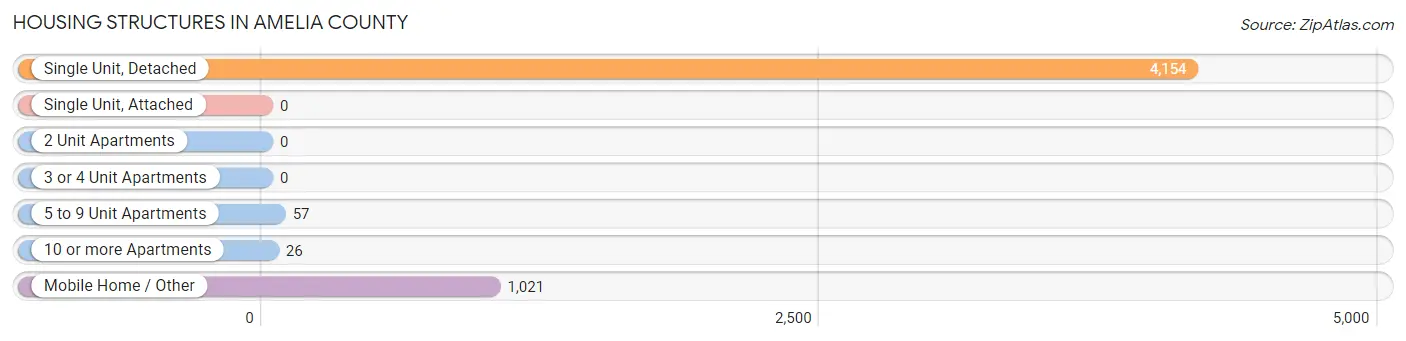
| Structure Type | # Housing Units | % Housing Units |
| Single Unit, Detached | 4,154 | 79.0% |
| Single Unit, Attached | 0 | 0.0% |
| 2 Unit Apartments | 0 | 0.0% |
| 3 or 4 Unit Apartments | 0 | 0.0% |
| 5 to 9 Unit Apartments | 57 | 1.1% |
| 10 or more Apartments | 26 | 0.5% |
| Mobile Home / Other | 1,021 | 19.4% |
| Total | 5,258 | 100.0% |
Housing Structures by Occupancy in Amelia County
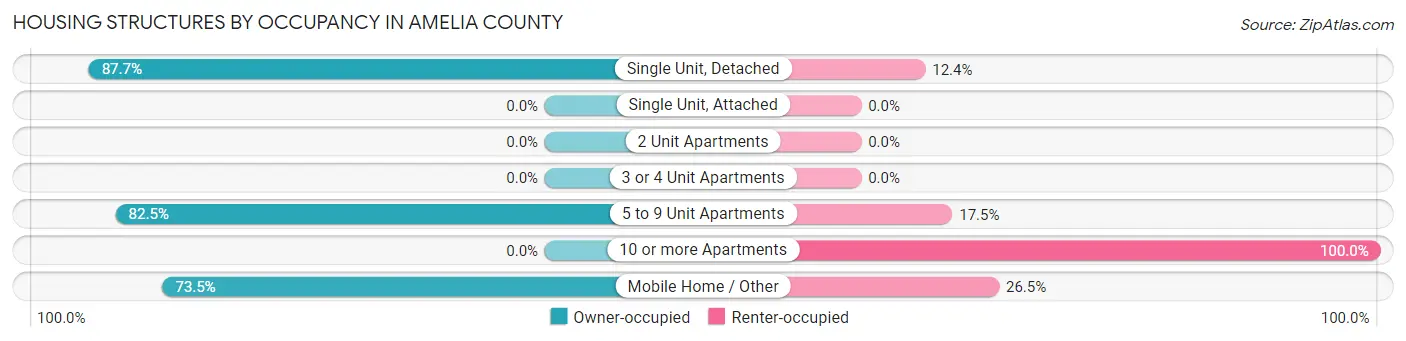
| Structure Type | Owner-occupied | Renter-occupied |
| Single Unit, Detached | 3,641 (87.6%) | 513 (12.3%) |
| Single Unit, Attached | 0 (0.0%) | 0 (0.0%) |
| 2 Unit Apartments | 0 (0.0%) | 0 (0.0%) |
| 3 or 4 Unit Apartments | 0 (0.0%) | 0 (0.0%) |
| 5 to 9 Unit Apartments | 47 (82.5%) | 10 (17.5%) |
| 10 or more Apartments | 0 (0.0%) | 26 (100.0%) |
| Mobile Home / Other | 750 (73.5%) | 271 (26.5%) |
| Total | 4,438 (84.4%) | 820 (15.6%) |
Housing Structures by Number of Rooms in Amelia County
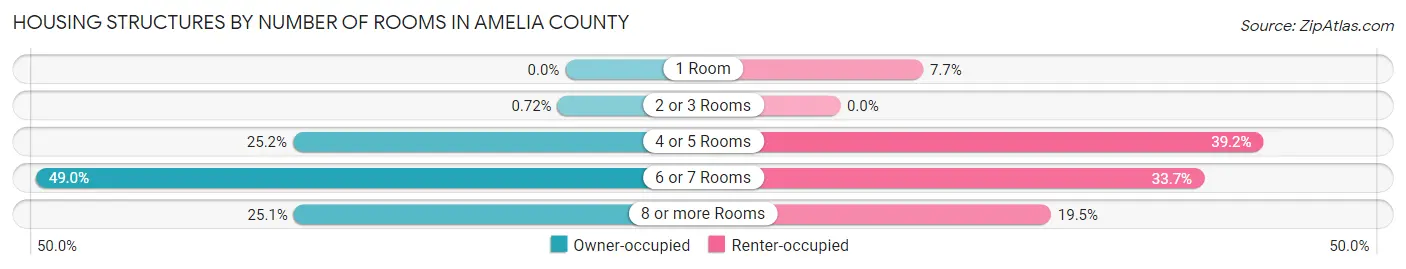
| Number of Rooms | Owner-occupied | Renter-occupied |
| 1 Room | 0 (0.0%) | 63 (7.7%) |
| 2 or 3 Rooms | 32 (0.7%) | 0 (0.0%) |
| 4 or 5 Rooms | 1,118 (25.2%) | 321 (39.2%) |
| 6 or 7 Rooms | 2,173 (49.0%) | 276 (33.7%) |
| 8 or more Rooms | 1,115 (25.1%) | 160 (19.5%) |
| Total | 4,438 (100.0%) | 820 (100.0%) |
Housing Structure by Heating Type in Amelia County
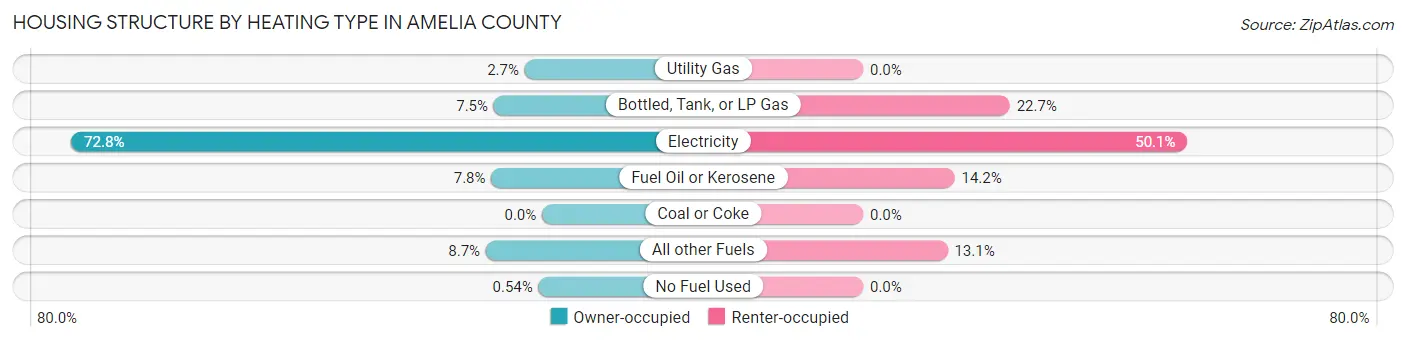
| Heating Type | Owner-occupied | Renter-occupied |
| Utility Gas | 119 (2.7%) | 0 (0.0%) |
| Bottled, Tank, or LP Gas | 331 (7.5%) | 186 (22.7%) |
| Electricity | 3,231 (72.8%) | 411 (50.1%) |
| Fuel Oil or Kerosene | 348 (7.8%) | 116 (14.1%) |
| Coal or Coke | 0 (0.0%) | 0 (0.0%) |
| All other Fuels | 385 (8.7%) | 107 (13.1%) |
| No Fuel Used | 24 (0.5%) | 0 (0.0%) |
| Total | 4,438 (100.0%) | 820 (100.0%) |
Household Vehicle Usage in Amelia County
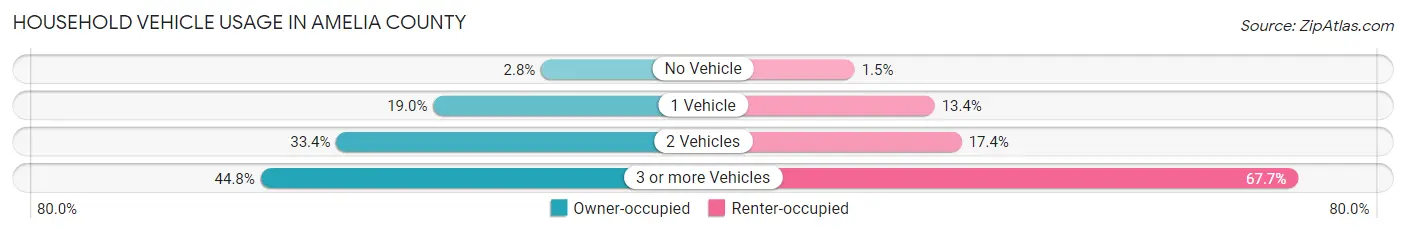
| Vehicles per Household | Owner-occupied | Renter-occupied |
| No Vehicle | 126 (2.8%) | 12 (1.5%) |
| 1 Vehicle | 842 (19.0%) | 110 (13.4%) |
| 2 Vehicles | 1,484 (33.4%) | 143 (17.4%) |
| 3 or more Vehicles | 1,986 (44.8%) | 555 (67.7%) |
| Total | 4,438 (100.0%) | 820 (100.0%) |
Real Estate & Mortgages in Amelia County
Real Estate and Mortgage Overview in Amelia County
| Characteristic | Without Mortgage | With Mortgage |
| Housing Units | 1,929 | 2,509 |
| Median Property Value | $215,100 | $244,200 |
| Median Household Income | $52,405 | $406 |
| Monthly Housing Costs | $373 | $116 |
| Real Estate Taxes | $754 | $83 |
Property Value by Mortgage Status in Amelia County
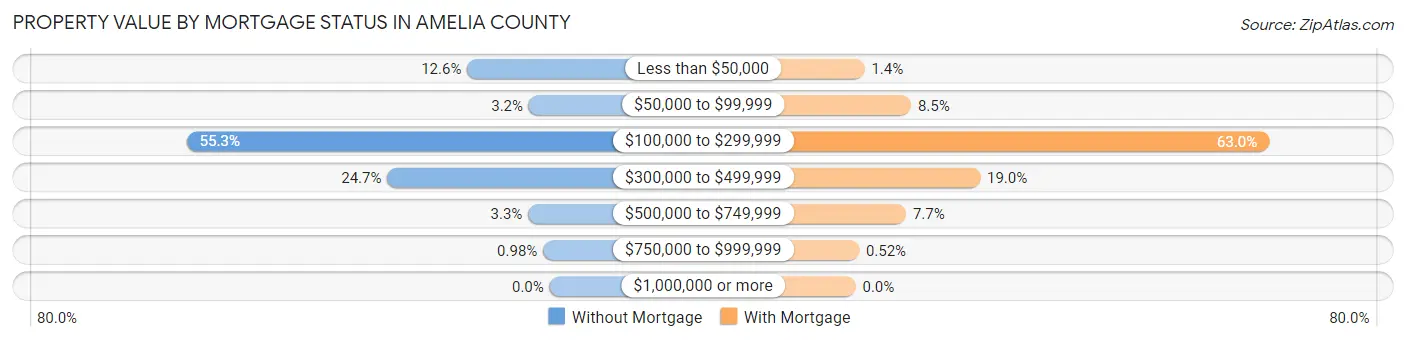
| Property Value | Without Mortgage | With Mortgage |
| Less than $50,000 | 242 (12.6%) | 34 (1.4%) |
| $50,000 to $99,999 | 61 (3.2%) | 212 (8.5%) |
| $100,000 to $299,999 | 1,067 (55.3%) | 1,581 (63.0%) |
| $300,000 to $499,999 | 477 (24.7%) | 476 (19.0%) |
| $500,000 to $749,999 | 63 (3.3%) | 193 (7.7%) |
| $750,000 to $999,999 | 19 (1.0%) | 13 (0.5%) |
| $1,000,000 or more | 0 (0.0%) | 0 (0.0%) |
| Total | 1,929 (100.0%) | 2,509 (100.0%) |
Household Income by Mortgage Status in Amelia County
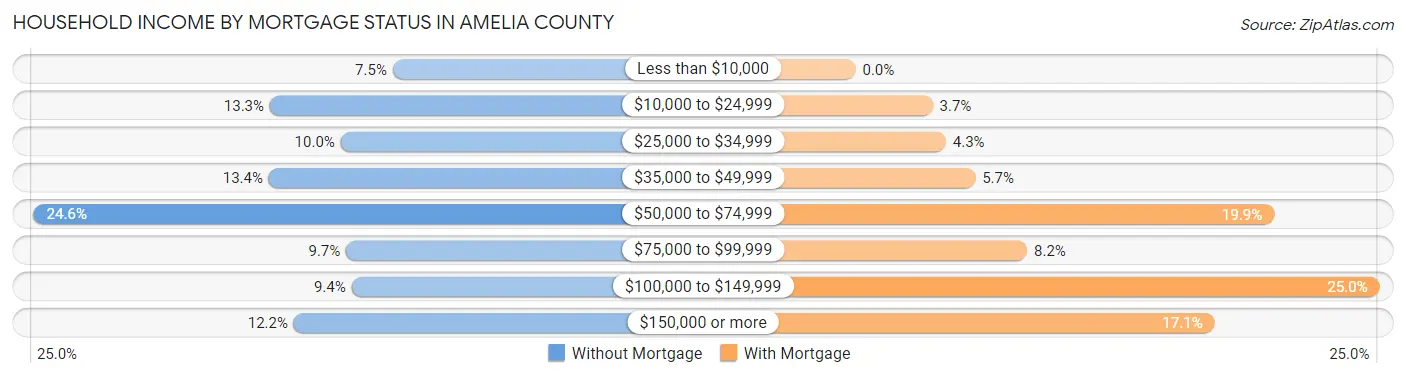
| Household Income | Without Mortgage | With Mortgage |
| Less than $10,000 | 144 (7.5%) | 0 (0.0%) |
| $10,000 to $24,999 | 257 (13.3%) | 92 (3.7%) |
| $25,000 to $34,999 | 192 (10.0%) | 108 (4.3%) |
| $35,000 to $49,999 | 258 (13.4%) | 143 (5.7%) |
| $50,000 to $74,999 | 474 (24.6%) | 500 (19.9%) |
| $75,000 to $99,999 | 187 (9.7%) | 205 (8.2%) |
| $100,000 to $149,999 | 182 (9.4%) | 626 (24.9%) |
| $150,000 or more | 235 (12.2%) | 429 (17.1%) |
| Total | 1,929 (100.0%) | 2,509 (100.0%) |
Property Value to Household Income Ratio in Amelia County
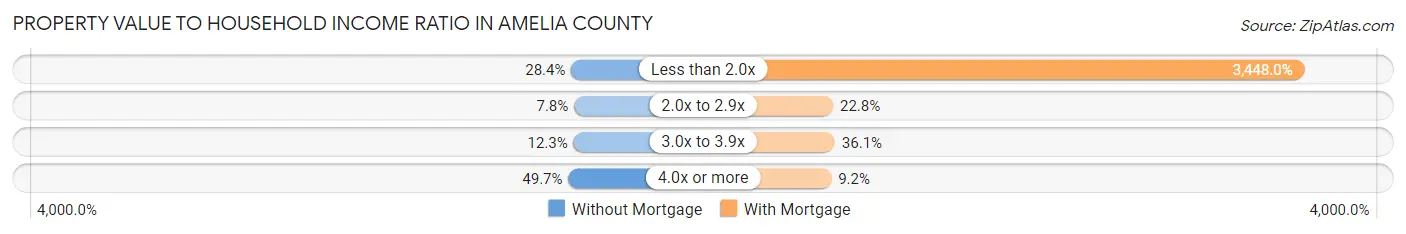
| Value-to-Income Ratio | Without Mortgage | With Mortgage |
| Less than 2.0x | 547 (28.4%) | 86,509 (3,448.0%) |
| 2.0x to 2.9x | 151 (7.8%) | 571 (22.8%) |
| 3.0x to 3.9x | 237 (12.3%) | 905 (36.1%) |
| 4.0x or more | 958 (49.7%) | 231 (9.2%) |
| Total | 1,929 (100.0%) | 2,509 (100.0%) |
Real Estate Taxes by Mortgage Status in Amelia County
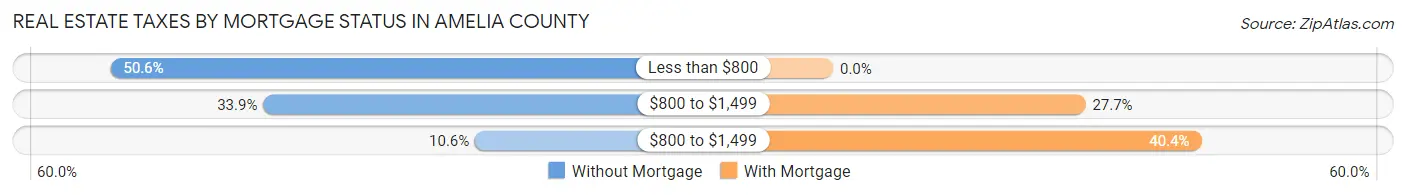
| Property Taxes | Without Mortgage | With Mortgage |
| Less than $800 | 976 (50.6%) | 0 (0.0%) |
| $800 to $1,499 | 653 (33.9%) | 694 (27.7%) |
| $800 to $1,499 | 205 (10.6%) | 1,013 (40.4%) |
| Total | 1,929 (100.0%) | 2,509 (100.0%) |
Health & Disability in Amelia County
Health Insurance Coverage by Age in Amelia County
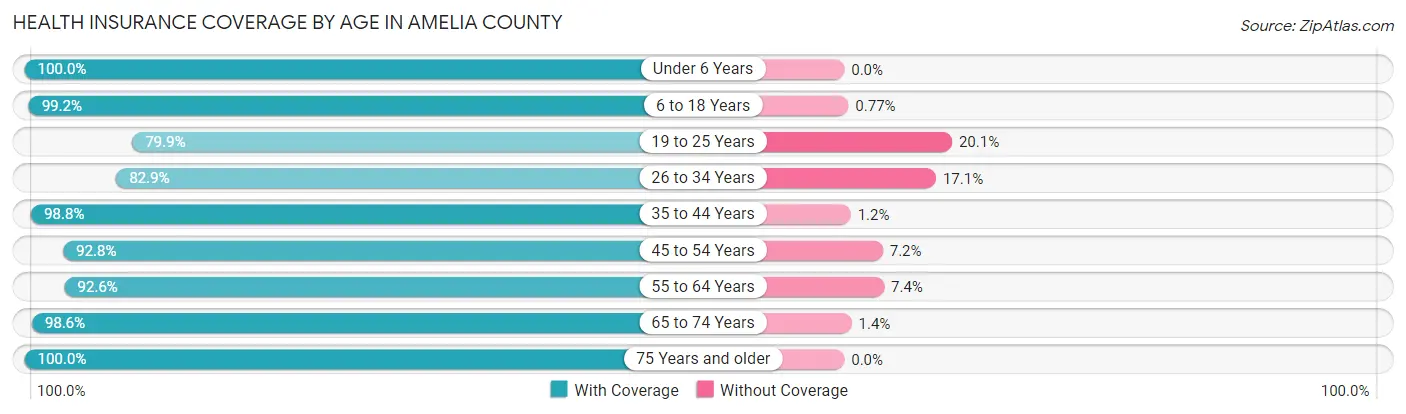
| Age Bracket | With Coverage | Without Coverage |
| Under 6 Years | 856 (100.0%) | 0 (0.0%) |
| 6 to 18 Years | 2,070 (99.2%) | 16 (0.8%) |
| 19 to 25 Years | 609 (79.9%) | 153 (20.1%) |
| 26 to 34 Years | 1,188 (82.9%) | 245 (17.1%) |
| 35 to 44 Years | 1,487 (98.8%) | 18 (1.2%) |
| 45 to 54 Years | 1,667 (92.8%) | 129 (7.2%) |
| 55 to 64 Years | 2,031 (92.6%) | 163 (7.4%) |
| 65 to 74 Years | 1,304 (98.6%) | 18 (1.4%) |
| 75 Years and older | 1,254 (100.0%) | 0 (0.0%) |
| Total | 12,466 (94.4%) | 742 (5.6%) |
Health Insurance Coverage by Citizenship Status in Amelia County
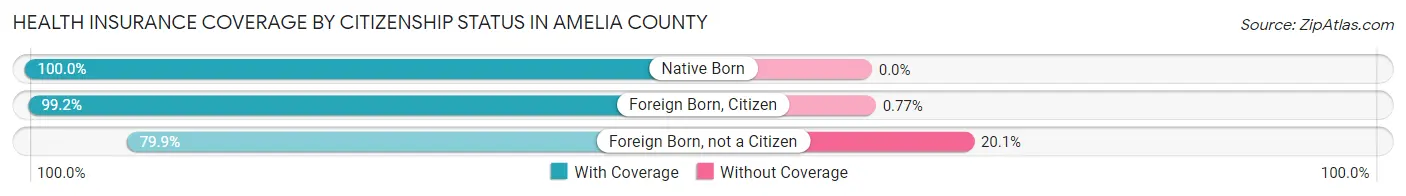
| Citizenship Status | With Coverage | Without Coverage |
| Native Born | 856 (100.0%) | 0 (0.0%) |
| Foreign Born, Citizen | 2,070 (99.2%) | 16 (0.8%) |
| Foreign Born, not a Citizen | 609 (79.9%) | 153 (20.1%) |
Health Insurance Coverage by Household Income in Amelia County
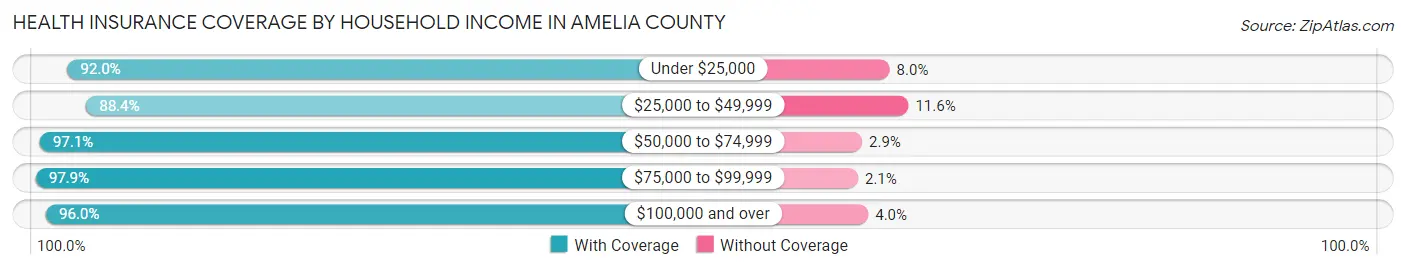
| Household Income | With Coverage | Without Coverage |
| Under $25,000 | 1,020 (92.0%) | 89 (8.0%) |
| $25,000 to $49,999 | 2,593 (88.4%) | 339 (11.6%) |
| $50,000 to $74,999 | 1,591 (97.1%) | 47 (2.9%) |
| $75,000 to $99,999 | 3,160 (97.9%) | 68 (2.1%) |
| $100,000 and over | 4,096 (96.0%) | 172 (4.0%) |
Public vs Private Health Insurance Coverage by Age in Amelia County
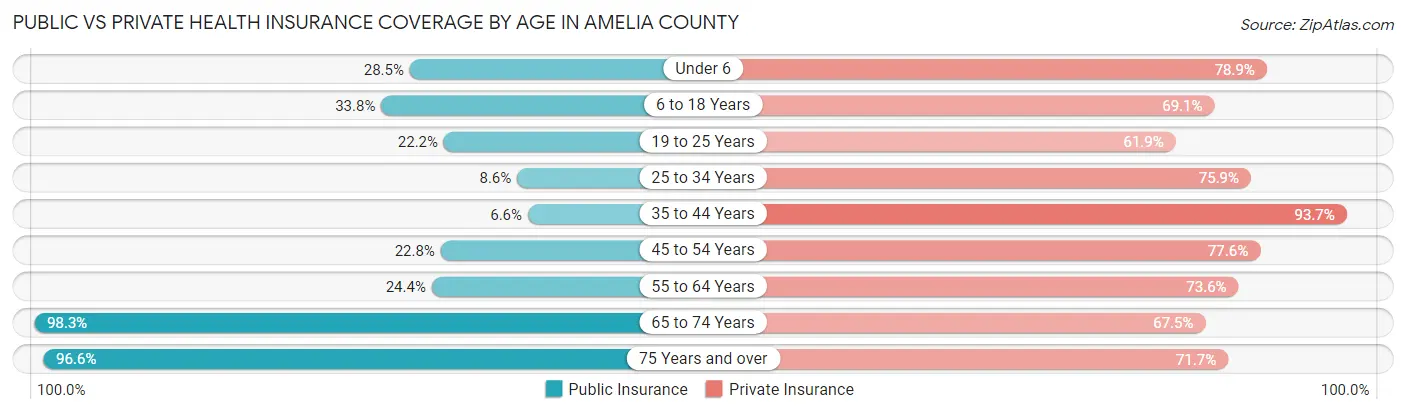
| Age Bracket | Public Insurance | Private Insurance |
| Under 6 | 244 (28.5%) | 675 (78.9%) |
| 6 to 18 Years | 705 (33.8%) | 1,442 (69.1%) |
| 19 to 25 Years | 169 (22.2%) | 472 (61.9%) |
| 25 to 34 Years | 123 (8.6%) | 1,088 (75.9%) |
| 35 to 44 Years | 99 (6.6%) | 1,410 (93.7%) |
| 45 to 54 Years | 409 (22.8%) | 1,394 (77.6%) |
| 55 to 64 Years | 536 (24.4%) | 1,615 (73.6%) |
| 65 to 74 Years | 1,299 (98.3%) | 892 (67.5%) |
| 75 Years and over | 1,211 (96.6%) | 899 (71.7%) |
| Total | 4,795 (36.3%) | 9,887 (74.9%) |
Disability Status by Sex by Age in Amelia County
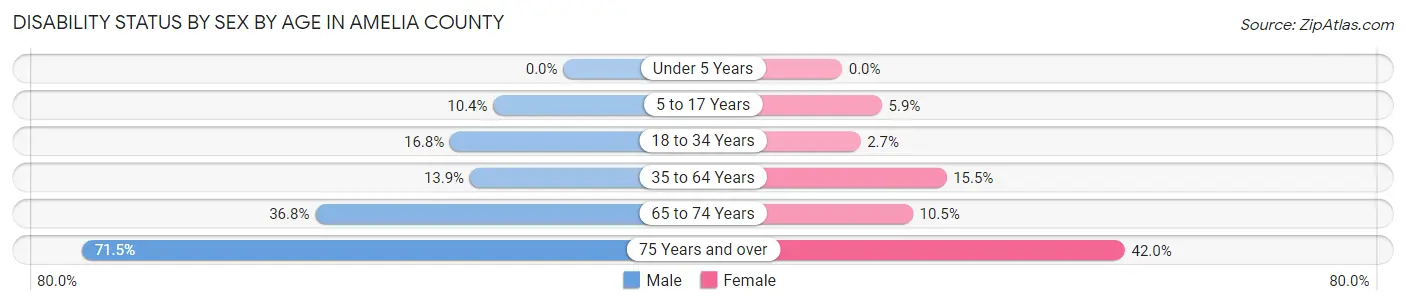
| Age Bracket | Male | Female |
| Under 5 Years | 0 (0.0%) | 0 (0.0%) |
| 5 to 17 Years | 97 (10.4%) | 65 (5.9%) |
| 18 to 34 Years | 197 (16.8%) | 33 (2.7%) |
| 35 to 64 Years | 387 (13.9%) | 419 (15.5%) |
| 65 to 74 Years | 252 (36.8%) | 67 (10.5%) |
| 75 Years and over | 379 (71.5%) | 304 (42.0%) |
Disability Class by Sex by Age in Amelia County
Disability Class: Hearing Difficulty
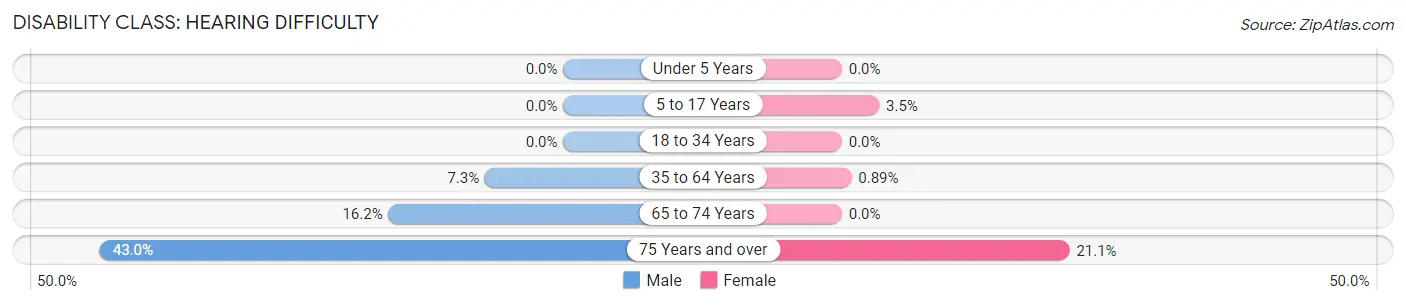
| Age Bracket | Male | Female |
| Under 5 Years | 0 (0.0%) | 0 (0.0%) |
| 5 to 17 Years | 0 (0.0%) | 38 (3.5%) |
| 18 to 34 Years | 0 (0.0%) | 0 (0.0%) |
| 35 to 64 Years | 203 (7.3%) | 24 (0.9%) |
| 65 to 74 Years | 111 (16.2%) | 0 (0.0%) |
| 75 Years and over | 228 (43.0%) | 153 (21.1%) |
Disability Class: Vision Difficulty
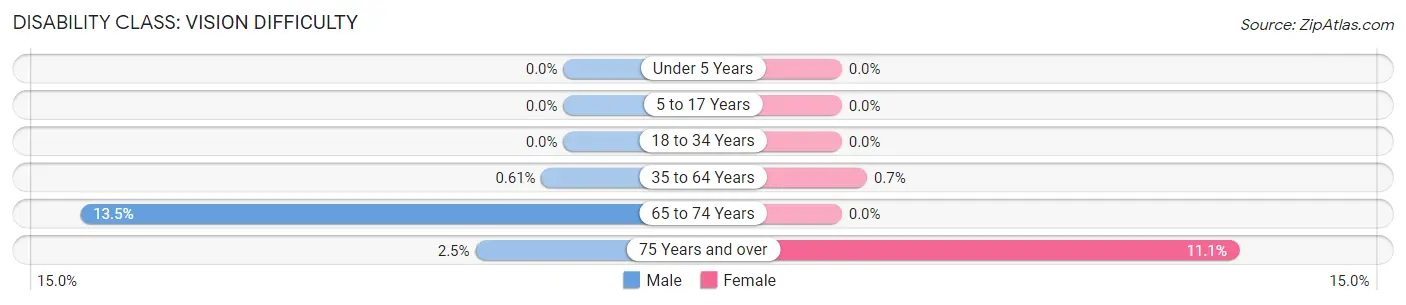
| Age Bracket | Male | Female |
| Under 5 Years | 0 (0.0%) | 0 (0.0%) |
| 5 to 17 Years | 0 (0.0%) | 0 (0.0%) |
| 18 to 34 Years | 0 (0.0%) | 0 (0.0%) |
| 35 to 64 Years | 17 (0.6%) | 19 (0.7%) |
| 65 to 74 Years | 92 (13.5%) | 0 (0.0%) |
| 75 Years and over | 13 (2.5%) | 80 (11.1%) |
Disability Class: Cognitive Difficulty
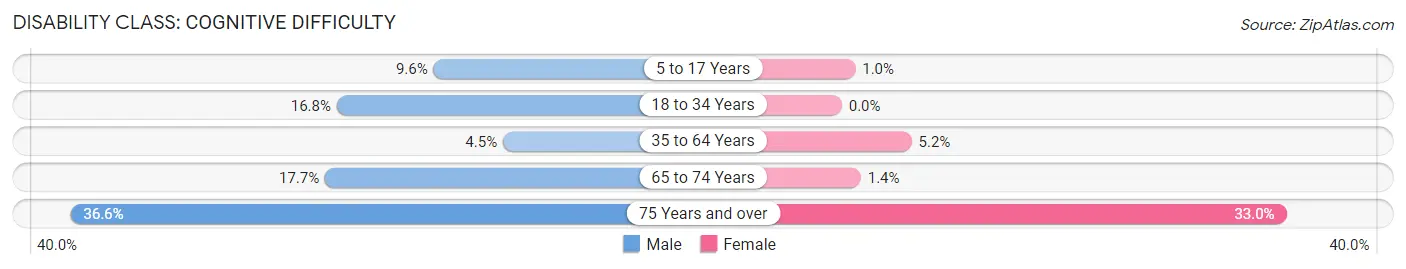
| Age Bracket | Male | Female |
| 5 to 17 Years | 90 (9.6%) | 11 (1.0%) |
| 18 to 34 Years | 197 (16.8%) | 0 (0.0%) |
| 35 to 64 Years | 125 (4.5%) | 140 (5.2%) |
| 65 to 74 Years | 121 (17.7%) | 9 (1.4%) |
| 75 Years and over | 194 (36.6%) | 239 (33.0%) |
Disability Class: Ambulatory Difficulty
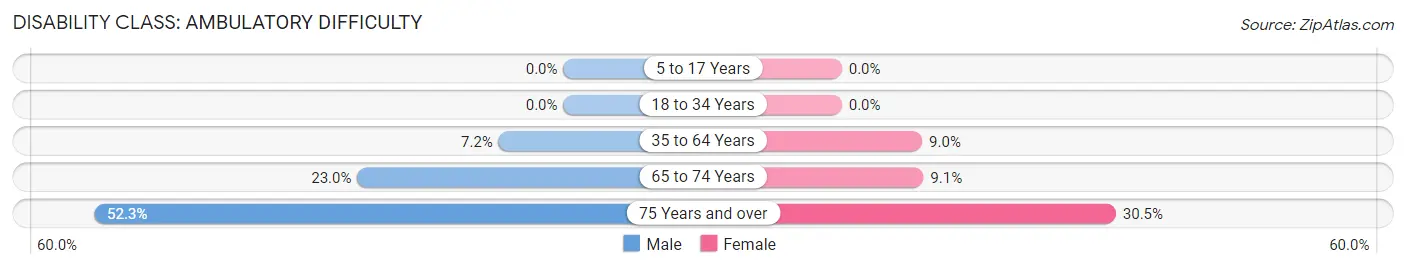
| Age Bracket | Male | Female |
| 5 to 17 Years | 0 (0.0%) | 0 (0.0%) |
| 18 to 34 Years | 0 (0.0%) | 0 (0.0%) |
| 35 to 64 Years | 201 (7.2%) | 242 (8.9%) |
| 65 to 74 Years | 157 (23.0%) | 58 (9.1%) |
| 75 Years and over | 277 (52.3%) | 221 (30.5%) |
Disability Class: Self-Care Difficulty
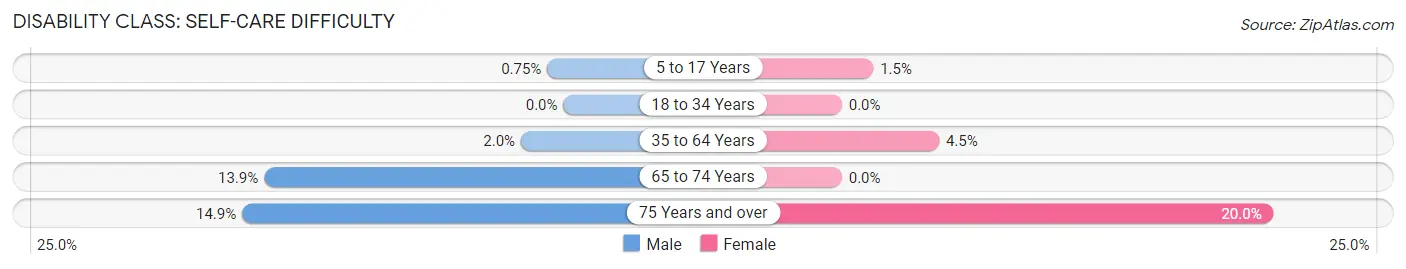
| Age Bracket | Male | Female |
| 5 to 17 Years | 7 (0.7%) | 16 (1.5%) |
| 18 to 34 Years | 0 (0.0%) | 0 (0.0%) |
| 35 to 64 Years | 55 (2.0%) | 122 (4.5%) |
| 65 to 74 Years | 95 (13.9%) | 0 (0.0%) |
| 75 Years and over | 79 (14.9%) | 145 (20.0%) |
Technology Access in Amelia County
Computing Device Access in Amelia County
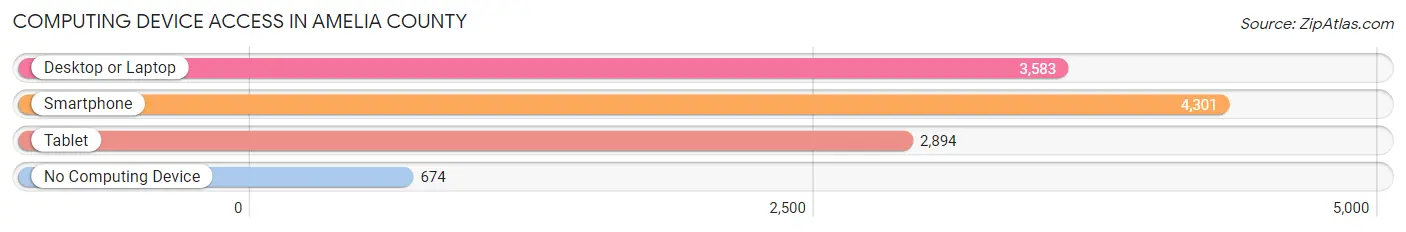
| Device Type | # Households | % Households |
| Desktop or Laptop | 3,583 | 68.1% |
| Smartphone | 4,301 | 81.8% |
| Tablet | 2,894 | 55.0% |
| No Computing Device | 674 | 12.8% |
| Total | 5,258 | 100.0% |
Internet Access in Amelia County
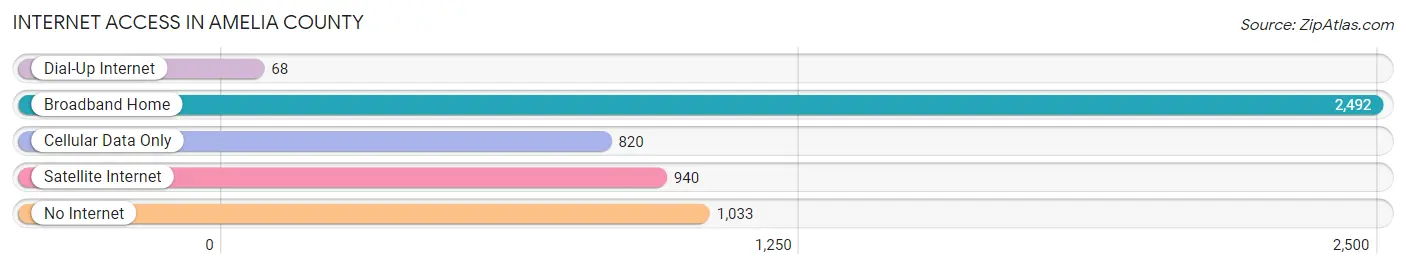
| Internet Type | # Households | % Households |
| Dial-Up Internet | 68 | 1.3% |
| Broadband Home | 2,492 | 47.4% |
| Cellular Data Only | 820 | 15.6% |
| Satellite Internet | 940 | 17.9% |
| No Internet | 1,033 | 19.7% |
| Total | 5,258 | 100.0% |
Amelia County Summary
Amelia County is a county located in the Commonwealth of Virginia. It is located in the south-central part of the state, and is part of the Richmond-Petersburg Metropolitan Statistical Area. As of the 2010 census, the population was 12,690. The county seat is Amelia Court House.
History
Amelia County was formed in 1735 from parts of Prince George and Brunswick counties. It was named for Princess Amelia, daughter of King George II of Great Britain. The county was the site of several battles during the American Civil War, including the Battle of Sayler's Creek, which was fought on April 6, 1865.
Geography
Amelia County is located in the south-central part of Virginia, and is bordered by Prince Edward County to the north, Nottoway County to the east, Lunenburg County to the south, and Powhatan County to the west. The county has a total area of 437 square miles, of which 434 square miles is land and 3 square miles (0.7%) is water.
The Appomattox River forms the northern border of the county, and the Nottoway River forms the eastern border. The county is mostly flat, with rolling hills in the western part. The highest point in the county is near the town of Amelia Court House, where the elevation reaches 590 feet above sea level.
Economy
The economy of Amelia County is largely based on agriculture. The county is home to several large farms, which produce a variety of crops, including corn, soybeans, wheat, and hay. The county also has a thriving timber industry, with several sawmills located in the area.
In addition to agriculture and timber, Amelia County is home to several manufacturing companies. The largest employer in the county is the Amelia Correctional Center, which employs over 500 people. Other major employers include the Amelia County Public Schools, the Amelia County Sheriff's Office, and the Amelia County Hospital.
Demographics
As of the 2010 census, there were 12,690 people, 4,845 households, and 3,521 families living in Amelia County. The population density was 29.3 people per square mile. The racial makeup of the county was 68.3% White, 28.2% African American, 0.3% Native American, 0.5% Asian, 0.1% Pacific Islander, 0.7% from other races, and 1.9% from two or more races. Hispanic or Latino of any race were 2.2% of the population.
The median income for a household in the county was $45,945, and the median income for a family was $54,945. The per capita income for the county was $20,945. About 11.3% of families and 14.2% of the population were below the poverty line, including 19.2% of those under age 18 and 11.2% of those age 65 or over.
Common Questions
What is Per Capita Income in Amelia County?
Per Capita income in Amelia County is $34,122.
What is the Median Family Income in Amelia County?
Median Family Income in Amelia County is $85,575.
What is the Median Household income in Amelia County?
Median Household Income in Amelia County is $63,438.
What is Income or Wage Gap in Amelia County?
Income or Wage Gap in Amelia County is 35.0%.
Women in Amelia County earn 65.0 cents for every dollar earned by a man.
What is Family Income Deficit in Amelia County?
Family Income Deficit in Amelia County is $9,080.
Families that are below poverty line in Amelia County earn $9,080 less on average than the poverty threshold level.
What is Inequality or Gini Index in Amelia County?
Inequality or Gini Index in Amelia County is 0.43.
What is the Total Population of Amelia County?
Total Population of Amelia County is 13,309.
What is the Total Male Population of Amelia County?
Total Male Population of Amelia County is 6,531.
What is the Total Female Population of Amelia County?
Total Female Population of Amelia County is 6,778.
What is the Ratio of Males per 100 Females in Amelia County?
There are 96.36 Males per 100 Females in Amelia County.
What is the Ratio of Females per 100 Males in Amelia County?
There are 103.78 Females per 100 Males in Amelia County.
What is the Median Population Age in Amelia County?
Median Population Age in Amelia County is 45.1 Years.
What is the Average Family Size in Amelia County
Average Family Size in Amelia County is 3.0 People.
What is the Average Household Size in Amelia County
Average Household Size in Amelia County is 2.5 People.
How Large is the Labor Force in Amelia County?
There are 6,617 People in the Labor Forcein in Amelia County.
What is the Percentage of People in the Labor Force in Amelia County?
61.0% of People are in the Labor Force in Amelia County.
What is the Unemployment Rate in Amelia County?
Unemployment Rate in Amelia County is 4.1%.