Alleghany County, VA Map & Demographics
Alleghany County Map
Alleghany County Overview
$30,143
PER CAPITA INCOME
$68,965
AVG FAMILY INCOME
$52,546
AVG HOUSEHOLD INCOME
42.9%
WAGE / INCOME GAP [ % ]
57.1¢/ $1
WAGE / INCOME GAP [ $ ]
$13,024
FAMILY INCOME DEFICIT
0.46
INEQUALITY / GINI INDEX
15,159
TOTAL POPULATION
7,501
MALE POPULATION
7,658
FEMALE POPULATION
97.95
MALES / 100 FEMALES
102.09
FEMALES / 100 MALES
48.0
MEDIAN AGE
3.1
AVG FAMILY SIZE
2.3
AVG HOUSEHOLD SIZE
6,316
LABOR FORCE [ PEOPLE ]
49.9%
PERCENT IN LABOR FORCE
3.7%
UNEMPLOYMENT RATE
Alleghany County Area Codes
Income in Alleghany County
Income Overview in Alleghany County
Per Capita Income in Alleghany County is $30,143, while median incomes of families and households are $68,965 and $52,546 respectively.
| Characteristic | Number | Measure |
| Per Capita Income | 15,159 | $30,143 |
| Median Family Income | 3,759 | $68,965 |
| Mean Family Income | 3,759 | $83,984 |
| Median Household Income | 6,309 | $52,546 |
| Mean Household Income | 6,309 | $68,475 |
| Income Deficit | 3,759 | $13,024 |
| Wage / Income Gap (%) | 15,159 | 42.94% |
| Wage / Income Gap ($) | 15,159 | 57.06¢ per $1 |
| Gini / Inequality Index | 15,159 | 0.46 |
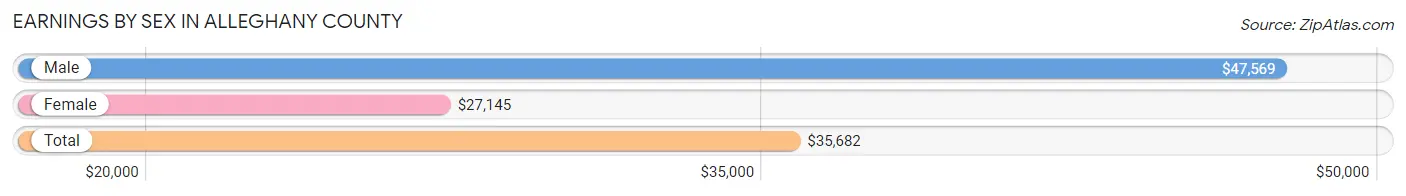
Earnings by Sex in Alleghany County
Average Earnings in Alleghany County are $35,682, $47,569 for men and $27,145 for women, a difference of 42.9%.
| Sex | Number | Average Earnings |
| Male | 3,532 (52.1%) | $47,569 |
| Female | 3,244 (47.9%) | $27,145 |
| Total | 6,776 (100.0%) | $35,682 |
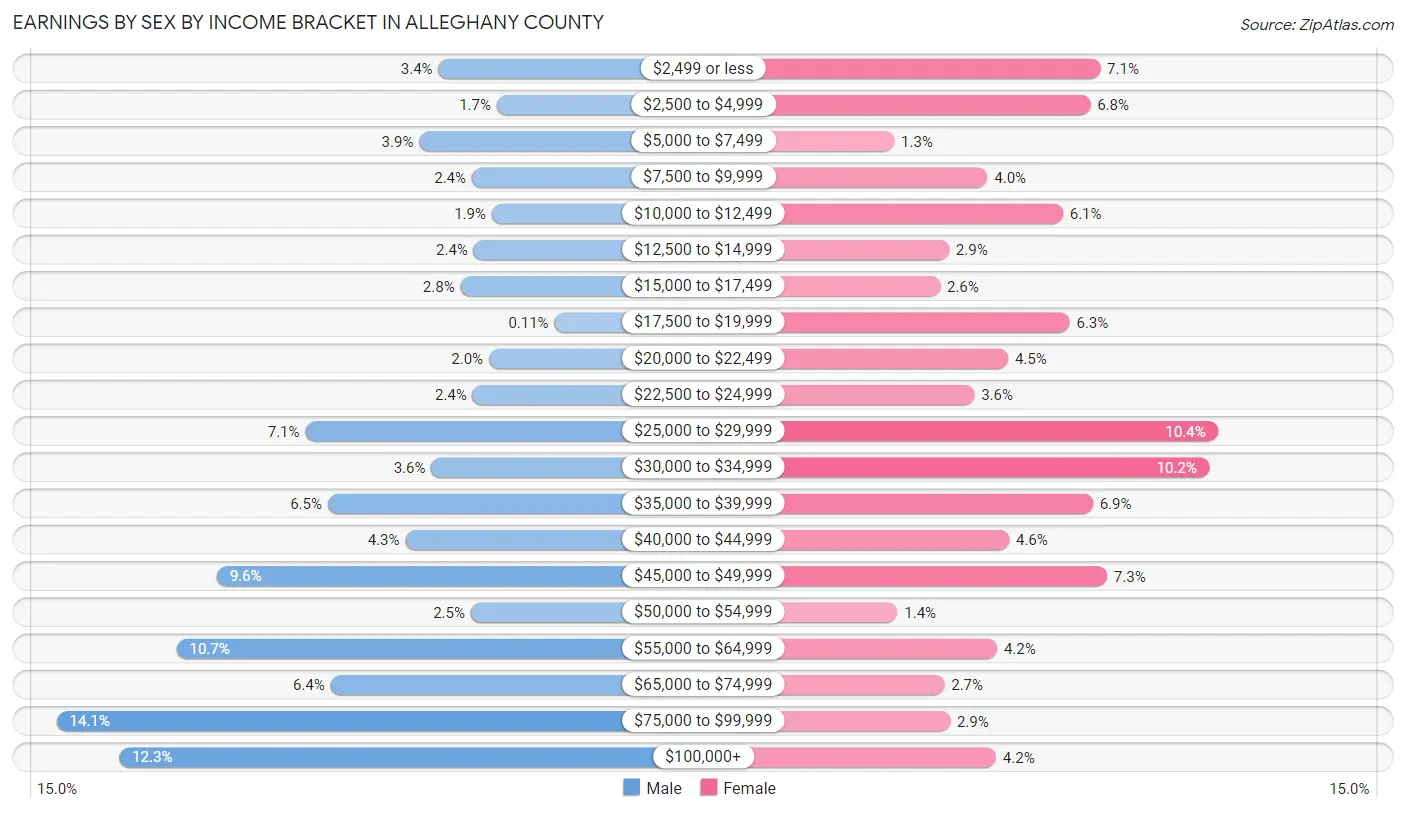
Earnings by Sex by Income Bracket in Alleghany County
The most common earnings brackets in Alleghany County are $75,000 to $99,999 for men (498 | 14.1%) and $25,000 to $29,999 for women (338 | 10.4%).
| Income | Male | Female |
| $2,499 or less | 119 (3.4%) | 231 (7.1%) |
| $2,500 to $4,999 | 61 (1.7%) | 222 (6.8%) |
| $5,000 to $7,499 | 138 (3.9%) | 43 (1.3%) |
| $7,500 to $9,999 | 86 (2.4%) | 128 (4.0%) |
| $10,000 to $12,499 | 66 (1.9%) | 197 (6.1%) |
| $12,500 to $14,999 | 84 (2.4%) | 93 (2.9%) |
| $15,000 to $17,499 | 97 (2.8%) | 85 (2.6%) |
| $17,500 to $19,999 | 4 (0.1%) | 203 (6.3%) |
| $20,000 to $22,499 | 69 (1.9%) | 147 (4.5%) |
| $22,500 to $24,999 | 85 (2.4%) | 116 (3.6%) |
| $25,000 to $29,999 | 251 (7.1%) | 338 (10.4%) |
| $30,000 to $34,999 | 126 (3.6%) | 330 (10.2%) |
| $35,000 to $39,999 | 229 (6.5%) | 224 (6.9%) |
| $40,000 to $44,999 | 152 (4.3%) | 148 (4.6%) |
| $45,000 to $49,999 | 339 (9.6%) | 237 (7.3%) |
| $50,000 to $54,999 | 87 (2.5%) | 46 (1.4%) |
| $55,000 to $64,999 | 379 (10.7%) | 137 (4.2%) |
| $65,000 to $74,999 | 226 (6.4%) | 89 (2.7%) |
| $75,000 to $99,999 | 498 (14.1%) | 94 (2.9%) |
| $100,000+ | 436 (12.3%) | 136 (4.2%) |
| Total | 3,532 (100.0%) | 3,244 (100.0%) |
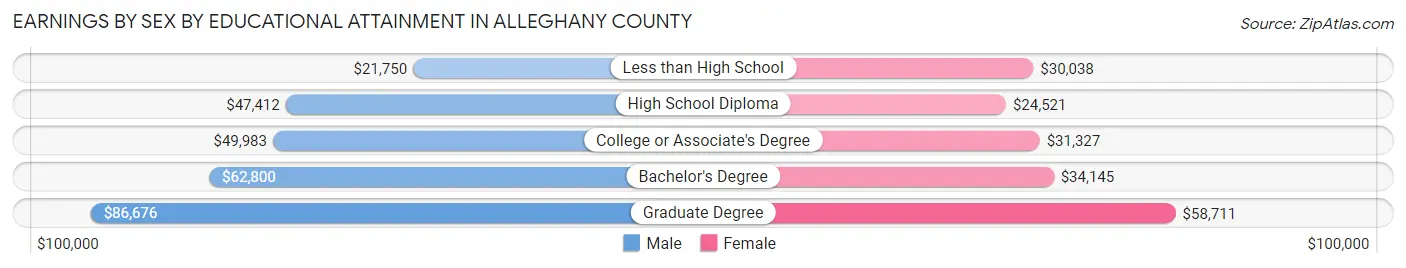
Earnings by Sex by Educational Attainment in Alleghany County
Average earnings in Alleghany County are $50,089 for men and $30,281 for women, a difference of 39.6%. Men with an educational attainment of graduate degree enjoy the highest average annual earnings of $86,676, while those with less than high school education earn the least with $21,750. Women with an educational attainment of graduate degree earn the most with the average annual earnings of $58,711, while those with high school diploma education have the smallest earnings of $24,521.
| Educational Attainment | Male Income | Female Income |
| Less than High School | $21,750 | $30,038 |
| High School Diploma | $47,412 | $24,521 |
| College or Associate's Degree | $49,983 | $31,327 |
| Bachelor's Degree | $62,800 | $34,145 |
| Graduate Degree | $86,676 | $58,711 |
| Total | $50,089 | $30,281 |
Family Income in Alleghany County
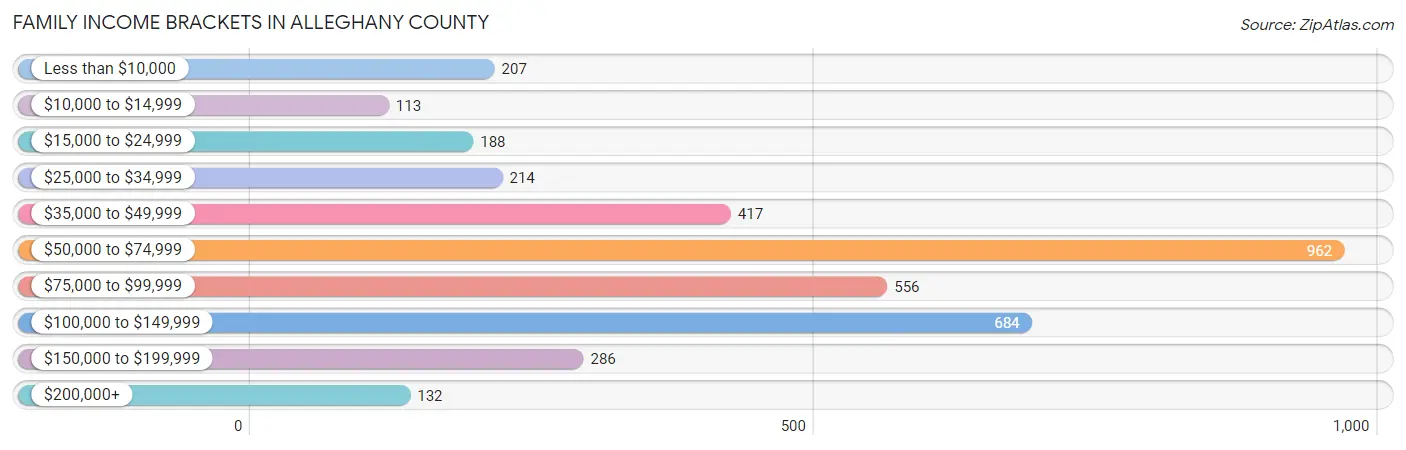
Family Income Brackets in Alleghany County
According to the Alleghany County family income data, there are 962 families falling into the $50,000 to $74,999 income range, which is the most common income bracket and makes up 25.6% of all families. Conversely, the $10,000 to $14,999 income bracket is the least frequent group with only 113 families (3.0%) belonging to this category.
| Income Bracket | # Families | % Families |
| Less than $10,000 | 207 | 5.5% |
| $10,000 to $14,999 | 113 | 3.0% |
| $15,000 to $24,999 | 188 | 5.0% |
| $25,000 to $34,999 | 214 | 5.7% |
| $35,000 to $49,999 | 417 | 11.1% |
| $50,000 to $74,999 | 962 | 25.6% |
| $75,000 to $99,999 | 556 | 14.8% |
| $100,000 to $149,999 | 684 | 18.2% |
| $150,000 to $199,999 | 286 | 7.6% |
| $200,000+ | 132 | 3.5% |
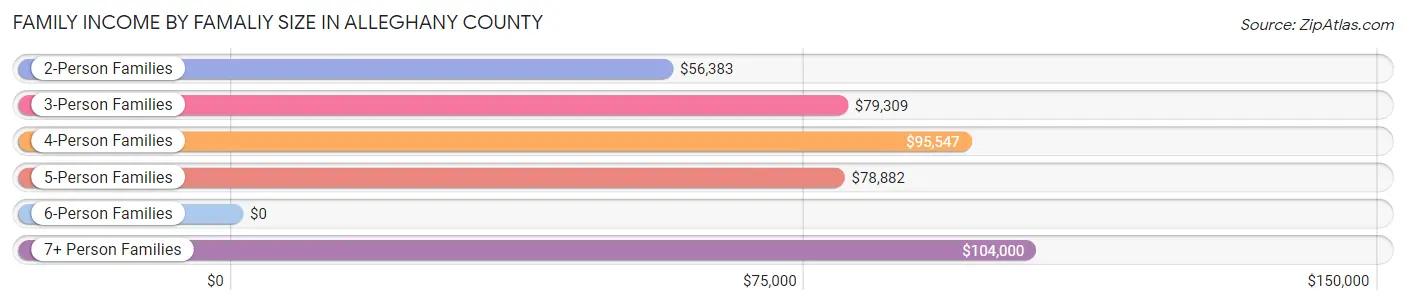
Family Income by Famaliy Size in Alleghany County
7+ person families (34 | 0.9%) account for the highest median family income in Alleghany County with $104,000 per family, while 2-person families (2,127 | 56.6%) have the highest median income of $28,192 per family member.
| Income Bracket | # Families | Median Income |
| 2-Person Families | 2,127 (56.6%) | $56,383 |
| 3-Person Families | 790 (21.0%) | $79,309 |
| 4-Person Families | 566 (15.1%) | $95,547 |
| 5-Person Families | 230 (6.1%) | $78,882 |
| 6-Person Families | 12 (0.3%) | $0 |
| 7+ Person Families | 34 (0.9%) | $104,000 |
| Total | 3,759 (100.0%) | $68,965 |
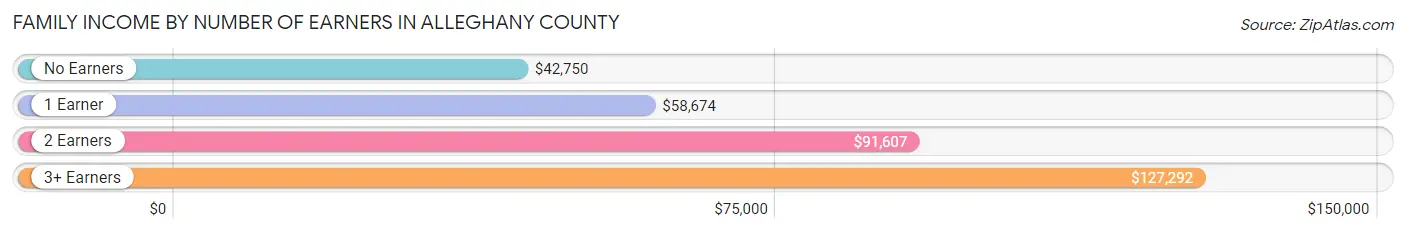
Family Income by Number of Earners in Alleghany County
The median family income in Alleghany County is $68,965, with families comprising 3+ earners (349) having the highest median family income of $127,292, while families with no earners (1,046) have the lowest median family income of $42,750, accounting for 9.3% and 27.8% of families, respectively.
| Number of Earners | # Families | Median Income |
| No Earners | 1,046 (27.8%) | $42,750 |
| 1 Earner | 1,015 (27.0%) | $58,674 |
| 2 Earners | 1,349 (35.9%) | $91,607 |
| 3+ Earners | 349 (9.3%) | $127,292 |
| Total | 3,759 (100.0%) | $68,965 |
Household Income in Alleghany County
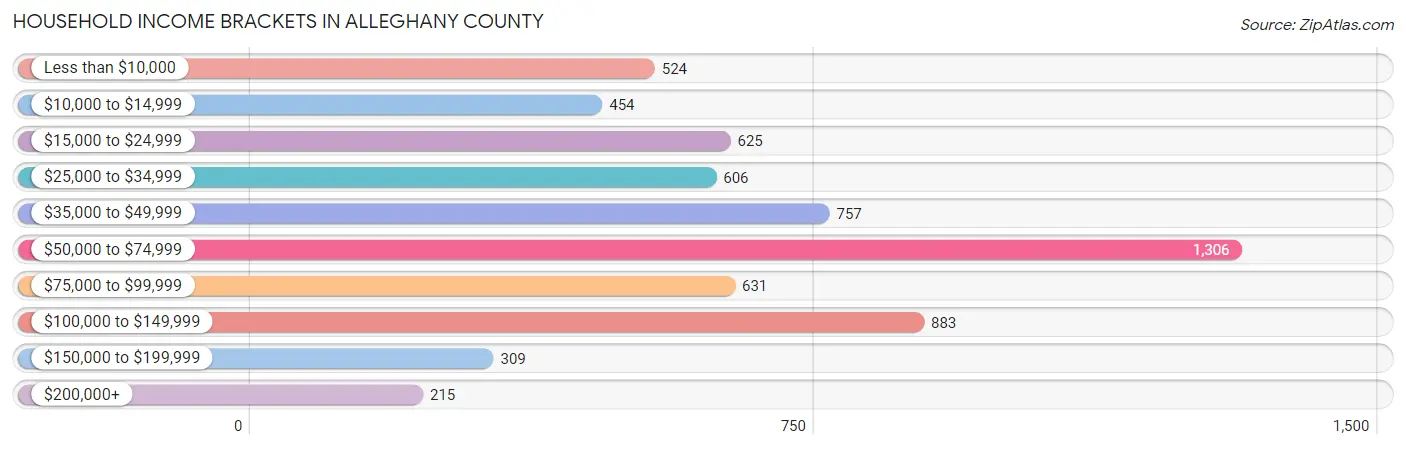
Household Income Brackets in Alleghany County
With 1,306 households falling in the category, the $50,000 to $74,999 income range is the most frequent in Alleghany County, accounting for 20.7% of all households. In contrast, only 215 households (3.4%) fall into the $200,000+ income bracket, making it the least populous group.
| Income Bracket | # Households | % Households |
| Less than $10,000 | 524 | 8.3% |
| $10,000 to $14,999 | 454 | 7.2% |
| $15,000 to $24,999 | 625 | 9.9% |
| $25,000 to $34,999 | 606 | 9.6% |
| $35,000 to $49,999 | 757 | 12.0% |
| $50,000 to $74,999 | 1,306 | 20.7% |
| $75,000 to $99,999 | 631 | 10.0% |
| $100,000 to $149,999 | 883 | 14.0% |
| $150,000 to $199,999 | 309 | 4.9% |
| $200,000+ | 215 | 3.4% |
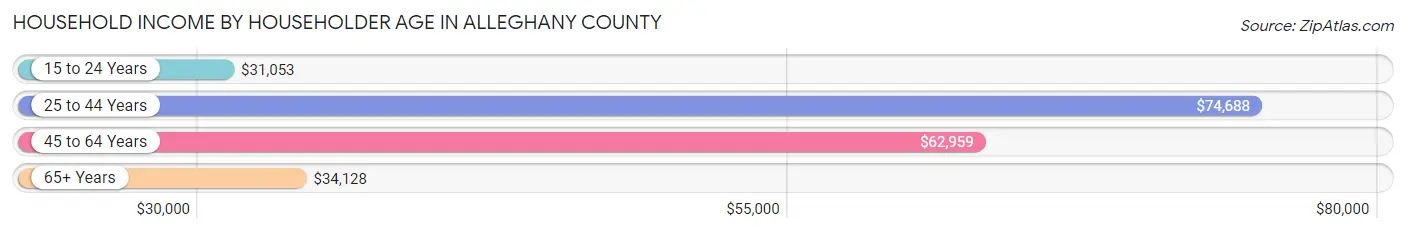
Household Income by Householder Age in Alleghany County
The median household income in Alleghany County is $52,546, with the highest median household income of $74,688 found in the 25 to 44 years age bracket for the primary householder. A total of 1,217 households (19.3%) fall into this category. Meanwhile, the 15 to 24 years age bracket for the primary householder has the lowest median household income of $31,053, with 142 households (2.2%) in this group.
| Income Bracket | # Households | Median Income |
| 15 to 24 Years | 142 (2.2%) | $31,053 |
| 25 to 44 Years | 1,217 (19.3%) | $74,688 |
| 45 to 64 Years | 2,554 (40.5%) | $62,959 |
| 65+ Years | 2,396 (38.0%) | $34,128 |
| Total | 6,309 (100.0%) | $52,546 |
Poverty in Alleghany County
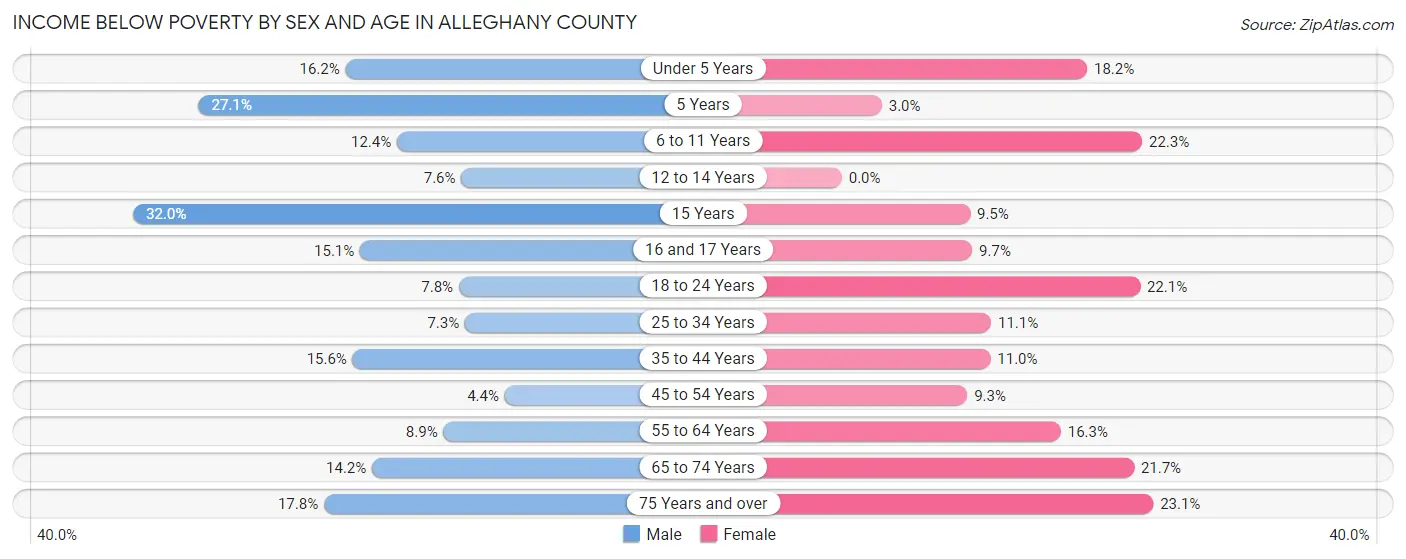
Income Below Poverty by Sex and Age in Alleghany County
With 11.6% poverty level for males and 15.8% for females among the residents of Alleghany County, 15 year old males and 75 year old and over females are the most vulnerable to poverty, with 54 males (32.0%) and 197 females (23.1%) in their respective age groups living below the poverty level.
| Age Bracket | Male | Female |
| Under 5 Years | 54 (16.2%) | 53 (18.2%) |
| 5 Years | 26 (27.1%) | 3 (3.0%) |
| 6 to 11 Years | 81 (12.3%) | 72 (22.3%) |
| 12 to 14 Years | 19 (7.6%) | 0 (0.0%) |
| 15 Years | 54 (32.0%) | 2 (9.5%) |
| 16 and 17 Years | 16 (15.1%) | 24 (9.7%) |
| 18 to 24 Years | 45 (7.7%) | 122 (22.1%) |
| 25 to 34 Years | 59 (7.3%) | 87 (11.1%) |
| 35 to 44 Years | 112 (15.6%) | 79 (11.0%) |
| 45 to 54 Years | 41 (4.3%) | 90 (9.3%) |
| 55 to 64 Years | 102 (8.9%) | 202 (16.3%) |
| 65 to 74 Years | 136 (14.2%) | 244 (21.7%) |
| 75 Years and over | 115 (17.8%) | 197 (23.1%) |
| Total | 860 (11.6%) | 1,175 (15.8%) |
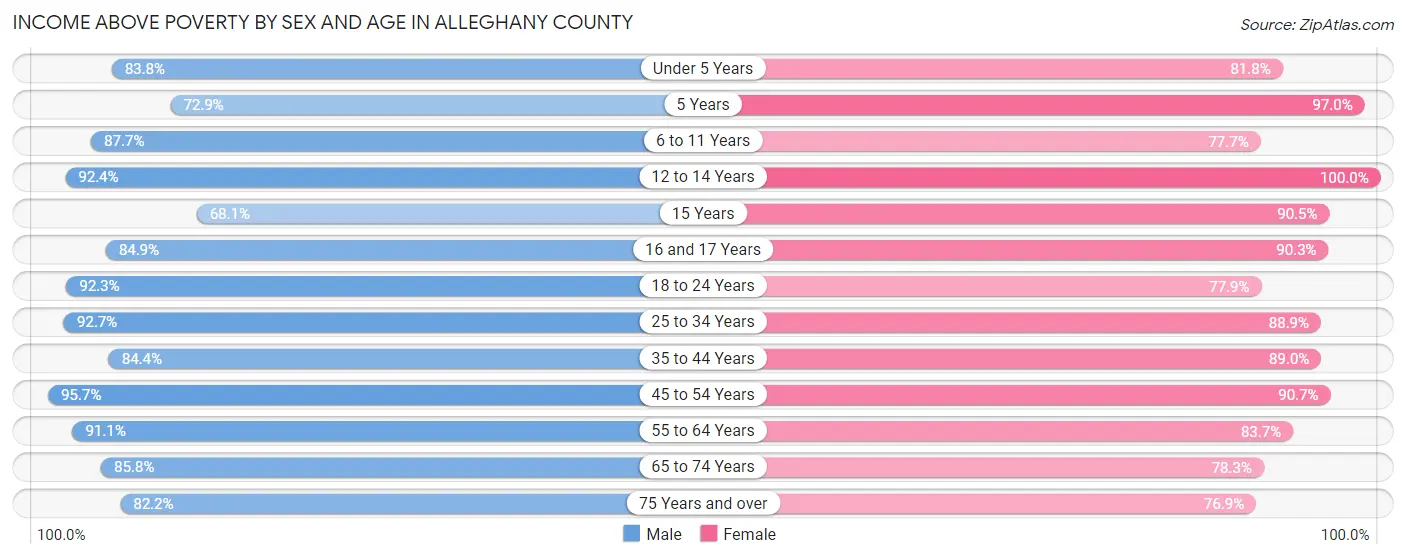
Income Above Poverty by Sex and Age in Alleghany County
According to the poverty statistics in Alleghany County, males aged 45 to 54 years and females aged 12 to 14 years are the age groups that are most secure financially, with 95.7% of males and 100.0% of females in these age groups living above the poverty line.
| Age Bracket | Male | Female |
| Under 5 Years | 280 (83.8%) | 238 (81.8%) |
| 5 Years | 70 (72.9%) | 98 (97.0%) |
| 6 to 11 Years | 575 (87.6%) | 251 (77.7%) |
| 12 to 14 Years | 232 (92.4%) | 230 (100.0%) |
| 15 Years | 115 (68.0%) | 19 (90.5%) |
| 16 and 17 Years | 90 (84.9%) | 224 (90.3%) |
| 18 to 24 Years | 536 (92.2%) | 429 (77.9%) |
| 25 to 34 Years | 749 (92.7%) | 698 (88.9%) |
| 35 to 44 Years | 604 (84.4%) | 637 (89.0%) |
| 45 to 54 Years | 902 (95.7%) | 877 (90.7%) |
| 55 to 64 Years | 1,044 (91.1%) | 1,040 (83.7%) |
| 65 to 74 Years | 822 (85.8%) | 881 (78.3%) |
| 75 Years and over | 532 (82.2%) | 655 (76.9%) |
| Total | 6,551 (88.4%) | 6,277 (84.2%) |
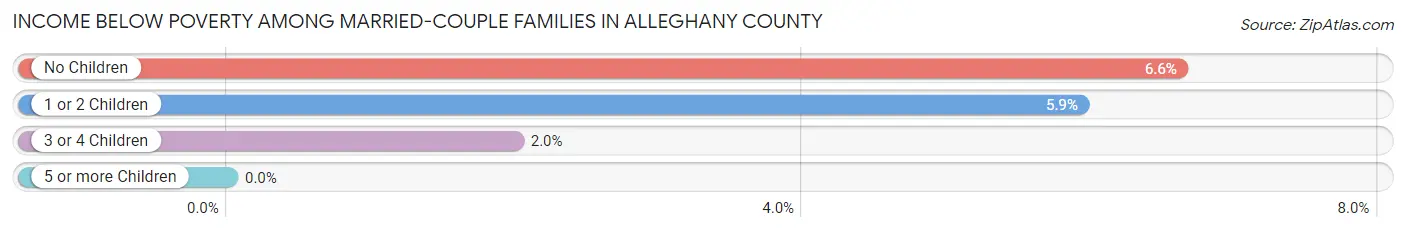
Income Below Poverty Among Married-Couple Families in Alleghany County
The poverty statistics for married-couple families in Alleghany County show that 6.2% or 182 of the total 2,947 families live below the poverty line. Families with no children have the highest poverty rate of 6.6%, comprising of 133 families. On the other hand, families with 5 or more children have the lowest poverty rate of 0.0%, which includes 0 families.
| Children | Above Poverty | Below Poverty |
| No Children | 1,876 (93.4%) | 133 (6.6%) |
| 1 or 2 Children | 730 (94.1%) | 46 (5.9%) |
| 3 or 4 Children | 148 (98.0%) | 3 (2.0%) |
| 5 or more Children | 11 (100.0%) | 0 (0.0%) |
| Total | 2,765 (93.8%) | 182 (6.2%) |
Income Below Poverty Among Single-Parent Households in Alleghany County
According to the poverty data in Alleghany County, 16.0% or 43 single-father households and 30.3% or 165 single-mother households are living below the poverty line. Among single-father households, those with no children have the highest poverty rate, with 41 households (25.6%) experiencing poverty. Likewise, among single-mother households, those with 3 or 4 children have the highest poverty rate, with 21 households (84.0%) falling below the poverty line.
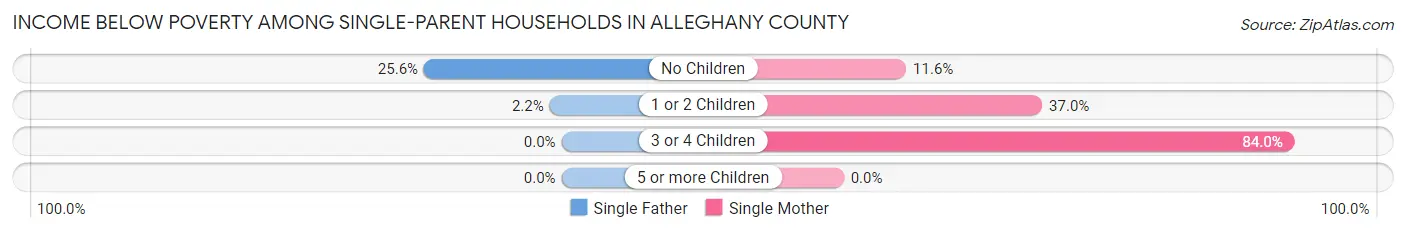
| Children | Single Father | Single Mother |
| No Children | 41 (25.6%) | 22 (11.6%) |
| 1 or 2 Children | 2 (2.2%) | 122 (37.0%) |
| 3 or 4 Children | 0 (0.0%) | 21 (84.0%) |
| 5 or more Children | 0 (0.0%) | 0 (0.0%) |
| Total | 43 (16.0%) | 165 (30.3%) |
Income Below Poverty Among Married-Couple vs Single-Parent Households in Alleghany County
The poverty data for Alleghany County shows that 182 of the married-couple family households (6.2%) and 208 of the single-parent households (25.6%) are living below the poverty level. Within the married-couple family households, those with no children have the highest poverty rate, with 133 households (6.6%) falling below the poverty line. Among the single-parent households, those with 3 or 4 children have the highest poverty rate, with 21 household (48.8%) living below poverty.
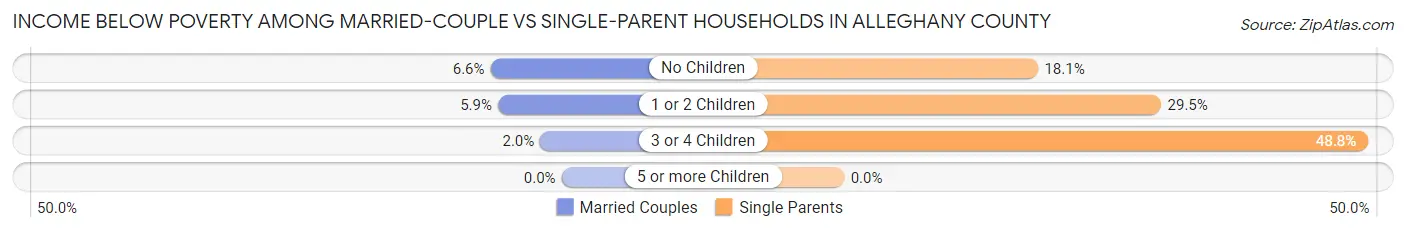
| Children | Married-Couple Families | Single-Parent Households |
| No Children | 133 (6.6%) | 63 (18.0%) |
| 1 or 2 Children | 46 (5.9%) | 124 (29.5%) |
| 3 or 4 Children | 3 (2.0%) | 21 (48.8%) |
| 5 or more Children | 0 (0.0%) | 0 (0.0%) |
| Total | 182 (6.2%) | 208 (25.6%) |
Race in Alleghany County
The most populous races in Alleghany County are White / Caucasian (14,000 | 92.3%), Black / African American (783 | 5.2%), and Two or more Races (290 | 1.9%).
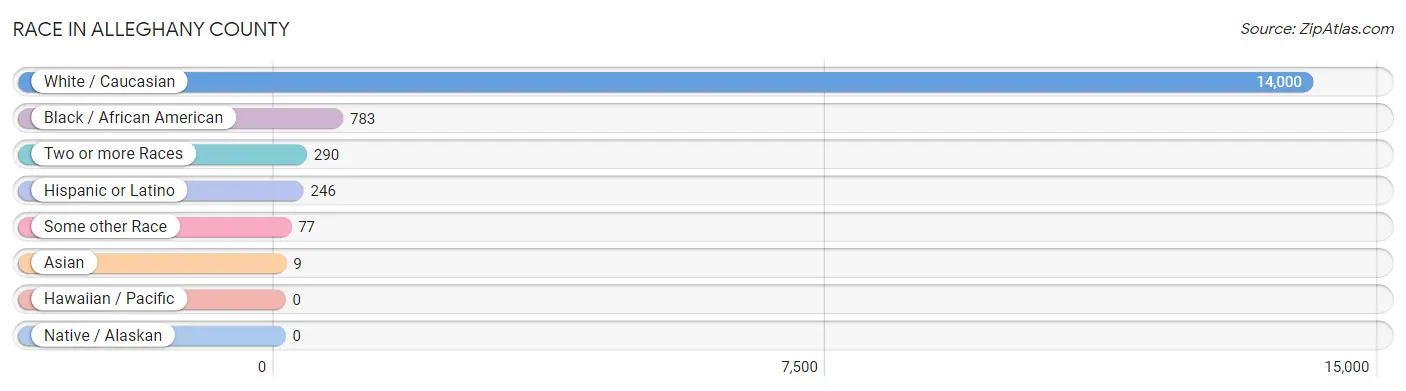
| Race | # Population | % Population |
| Asian | 9 | 0.1% |
| Black / African American | 783 | 5.2% |
| Hawaiian / Pacific | 0 | 0.0% |
| Hispanic or Latino | 246 | 1.6% |
| Native / Alaskan | 0 | 0.0% |
| White / Caucasian | 14,000 | 92.3% |
| Two or more Races | 290 | 1.9% |
| Some other Race | 77 | 0.5% |
| Total | 15,159 | 100.0% |
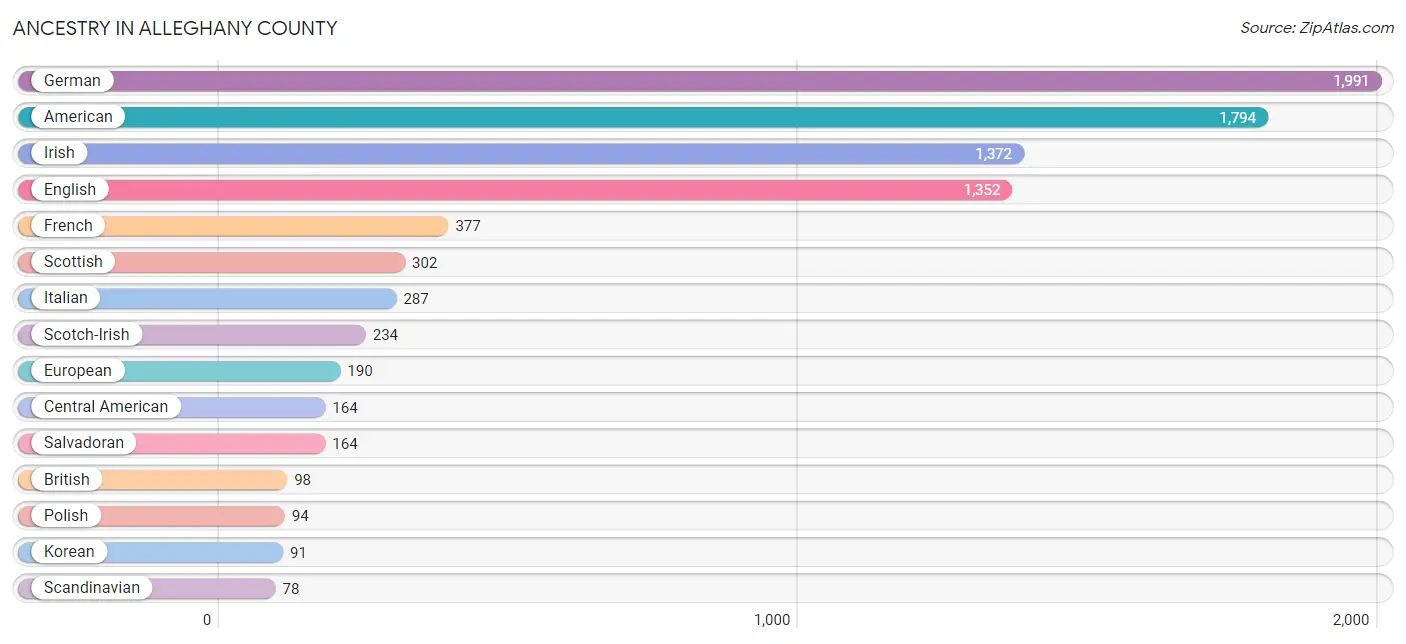
Ancestry in Alleghany County
The most populous ancestries reported in Alleghany County are German (1,991 | 13.1%), American (1,794 | 11.8%), Irish (1,372 | 9.0%), English (1,352 | 8.9%), and French (377 | 2.5%), together accounting for 45.4% of all Alleghany County residents.
| Ancestry | # Population | % Population |
| African | 10 | 0.1% |
| American | 1,794 | 11.8% |
| Arab | 3 | 0.0% |
| Austrian | 44 | 0.3% |
| British | 98 | 0.6% |
| Central American | 164 | 1.1% |
| Cherokee | 66 | 0.4% |
| Czech | 10 | 0.1% |
| Danish | 28 | 0.2% |
| Dutch | 73 | 0.5% |
| Eastern European | 21 | 0.1% |
| English | 1,352 | 8.9% |
| Ethiopian | 2 | 0.0% |
| European | 190 | 1.3% |
| French | 377 | 2.5% |
| French Canadian | 28 | 0.2% |
| German | 1,991 | 13.1% |
| Greek | 33 | 0.2% |
| Indian (Asian) | 5 | 0.0% |
| Irish | 1,372 | 9.0% |
| Italian | 287 | 1.9% |
| Korean | 91 | 0.6% |
| Latvian | 30 | 0.2% |
| Mexican | 39 | 0.3% |
| Northern European | 12 | 0.1% |
| Norwegian | 18 | 0.1% |
| Polish | 94 | 0.6% |
| Puerto Rican | 24 | 0.2% |
| Russian | 49 | 0.3% |
| Salvadoran | 164 | 1.1% |
| Scandinavian | 78 | 0.5% |
| Scotch-Irish | 234 | 1.5% |
| Scottish | 302 | 2.0% |
| Slovak | 12 | 0.1% |
| Spaniard | 9 | 0.1% |
| Spanish American | 10 | 0.1% |
| Subsaharan African | 12 | 0.1% |
| Swedish | 43 | 0.3% |
| Swiss | 14 | 0.1% |
| Thai | 4 | 0.0% |
| Ukrainian | 40 | 0.3% |
| Welsh | 29 | 0.2% | View All 42 Rows |
Immigrants in Alleghany County
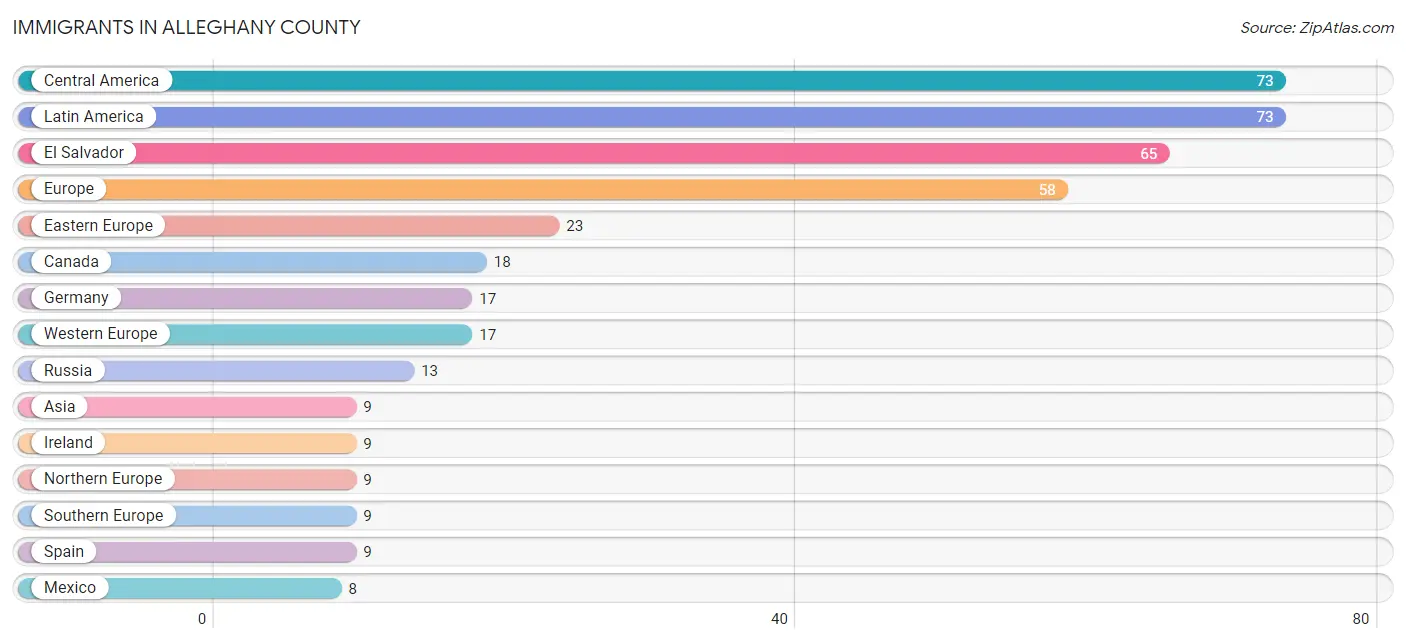
The most numerous immigrant groups reported in Alleghany County came from Central America (73 | 0.5%), Latin America (73 | 0.5%), El Salvador (65 | 0.4%), Europe (58 | 0.4%), and Eastern Europe (23 | 0.2%), together accounting for 1.9% of all Alleghany County residents.
| Immigration Origin | # Population | % Population |
| Africa | 2 | 0.0% |
| Asia | 9 | 0.1% |
| Canada | 18 | 0.1% |
| Central America | 73 | 0.5% |
| Eastern Africa | 2 | 0.0% |
| Eastern Europe | 23 | 0.2% |
| El Salvador | 65 | 0.4% |
| Ethiopia | 2 | 0.0% |
| Europe | 58 | 0.4% |
| Germany | 17 | 0.1% |
| India | 4 | 0.0% |
| Ireland | 9 | 0.1% |
| Latin America | 73 | 0.5% |
| Mexico | 8 | 0.1% |
| Northern Europe | 9 | 0.1% |
| Russia | 13 | 0.1% |
| Singapore | 5 | 0.0% |
| South Central Asia | 4 | 0.0% |
| South Eastern Asia | 5 | 0.0% |
| Southern Europe | 9 | 0.1% |
| Spain | 9 | 0.1% |
| Western Europe | 17 | 0.1% | View All 22 Rows |
Sex and Age in Alleghany County
Sex and Age in Alleghany County
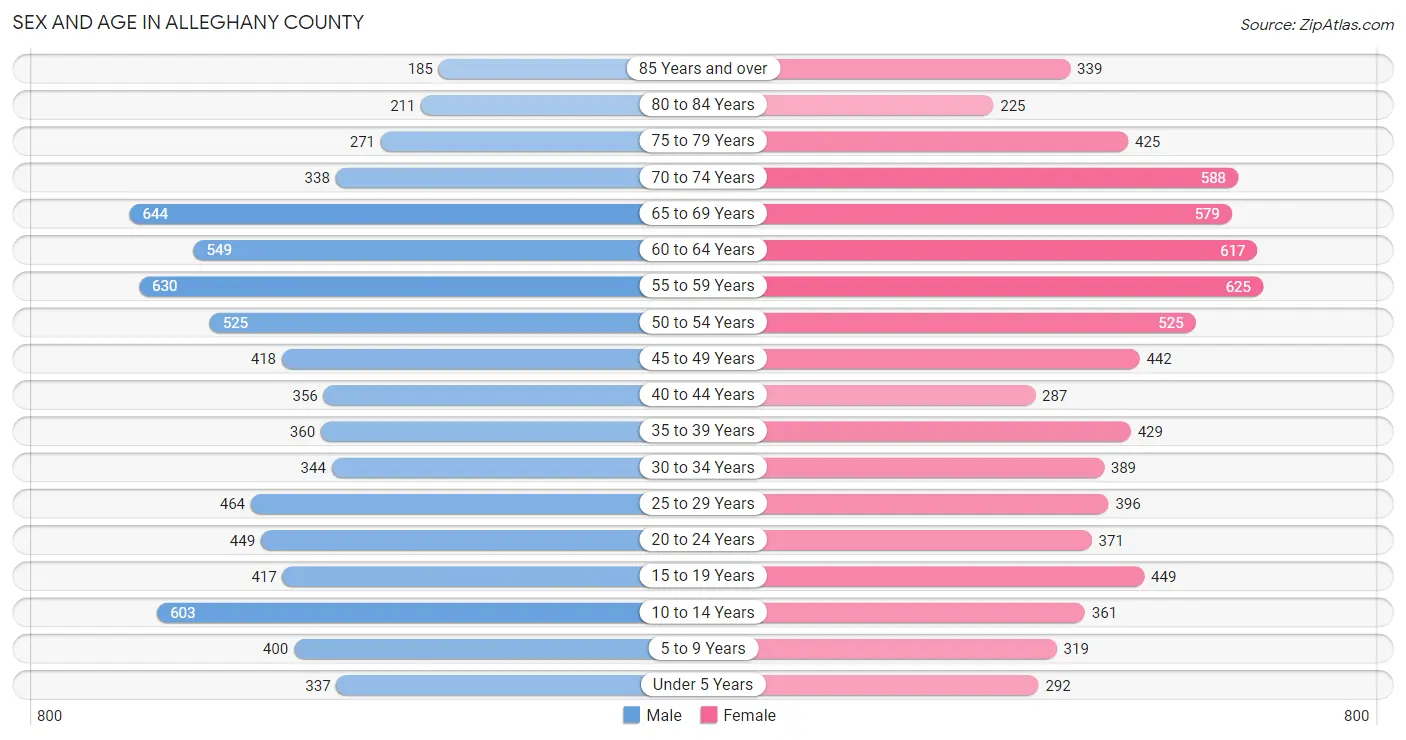
The most populous age groups in Alleghany County are 65 to 69 Years (644 | 8.6%) for men and 55 to 59 Years (625 | 8.2%) for women.
| Age Bracket | Male | Female |
| Under 5 Years | 337 (4.5%) | 292 (3.8%) |
| 5 to 9 Years | 400 (5.3%) | 319 (4.2%) |
| 10 to 14 Years | 603 (8.0%) | 361 (4.7%) |
| 15 to 19 Years | 417 (5.6%) | 449 (5.9%) |
| 20 to 24 Years | 449 (6.0%) | 371 (4.8%) |
| 25 to 29 Years | 464 (6.2%) | 396 (5.2%) |
| 30 to 34 Years | 344 (4.6%) | 389 (5.1%) |
| 35 to 39 Years | 360 (4.8%) | 429 (5.6%) |
| 40 to 44 Years | 356 (4.8%) | 287 (3.7%) |
| 45 to 49 Years | 418 (5.6%) | 442 (5.8%) |
| 50 to 54 Years | 525 (7.0%) | 525 (6.9%) |
| 55 to 59 Years | 630 (8.4%) | 625 (8.2%) |
| 60 to 64 Years | 549 (7.3%) | 617 (8.1%) |
| 65 to 69 Years | 644 (8.6%) | 579 (7.6%) |
| 70 to 74 Years | 338 (4.5%) | 588 (7.7%) |
| 75 to 79 Years | 271 (3.6%) | 425 (5.6%) |
| 80 to 84 Years | 211 (2.8%) | 225 (2.9%) |
| 85 Years and over | 185 (2.5%) | 339 (4.4%) |
| Total | 7,501 (100.0%) | 7,658 (100.0%) |
Families and Households in Alleghany County
Median Family Size in Alleghany County
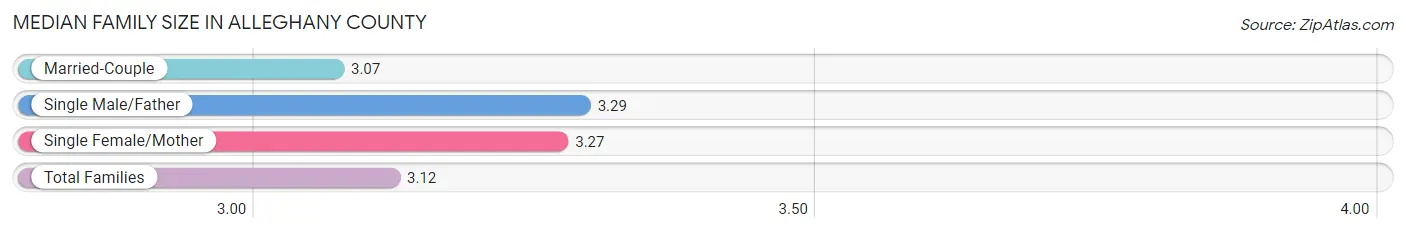
The median family size in Alleghany County is 3.12 persons per family, with single male/father families (268 | 7.1%) accounting for the largest median family size of 3.29 persons per family. On the other hand, married-couple families (2,947 | 78.4%) represent the smallest median family size with 3.07 persons per family.
| Family Type | # Families | Family Size |
| Married-Couple | 2,947 (78.4%) | 3.07 |
| Single Male/Father | 268 (7.1%) | 3.29 |
| Single Female/Mother | 544 (14.5%) | 3.27 |
| Total Families | 3,759 (100.0%) | 3.12 |
Median Household Size in Alleghany County
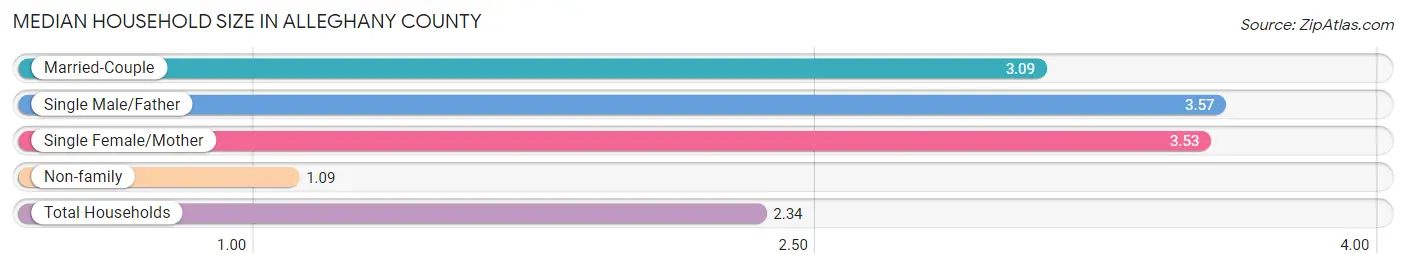
The median household size in Alleghany County is 2.34 persons per household, with single male/father households (268 | 4.3%) accounting for the largest median household size of 3.57 persons per household. non-family households (2,550 | 40.4%) represent the smallest median household size with 1.09 persons per household.
| Household Type | # Households | Household Size |
| Married-Couple | 2,947 (46.7%) | 3.09 |
| Single Male/Father | 268 (4.3%) | 3.57 |
| Single Female/Mother | 544 (8.6%) | 3.53 |
| Non-family | 2,550 (40.4%) | 1.09 |
| Total Households | 6,309 (100.0%) | 2.34 |
Household Size by Marriage Status in Alleghany County
Out of a total of 6,309 households in Alleghany County, 3,759 (59.6%) are family households, while 2,550 (40.4%) are nonfamily households. The most numerous type of family households are 2-person households, comprising 2,051, and the most common type of nonfamily households are 1-person households, comprising 2,353.
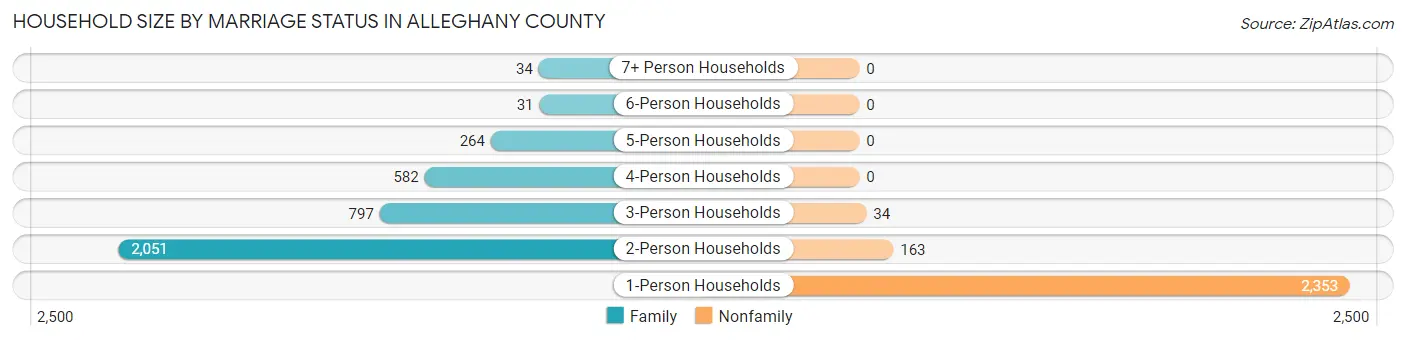
| Household Size | Family Households | Nonfamily Households |
| 1-Person Households | - | 2,353 (37.3%) |
| 2-Person Households | 2,051 (32.5%) | 163 (2.6%) |
| 3-Person Households | 797 (12.6%) | 34 (0.5%) |
| 4-Person Households | 582 (9.2%) | 0 (0.0%) |
| 5-Person Households | 264 (4.2%) | 0 (0.0%) |
| 6-Person Households | 31 (0.5%) | 0 (0.0%) |
| 7+ Person Households | 34 (0.5%) | 0 (0.0%) |
| Total | 3,759 (59.6%) | 2,550 (40.4%) |
Female Fertility in Alleghany County
Fertility by Age in Alleghany County
Average fertility rate in Alleghany County is 40.0 births per 1,000 women. Women in the age bracket of 20 to 34 years have the highest fertility rate with 87.0 births per 1,000 women. Women in the age bracket of 20 to 34 years acount for 86.2% of all women with births.
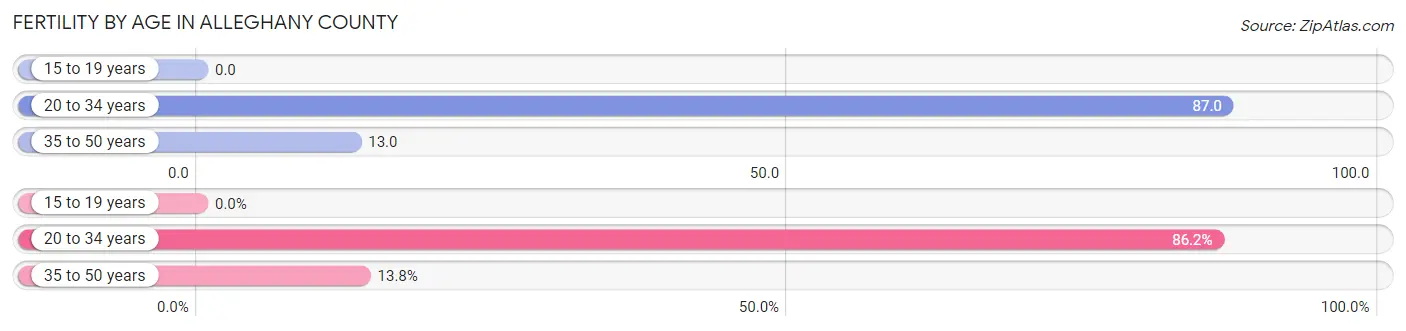
| Age Bracket | Women with Births | Births / 1,000 Women |
| 15 to 19 years | 0 (0.0%) | 0.0 |
| 20 to 34 years | 100 (86.2%) | 87.0 |
| 35 to 50 years | 16 (13.8%) | 13.0 |
| Total | 116 (100.0%) | 40.0 |
Fertility by Age by Marriage Status in Alleghany County
47.4% of women with births (116) in Alleghany County are married. The highest percentage of unmarried women with births falls into 20 to 34 years age bracket with 61.0% of them unmarried at the time of birth, while the lowest percentage of unmarried women with births belong to 35 to 50 years age bracket with 0.0% of them unmarried.
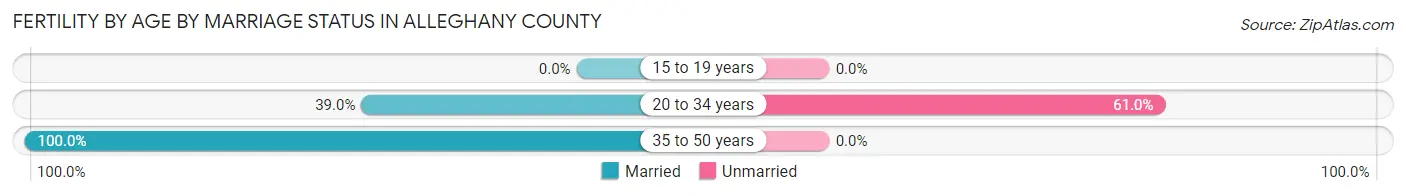
| Age Bracket | Married | Unmarried |
| 15 to 19 years | 0 (0.0%) | 0 (0.0%) |
| 20 to 34 years | 39 (39.0%) | 61 (61.0%) |
| 35 to 50 years | 16 (100.0%) | 0 (0.0%) |
| Total | 55 (47.4%) | 61 (52.6%) |
Fertility by Education in Alleghany County
Average fertility rate in Alleghany County is 40.0 births per 1,000 women. Women with the education attainment of bachelor's degree have the highest fertility rate of 99.0 births per 1,000 women, while women with the education attainment of college or associate's degree have the lowest fertility at 11.0 births per 1,000 women. Women with the education attainment of high school diploma represent 41.4% of all women with births.
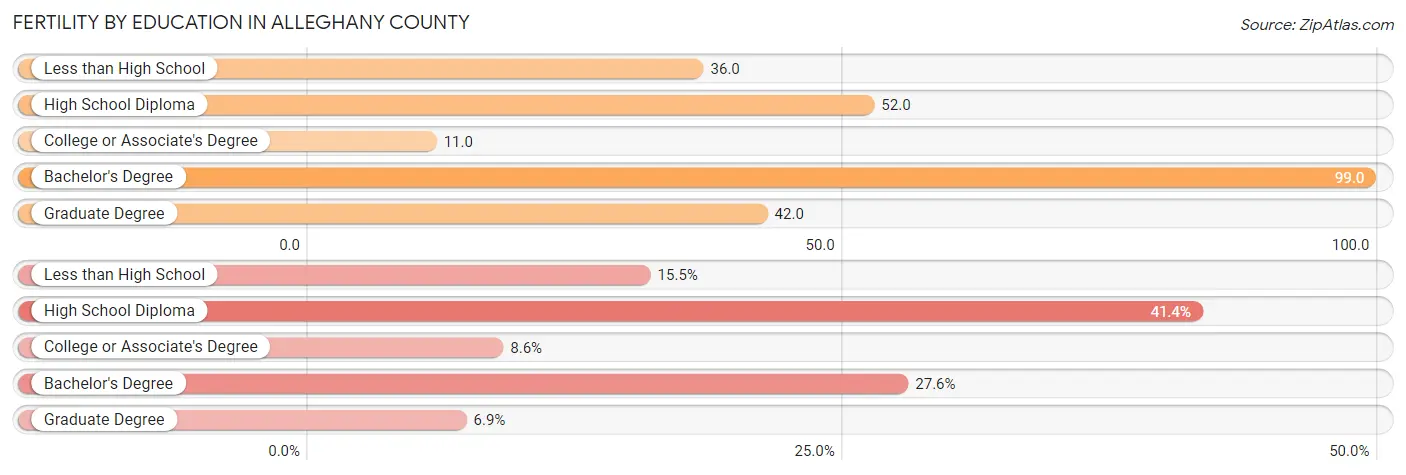
| Educational Attainment | Women with Births | Births / 1,000 Women |
| Less than High School | 18 (15.5%) | 36.0 |
| High School Diploma | 48 (41.4%) | 52.0 |
| College or Associate's Degree | 10 (8.6%) | 11.0 |
| Bachelor's Degree | 32 (27.6%) | 99.0 |
| Graduate Degree | 8 (6.9%) | 42.0 |
| Total | 116 (100.0%) | 40.0 |
Fertility by Education by Marriage Status in Alleghany County
52.6% of women with births in Alleghany County are unmarried. Women with the educational attainment of graduate degree are most likely to be married with 100.0% of them married at childbirth, while women with the educational attainment of high school diploma are least likely to be married with 100.0% of them unmarried at childbirth.
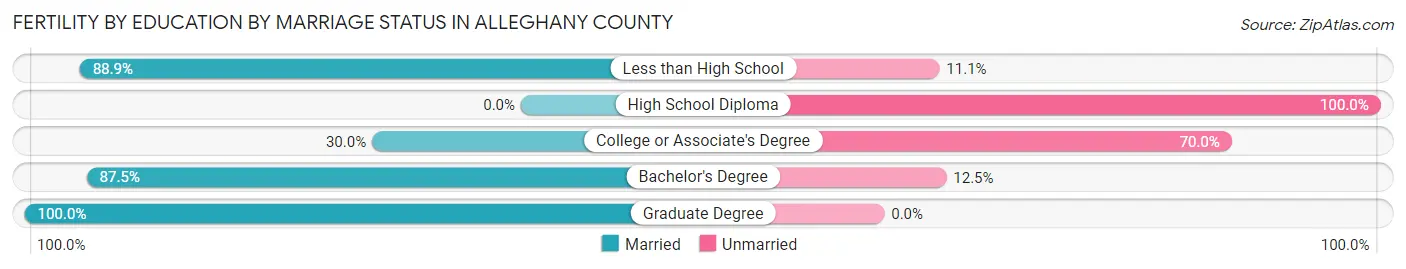
| Educational Attainment | Married | Unmarried |
| Less than High School | 16 (88.9%) | 2 (11.1%) |
| High School Diploma | 0 (0.0%) | 48 (100.0%) |
| College or Associate's Degree | 3 (30.0%) | 7 (70.0%) |
| Bachelor's Degree | 28 (87.5%) | 4 (12.5%) |
| Graduate Degree | 8 (100.0%) | 0 (0.0%) |
| Total | 55 (47.4%) | 61 (52.6%) |
Employment Characteristics in Alleghany County
Employment by Class of Employer in Alleghany County
Among the 6,007 employed individuals in Alleghany County, private company employees (3,851 | 64.1%), local government employees (811 | 13.5%), and not-for-profit organizations (451 | 7.5%) make up the most common classes of employment.
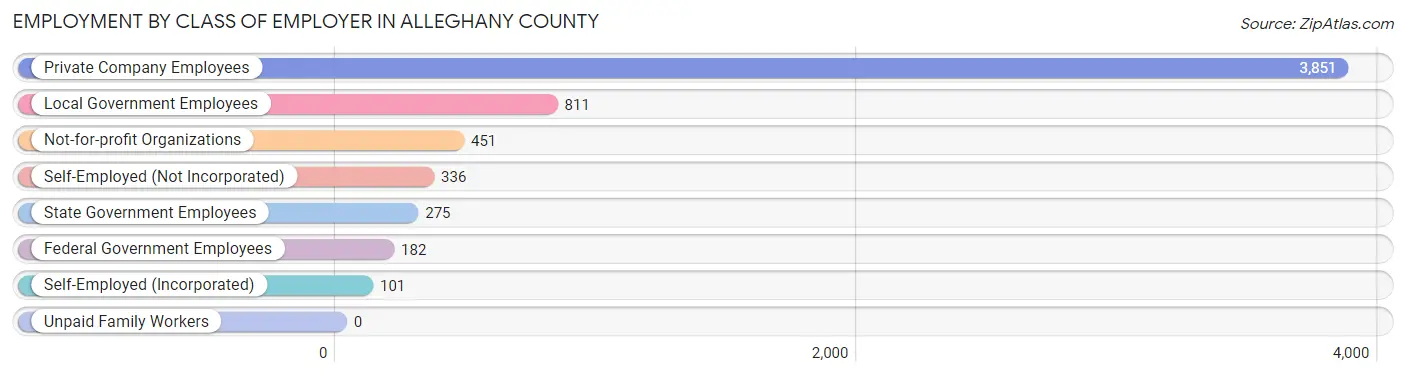
| Employer Class | # Employees | % Employees |
| Private Company Employees | 3,851 | 64.1% |
| Self-Employed (Incorporated) | 101 | 1.7% |
| Self-Employed (Not Incorporated) | 336 | 5.6% |
| Not-for-profit Organizations | 451 | 7.5% |
| Local Government Employees | 811 | 13.5% |
| State Government Employees | 275 | 4.6% |
| Federal Government Employees | 182 | 3.0% |
| Unpaid Family Workers | 0 | 0.0% |
| Total | 6,007 | 100.0% |
Employment Status by Age in Alleghany County
According to the labor force statistics for Alleghany County, out of the total population over 16 years of age (12,657), 49.9% or 6,316 individuals are in the labor force, with 3.7% or 234 of them unemployed. The age group with the highest labor force participation rate is 45 to 54 years, with 79.7% or 1,522 individuals in the labor force. Within the labor force, the 16 to 19 years age range has the highest percentage of unemployed individuals, with 12.5% or 13 of them being unemployed.
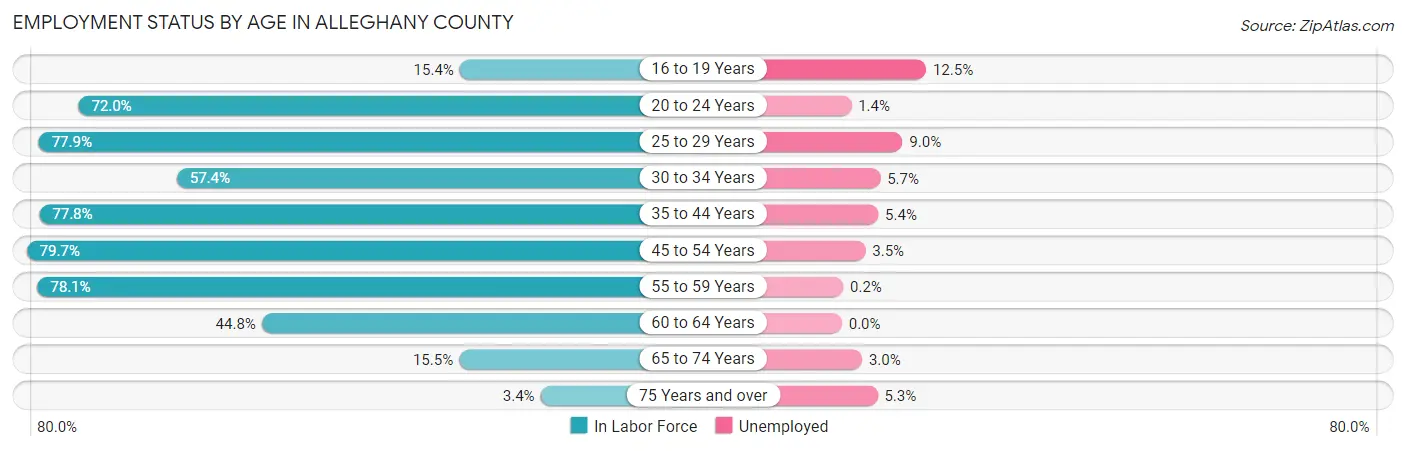
| Age Bracket | In Labor Force | Unemployed |
| 16 to 19 Years | 104 (15.4%) | 13 (12.5%) |
| 20 to 24 Years | 590 (72.0%) | 8 (1.4%) |
| 25 to 29 Years | 670 (77.9%) | 60 (9.0%) |
| 30 to 34 Years | 421 (57.4%) | 24 (5.7%) |
| 35 to 44 Years | 1,114 (77.8%) | 60 (5.4%) |
| 45 to 54 Years | 1,522 (79.7%) | 53 (3.5%) |
| 55 to 59 Years | 980 (78.1%) | 2 (0.2%) |
| 60 to 64 Years | 522 (44.8%) | 0 (0.0%) |
| 65 to 74 Years | 333 (15.5%) | 10 (3.0%) |
| 75 Years and over | 56 (3.4%) | 3 (5.3%) |
| Total | 6,316 (49.9%) | 234 (3.7%) |
Employment Status by Educational Attainment in Alleghany County
According to labor force statistics for Alleghany County, 71.1% of individuals (5,230) out of the total population between 25 and 64 years of age (7,356) are in the labor force, with 3.8% or 199 of them being unemployed. The group with the highest labor force participation rate are those with the educational attainment of bachelor's degree or higher, with 84.5% or 901 individuals in the labor force. Within the labor force, individuals with less than high school education have the highest percentage of unemployment, with 16.3% or 51 of them being unemployed.
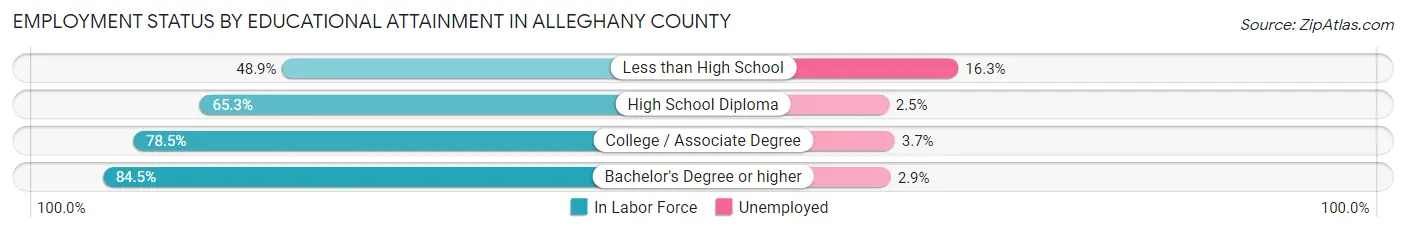
| Educational Attainment | In Labor Force | Unemployed |
| Less than High School | 313 (48.9%) | 104 (16.3%) |
| High School Diploma | 2,076 (65.3%) | 79 (2.5%) |
| College / Associate Degree | 1,940 (78.5%) | 91 (3.7%) |
| Bachelor's Degree or higher | 901 (84.5%) | 31 (2.9%) |
| Total | 5,230 (71.1%) | 280 (3.8%) |
Employment Occupations by Sex in Alleghany County
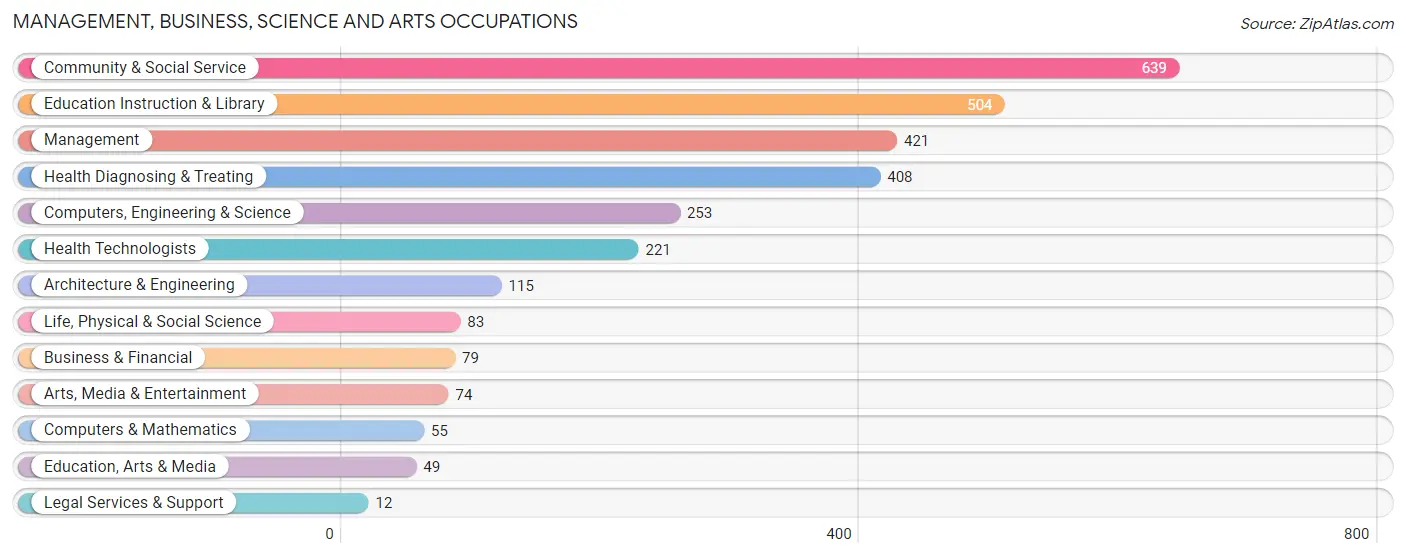
Management, Business, Science and Arts Occupations
The most common Management, Business, Science and Arts occupations in Alleghany County are Community & Social Service (639 | 10.5%), Education Instruction & Library (504 | 8.3%), Management (421 | 7.0%), Health Diagnosing & Treating (408 | 6.7%), and Computers, Engineering & Science (253 | 4.2%).
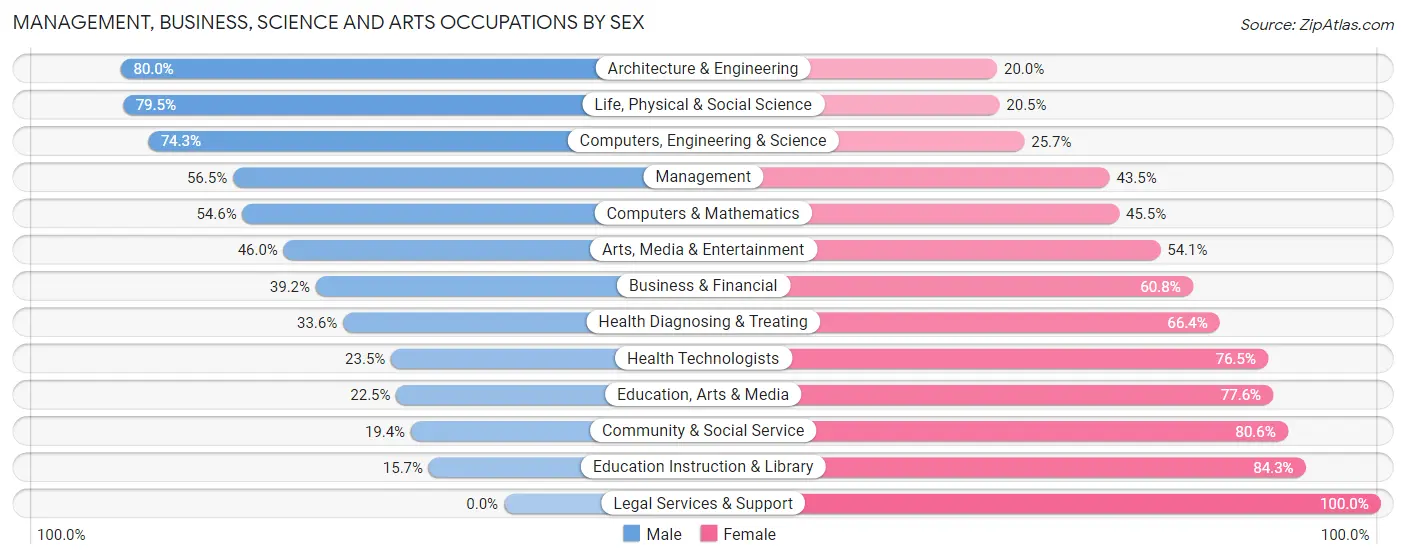
Management, Business, Science and Arts Occupations by Sex
Within the Management, Business, Science and Arts occupations in Alleghany County, the most male-oriented occupations are Architecture & Engineering (80.0%), Life, Physical & Social Science (79.5%), and Computers, Engineering & Science (74.3%), while the most female-oriented occupations are Legal Services & Support (100.0%), Education Instruction & Library (84.3%), and Community & Social Service (80.6%).
| Occupation | Male | Female |
| Management | 238 (56.5%) | 183 (43.5%) |
| Business & Financial | 31 (39.2%) | 48 (60.8%) |
| Computers, Engineering & Science | 188 (74.3%) | 65 (25.7%) |
| Computers & Mathematics | 30 (54.5%) | 25 (45.5%) |
| Architecture & Engineering | 92 (80.0%) | 23 (20.0%) |
| Life, Physical & Social Science | 66 (79.5%) | 17 (20.5%) |
| Community & Social Service | 124 (19.4%) | 515 (80.6%) |
| Education, Arts & Media | 11 (22.5%) | 38 (77.5%) |
| Legal Services & Support | 0 (0.0%) | 12 (100.0%) |
| Education Instruction & Library | 79 (15.7%) | 425 (84.3%) |
| Arts, Media & Entertainment | 34 (46.0%) | 40 (54.0%) |
| Health Diagnosing & Treating | 137 (33.6%) | 271 (66.4%) |
| Health Technologists | 52 (23.5%) | 169 (76.5%) |
| Total (Category) | 718 (39.9%) | 1,082 (60.1%) |
| Total (Overall) | 3,277 (54.1%) | 2,783 (45.9%) |
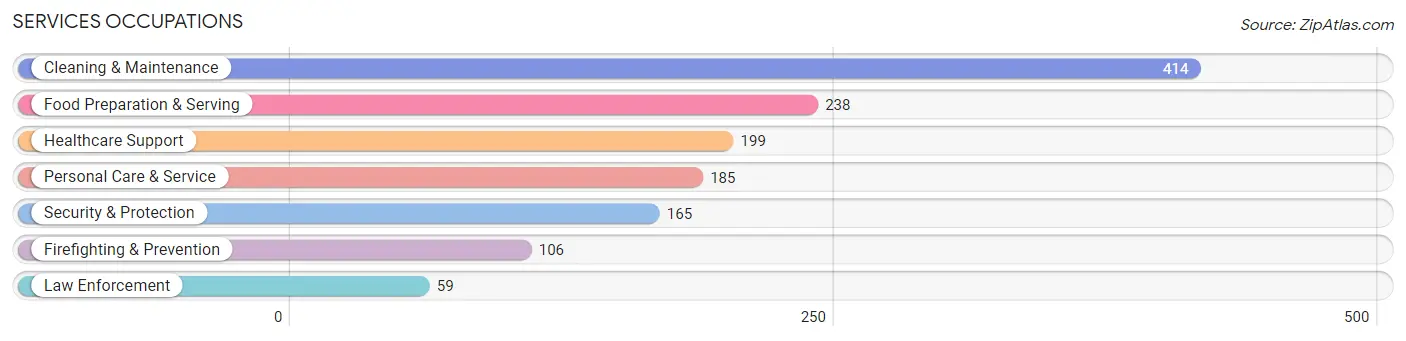
Services Occupations
The most common Services occupations in Alleghany County are Cleaning & Maintenance (414 | 6.8%), Food Preparation & Serving (238 | 3.9%), Healthcare Support (199 | 3.3%), Personal Care & Service (185 | 3.0%), and Security & Protection (165 | 2.7%).
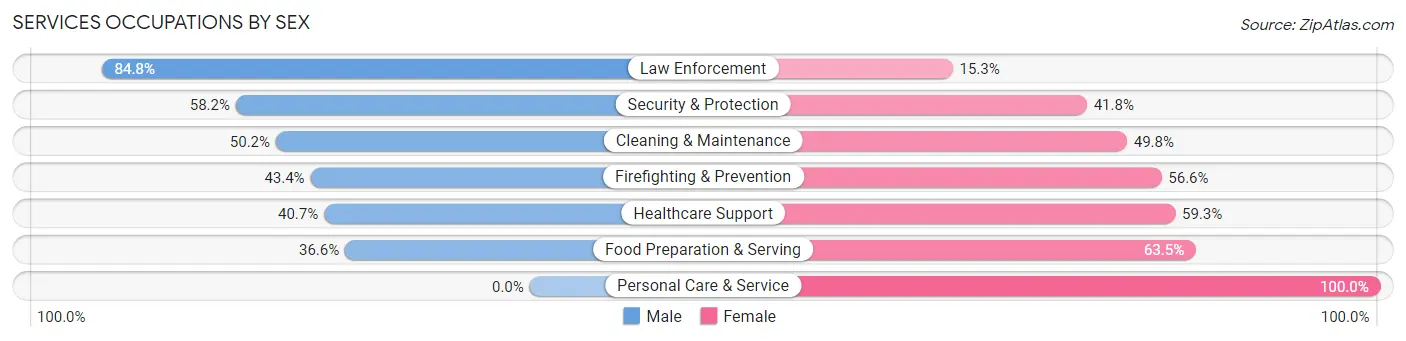
Services Occupations by Sex
Within the Services occupations in Alleghany County, the most male-oriented occupations are Law Enforcement (84.8%), Security & Protection (58.2%), and Cleaning & Maintenance (50.2%), while the most female-oriented occupations are Personal Care & Service (100.0%), Food Preparation & Serving (63.4%), and Healthcare Support (59.3%).
| Occupation | Male | Female |
| Healthcare Support | 81 (40.7%) | 118 (59.3%) |
| Security & Protection | 96 (58.2%) | 69 (41.8%) |
| Firefighting & Prevention | 46 (43.4%) | 60 (56.6%) |
| Law Enforcement | 50 (84.8%) | 9 (15.2%) |
| Food Preparation & Serving | 87 (36.5%) | 151 (63.4%) |
| Cleaning & Maintenance | 208 (50.2%) | 206 (49.8%) |
| Personal Care & Service | 0 (0.0%) | 185 (100.0%) |
| Total (Category) | 472 (39.3%) | 729 (60.7%) |
| Total (Overall) | 3,277 (54.1%) | 2,783 (45.9%) |
Sales and Office Occupations
The most common Sales and Office occupations in Alleghany County are Office & Administration (683 | 11.3%), and Sales & Related (271 | 4.5%).

Sales and Office Occupations by Sex

| Occupation | Male | Female |
| Sales & Related | 163 (60.2%) | 108 (39.9%) |
| Office & Administration | 97 (14.2%) | 586 (85.8%) |
| Total (Category) | 260 (27.3%) | 694 (72.8%) |
| Total (Overall) | 3,277 (54.1%) | 2,783 (45.9%) |
Natural Resources, Construction and Maintenance Occupations
The most common Natural Resources, Construction and Maintenance occupations in Alleghany County are Construction & Extraction (381 | 6.3%), Installation, Maintenance & Repair (252 | 4.2%), and Farming, Fishing & Forestry (89 | 1.5%).
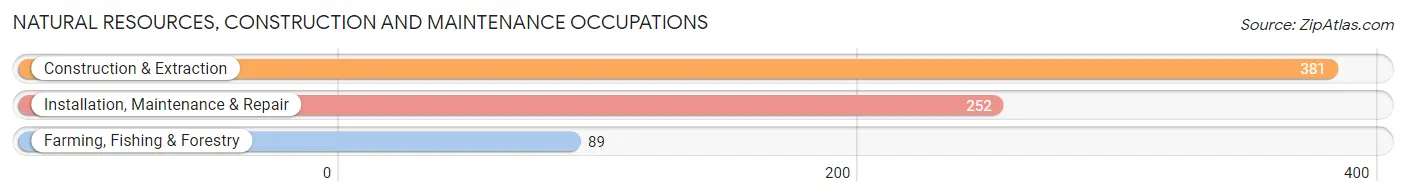
Natural Resources, Construction and Maintenance Occupations by Sex
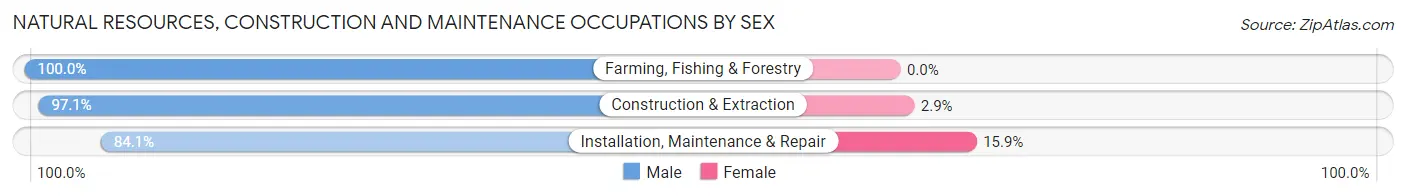
| Occupation | Male | Female |
| Farming, Fishing & Forestry | 89 (100.0%) | 0 (0.0%) |
| Construction & Extraction | 370 (97.1%) | 11 (2.9%) |
| Installation, Maintenance & Repair | 212 (84.1%) | 40 (15.9%) |
| Total (Category) | 671 (92.9%) | 51 (7.1%) |
| Total (Overall) | 3,277 (54.1%) | 2,783 (45.9%) |
Production, Transportation and Moving Occupations
The most common Production, Transportation and Moving occupations in Alleghany County are Production (804 | 13.3%), Material Moving (317 | 5.2%), and Transportation (262 | 4.3%).
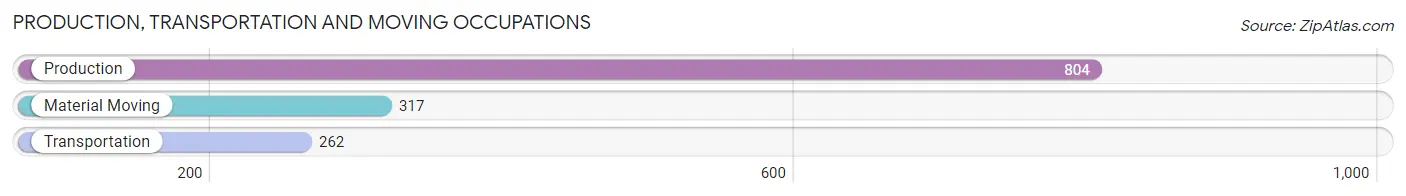
Production, Transportation and Moving Occupations by Sex
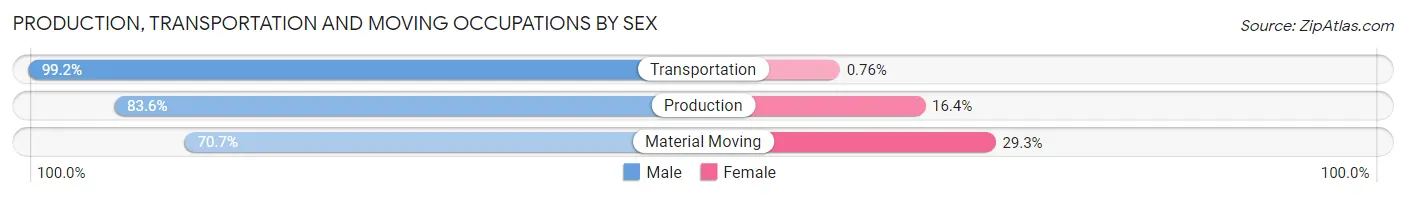
| Occupation | Male | Female |
| Production | 672 (83.6%) | 132 (16.4%) |
| Transportation | 260 (99.2%) | 2 (0.8%) |
| Material Moving | 224 (70.7%) | 93 (29.3%) |
| Total (Category) | 1,156 (83.6%) | 227 (16.4%) |
| Total (Overall) | 3,277 (54.1%) | 2,783 (45.9%) |
Employment Industries by Sex in Alleghany County
Employment Industries in Alleghany County
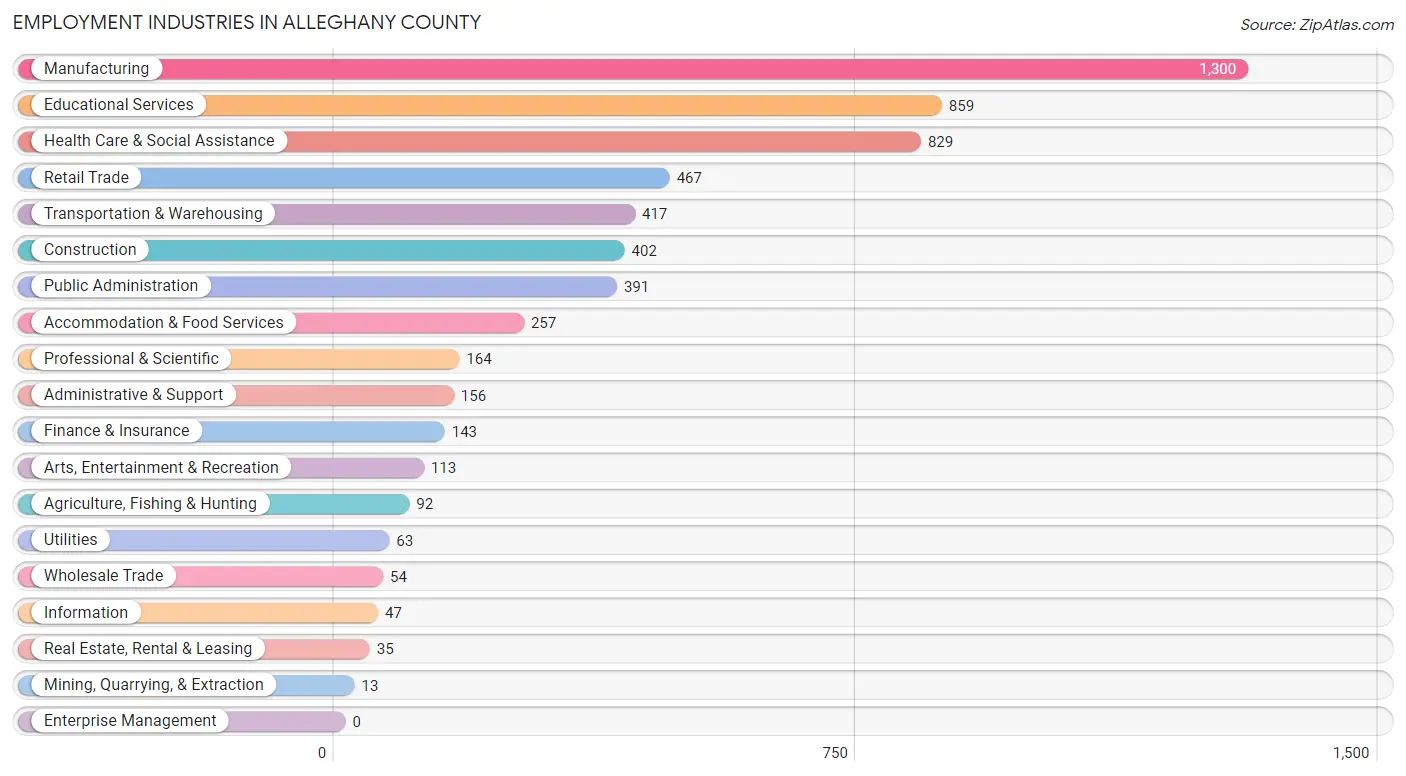
The major employment industries in Alleghany County include Manufacturing (1,300 | 21.4%), Educational Services (859 | 14.2%), Health Care & Social Assistance (829 | 13.7%), Retail Trade (467 | 7.7%), and Transportation & Warehousing (417 | 6.9%).
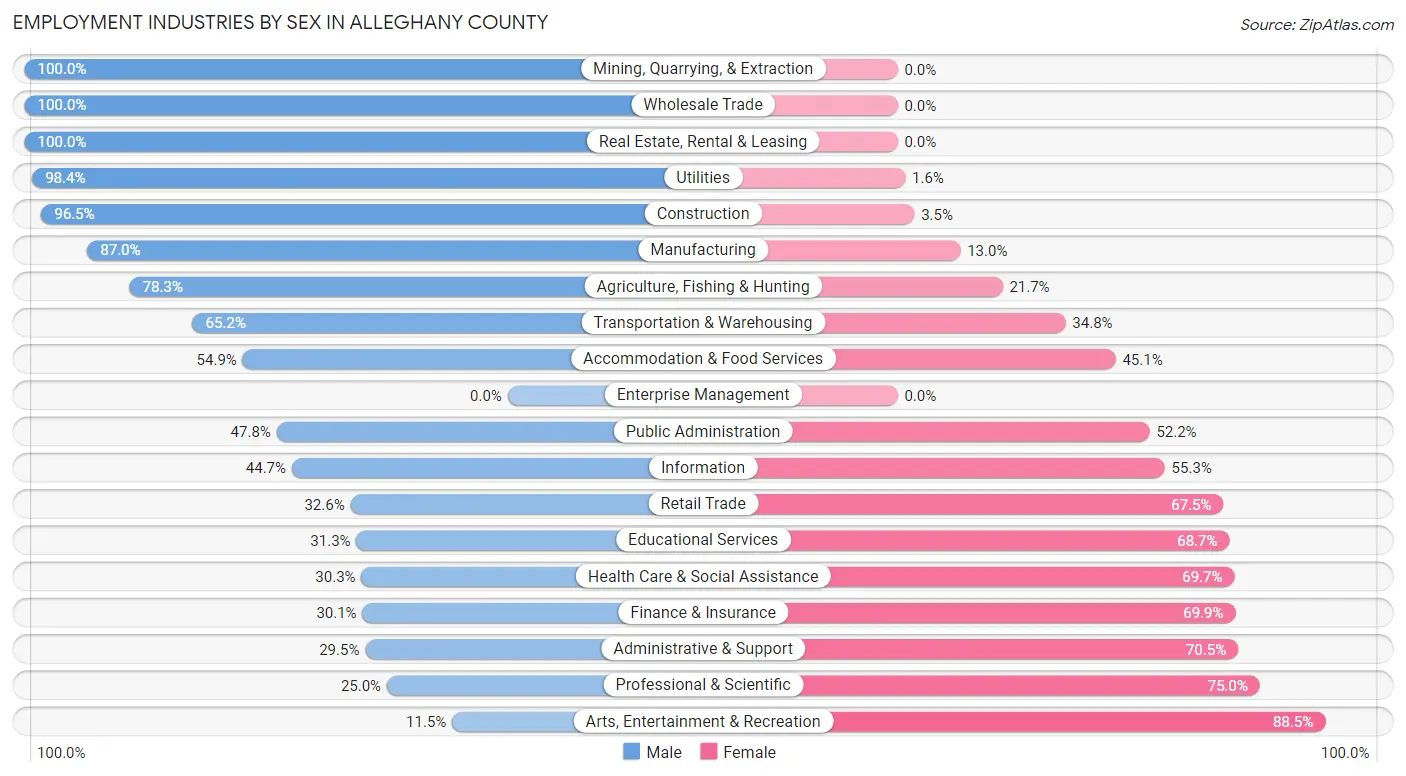
Employment Industries by Sex in Alleghany County
The Alleghany County industries that see more men than women are Mining, Quarrying, & Extraction (100.0%), Wholesale Trade (100.0%), and Real Estate, Rental & Leasing (100.0%), whereas the industries that tend to have a higher number of women are Arts, Entertainment & Recreation (88.5%), Professional & Scientific (75.0%), and Administrative & Support (70.5%).
| Industry | Male | Female |
| Agriculture, Fishing & Hunting | 72 (78.3%) | 20 (21.7%) |
| Mining, Quarrying, & Extraction | 13 (100.0%) | 0 (0.0%) |
| Construction | 388 (96.5%) | 14 (3.5%) |
| Manufacturing | 1,131 (87.0%) | 169 (13.0%) |
| Wholesale Trade | 54 (100.0%) | 0 (0.0%) |
| Retail Trade | 152 (32.6%) | 315 (67.4%) |
| Transportation & Warehousing | 272 (65.2%) | 145 (34.8%) |
| Utilities | 62 (98.4%) | 1 (1.6%) |
| Information | 21 (44.7%) | 26 (55.3%) |
| Finance & Insurance | 43 (30.1%) | 100 (69.9%) |
| Real Estate, Rental & Leasing | 35 (100.0%) | 0 (0.0%) |
| Professional & Scientific | 41 (25.0%) | 123 (75.0%) |
| Enterprise Management | 0 (0.0%) | 0 (0.0%) |
| Administrative & Support | 46 (29.5%) | 110 (70.5%) |
| Educational Services | 269 (31.3%) | 590 (68.7%) |
| Health Care & Social Assistance | 251 (30.3%) | 578 (69.7%) |
| Arts, Entertainment & Recreation | 13 (11.5%) | 100 (88.5%) |
| Accommodation & Food Services | 141 (54.9%) | 116 (45.1%) |
| Public Administration | 187 (47.8%) | 204 (52.2%) |
| Total | 3,277 (54.1%) | 2,783 (45.9%) |
Education in Alleghany County
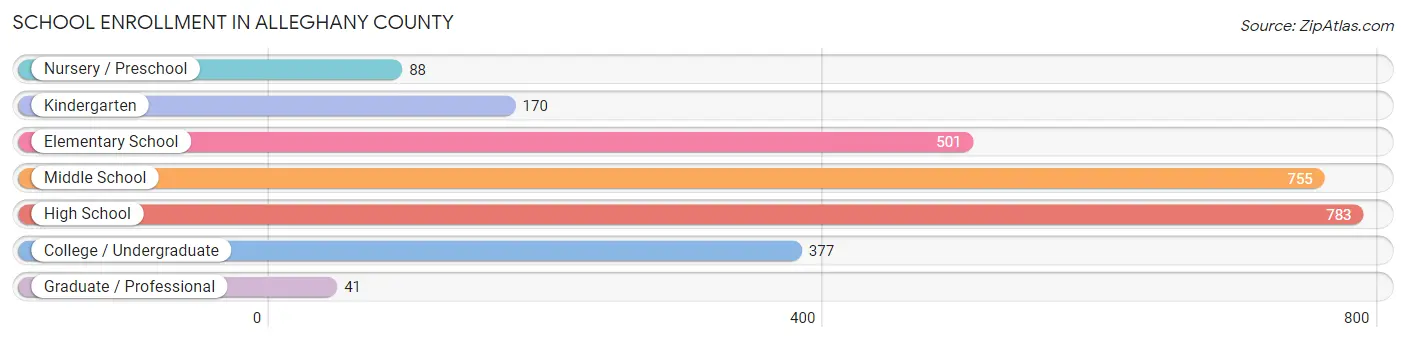
School Enrollment in Alleghany County
The most common levels of schooling among the 2,715 students in Alleghany County are high school (783 | 28.8%), middle school (755 | 27.8%), and elementary school (501 | 18.4%).
| School Level | # Students | % Students |
| Nursery / Preschool | 88 | 3.2% |
| Kindergarten | 170 | 6.3% |
| Elementary School | 501 | 18.4% |
| Middle School | 755 | 27.8% |
| High School | 783 | 28.8% |
| College / Undergraduate | 377 | 13.9% |
| Graduate / Professional | 41 | 1.5% |
| Total | 2,715 | 100.0% |
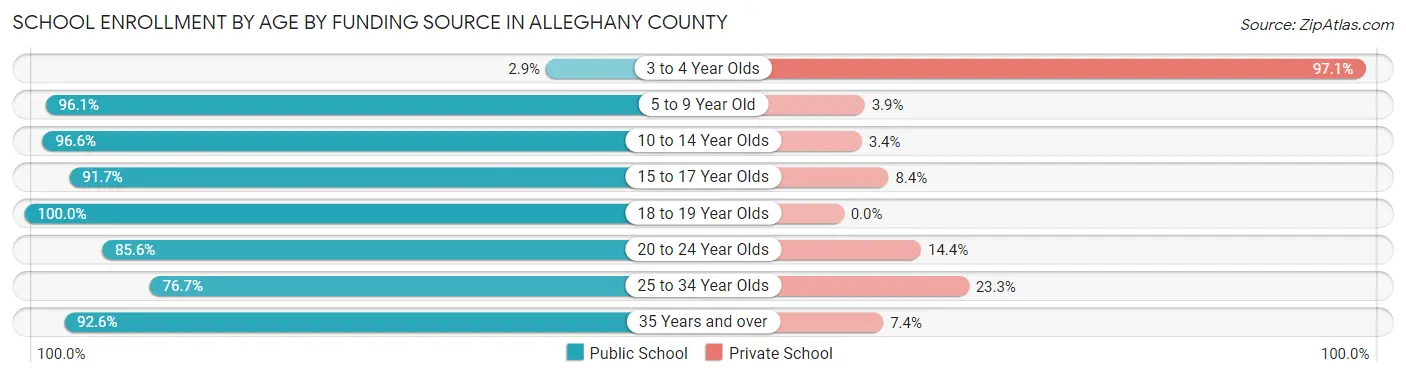
School Enrollment by Age by Funding Source in Alleghany County
Out of a total of 2,715 students who are enrolled in schools in Alleghany County, 223 (8.2%) attend a private institution, while the remaining 2,492 (91.8%) are enrolled in public schools. The age group of 3 to 4 year olds has the highest likelihood of being enrolled in private schools, with 67 (97.1% in the age bracket) enrolled. Conversely, the age group of 18 to 19 year olds has the lowest likelihood of being enrolled in a private school, with 167 (100.0% in the age bracket) attending a public institution.
| Age Bracket | Public School | Private School |
| 3 to 4 Year Olds | 2 (2.9%) | 67 (97.1%) |
| 5 to 9 Year Old | 612 (96.1%) | 25 (3.9%) |
| 10 to 14 Year Olds | 917 (96.6%) | 32 (3.4%) |
| 15 to 17 Year Olds | 461 (91.6%) | 42 (8.4%) |
| 18 to 19 Year Olds | 167 (100.0%) | 0 (0.0%) |
| 20 to 24 Year Olds | 190 (85.6%) | 32 (14.4%) |
| 25 to 34 Year Olds | 56 (76.7%) | 17 (23.3%) |
| 35 Years and over | 88 (92.6%) | 7 (7.4%) |
| Total | 2,492 (91.8%) | 223 (8.2%) |
Educational Attainment by Field of Study in Alleghany County
Education (397 | 20.2%), business (215 | 10.9%), engineering (211 | 10.7%), science & technology (172 | 8.7%), and liberal arts & history (142 | 7.2%) are the most common fields of study among 1,967 individuals in Alleghany County who have obtained a bachelor's degree or higher.
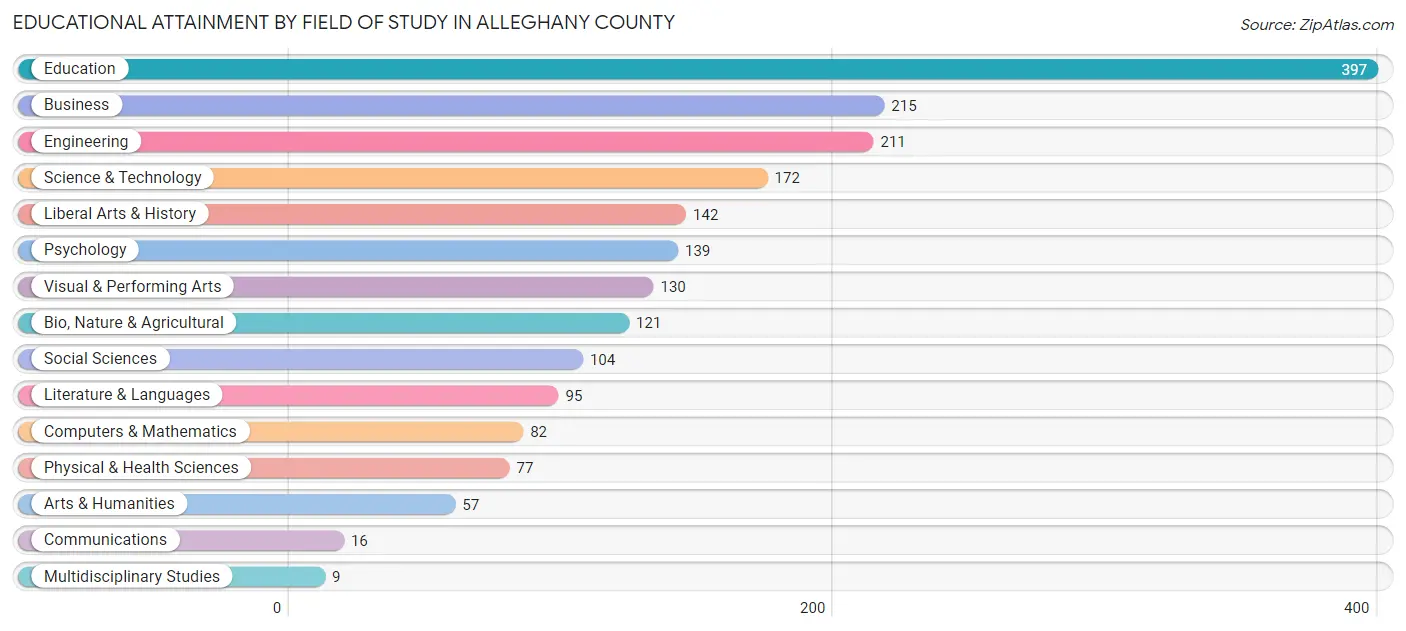
| Field of Study | # Graduates | % Graduates |
| Computers & Mathematics | 82 | 4.2% |
| Bio, Nature & Agricultural | 121 | 6.1% |
| Physical & Health Sciences | 77 | 3.9% |
| Psychology | 139 | 7.1% |
| Social Sciences | 104 | 5.3% |
| Engineering | 211 | 10.7% |
| Multidisciplinary Studies | 9 | 0.5% |
| Science & Technology | 172 | 8.7% |
| Business | 215 | 10.9% |
| Education | 397 | 20.2% |
| Literature & Languages | 95 | 4.8% |
| Liberal Arts & History | 142 | 7.2% |
| Visual & Performing Arts | 130 | 6.6% |
| Communications | 16 | 0.8% |
| Arts & Humanities | 57 | 2.9% |
| Total | 1,967 | 100.0% |
Transportation & Commute in Alleghany County
Vehicle Availability by Sex in Alleghany County
The most prevalent vehicle ownership categories in Alleghany County are males with 3 vehicles (920, accounting for 28.5%) and females with 3 vehicles (813, making up 33.4%).
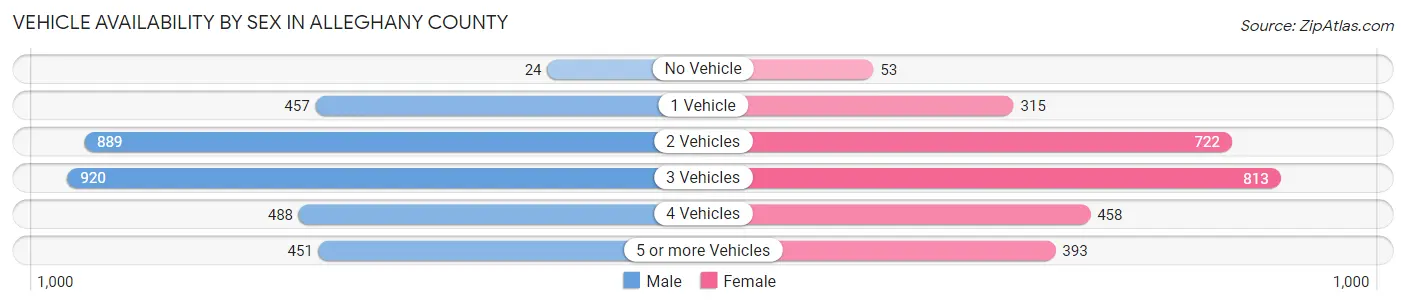
| Vehicles Available | Male | Female |
| No Vehicle | 24 (0.7%) | 53 (1.9%) |
| 1 Vehicle | 457 (14.1%) | 315 (11.4%) |
| 2 Vehicles | 889 (27.5%) | 722 (26.2%) |
| 3 Vehicles | 920 (28.5%) | 813 (29.5%) |
| 4 Vehicles | 488 (15.1%) | 458 (16.6%) |
| 5 or more Vehicles | 451 (14.0%) | 393 (14.3%) |
| Total | 3,229 (100.0%) | 2,754 (100.0%) |
Commute Time in Alleghany County
The most frequently occuring commute durations in Alleghany County are 20 to 24 minutes (1,193 commuters, 20.4%), 15 to 19 minutes (1,181 commuters, 20.2%), and 10 to 14 minutes (933 commuters, 16.0%).
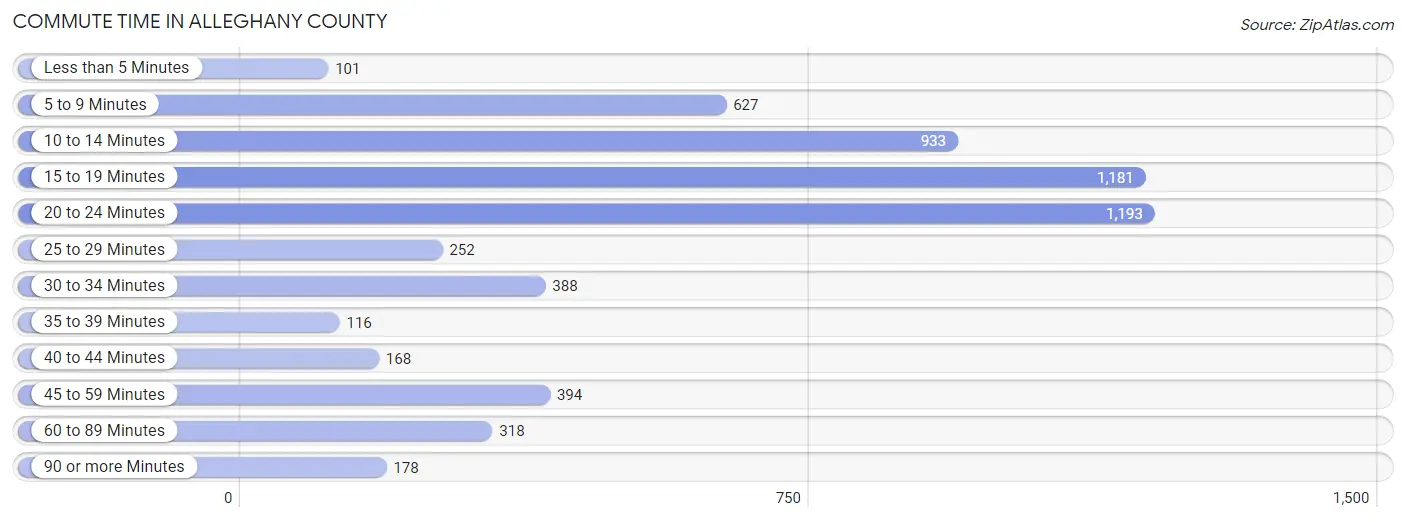
| Commute Time | # Commuters | % Commuters |
| Less than 5 Minutes | 101 | 1.7% |
| 5 to 9 Minutes | 627 | 10.7% |
| 10 to 14 Minutes | 933 | 16.0% |
| 15 to 19 Minutes | 1,181 | 20.2% |
| 20 to 24 Minutes | 1,193 | 20.4% |
| 25 to 29 Minutes | 252 | 4.3% |
| 30 to 34 Minutes | 388 | 6.6% |
| 35 to 39 Minutes | 116 | 2.0% |
| 40 to 44 Minutes | 168 | 2.9% |
| 45 to 59 Minutes | 394 | 6.7% |
| 60 to 89 Minutes | 318 | 5.4% |
| 90 or more Minutes | 178 | 3.0% |
Commute Time by Sex in Alleghany County
The most common commute times in Alleghany County are 20 to 24 minutes (684 commuters, 21.4%) for males and 15 to 19 minutes (519 commuters, 19.5%) for females.
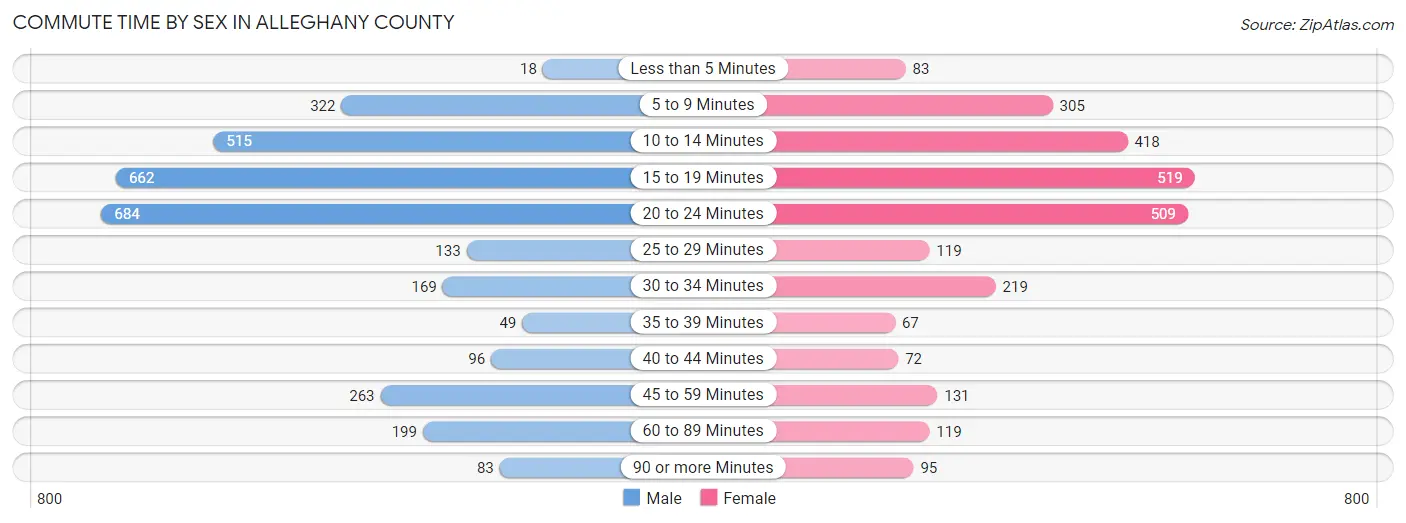
| Commute Time | Male | Female |
| Less than 5 Minutes | 18 (0.6%) | 83 (3.1%) |
| 5 to 9 Minutes | 322 (10.1%) | 305 (11.5%) |
| 10 to 14 Minutes | 515 (16.1%) | 418 (15.7%) |
| 15 to 19 Minutes | 662 (20.7%) | 519 (19.5%) |
| 20 to 24 Minutes | 684 (21.4%) | 509 (19.2%) |
| 25 to 29 Minutes | 133 (4.2%) | 119 (4.5%) |
| 30 to 34 Minutes | 169 (5.3%) | 219 (8.3%) |
| 35 to 39 Minutes | 49 (1.5%) | 67 (2.5%) |
| 40 to 44 Minutes | 96 (3.0%) | 72 (2.7%) |
| 45 to 59 Minutes | 263 (8.2%) | 131 (4.9%) |
| 60 to 89 Minutes | 199 (6.2%) | 119 (4.5%) |
| 90 or more Minutes | 83 (2.6%) | 95 (3.6%) |
Time of Departure to Work by Sex in Alleghany County
The most frequent times of departure to work in Alleghany County are 7:00 AM to 7:29 AM (654, 20.5%) for males and 7:30 AM to 7:59 AM (531, 20.0%) for females.
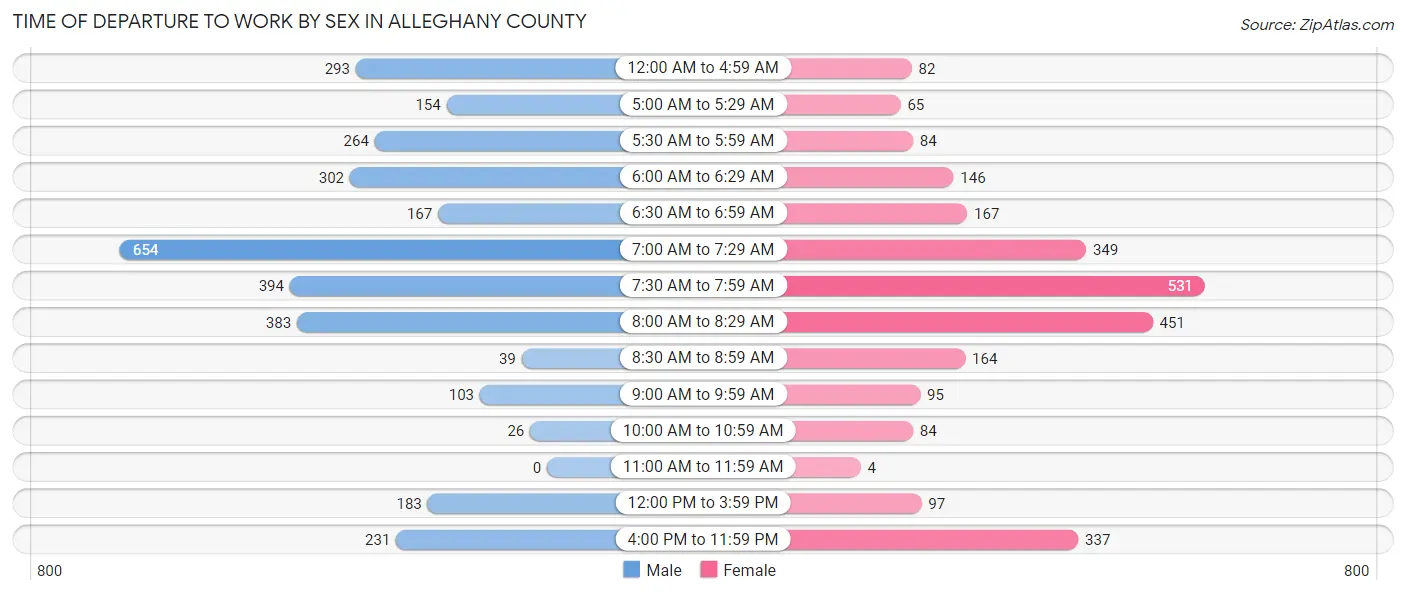
| Time of Departure | Male | Female |
| 12:00 AM to 4:59 AM | 293 (9.2%) | 82 (3.1%) |
| 5:00 AM to 5:29 AM | 154 (4.8%) | 65 (2.5%) |
| 5:30 AM to 5:59 AM | 264 (8.3%) | 84 (3.2%) |
| 6:00 AM to 6:29 AM | 302 (9.5%) | 146 (5.5%) |
| 6:30 AM to 6:59 AM | 167 (5.2%) | 167 (6.3%) |
| 7:00 AM to 7:29 AM | 654 (20.5%) | 349 (13.1%) |
| 7:30 AM to 7:59 AM | 394 (12.3%) | 531 (20.0%) |
| 8:00 AM to 8:29 AM | 383 (12.0%) | 451 (17.0%) |
| 8:30 AM to 8:59 AM | 39 (1.2%) | 164 (6.2%) |
| 9:00 AM to 9:59 AM | 103 (3.2%) | 95 (3.6%) |
| 10:00 AM to 10:59 AM | 26 (0.8%) | 84 (3.2%) |
| 11:00 AM to 11:59 AM | 0 (0.0%) | 4 (0.2%) |
| 12:00 PM to 3:59 PM | 183 (5.7%) | 97 (3.6%) |
| 4:00 PM to 11:59 PM | 231 (7.2%) | 337 (12.7%) |
| Total | 3,193 (100.0%) | 2,656 (100.0%) |
Housing Occupancy in Alleghany County
Occupancy by Ownership in Alleghany County
Of the total 6,309 dwellings in Alleghany County, owner-occupied units account for 5,250 (83.2%), while renter-occupied units make up 1,059 (16.8%).
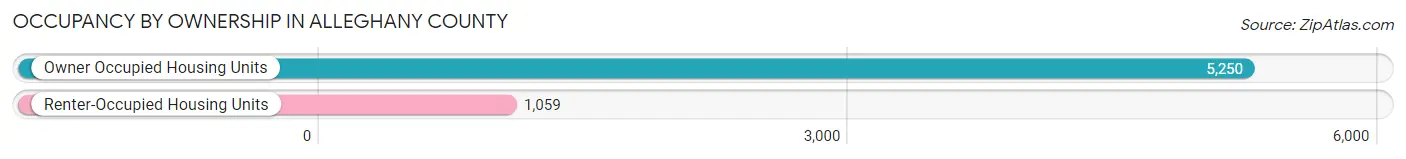
| Occupancy | # Housing Units | % Housing Units |
| Owner Occupied Housing Units | 5,250 | 83.2% |
| Renter-Occupied Housing Units | 1,059 | 16.8% |
| Total Occupied Housing Units | 6,309 | 100.0% |
Occupancy by Household Size in Alleghany County
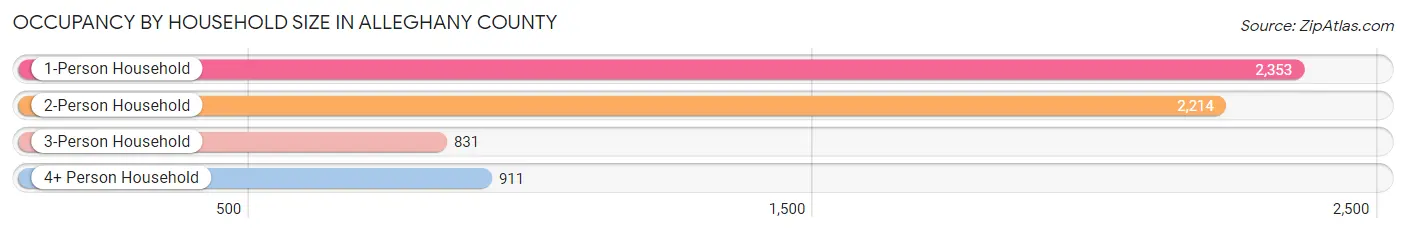
| Household Size | # Housing Units | % Housing Units |
| 1-Person Household | 2,353 | 37.3% |
| 2-Person Household | 2,214 | 35.1% |
| 3-Person Household | 831 | 13.2% |
| 4+ Person Household | 911 | 14.4% |
| Total Housing Units | 6,309 | 100.0% |
Occupancy by Ownership by Household Size in Alleghany County
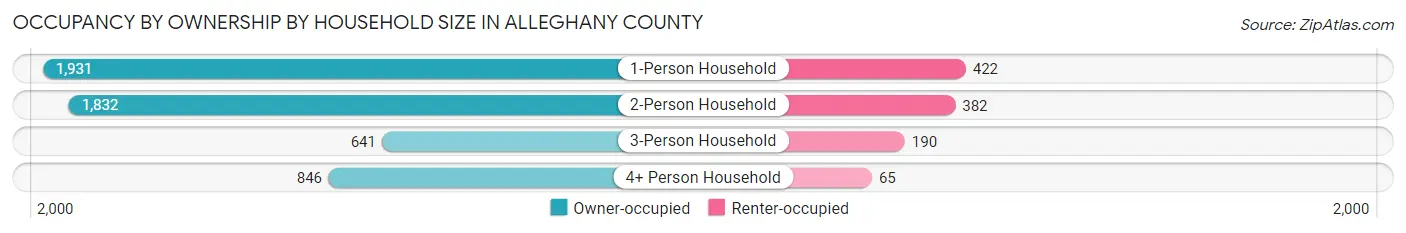
| Household Size | Owner-occupied | Renter-occupied |
| 1-Person Household | 1,931 (82.1%) | 422 (17.9%) |
| 2-Person Household | 1,832 (82.8%) | 382 (17.2%) |
| 3-Person Household | 641 (77.1%) | 190 (22.9%) |
| 4+ Person Household | 846 (92.9%) | 65 (7.1%) |
| Total Housing Units | 5,250 (83.2%) | 1,059 (16.8%) |
Occupancy by Educational Attainment in Alleghany County
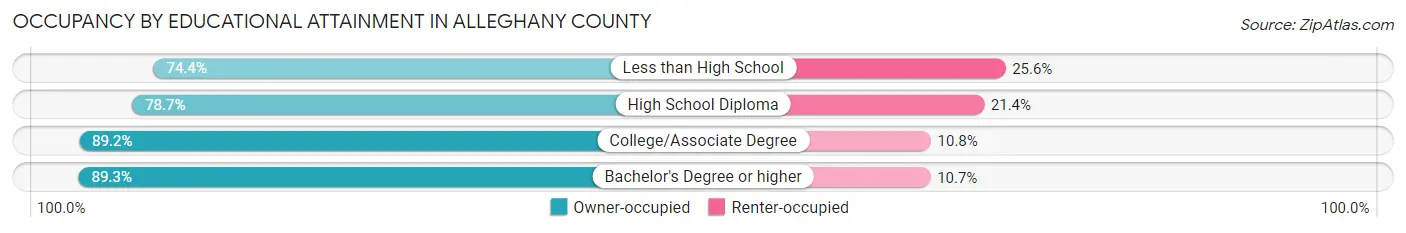
| Household Size | Owner-occupied | Renter-occupied |
| Less than High School | 480 (74.4%) | 165 (25.6%) |
| High School Diploma | 2,111 (78.6%) | 573 (21.3%) |
| College/Associate Degree | 1,809 (89.2%) | 219 (10.8%) |
| Bachelor's Degree or higher | 850 (89.3%) | 102 (10.7%) |
Occupancy by Age of Householder in Alleghany County
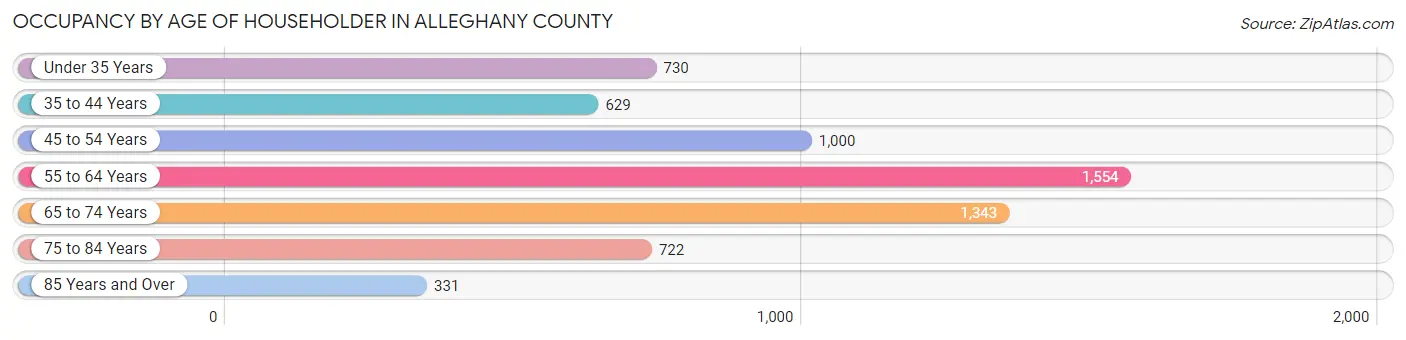
| Age Bracket | # Households | % Households |
| Under 35 Years | 730 | 11.6% |
| 35 to 44 Years | 629 | 10.0% |
| 45 to 54 Years | 1,000 | 15.9% |
| 55 to 64 Years | 1,554 | 24.6% |
| 65 to 74 Years | 1,343 | 21.3% |
| 75 to 84 Years | 722 | 11.4% |
| 85 Years and Over | 331 | 5.2% |
| Total | 6,309 | 100.0% |
Housing Finances in Alleghany County
Median Income by Occupancy in Alleghany County
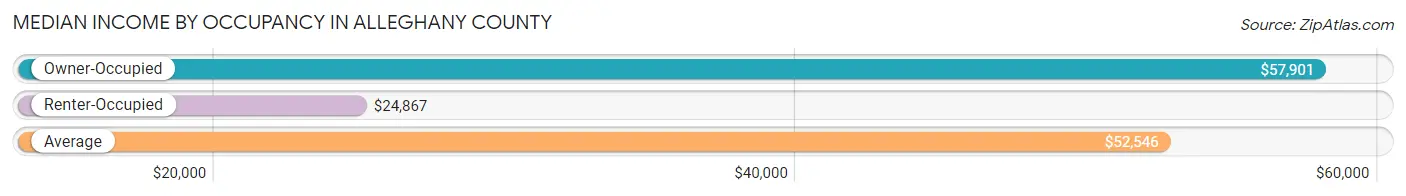
| Occupancy Type | # Households | Median Income |
| Owner-Occupied | 5,250 (83.2%) | $57,901 |
| Renter-Occupied | 1,059 (16.8%) | $24,867 |
| Average | 6,309 (100.0%) | $52,546 |
Occupancy by Householder Income Bracket in Alleghany County
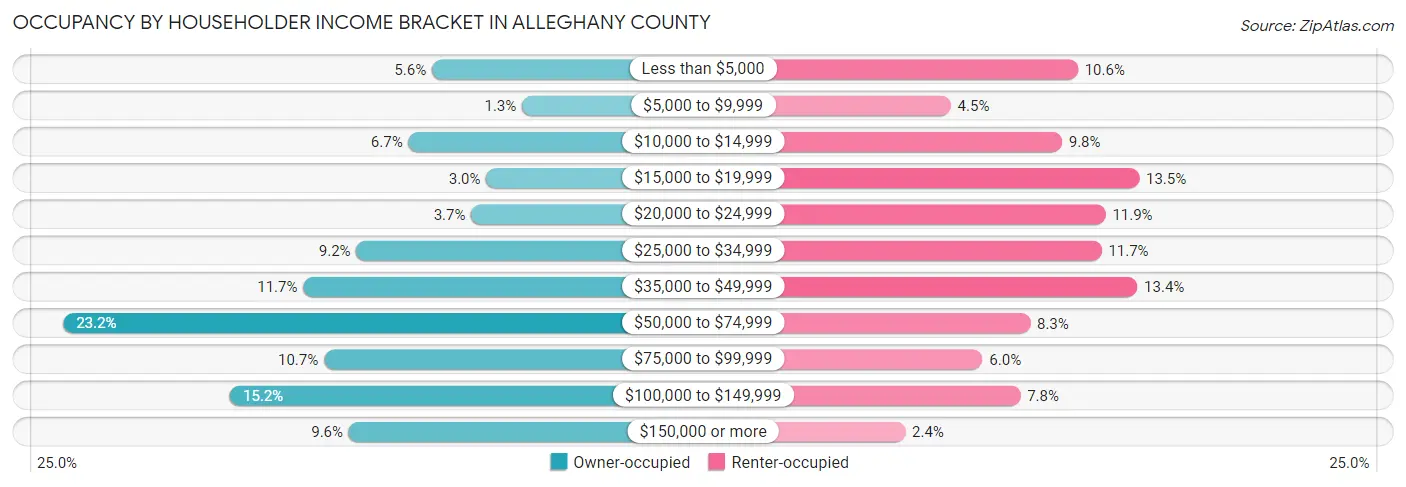
| Income Bracket | Owner-occupied | Renter-occupied |
| Less than $5,000 | 294 (5.6%) | 112 (10.6%) |
| $5,000 to $9,999 | 69 (1.3%) | 48 (4.5%) |
| $10,000 to $14,999 | 353 (6.7%) | 104 (9.8%) |
| $15,000 to $19,999 | 158 (3.0%) | 143 (13.5%) |
| $20,000 to $24,999 | 196 (3.7%) | 126 (11.9%) |
| $25,000 to $34,999 | 483 (9.2%) | 124 (11.7%) |
| $35,000 to $49,999 | 616 (11.7%) | 142 (13.4%) |
| $50,000 to $74,999 | 1,216 (23.2%) | 88 (8.3%) |
| $75,000 to $99,999 | 564 (10.7%) | 64 (6.0%) |
| $100,000 to $149,999 | 799 (15.2%) | 83 (7.8%) |
| $150,000 or more | 502 (9.6%) | 25 (2.4%) |
| Total | 5,250 (100.0%) | 1,059 (100.0%) |
Monthly Housing Cost Tiers in Alleghany County
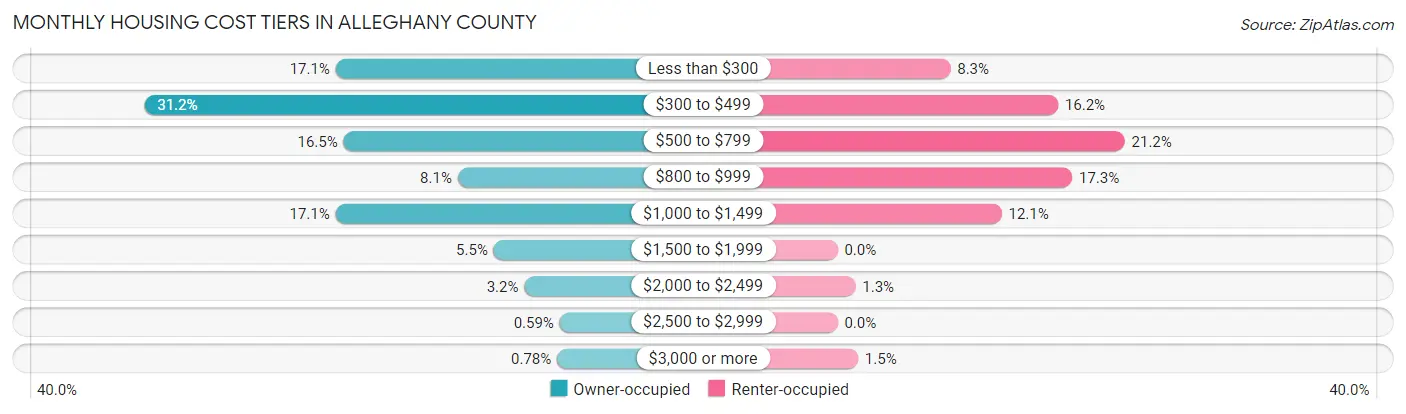
| Monthly Cost | Owner-occupied | Renter-occupied |
| Less than $300 | 897 (17.1%) | 88 (8.3%) |
| $300 to $499 | 1,637 (31.2%) | 172 (16.2%) |
| $500 to $799 | 867 (16.5%) | 224 (21.1%) |
| $800 to $999 | 425 (8.1%) | 183 (17.3%) |
| $1,000 to $1,499 | 898 (17.1%) | 128 (12.1%) |
| $1,500 to $1,999 | 286 (5.4%) | 0 (0.0%) |
| $2,000 to $2,499 | 168 (3.2%) | 14 (1.3%) |
| $2,500 to $2,999 | 31 (0.6%) | 0 (0.0%) |
| $3,000 or more | 41 (0.8%) | 16 (1.5%) |
| Total | 5,250 (100.0%) | 1,059 (100.0%) |
Physical Housing Characteristics in Alleghany County
Housing Structures in Alleghany County
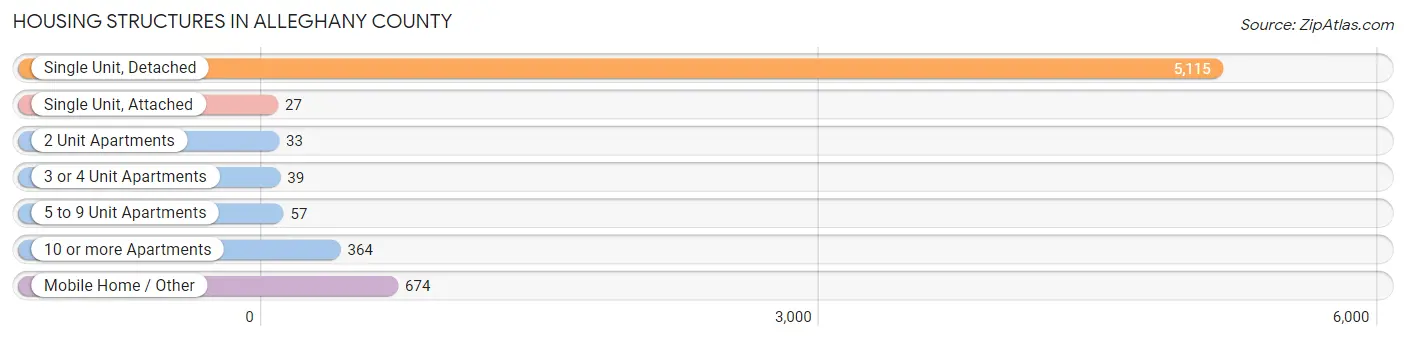
| Structure Type | # Housing Units | % Housing Units |
| Single Unit, Detached | 5,115 | 81.1% |
| Single Unit, Attached | 27 | 0.4% |
| 2 Unit Apartments | 33 | 0.5% |
| 3 or 4 Unit Apartments | 39 | 0.6% |
| 5 to 9 Unit Apartments | 57 | 0.9% |
| 10 or more Apartments | 364 | 5.8% |
| Mobile Home / Other | 674 | 10.7% |
| Total | 6,309 | 100.0% |
Housing Structures by Occupancy in Alleghany County
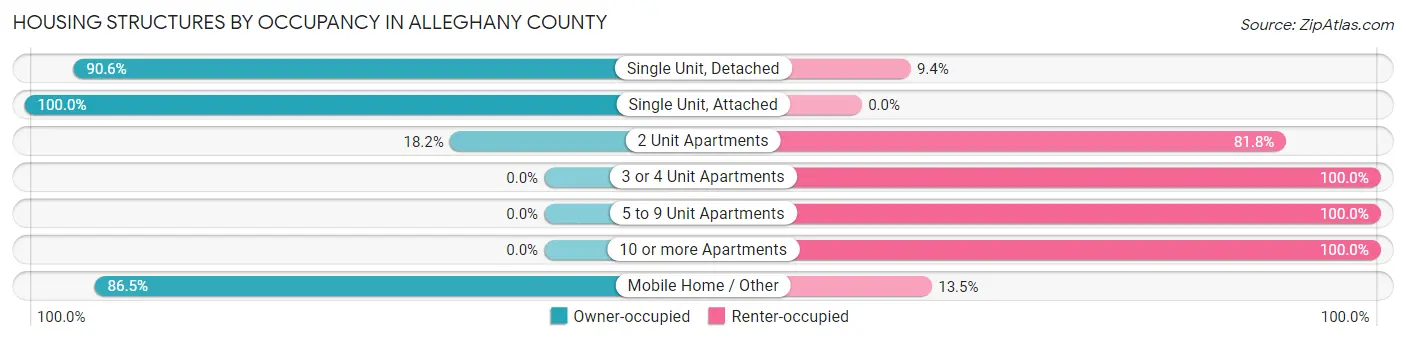
| Structure Type | Owner-occupied | Renter-occupied |
| Single Unit, Detached | 4,634 (90.6%) | 481 (9.4%) |
| Single Unit, Attached | 27 (100.0%) | 0 (0.0%) |
| 2 Unit Apartments | 6 (18.2%) | 27 (81.8%) |
| 3 or 4 Unit Apartments | 0 (0.0%) | 39 (100.0%) |
| 5 to 9 Unit Apartments | 0 (0.0%) | 57 (100.0%) |
| 10 or more Apartments | 0 (0.0%) | 364 (100.0%) |
| Mobile Home / Other | 583 (86.5%) | 91 (13.5%) |
| Total | 5,250 (83.2%) | 1,059 (16.8%) |
Housing Structures by Number of Rooms in Alleghany County
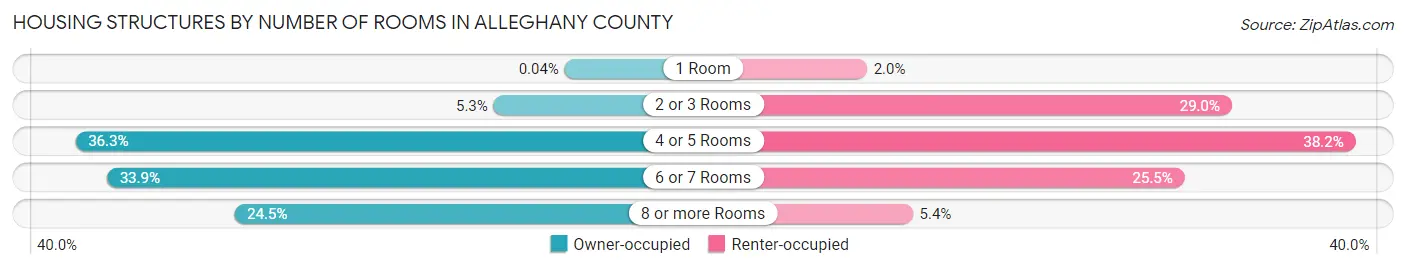
| Number of Rooms | Owner-occupied | Renter-occupied |
| 1 Room | 2 (0.0%) | 21 (2.0%) |
| 2 or 3 Rooms | 278 (5.3%) | 307 (29.0%) |
| 4 or 5 Rooms | 1,903 (36.2%) | 404 (38.2%) |
| 6 or 7 Rooms | 1,781 (33.9%) | 270 (25.5%) |
| 8 or more Rooms | 1,286 (24.5%) | 57 (5.4%) |
| Total | 5,250 (100.0%) | 1,059 (100.0%) |
Housing Structure by Heating Type in Alleghany County
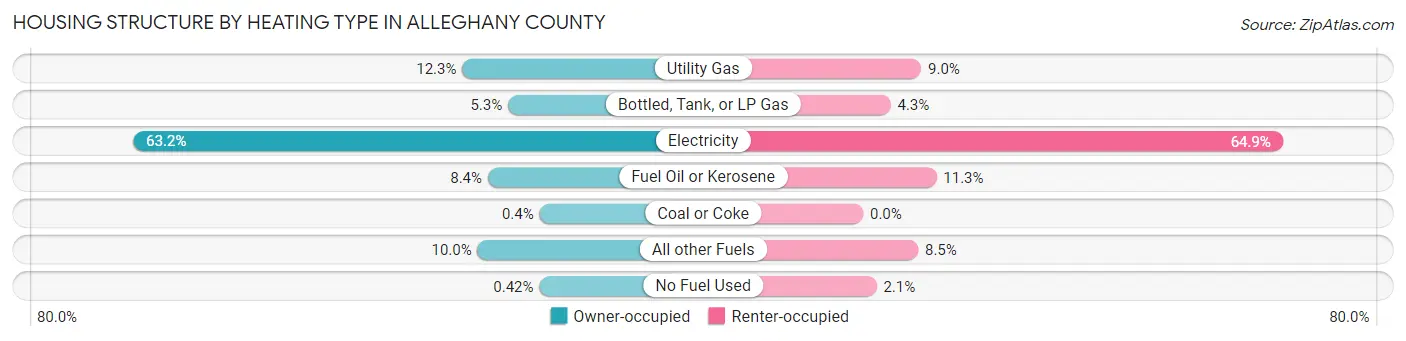
| Heating Type | Owner-occupied | Renter-occupied |
| Utility Gas | 648 (12.3%) | 95 (9.0%) |
| Bottled, Tank, or LP Gas | 276 (5.3%) | 45 (4.3%) |
| Electricity | 3,319 (63.2%) | 687 (64.9%) |
| Fuel Oil or Kerosene | 440 (8.4%) | 120 (11.3%) |
| Coal or Coke | 21 (0.4%) | 0 (0.0%) |
| All other Fuels | 524 (10.0%) | 90 (8.5%) |
| No Fuel Used | 22 (0.4%) | 22 (2.1%) |
| Total | 5,250 (100.0%) | 1,059 (100.0%) |
Household Vehicle Usage in Alleghany County
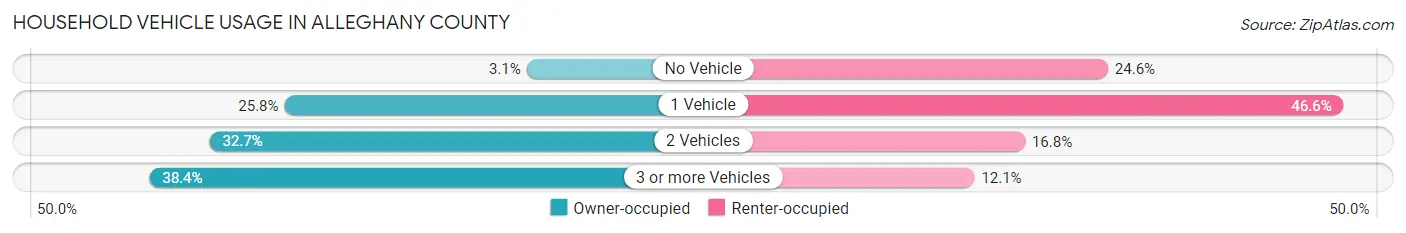
| Vehicles per Household | Owner-occupied | Renter-occupied |
| No Vehicle | 165 (3.1%) | 260 (24.5%) |
| 1 Vehicle | 1,352 (25.8%) | 493 (46.6%) |
| 2 Vehicles | 1,719 (32.7%) | 178 (16.8%) |
| 3 or more Vehicles | 2,014 (38.4%) | 128 (12.1%) |
| Total | 5,250 (100.0%) | 1,059 (100.0%) |
Real Estate & Mortgages in Alleghany County
Real Estate and Mortgage Overview in Alleghany County
| Characteristic | Without Mortgage | With Mortgage |
| Housing Units | 3,223 | 2,027 |
| Median Property Value | $109,900 | $152,800 |
| Median Household Income | $43,230 | $299 |
| Monthly Housing Costs | $375 | $41 |
| Real Estate Taxes | $873 | $56 |
Property Value by Mortgage Status in Alleghany County
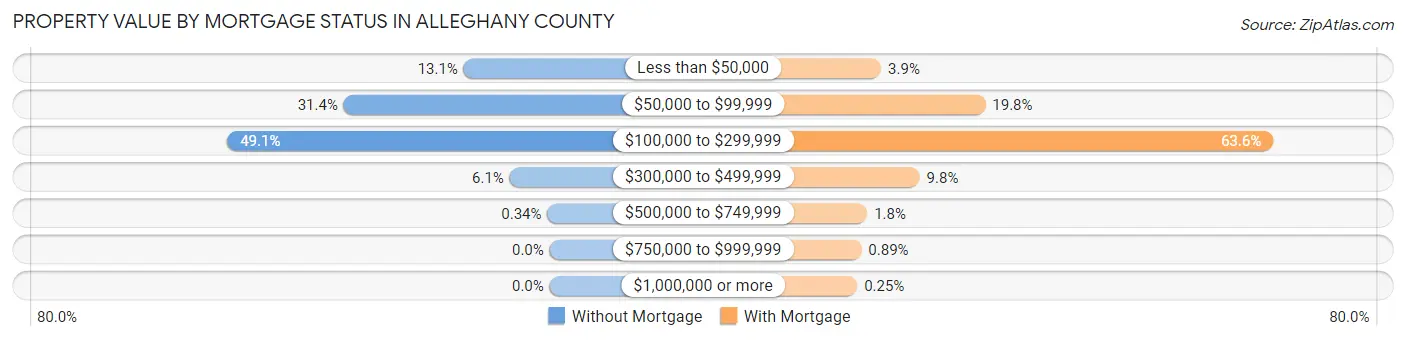
| Property Value | Without Mortgage | With Mortgage |
| Less than $50,000 | 422 (13.1%) | 79 (3.9%) |
| $50,000 to $99,999 | 1,011 (31.4%) | 401 (19.8%) |
| $100,000 to $299,999 | 1,583 (49.1%) | 1,290 (63.6%) |
| $300,000 to $499,999 | 196 (6.1%) | 198 (9.8%) |
| $500,000 to $749,999 | 11 (0.3%) | 36 (1.8%) |
| $750,000 to $999,999 | 0 (0.0%) | 18 (0.9%) |
| $1,000,000 or more | 0 (0.0%) | 5 (0.3%) |
| Total | 3,223 (100.0%) | 2,027 (100.0%) |
Household Income by Mortgage Status in Alleghany County
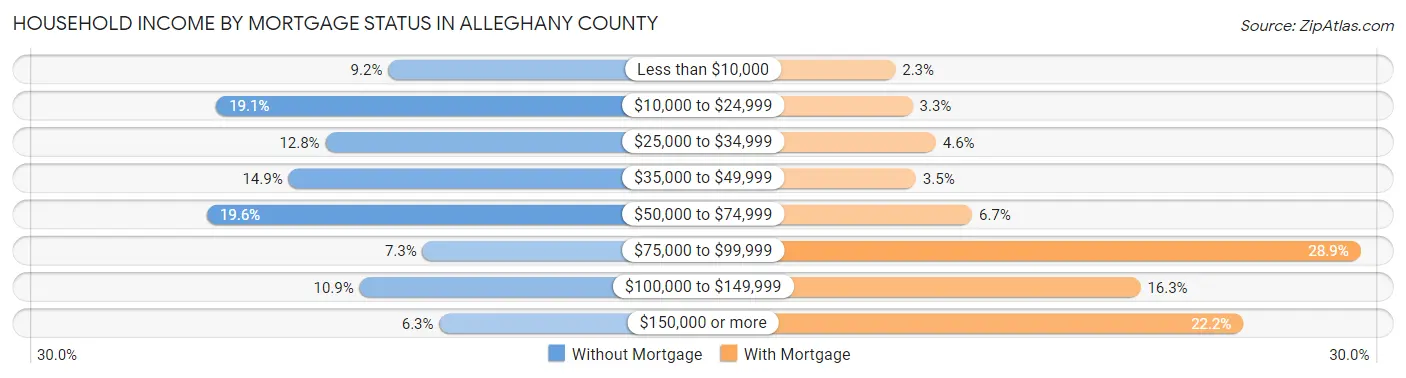
| Household Income | Without Mortgage | With Mortgage |
| Less than $10,000 | 297 (9.2%) | 46 (2.3%) |
| $10,000 to $24,999 | 614 (19.1%) | 66 (3.3%) |
| $25,000 to $34,999 | 413 (12.8%) | 93 (4.6%) |
| $35,000 to $49,999 | 481 (14.9%) | 70 (3.5%) |
| $50,000 to $74,999 | 631 (19.6%) | 135 (6.7%) |
| $75,000 to $99,999 | 234 (7.3%) | 585 (28.9%) |
| $100,000 to $149,999 | 350 (10.9%) | 330 (16.3%) |
| $150,000 or more | 203 (6.3%) | 449 (22.2%) |
| Total | 3,223 (100.0%) | 2,027 (100.0%) |
Property Value to Household Income Ratio in Alleghany County
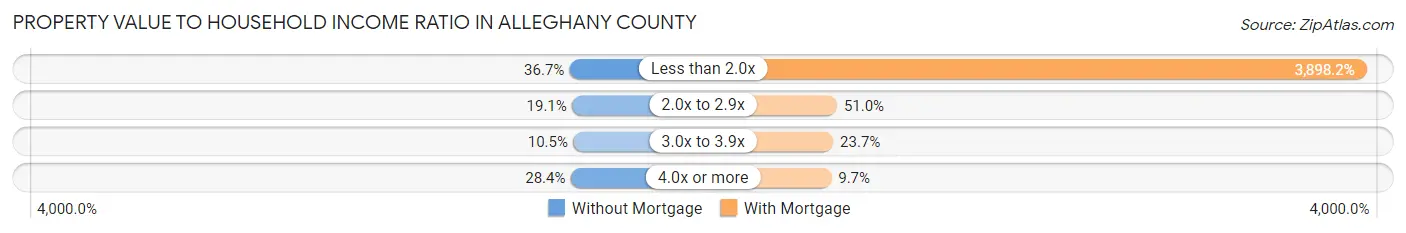
| Value-to-Income Ratio | Without Mortgage | With Mortgage |
| Less than 2.0x | 1,183 (36.7%) | 79,017 (3,898.2%) |
| 2.0x to 2.9x | 616 (19.1%) | 1,034 (51.0%) |
| 3.0x to 3.9x | 337 (10.5%) | 480 (23.7%) |
| 4.0x or more | 914 (28.4%) | 196 (9.7%) |
| Total | 3,223 (100.0%) | 2,027 (100.0%) |
Real Estate Taxes by Mortgage Status in Alleghany County
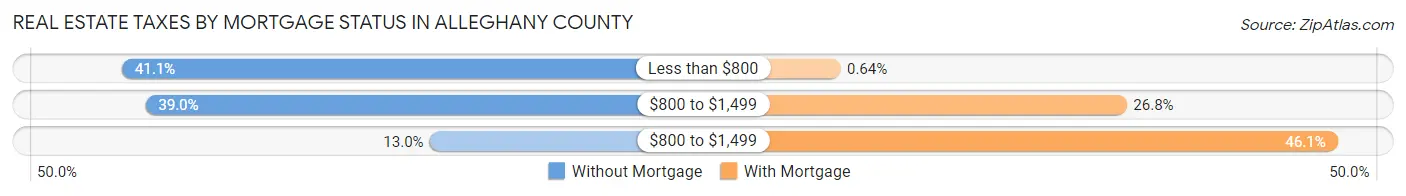
| Property Taxes | Without Mortgage | With Mortgage |
| Less than $800 | 1,325 (41.1%) | 13 (0.6%) |
| $800 to $1,499 | 1,256 (39.0%) | 543 (26.8%) |
| $800 to $1,499 | 420 (13.0%) | 934 (46.1%) |
| Total | 3,223 (100.0%) | 2,027 (100.0%) |
Health & Disability in Alleghany County
Health Insurance Coverage by Age in Alleghany County
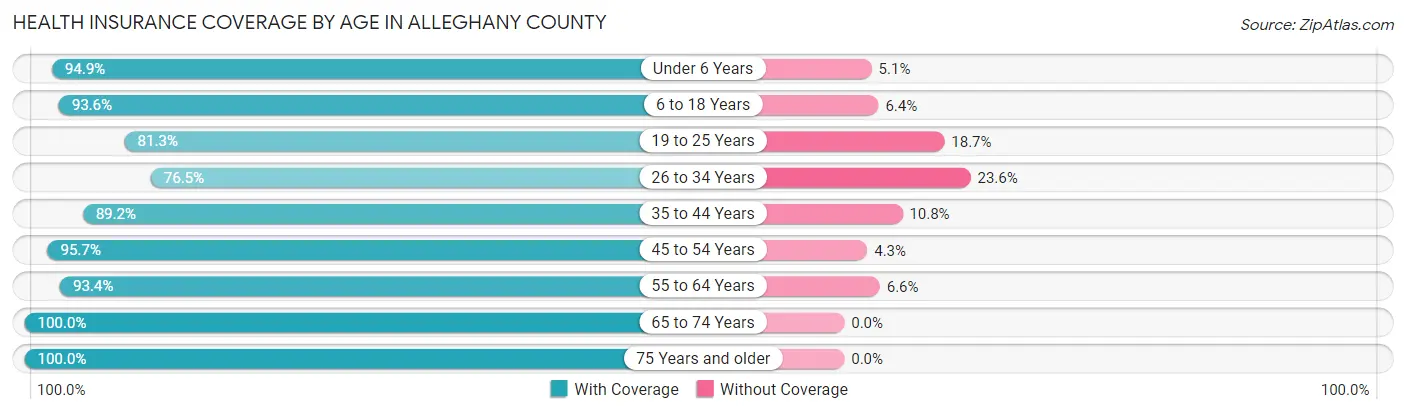
| Age Bracket | With Coverage | Without Coverage |
| Under 6 Years | 781 (94.9%) | 42 (5.1%) |
| 6 to 18 Years | 2,069 (93.6%) | 141 (6.4%) |
| 19 to 25 Years | 1,142 (81.3%) | 262 (18.7%) |
| 26 to 34 Years | 870 (76.4%) | 268 (23.5%) |
| 35 to 44 Years | 1,258 (89.2%) | 153 (10.8%) |
| 45 to 54 Years | 1,828 (95.7%) | 82 (4.3%) |
| 55 to 64 Years | 2,230 (93.4%) | 158 (6.6%) |
| 65 to 74 Years | 2,083 (100.0%) | 0 (0.0%) |
| 75 Years and older | 1,499 (100.0%) | 0 (0.0%) |
| Total | 13,760 (92.6%) | 1,106 (7.4%) |
Health Insurance Coverage by Citizenship Status in Alleghany County
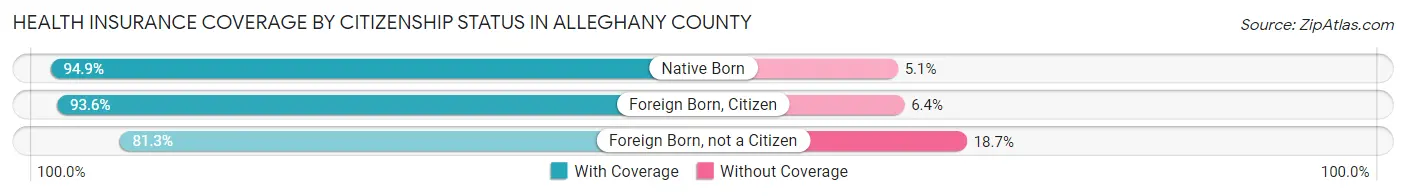
| Citizenship Status | With Coverage | Without Coverage |
| Native Born | 781 (94.9%) | 42 (5.1%) |
| Foreign Born, Citizen | 2,069 (93.6%) | 141 (6.4%) |
| Foreign Born, not a Citizen | 1,142 (81.3%) | 262 (18.7%) |
Health Insurance Coverage by Household Income in Alleghany County
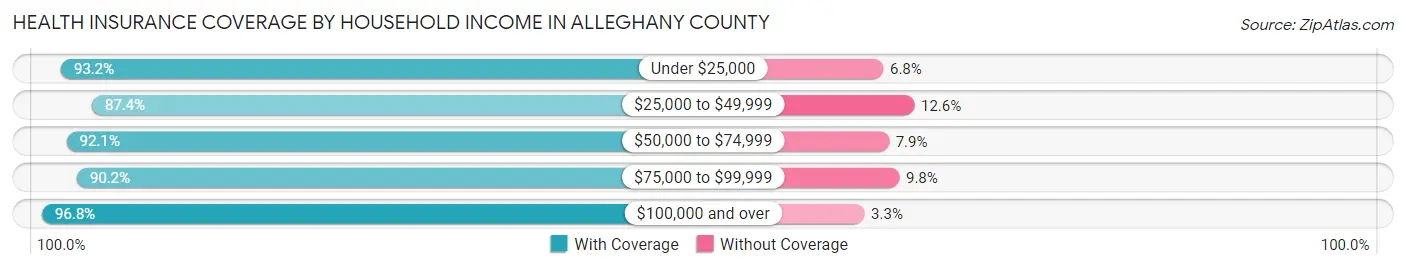
| Household Income | With Coverage | Without Coverage |
| Under $25,000 | 2,363 (93.2%) | 172 (6.8%) |
| $25,000 to $49,999 | 2,233 (87.4%) | 322 (12.6%) |
| $50,000 to $74,999 | 2,976 (92.1%) | 254 (7.9%) |
| $75,000 to $99,999 | 1,695 (90.2%) | 184 (9.8%) |
| $100,000 and over | 4,409 (96.8%) | 148 (3.3%) |
Public vs Private Health Insurance Coverage by Age in Alleghany County
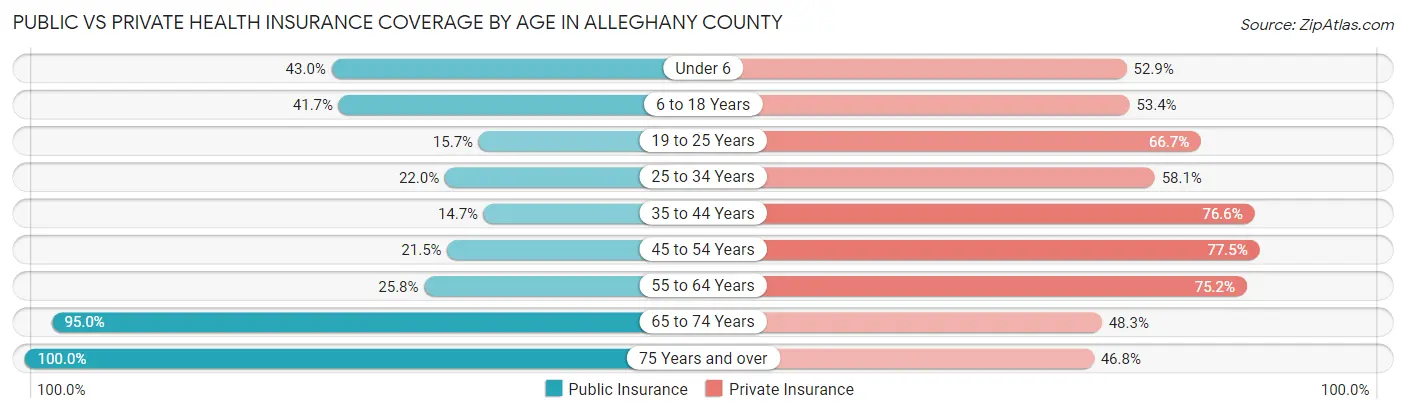
| Age Bracket | Public Insurance | Private Insurance |
| Under 6 | 354 (43.0%) | 435 (52.9%) |
| 6 to 18 Years | 921 (41.7%) | 1,180 (53.4%) |
| 19 to 25 Years | 220 (15.7%) | 936 (66.7%) |
| 25 to 34 Years | 250 (22.0%) | 661 (58.1%) |
| 35 to 44 Years | 208 (14.7%) | 1,081 (76.6%) |
| 45 to 54 Years | 411 (21.5%) | 1,481 (77.5%) |
| 55 to 64 Years | 616 (25.8%) | 1,795 (75.2%) |
| 65 to 74 Years | 1,979 (95.0%) | 1,005 (48.2%) |
| 75 Years and over | 1,499 (100.0%) | 701 (46.8%) |
| Total | 6,458 (43.4%) | 9,275 (62.4%) |
Disability Status by Sex by Age in Alleghany County
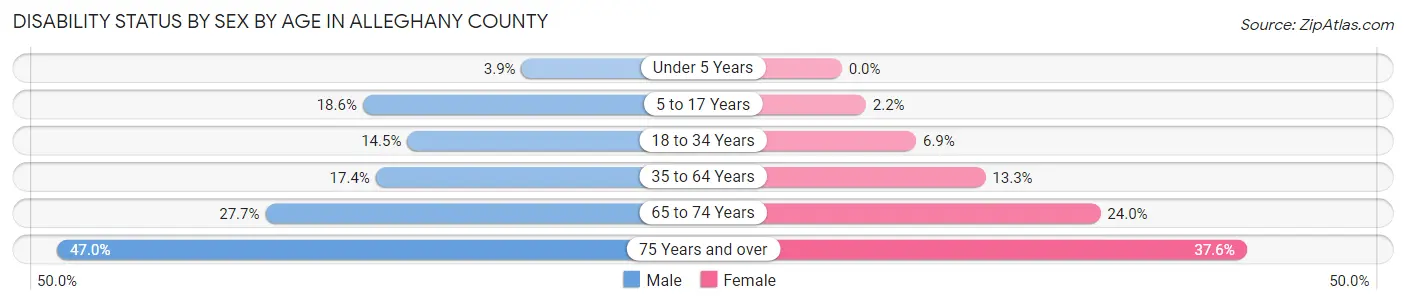
| Age Bracket | Male | Female |
| Under 5 Years | 13 (3.9%) | 0 (0.0%) |
| 5 to 17 Years | 238 (18.6%) | 21 (2.2%) |
| 18 to 34 Years | 202 (14.5%) | 92 (6.9%) |
| 35 to 64 Years | 485 (17.4%) | 390 (13.3%) |
| 65 to 74 Years | 265 (27.7%) | 270 (24.0%) |
| 75 Years and over | 304 (47.0%) | 320 (37.6%) |
Disability Class by Sex by Age in Alleghany County
Disability Class: Hearing Difficulty
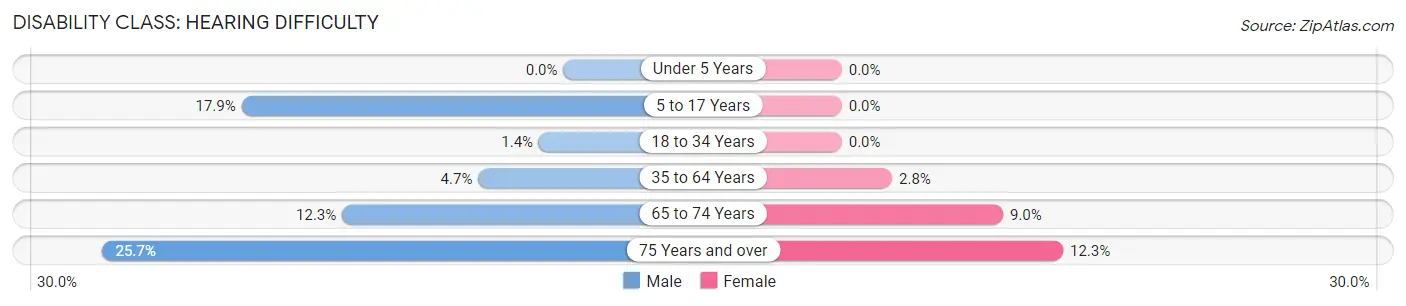
| Age Bracket | Male | Female |
| Under 5 Years | 0 (0.0%) | 0 (0.0%) |
| 5 to 17 Years | 229 (17.9%) | 0 (0.0%) |
| 18 to 34 Years | 19 (1.4%) | 0 (0.0%) |
| 35 to 64 Years | 132 (4.7%) | 82 (2.8%) |
| 65 to 74 Years | 118 (12.3%) | 101 (9.0%) |
| 75 Years and over | 166 (25.7%) | 105 (12.3%) |
Disability Class: Vision Difficulty
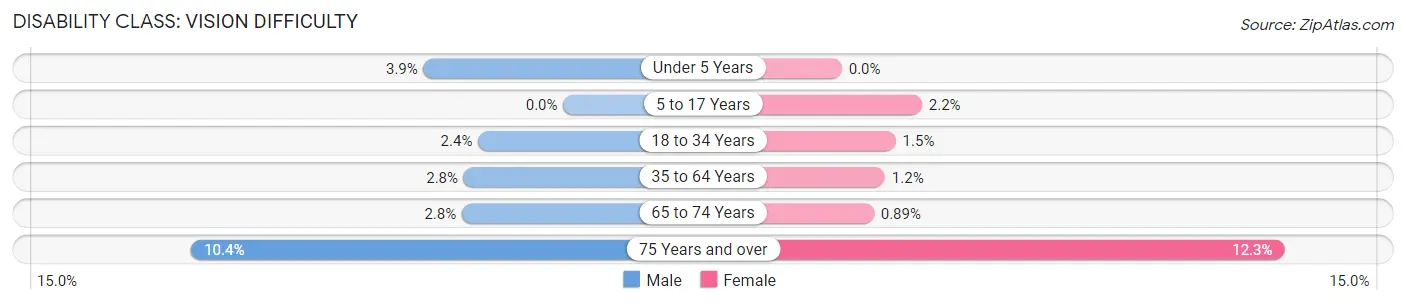
| Age Bracket | Male | Female |
| Under 5 Years | 13 (3.9%) | 0 (0.0%) |
| 5 to 17 Years | 0 (0.0%) | 21 (2.2%) |
| 18 to 34 Years | 33 (2.4%) | 20 (1.5%) |
| 35 to 64 Years | 77 (2.8%) | 35 (1.2%) |
| 65 to 74 Years | 27 (2.8%) | 10 (0.9%) |
| 75 Years and over | 67 (10.4%) | 105 (12.3%) |
Disability Class: Cognitive Difficulty
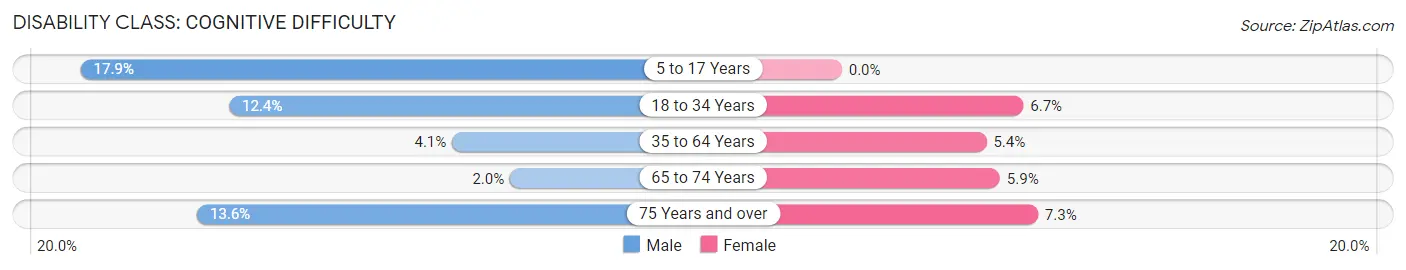
| Age Bracket | Male | Female |
| 5 to 17 Years | 229 (17.9%) | 0 (0.0%) |
| 18 to 34 Years | 173 (12.4%) | 90 (6.7%) |
| 35 to 64 Years | 115 (4.1%) | 157 (5.4%) |
| 65 to 74 Years | 19 (2.0%) | 66 (5.9%) |
| 75 Years and over | 88 (13.6%) | 62 (7.3%) |
Disability Class: Ambulatory Difficulty
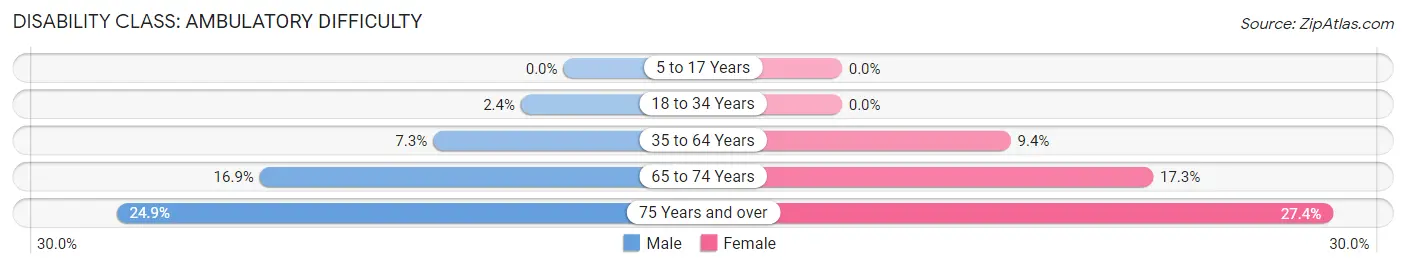
| Age Bracket | Male | Female |
| 5 to 17 Years | 0 (0.0%) | 0 (0.0%) |
| 18 to 34 Years | 33 (2.4%) | 0 (0.0%) |
| 35 to 64 Years | 202 (7.3%) | 275 (9.4%) |
| 65 to 74 Years | 162 (16.9%) | 195 (17.3%) |
| 75 Years and over | 161 (24.9%) | 233 (27.4%) |
Disability Class: Self-Care Difficulty
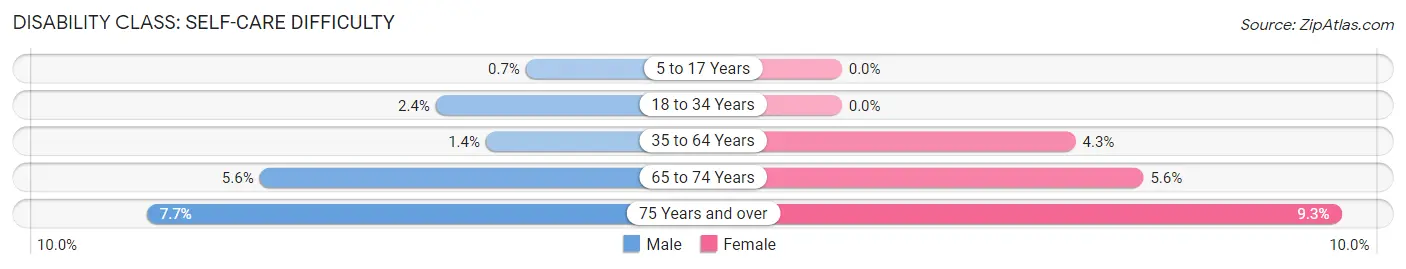
| Age Bracket | Male | Female |
| 5 to 17 Years | 9 (0.7%) | 0 (0.0%) |
| 18 to 34 Years | 33 (2.4%) | 0 (0.0%) |
| 35 to 64 Years | 40 (1.4%) | 127 (4.3%) |
| 65 to 74 Years | 54 (5.6%) | 63 (5.6%) |
| 75 Years and over | 50 (7.7%) | 79 (9.3%) |
Technology Access in Alleghany County
Computing Device Access in Alleghany County
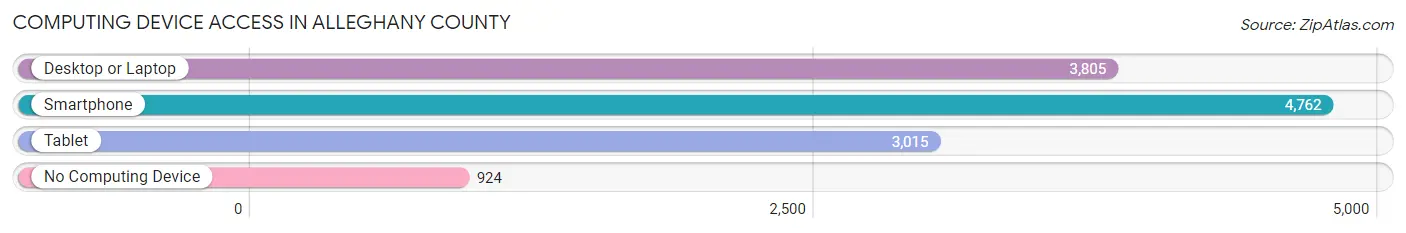
| Device Type | # Households | % Households |
| Desktop or Laptop | 3,805 | 60.3% |
| Smartphone | 4,762 | 75.5% |
| Tablet | 3,015 | 47.8% |
| No Computing Device | 924 | 14.6% |
| Total | 6,309 | 100.0% |
Internet Access in Alleghany County
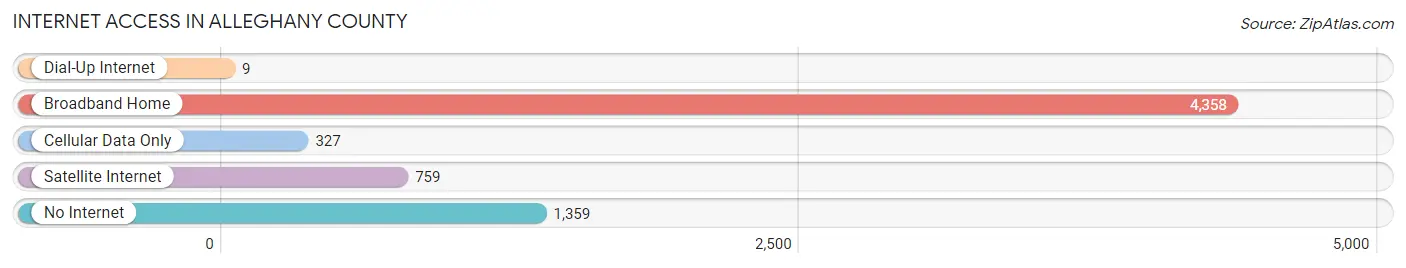
| Internet Type | # Households | % Households |
| Dial-Up Internet | 9 | 0.1% |
| Broadband Home | 4,358 | 69.1% |
| Cellular Data Only | 327 | 5.2% |
| Satellite Internet | 759 | 12.0% |
| No Internet | 1,359 | 21.5% |
| Total | 6,309 | 100.0% |
Alleghany County Summary
Alleghany County, Virginia is located in the western part of the state, in the Appalachian Mountains. It is bordered by the counties of Bath, Rockbridge, Botetourt, Craig, and Bedford. The county seat is Covington, and the county has a population of approximately 16,000 people.
Geography
Alleghany County is located in the Appalachian Mountains, and is part of the Ridge and Valley physiographic province. The county is characterized by steep, rugged terrain, with elevations ranging from 1,000 to 4,000 feet. The highest point in the county is Reddish Knob, at 4,397 feet. The county is drained by the Jackson River, which flows through the county from east to west. The county is also home to several other rivers, including the Cowpasture, the Maury, and the James.
The county is mostly forested, with oak, hickory, and pine being the dominant tree species. There are also several small farms in the county, which produce hay, corn, and other crops.
History
Alleghany County was formed in 1822 from parts of Botetourt and Bath counties. The county was named after the Allegheny Mountains, which are located in the area. The county seat was originally located in the town of Jackson, but was moved to Covington in 1824.
The county was largely rural and agricultural throughout its history. The county was home to several small towns, including Clifton Forge, Iron Gate, and Hot Springs. The county was also home to several iron furnaces, which produced iron for use in the Civil War.
Economy
Alleghany County’s economy is largely based on agriculture and tourism. The county is home to several small farms, which produce hay, corn, and other crops. The county is also home to several tourist attractions, including the Allegheny Mountain Tunnel, the Jackson River Scenic Trail, and the Alleghany Highlands Museum.
The county is also home to several manufacturing companies, including a paper mill, a furniture factory, and a wood products plant. The county is also home to several coal mines, which produce coal for use in power plants.
Demographics
As of the 2010 census, Alleghany County had a population of 16,250 people. The racial makeup of the county was 95.3% White, 2.2% African American, 0.3% Native American, 0.3% Asian, 0.1% Pacific Islander, 0.7% from other races, and 1.2% from two or more races. Hispanic or Latino of any race were 1.7% of the population.
The median income for a household in the county was $35,945, and the median income for a family was $41,945. The per capita income for the county was $17,945. About 13.2% of families and 16.2% of the population were below the poverty line, including 22.2% of those under age 18 and 11.2% of those age 65 or over.
Alleghany County is a rural county with a rich history and a diverse economy. The county is home to several small farms, manufacturing companies, and tourist attractions. The county is also home to a diverse population, with a median income that is slightly below the state average.
Common Questions
What is Per Capita Income in Alleghany County?
Per Capita income in Alleghany County is $30,143.
What is the Median Family Income in Alleghany County?
Median Family Income in Alleghany County is $68,965.
What is the Median Household income in Alleghany County?
Median Household Income in Alleghany County is $52,546.
What is Income or Wage Gap in Alleghany County?
Income or Wage Gap in Alleghany County is 42.9%.
Women in Alleghany County earn 57.1 cents for every dollar earned by a man.
What is Family Income Deficit in Alleghany County?
Family Income Deficit in Alleghany County is $13,024.
Families that are below poverty line in Alleghany County earn $13,024 less on average than the poverty threshold level.
What is Inequality or Gini Index in Alleghany County?
Inequality or Gini Index in Alleghany County is 0.46.
What is the Total Population of Alleghany County?
Total Population of Alleghany County is 15,159.
What is the Total Male Population of Alleghany County?
Total Male Population of Alleghany County is 7,501.
What is the Total Female Population of Alleghany County?
Total Female Population of Alleghany County is 7,658.
What is the Ratio of Males per 100 Females in Alleghany County?
There are 97.95 Males per 100 Females in Alleghany County.
What is the Ratio of Females per 100 Males in Alleghany County?
There are 102.09 Females per 100 Males in Alleghany County.
What is the Median Population Age in Alleghany County?
Median Population Age in Alleghany County is 48.0 Years.
What is the Average Family Size in Alleghany County
Average Family Size in Alleghany County is 3.1 People.
What is the Average Household Size in Alleghany County
Average Household Size in Alleghany County is 2.3 People.
How Large is the Labor Force in Alleghany County?
There are 6,316 People in the Labor Forcein in Alleghany County.
What is the Percentage of People in the Labor Force in Alleghany County?
49.9% of People are in the Labor Force in Alleghany County.
What is the Unemployment Rate in Alleghany County?
Unemployment Rate in Alleghany County is 3.7%.