Alexandria city, VA Map & Demographics
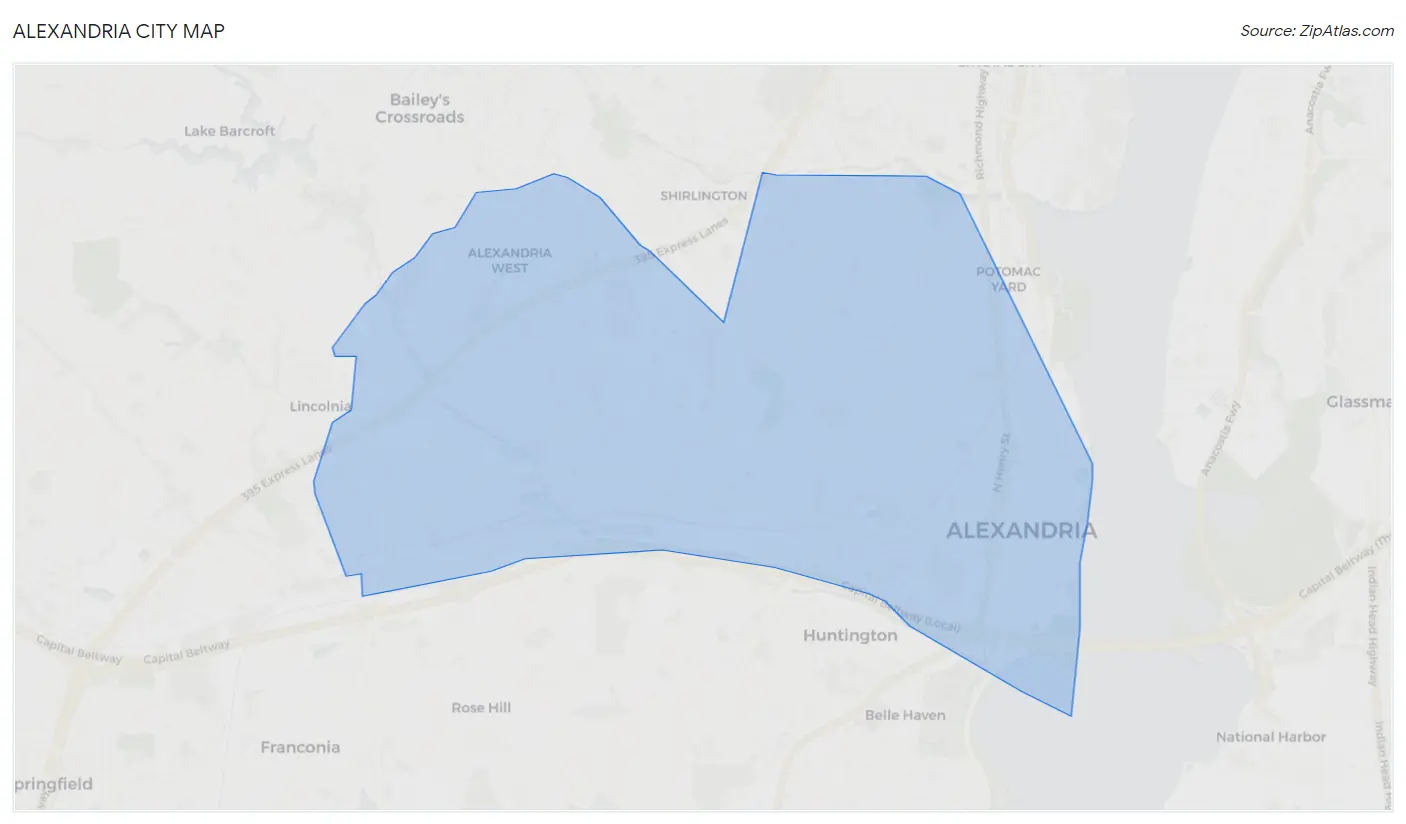
Alexandria city Map
Alexandria city Overview
$75,884
PER CAPITA INCOME
$149,526
AVG FAMILY INCOME
$113,179
AVG HOUSEHOLD INCOME
8.5%
WAGE / INCOME GAP [ % ]
91.5¢/ $1
WAGE / INCOME GAP [ $ ]
$10,132
FAMILY INCOME DEFICIT
0.46
INEQUALITY / GINI INDEX
157,594
TOTAL POPULATION
76,589
MALE POPULATION
81,005
FEMALE POPULATION
94.55
MALES / 100 FEMALES
105.77
FEMALES / 100 MALES
37.4
MEDIAN AGE
3.0
AVG FAMILY SIZE
2.1
AVG HOUSEHOLD SIZE
102,495
LABOR FORCE [ PEOPLE ]
78.0%
PERCENT IN LABOR FORCE
3.2%
UNEMPLOYMENT RATE
Income in Alexandria city
Income Overview in Alexandria city
Per Capita Income in Alexandria city is $75,884, while median incomes of families and households are $149,526 and $113,179 respectively.
| Characteristic | Number | Measure |
| Per Capita Income | 157,594 | $75,884 |
| Median Family Income | 34,501 | $149,526 |
| Mean Family Income | 34,501 | $201,538 |
| Median Household Income | 74,818 | $113,179 |
| Mean Household Income | 74,818 | $156,781 |
| Income Deficit | 34,501 | $10,132 |
| Wage / Income Gap (%) | 157,594 | 8.53% |
| Wage / Income Gap ($) | 157,594 | 91.47¢ per $1 |
| Gini / Inequality Index | 157,594 | 0.46 |
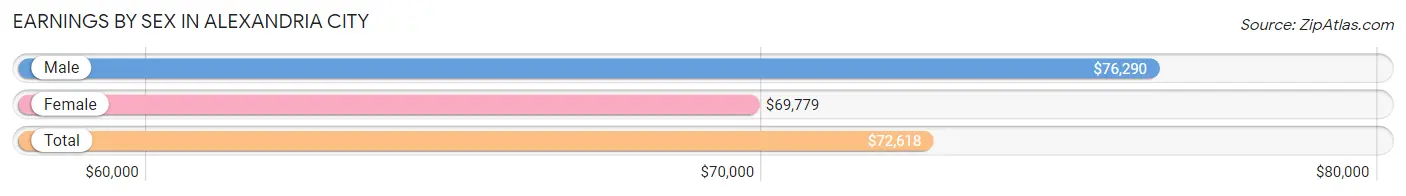
Earnings by Sex in Alexandria city
Average Earnings in Alexandria city are $72,618, $76,290 for men and $69,779 for women, a difference of 8.5%.
| Sex | Number | Average Earnings |
| Male | 54,047 (51.3%) | $76,290 |
| Female | 51,215 (48.6%) | $69,779 |
| Total | 105,262 (100.0%) | $72,618 |
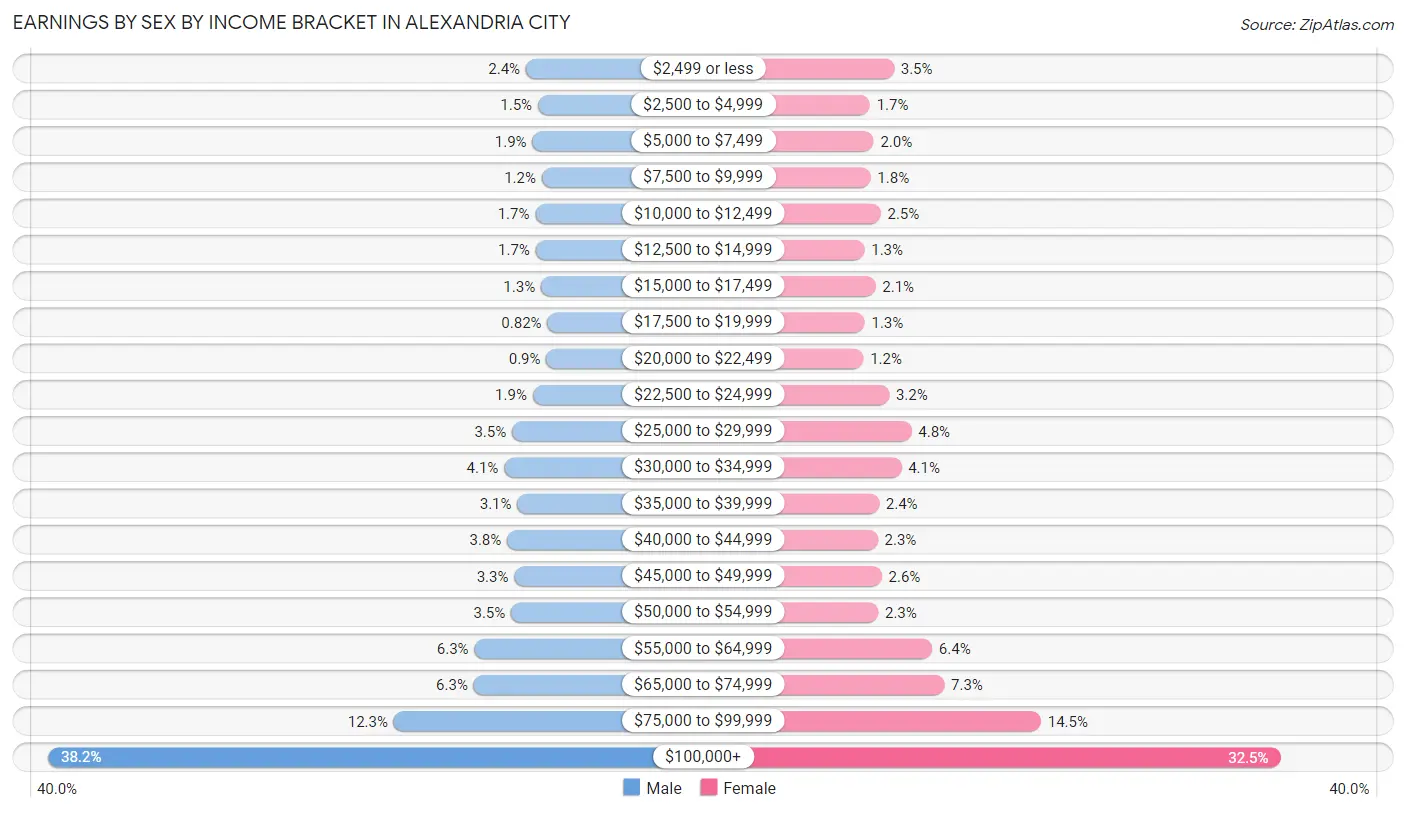
Earnings by Sex by Income Bracket in Alexandria city
The most common earnings brackets in Alexandria city are $100,000+ for men (20,666 | 38.2%) and $100,000+ for women (16,638 | 32.5%).
| Income | Male | Female |
| $2,499 or less | 1,316 (2.4%) | 1,804 (3.5%) |
| $2,500 to $4,999 | 828 (1.5%) | 879 (1.7%) |
| $5,000 to $7,499 | 1,051 (1.9%) | 1,026 (2.0%) |
| $7,500 to $9,999 | 672 (1.2%) | 909 (1.8%) |
| $10,000 to $12,499 | 933 (1.7%) | 1,297 (2.5%) |
| $12,500 to $14,999 | 921 (1.7%) | 671 (1.3%) |
| $15,000 to $17,499 | 705 (1.3%) | 1,098 (2.1%) |
| $17,500 to $19,999 | 443 (0.8%) | 683 (1.3%) |
| $20,000 to $22,499 | 488 (0.9%) | 630 (1.2%) |
| $22,500 to $24,999 | 1,036 (1.9%) | 1,618 (3.2%) |
| $25,000 to $29,999 | 1,877 (3.5%) | 2,479 (4.8%) |
| $30,000 to $34,999 | 2,196 (4.1%) | 2,088 (4.1%) |
| $35,000 to $39,999 | 1,658 (3.1%) | 1,230 (2.4%) |
| $40,000 to $44,999 | 2,074 (3.8%) | 1,184 (2.3%) |
| $45,000 to $49,999 | 1,781 (3.3%) | 1,336 (2.6%) |
| $50,000 to $54,999 | 1,915 (3.5%) | 1,198 (2.3%) |
| $55,000 to $64,999 | 3,400 (6.3%) | 3,265 (6.4%) |
| $65,000 to $74,999 | 3,424 (6.3%) | 3,734 (7.3%) |
| $75,000 to $99,999 | 6,663 (12.3%) | 7,448 (14.5%) |
| $100,000+ | 20,666 (38.2%) | 16,638 (32.5%) |
| Total | 54,047 (100.0%) | 51,215 (100.0%) |
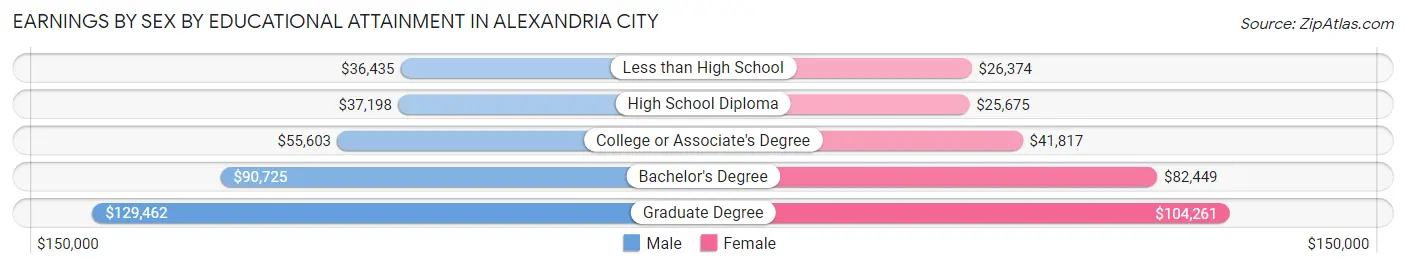
Earnings by Sex by Educational Attainment in Alexandria city
Average earnings in Alexandria city are $82,088 for men and $75,904 for women, a difference of 7.5%. Men with an educational attainment of graduate degree enjoy the highest average annual earnings of $129,462, while those with less than high school education earn the least with $36,435. Women with an educational attainment of graduate degree earn the most with the average annual earnings of $104,261, while those with high school diploma education have the smallest earnings of $25,675.
| Educational Attainment | Male Income | Female Income |
| Less than High School | $36,435 | $26,374 |
| High School Diploma | $37,198 | $25,675 |
| College or Associate's Degree | $55,603 | $41,817 |
| Bachelor's Degree | $90,725 | $82,449 |
| Graduate Degree | $129,462 | $104,261 |
| Total | $82,088 | $75,904 |
Family Income in Alexandria city
Family Income Brackets in Alexandria city
According to the Alexandria city family income data, there are 13,283 families falling into the $200,000+ income range, which is the most common income bracket and makes up 38.5% of all families. Conversely, the $10,000 to $14,999 income bracket is the least frequent group with only 414 families (1.2%) belonging to this category.
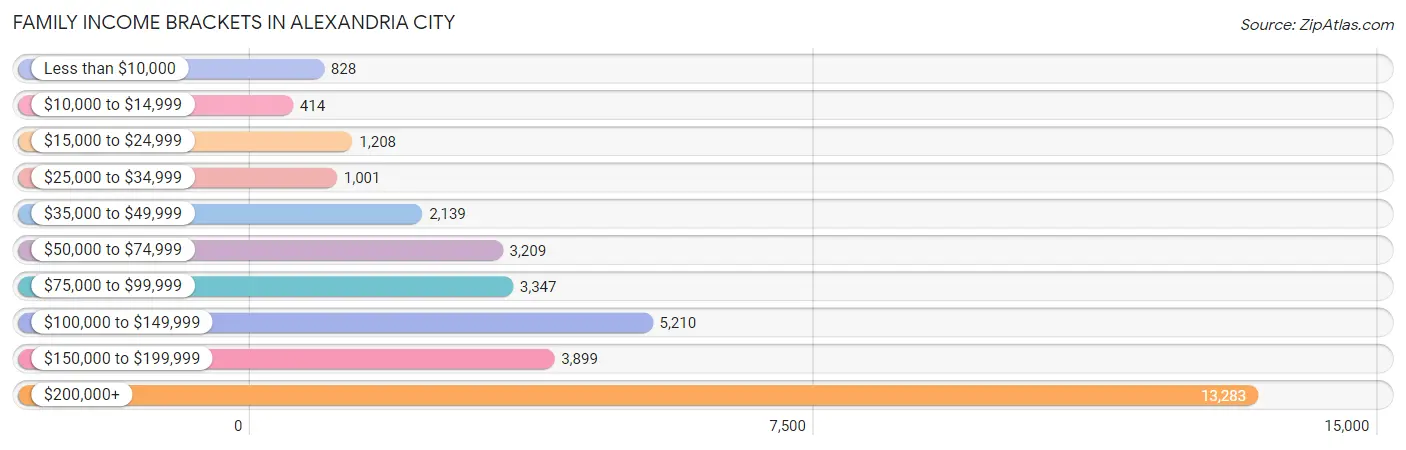
| Income Bracket | # Families | % Families |
| Less than $10,000 | 828 | 2.4% |
| $10,000 to $14,999 | 414 | 1.2% |
| $15,000 to $24,999 | 1,208 | 3.5% |
| $25,000 to $34,999 | 1,001 | 2.9% |
| $35,000 to $49,999 | 2,139 | 6.2% |
| $50,000 to $74,999 | 3,209 | 9.3% |
| $75,000 to $99,999 | 3,347 | 9.7% |
| $100,000 to $149,999 | 5,210 | 15.1% |
| $150,000 to $199,999 | 3,899 | 11.3% |
| $200,000+ | 13,283 | 38.5% |
Family Income by Famaliy Size in Alexandria city
4-person families (5,498 | 15.9%) account for the highest median family income in Alexandria city with $162,717 per family, while 2-person families (17,982 | 52.1%) have the highest median income of $78,200 per family member.
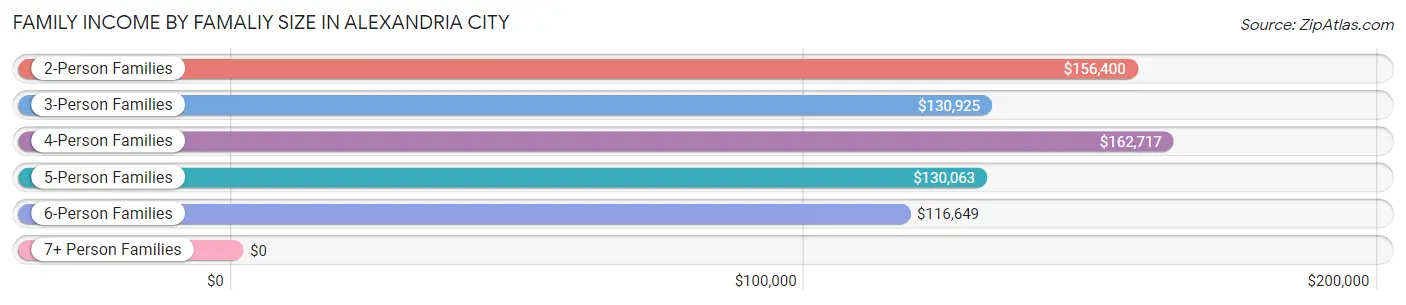
| Income Bracket | # Families | Median Income |
| 2-Person Families | 17,982 (52.1%) | $156,400 |
| 3-Person Families | 8,203 (23.8%) | $130,925 |
| 4-Person Families | 5,498 (15.9%) | $162,717 |
| 5-Person Families | 1,943 (5.6%) | $130,063 |
| 6-Person Families | 787 (2.3%) | $116,649 |
| 7+ Person Families | 88 (0.3%) | $0 |
| Total | 34,501 (100.0%) | $149,526 |
Family Income by Number of Earners in Alexandria city
The median family income in Alexandria city is $149,526, with families comprising 2 earners (18,954) having the highest median family income of $201,126, while families with 1 earner (10,357) have the lowest median family income of $78,845, accounting for 54.9% and 30.0% of families, respectively.
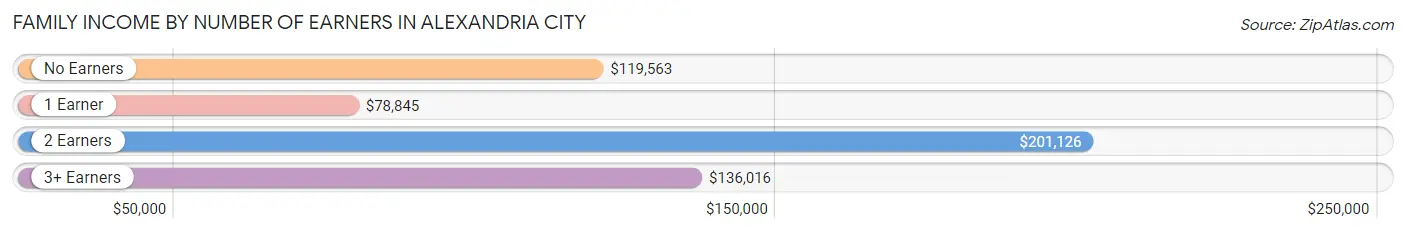
| Number of Earners | # Families | Median Income |
| No Earners | 2,307 (6.7%) | $119,563 |
| 1 Earner | 10,357 (30.0%) | $78,845 |
| 2 Earners | 18,954 (54.9%) | $201,126 |
| 3+ Earners | 2,883 (8.4%) | $136,016 |
| Total | 34,501 (100.0%) | $149,526 |
Household Income in Alexandria city
Household Income Brackets in Alexandria city
With 17,956 households falling in the category, the $200,000+ income range is the most frequent in Alexandria city, accounting for 24.0% of all households. In contrast, only 1,496 households (2.0%) fall into the $10,000 to $14,999 income bracket, making it the least populous group.
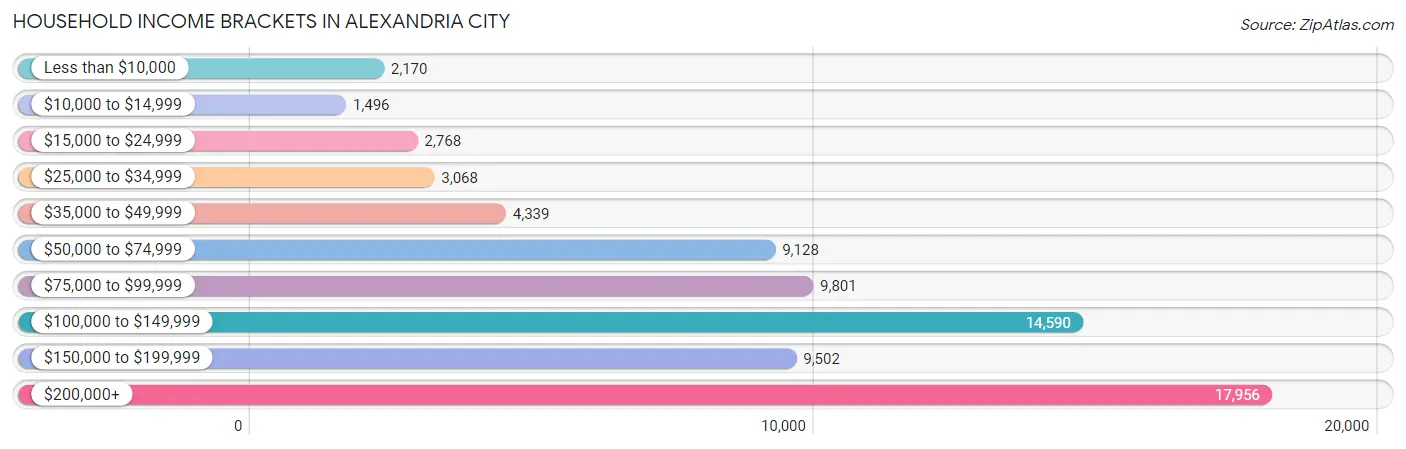
| Income Bracket | # Households | % Households |
| Less than $10,000 | 2,170 | 2.9% |
| $10,000 to $14,999 | 1,496 | 2.0% |
| $15,000 to $24,999 | 2,768 | 3.7% |
| $25,000 to $34,999 | 3,068 | 4.1% |
| $35,000 to $49,999 | 4,339 | 5.8% |
| $50,000 to $74,999 | 9,128 | 12.2% |
| $75,000 to $99,999 | 9,801 | 13.1% |
| $100,000 to $149,999 | 14,590 | 19.5% |
| $150,000 to $199,999 | 9,502 | 12.7% |
| $200,000+ | 17,956 | 24.0% |
Household Income by Householder Age in Alexandria city
The median household income in Alexandria city is $113,179, with the highest median household income of $135,072 found in the 45 to 64 years age bracket for the primary householder. A total of 24,052 households (32.2%) fall into this category. Meanwhile, the 15 to 24 years age bracket for the primary householder has the lowest median household income of $54,483, with 2,820 households (3.8%) in this group.
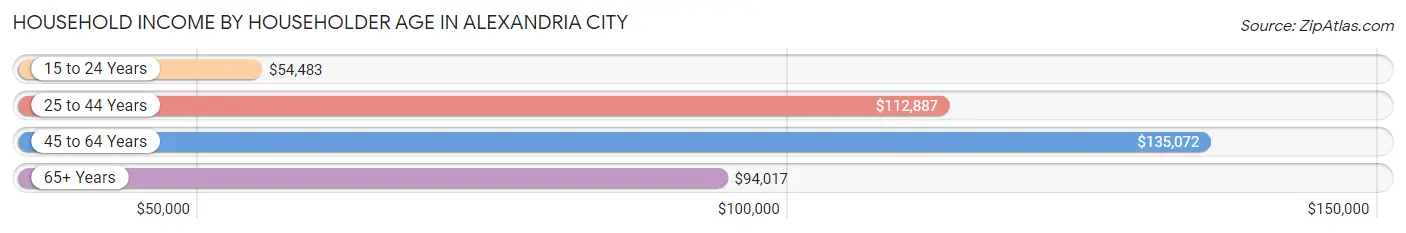
| Income Bracket | # Households | Median Income |
| 15 to 24 Years | 2,820 (3.8%) | $54,483 |
| 25 to 44 Years | 34,699 (46.4%) | $112,887 |
| 45 to 64 Years | 24,052 (32.2%) | $135,072 |
| 65+ Years | 13,247 (17.7%) | $94,017 |
| Total | 74,818 (100.0%) | $113,179 |
Poverty in Alexandria city
Income Below Poverty by Sex and Age in Alexandria city
With 8.1% poverty level for males and 9.5% for females among the residents of Alexandria city, 18 to 24 year old males and 18 to 24 year old females are the most vulnerable to poverty, with 749 males (17.5%) and 1,265 females (25.8%) in their respective age groups living below the poverty level.
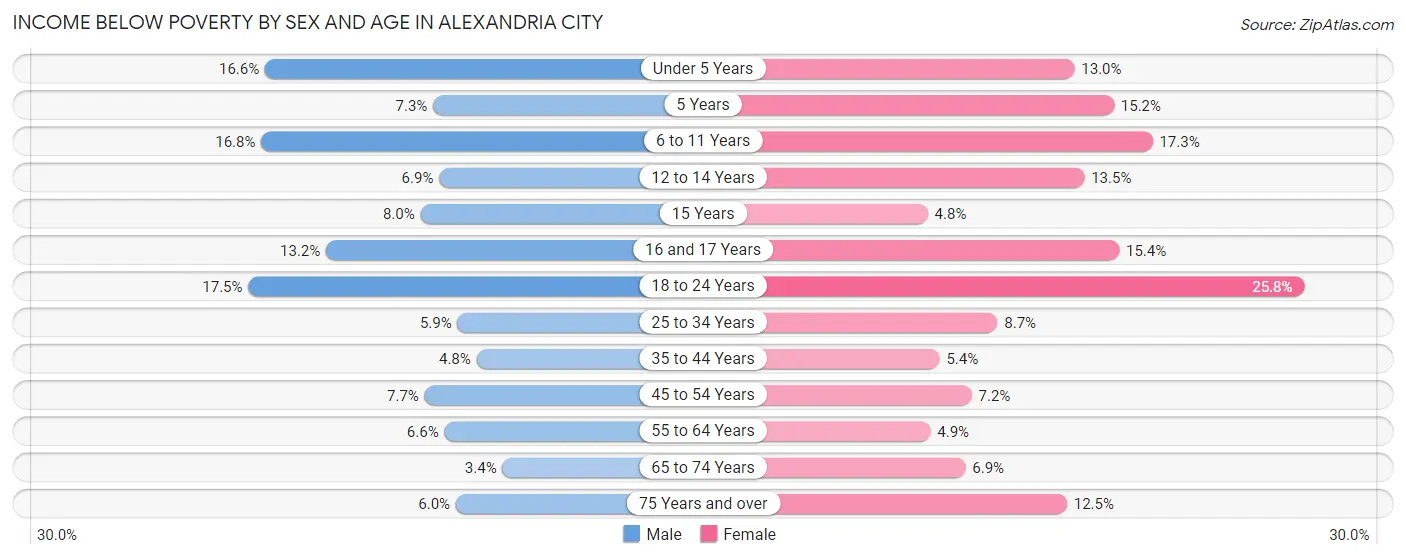
| Age Bracket | Male | Female |
| Under 5 Years | 906 (16.6%) | 669 (13.0%) |
| 5 Years | 43 (7.2%) | 108 (15.1%) |
| 6 to 11 Years | 763 (16.8%) | 656 (17.3%) |
| 12 to 14 Years | 138 (6.9%) | 283 (13.5%) |
| 15 Years | 38 (8.0%) | 36 (4.8%) |
| 16 and 17 Years | 179 (13.2%) | 155 (15.4%) |
| 18 to 24 Years | 749 (17.5%) | 1,265 (25.8%) |
| 25 to 34 Years | 885 (5.9%) | 1,454 (8.7%) |
| 35 to 44 Years | 718 (4.8%) | 790 (5.4%) |
| 45 to 54 Years | 808 (7.7%) | 769 (7.2%) |
| 55 to 64 Years | 555 (6.6%) | 443 (4.9%) |
| 65 to 74 Years | 180 (3.4%) | 445 (6.9%) |
| 75 Years and over | 178 (6.0%) | 547 (12.5%) |
| Total | 6,140 (8.1%) | 7,620 (9.5%) |
Income Above Poverty by Sex and Age in Alexandria city
According to the poverty statistics in Alexandria city, males aged 65 to 74 years and females aged 15 years are the age groups that are most secure financially, with 96.6% of males and 95.2% of females in these age groups living above the poverty line.
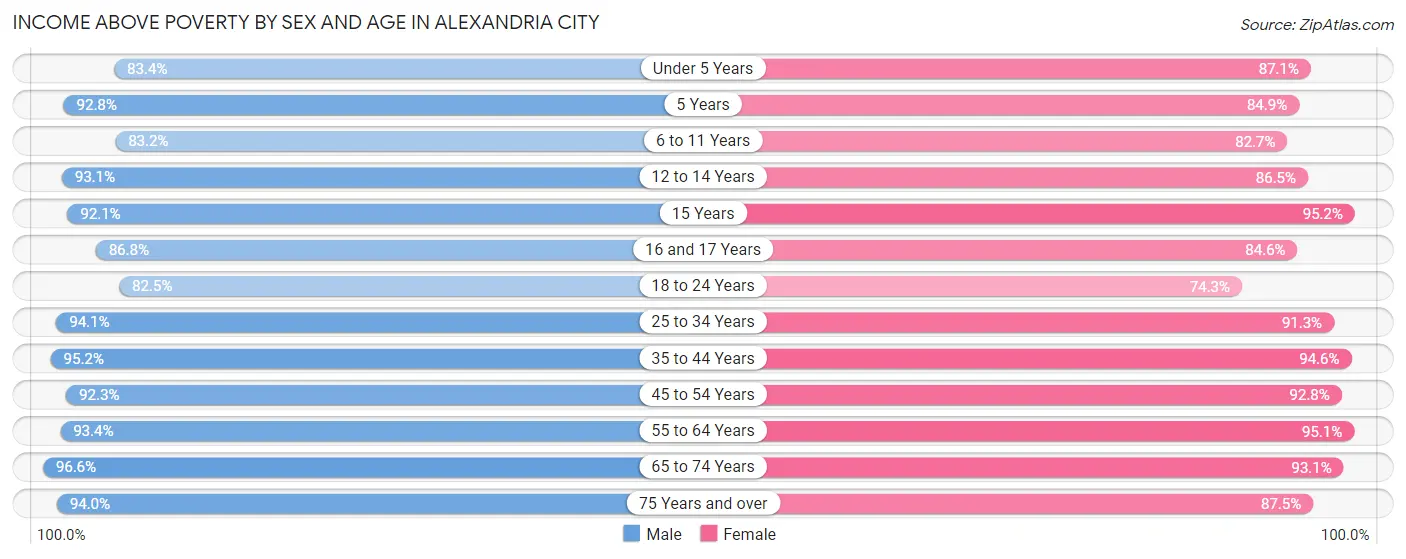
| Age Bracket | Male | Female |
| Under 5 Years | 4,548 (83.4%) | 4,496 (87.1%) |
| 5 Years | 550 (92.7%) | 605 (84.9%) |
| 6 to 11 Years | 3,772 (83.2%) | 3,135 (82.7%) |
| 12 to 14 Years | 1,858 (93.1%) | 1,813 (86.5%) |
| 15 Years | 440 (92.0%) | 717 (95.2%) |
| 16 and 17 Years | 1,176 (86.8%) | 849 (84.6%) |
| 18 to 24 Years | 3,521 (82.5%) | 3,647 (74.3%) |
| 25 to 34 Years | 14,153 (94.1%) | 15,330 (91.3%) |
| 35 to 44 Years | 14,162 (95.2%) | 13,736 (94.6%) |
| 45 to 54 Years | 9,660 (92.3%) | 9,867 (92.8%) |
| 55 to 64 Years | 7,831 (93.4%) | 8,542 (95.1%) |
| 65 to 74 Years | 5,122 (96.6%) | 6,019 (93.1%) |
| 75 Years and over | 2,799 (94.0%) | 3,819 (87.5%) |
| Total | 69,592 (91.9%) | 72,575 (90.5%) |
Income Below Poverty Among Married-Couple Families in Alexandria city
The poverty statistics for married-couple families in Alexandria city show that 3.7% or 971 of the total 26,185 families live below the poverty line. Families with 3 or 4 children have the highest poverty rate of 12.7%, comprising of 230 families. On the other hand, families with 5 or more children have the lowest poverty rate of 0.0%, which includes 0 families.
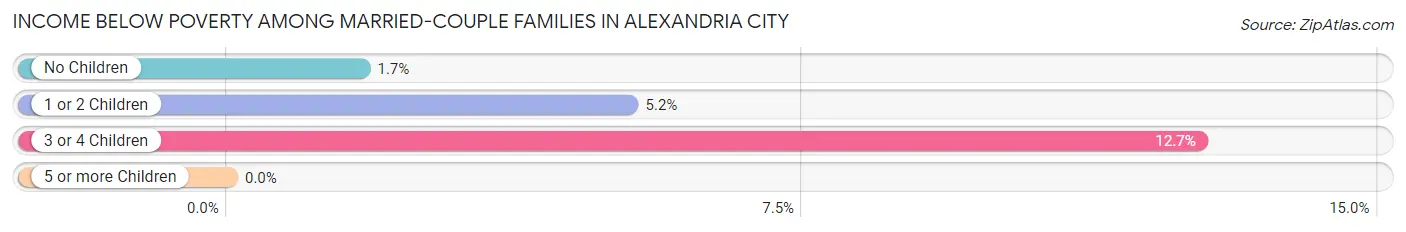
| Children | Above Poverty | Below Poverty |
| No Children | 14,901 (98.3%) | 262 (1.7%) |
| 1 or 2 Children | 8,678 (94.8%) | 479 (5.2%) |
| 3 or 4 Children | 1,587 (87.3%) | 230 (12.7%) |
| 5 or more Children | 48 (100.0%) | 0 (0.0%) |
| Total | 25,214 (96.3%) | 971 (3.7%) |
Income Below Poverty Among Single-Parent Households in Alexandria city
According to the poverty data in Alexandria city, 9.4% or 227 single-father households and 20.2% or 1,190 single-mother households are living below the poverty line. Among single-father households, those with 3 or 4 children have the highest poverty rate, with 16 households (55.2%) experiencing poverty. Likewise, among single-mother households, those with 5 or more children have the highest poverty rate, with 29 households (100.0%) falling below the poverty line.
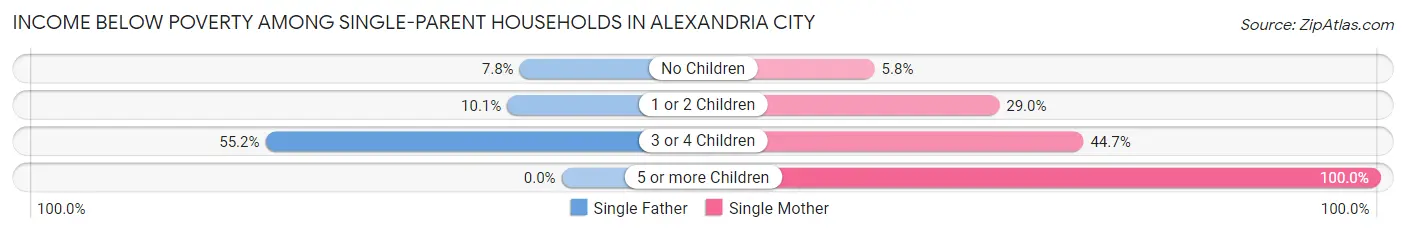
| Children | Single Father | Single Mother |
| No Children | 103 (7.8%) | 146 (5.8%) |
| 1 or 2 Children | 108 (10.1%) | 885 (29.0%) |
| 3 or 4 Children | 16 (55.2%) | 130 (44.7%) |
| 5 or more Children | 0 (0.0%) | 29 (100.0%) |
| Total | 227 (9.4%) | 1,190 (20.2%) |
Income Below Poverty Among Married-Couple vs Single-Parent Households in Alexandria city
The poverty data for Alexandria city shows that 971 of the married-couple family households (3.7%) and 1,417 of the single-parent households (17.0%) are living below the poverty level. Within the married-couple family households, those with 3 or 4 children have the highest poverty rate, with 230 households (12.7%) falling below the poverty line. Among the single-parent households, those with 5 or more children have the highest poverty rate, with 29 household (100.0%) living below poverty.
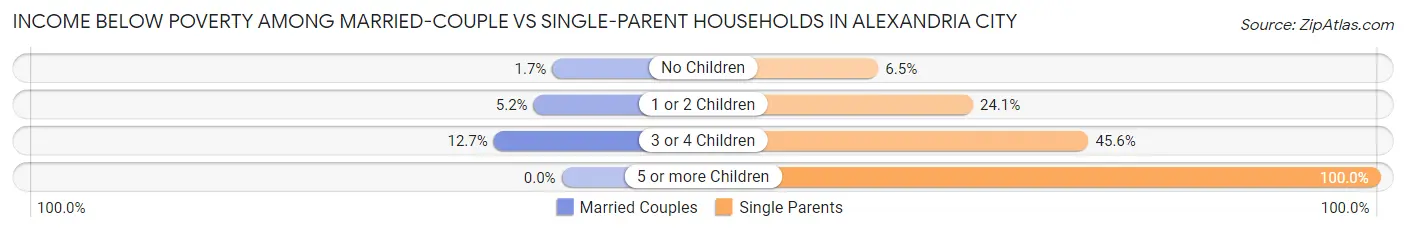
| Children | Married-Couple Families | Single-Parent Households |
| No Children | 262 (1.7%) | 249 (6.5%) |
| 1 or 2 Children | 479 (5.2%) | 993 (24.1%) |
| 3 or 4 Children | 230 (12.7%) | 146 (45.6%) |
| 5 or more Children | 0 (0.0%) | 29 (100.0%) |
| Total | 971 (3.7%) | 1,417 (17.0%) |
Race in Alexandria city
The most populous races in Alexandria city are White / Caucasian (89,304 | 56.7%), Black / African American (33,645 | 21.3%), and Hispanic or Latino (26,092 | 16.6%).
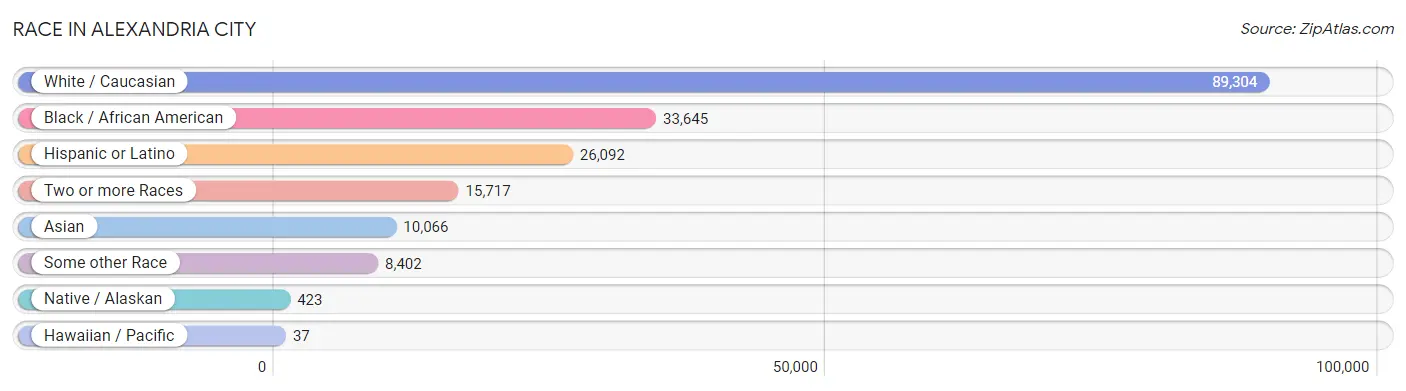
| Race | # Population | % Population |
| Asian | 10,066 | 6.4% |
| Black / African American | 33,645 | 21.3% |
| Hawaiian / Pacific | 37 | 0.0% |
| Hispanic or Latino | 26,092 | 16.6% |
| Native / Alaskan | 423 | 0.3% |
| White / Caucasian | 89,304 | 56.7% |
| Two or more Races | 15,717 | 10.0% |
| Some other Race | 8,402 | 5.3% |
| Total | 157,594 | 100.0% |
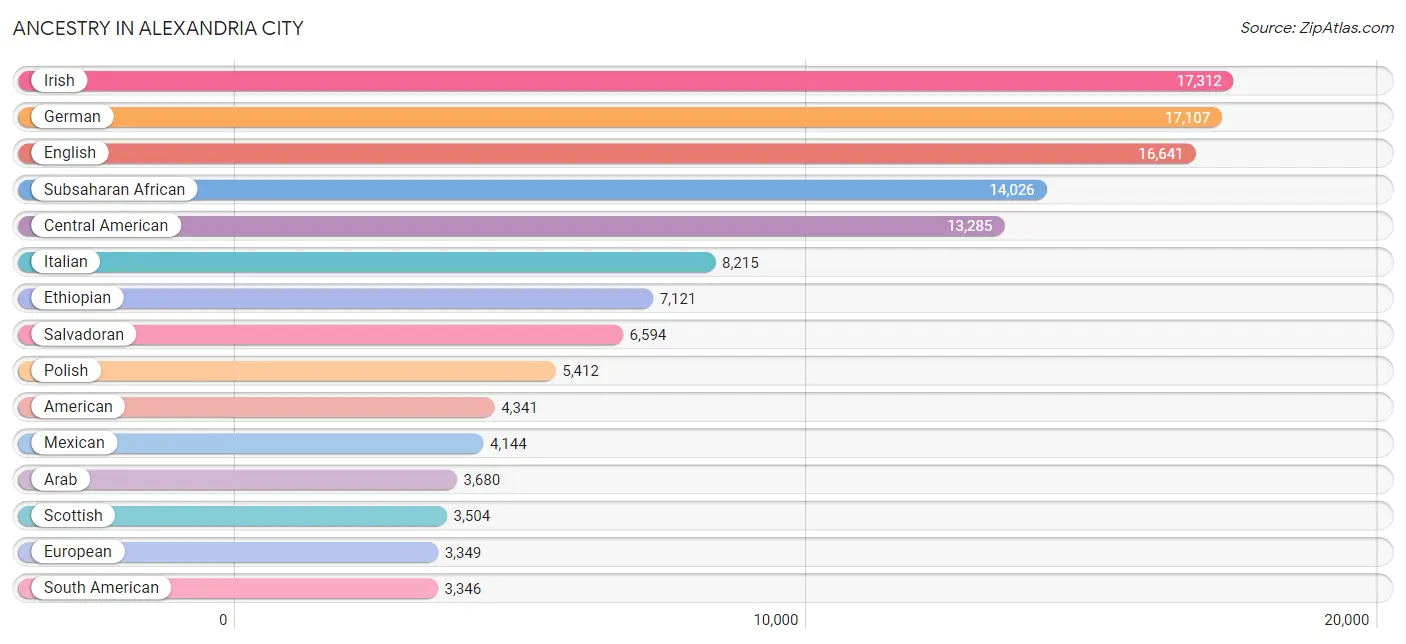
Ancestry in Alexandria city
The most populous ancestries reported in Alexandria city are Irish (17,312 | 11.0%), German (17,107 | 10.9%), English (16,641 | 10.6%), Subsaharan African (14,026 | 8.9%), and Central American (13,285 | 8.4%), together accounting for 49.7% of all Alexandria city residents.
| Ancestry | # Population | % Population |
| Afghan | 1,827 | 1.2% |
| African | 2,210 | 1.4% |
| Albanian | 120 | 0.1% |
| American | 4,341 | 2.8% |
| Apache | 32 | 0.0% |
| Arab | 3,680 | 2.3% |
| Argentinean | 262 | 0.2% |
| Armenian | 150 | 0.1% |
| Australian | 62 | 0.0% |
| Austrian | 414 | 0.3% |
| Bahamian | 26 | 0.0% |
| Bangladeshi | 11 | 0.0% |
| Barbadian | 36 | 0.0% |
| Basque | 9 | 0.0% |
| Belgian | 158 | 0.1% |
| Belizean | 11 | 0.0% |
| Bhutanese | 966 | 0.6% |
| Blackfeet | 99 | 0.1% |
| Bolivian | 995 | 0.6% |
| Brazilian | 314 | 0.2% |
| British | 1,643 | 1.0% |
| British West Indian | 54 | 0.0% |
| Bulgarian | 87 | 0.1% |
| Burmese | 1,979 | 1.3% |
| Cajun | 57 | 0.0% |
| Cambodian | 81 | 0.1% |
| Canadian | 202 | 0.1% |
| Cape Verdean | 30 | 0.0% |
| Carpatho Rusyn | 64 | 0.0% |
| Celtic | 41 | 0.0% |
| Central American | 13,285 | 8.4% |
| Central American Indian | 354 | 0.2% |
| Cherokee | 384 | 0.2% |
| Chickasaw | 8 | 0.0% |
| Chilean | 182 | 0.1% |
| Chippewa | 5 | 0.0% |
| Colombian | 562 | 0.4% |
| Costa Rican | 158 | 0.1% |
| Creek | 33 | 0.0% |
| Croatian | 284 | 0.2% |
| Cuban | 896 | 0.6% |
| Czech | 714 | 0.4% |
| Czechoslovakian | 60 | 0.0% |
| Danish | 422 | 0.3% |
| Dominican | 355 | 0.2% |
| Dutch | 1,029 | 0.6% |
| Eastern European | 874 | 0.5% |
| Ecuadorian | 297 | 0.2% |
| Egyptian | 431 | 0.3% |
| English | 16,641 | 10.6% |
| Estonian | 12 | 0.0% |
| Ethiopian | 7,121 | 4.5% |
| European | 3,349 | 2.1% |
| Filipino | 197 | 0.1% |
| Finnish | 345 | 0.2% |
| French | 3,114 | 2.0% |
| French Canadian | 591 | 0.4% |
| German | 17,107 | 10.9% |
| German Russian | 11 | 0.0% |
| Ghanaian | 795 | 0.5% |
| Greek | 871 | 0.5% |
| Guamanian / Chamorro | 42 | 0.0% |
| Guatemalan | 2,427 | 1.5% |
| Guyanese | 27 | 0.0% |
| Haitian | 100 | 0.1% |
| Honduran | 2,853 | 1.8% |
| Hungarian | 621 | 0.4% |
| Icelander | 22 | 0.0% |
| Indian (Asian) | 1,761 | 1.1% |
| Indonesian | 16 | 0.0% |
| Iranian | 444 | 0.3% |
| Iraqi | 139 | 0.1% |
| Irish | 17,312 | 11.0% |
| Iroquois | 8 | 0.0% |
| Israeli | 19 | 0.0% |
| Italian | 8,215 | 5.2% |
| Jamaican | 504 | 0.3% |
| Japanese | 26 | 0.0% |
| Jordanian | 323 | 0.2% |
| Kenyan | 37 | 0.0% |
| Kiowa | 84 | 0.1% |
| Korean | 2,161 | 1.4% |
| Laotian | 57 | 0.0% |
| Latvian | 87 | 0.1% |
| Lebanese | 641 | 0.4% |
| Liberian | 107 | 0.1% |
| Lithuanian | 365 | 0.2% |
| Lumbee | 85 | 0.1% |
| Luxembourger | 48 | 0.0% |
| Macedonian | 9 | 0.0% |
| Malaysian | 77 | 0.1% |
| Maltese | 43 | 0.0% |
| Mexican | 4,144 | 2.6% |
| Mexican American Indian | 131 | 0.1% |
| Mongolian | 10 | 0.0% |
| Moroccan | 1,243 | 0.8% |
| Native Hawaiian | 41 | 0.0% |
| New Zealander | 8 | 0.0% |
| Nicaraguan | 638 | 0.4% |
| Nigerian | 539 | 0.3% |
| Northern European | 448 | 0.3% |
| Norwegian | 1,508 | 1.0% |
| Osage | 12 | 0.0% |
| Pakistani | 209 | 0.1% |
| Palestinian | 196 | 0.1% |
| Panamanian | 544 | 0.4% |
| Pennsylvania German | 10 | 0.0% |
| Peruvian | 718 | 0.5% |
| Polish | 5,412 | 3.4% |
| Portuguese | 689 | 0.4% |
| Potawatomi | 19 | 0.0% |
| Puerto Rican | 2,646 | 1.7% |
| Romanian | 123 | 0.1% |
| Russian | 1,871 | 1.2% |
| Salvadoran | 6,594 | 4.2% |
| Samoan | 99 | 0.1% |
| Scandinavian | 263 | 0.2% |
| Scotch-Irish | 2,112 | 1.3% |
| Scottish | 3,504 | 2.2% |
| Seminole | 9 | 0.0% |
| Senegalese | 18 | 0.0% |
| Serbian | 175 | 0.1% |
| Sierra Leonean | 892 | 0.6% |
| Sioux | 54 | 0.0% |
| Slavic | 111 | 0.1% |
| Slovak | 436 | 0.3% |
| Slovene | 99 | 0.1% |
| Somali | 458 | 0.3% |
| South African | 76 | 0.1% |
| South American | 3,346 | 2.1% |
| Spaniard | 340 | 0.2% |
| Spanish | 185 | 0.1% |
| Spanish American | 14 | 0.0% |
| Spanish American Indian | 21 | 0.0% |
| Sri Lankan | 719 | 0.5% |
| Subsaharan African | 14,026 | 8.9% |
| Sudanese | 676 | 0.4% |
| Swedish | 1,782 | 1.1% |
| Swiss | 366 | 0.2% |
| Syrian | 115 | 0.1% |
| Thai | 1,885 | 1.2% |
| Tongan | 9 | 0.0% |
| Trinidadian and Tobagonian | 206 | 0.1% |
| Turkish | 303 | 0.2% |
| U.S. Virgin Islander | 13 | 0.0% |
| Ugandan | 79 | 0.1% |
| Ukrainian | 890 | 0.6% |
| Uruguayan | 61 | 0.0% |
| Venezuelan | 240 | 0.2% |
| Vietnamese | 467 | 0.3% |
| Welsh | 1,162 | 0.7% |
| West Indian | 56 | 0.0% |
| Yugoslavian | 51 | 0.0% |
| Zimbabwean | 42 | 0.0% | View All 154 Rows |
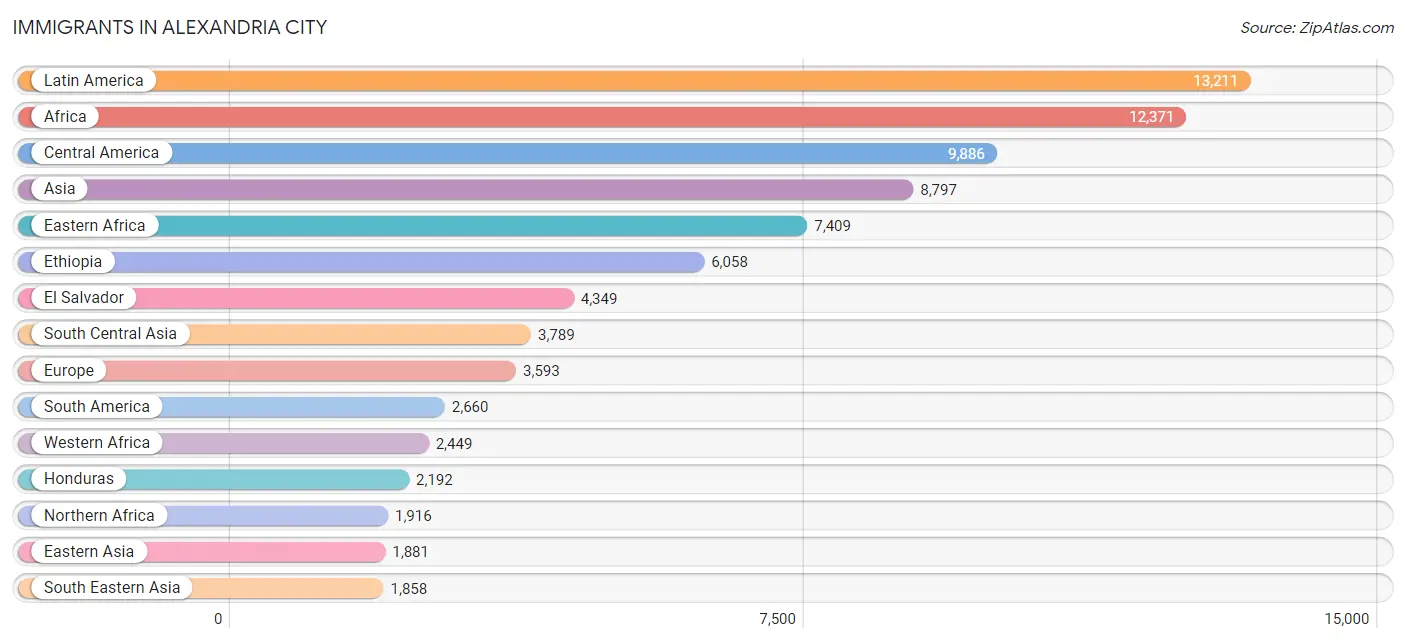
Immigrants in Alexandria city
The most numerous immigrant groups reported in Alexandria city came from Latin America (13,211 | 8.4%), Africa (12,371 | 7.9%), Central America (9,886 | 6.3%), Asia (8,797 | 5.6%), and Eastern Africa (7,409 | 4.7%), together accounting for 32.8% of all Alexandria city residents.
| Immigration Origin | # Population | % Population |
| Afghanistan | 1,656 | 1.1% |
| Africa | 12,371 | 7.9% |
| Albania | 34 | 0.0% |
| Argentina | 137 | 0.1% |
| Armenia | 15 | 0.0% |
| Asia | 8,797 | 5.6% |
| Australia | 188 | 0.1% |
| Austria | 1 | 0.0% |
| Bangladesh | 405 | 0.3% |
| Barbados | 12 | 0.0% |
| Belarus | 35 | 0.0% |
| Belgium | 47 | 0.0% |
| Bolivia | 1,025 | 0.6% |
| Bosnia and Herzegovina | 33 | 0.0% |
| Brazil | 310 | 0.2% |
| Bulgaria | 29 | 0.0% |
| Cambodia | 3 | 0.0% |
| Cameroon | 27 | 0.0% |
| Canada | 283 | 0.2% |
| Caribbean | 665 | 0.4% |
| Central America | 9,886 | 6.3% |
| Chile | 276 | 0.2% |
| China | 794 | 0.5% |
| Colombia | 318 | 0.2% |
| Costa Rica | 191 | 0.1% |
| Croatia | 36 | 0.0% |
| Cuba | 152 | 0.1% |
| Czechoslovakia | 69 | 0.0% |
| Denmark | 16 | 0.0% |
| Dominican Republic | 129 | 0.1% |
| Eastern Africa | 7,409 | 4.7% |
| Eastern Asia | 1,881 | 1.2% |
| Eastern Europe | 1,499 | 0.9% |
| Ecuador | 114 | 0.1% |
| Egypt | 190 | 0.1% |
| El Salvador | 4,349 | 2.8% |
| England | 306 | 0.2% |
| Eritrea | 377 | 0.2% |
| Ethiopia | 6,058 | 3.8% |
| Europe | 3,593 | 2.3% |
| France | 250 | 0.2% |
| Germany | 336 | 0.2% |
| Ghana | 870 | 0.5% |
| Greece | 132 | 0.1% |
| Guatemala | 1,487 | 0.9% |
| Guyana | 28 | 0.0% |
| Haiti | 25 | 0.0% |
| Honduras | 2,192 | 1.4% |
| Hong Kong | 101 | 0.1% |
| India | 647 | 0.4% |
| Indonesia | 64 | 0.0% |
| Iran | 267 | 0.2% |
| Iraq | 213 | 0.1% |
| Ireland | 159 | 0.1% |
| Israel | 12 | 0.0% |
| Italy | 116 | 0.1% |
| Jamaica | 197 | 0.1% |
| Japan | 300 | 0.2% |
| Jordan | 205 | 0.1% |
| Kazakhstan | 36 | 0.0% |
| Kenya | 141 | 0.1% |
| Korea | 706 | 0.4% |
| Kuwait | 26 | 0.0% |
| Laos | 54 | 0.0% |
| Latin America | 13,211 | 8.4% |
| Latvia | 13 | 0.0% |
| Lebanon | 98 | 0.1% |
| Liberia | 73 | 0.1% |
| Lithuania | 17 | 0.0% |
| Malaysia | 6 | 0.0% |
| Mexico | 969 | 0.6% |
| Middle Africa | 347 | 0.2% |
| Moldova | 9 | 0.0% |
| Morocco | 1,116 | 0.7% |
| Nepal | 7 | 0.0% |
| Netherlands | 88 | 0.1% |
| Nicaragua | 371 | 0.2% |
| Nigeria | 202 | 0.1% |
| North Macedonia | 23 | 0.0% |
| Northern Africa | 1,916 | 1.2% |
| Northern Europe | 903 | 0.6% |
| Norway | 36 | 0.0% |
| Oceania | 290 | 0.2% |
| Pakistan | 505 | 0.3% |
| Panama | 327 | 0.2% |
| Peru | 341 | 0.2% |
| Philippines | 1,099 | 0.7% |
| Poland | 347 | 0.2% |
| Portugal | 126 | 0.1% |
| Romania | 39 | 0.0% |
| Russia | 329 | 0.2% |
| Saudi Arabia | 85 | 0.1% |
| Scotland | 59 | 0.0% |
| Serbia | 77 | 0.1% |
| Sierra Leone | 842 | 0.5% |
| Singapore | 32 | 0.0% |
| Somalia | 308 | 0.2% |
| South Africa | 108 | 0.1% |
| South America | 2,660 | 1.7% |
| South Central Asia | 3,789 | 2.4% |
| South Eastern Asia | 1,858 | 1.2% |
| Southern Europe | 433 | 0.3% |
| Spain | 59 | 0.0% |
| Sri Lanka | 165 | 0.1% |
| Sudan | 574 | 0.4% |
| Switzerland | 36 | 0.0% |
| Syria | 33 | 0.0% |
| Taiwan | 86 | 0.1% |
| Thailand | 170 | 0.1% |
| Trinidad and Tobago | 120 | 0.1% |
| Turkey | 277 | 0.2% |
| Uganda | 53 | 0.0% |
| Ukraine | 189 | 0.1% |
| Uruguay | 21 | 0.0% |
| Uzbekistan | 71 | 0.1% |
| Venezuela | 90 | 0.1% |
| Vietnam | 408 | 0.3% |
| Western Africa | 2,449 | 1.5% |
| Western Asia | 1,186 | 0.7% |
| Western Europe | 758 | 0.5% |
| Yemen | 95 | 0.1% |
| Zaire | 127 | 0.1% |
| Zimbabwe | 23 | 0.0% | View All 123 Rows |
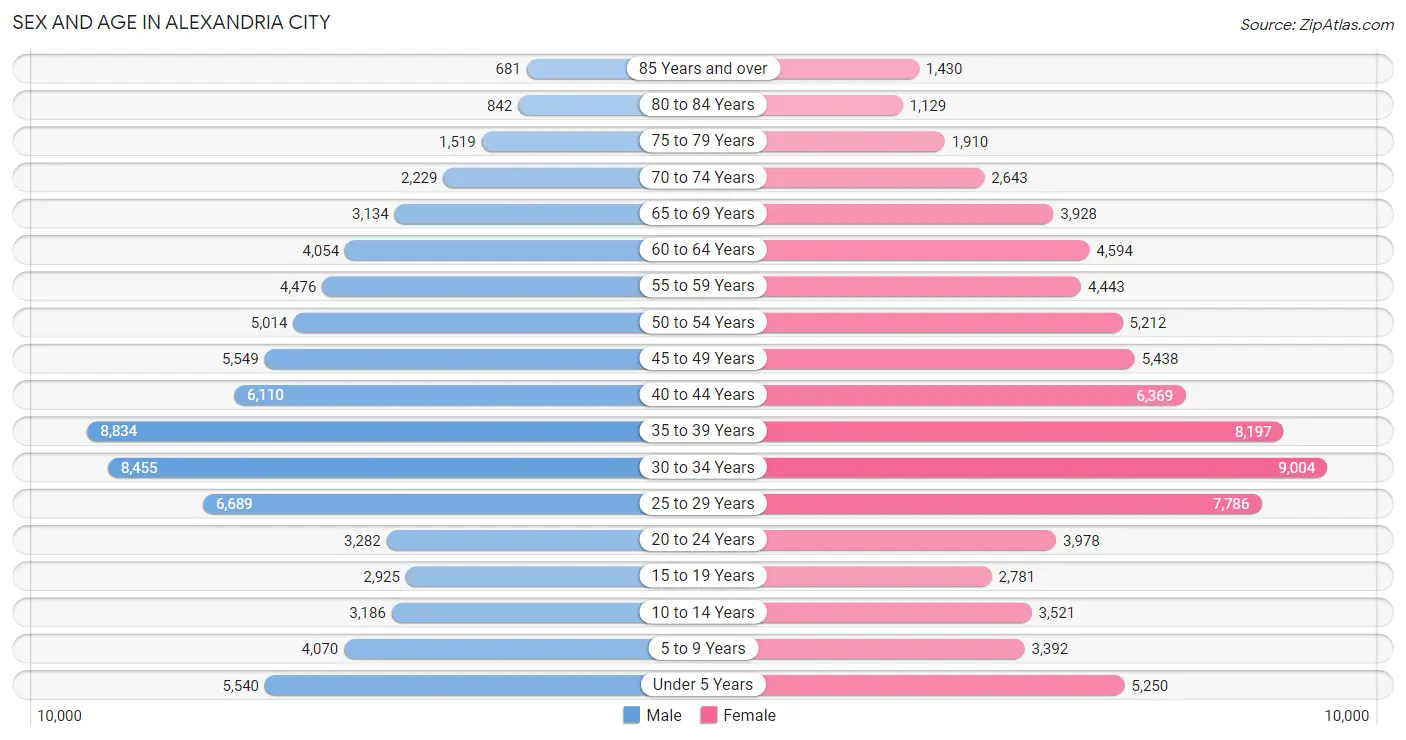
Sex and Age in Alexandria city
Sex and Age in Alexandria city
The most populous age groups in Alexandria city are 35 to 39 Years (8,834 | 11.5%) for men and 30 to 34 Years (9,004 | 11.1%) for women.
| Age Bracket | Male | Female |
| Under 5 Years | 5,540 (7.2%) | 5,250 (6.5%) |
| 5 to 9 Years | 4,070 (5.3%) | 3,392 (4.2%) |
| 10 to 14 Years | 3,186 (4.2%) | 3,521 (4.3%) |
| 15 to 19 Years | 2,925 (3.8%) | 2,781 (3.4%) |
| 20 to 24 Years | 3,282 (4.3%) | 3,978 (4.9%) |
| 25 to 29 Years | 6,689 (8.7%) | 7,786 (9.6%) |
| 30 to 34 Years | 8,455 (11.0%) | 9,004 (11.1%) |
| 35 to 39 Years | 8,834 (11.5%) | 8,197 (10.1%) |
| 40 to 44 Years | 6,110 (8.0%) | 6,369 (7.9%) |
| 45 to 49 Years | 5,549 (7.2%) | 5,438 (6.7%) |
| 50 to 54 Years | 5,014 (6.6%) | 5,212 (6.4%) |
| 55 to 59 Years | 4,476 (5.8%) | 4,443 (5.5%) |
| 60 to 64 Years | 4,054 (5.3%) | 4,594 (5.7%) |
| 65 to 69 Years | 3,134 (4.1%) | 3,928 (4.9%) |
| 70 to 74 Years | 2,229 (2.9%) | 2,643 (3.3%) |
| 75 to 79 Years | 1,519 (2.0%) | 1,910 (2.4%) |
| 80 to 84 Years | 842 (1.1%) | 1,129 (1.4%) |
| 85 Years and over | 681 (0.9%) | 1,430 (1.8%) |
| Total | 76,589 (100.0%) | 81,005 (100.0%) |
Families and Households in Alexandria city
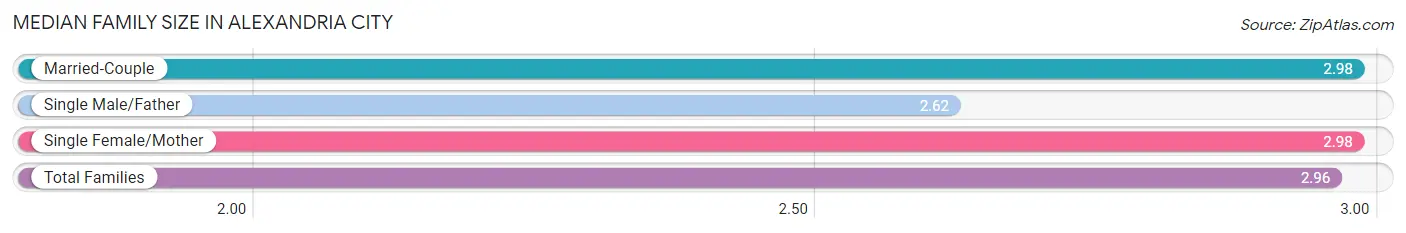
Median Family Size in Alexandria city
The median family size in Alexandria city is 2.96 persons per family, with married-couple families (26,185 | 75.9%) accounting for the largest median family size of 2.98 persons per family. On the other hand, single male/father families (2,410 | 7.0%) represent the smallest median family size with 2.62 persons per family.
| Family Type | # Families | Family Size |
| Married-Couple | 26,185 (75.9%) | 2.98 |
| Single Male/Father | 2,410 (7.0%) | 2.62 |
| Single Female/Mother | 5,906 (17.1%) | 2.98 |
| Total Families | 34,501 (100.0%) | 2.96 |
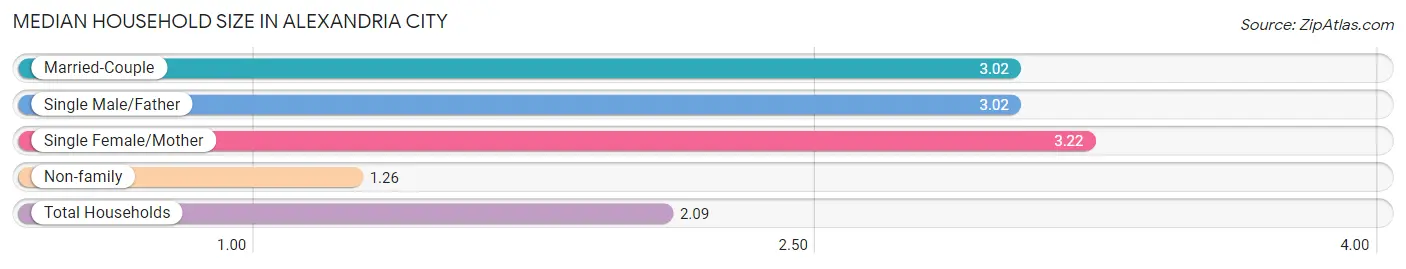
Median Household Size in Alexandria city
The median household size in Alexandria city is 2.09 persons per household, with single female/mother households (5,906 | 7.9%) accounting for the largest median household size of 3.22 persons per household. non-family households (40,317 | 53.9%) represent the smallest median household size with 1.26 persons per household.
| Household Type | # Households | Household Size |
| Married-Couple | 26,185 (35.0%) | 3.02 |
| Single Male/Father | 2,410 (3.2%) | 3.02 |
| Single Female/Mother | 5,906 (7.9%) | 3.22 |
| Non-family | 40,317 (53.9%) | 1.26 |
| Total Households | 74,818 (100.0%) | 2.09 |
Household Size by Marriage Status in Alexandria city
Out of a total of 74,818 households in Alexandria city, 34,501 (46.1%) are family households, while 40,317 (53.9%) are nonfamily households. The most numerous type of family households are 2-person households, comprising 17,014, and the most common type of nonfamily households are 1-person households, comprising 32,425.
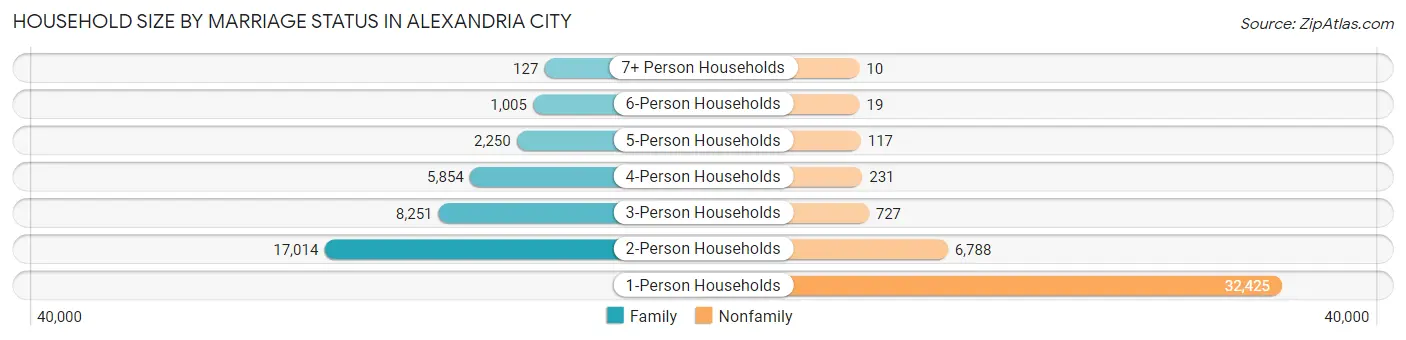
| Household Size | Family Households | Nonfamily Households |
| 1-Person Households | - | 32,425 (43.3%) |
| 2-Person Households | 17,014 (22.7%) | 6,788 (9.1%) |
| 3-Person Households | 8,251 (11.0%) | 727 (1.0%) |
| 4-Person Households | 5,854 (7.8%) | 231 (0.3%) |
| 5-Person Households | 2,250 (3.0%) | 117 (0.2%) |
| 6-Person Households | 1,005 (1.3%) | 19 (0.0%) |
| 7+ Person Households | 127 (0.2%) | 10 (0.0%) |
| Total | 34,501 (46.1%) | 40,317 (53.9%) |
Female Fertility in Alexandria city
Fertility by Age in Alexandria city
Average fertility rate in Alexandria city is 42.0 births per 1,000 women. Women in the age bracket of 20 to 34 years have the highest fertility rate with 55.0 births per 1,000 women. Women in the age bracket of 20 to 34 years acount for 61.7% of all women with births.
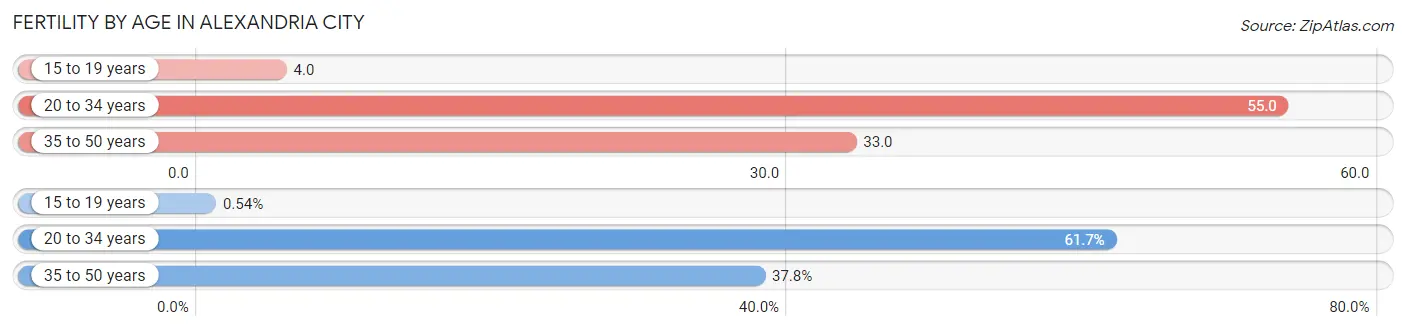
| Age Bracket | Women with Births | Births / 1,000 Women |
| 15 to 19 years | 10 (0.5%) | 4.0 |
| 20 to 34 years | 1,140 (61.7%) | 55.0 |
| 35 to 50 years | 699 (37.8%) | 33.0 |
| Total | 1,849 (100.0%) | 42.0 |
Fertility by Age by Marriage Status in Alexandria city
81.2% of women with births (1,849) in Alexandria city are married. The highest percentage of unmarried women with births falls into 15 to 19 years age bracket with 100.0% of them unmarried at the time of birth, while the lowest percentage of unmarried women with births belong to 35 to 50 years age bracket with 9.9% of them unmarried.
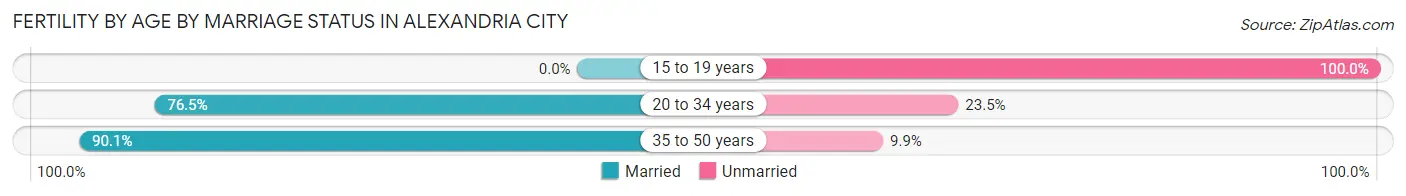
| Age Bracket | Married | Unmarried |
| 15 to 19 years | 0 (0.0%) | 10 (100.0%) |
| 20 to 34 years | 872 (76.5%) | 268 (23.5%) |
| 35 to 50 years | 630 (90.1%) | 69 (9.9%) |
| Total | 1,501 (81.2%) | 348 (18.8%) |
Fertility by Education in Alexandria city
Average fertility rate in Alexandria city is 42.0 births per 1,000 women. Women with the education attainment of graduate degree have the highest fertility rate of 52.0 births per 1,000 women, while women with the education attainment of college or associate's degree have the lowest fertility at 30.0 births per 1,000 women. Women with the education attainment of graduate degree represent 40.5% of all women with births.
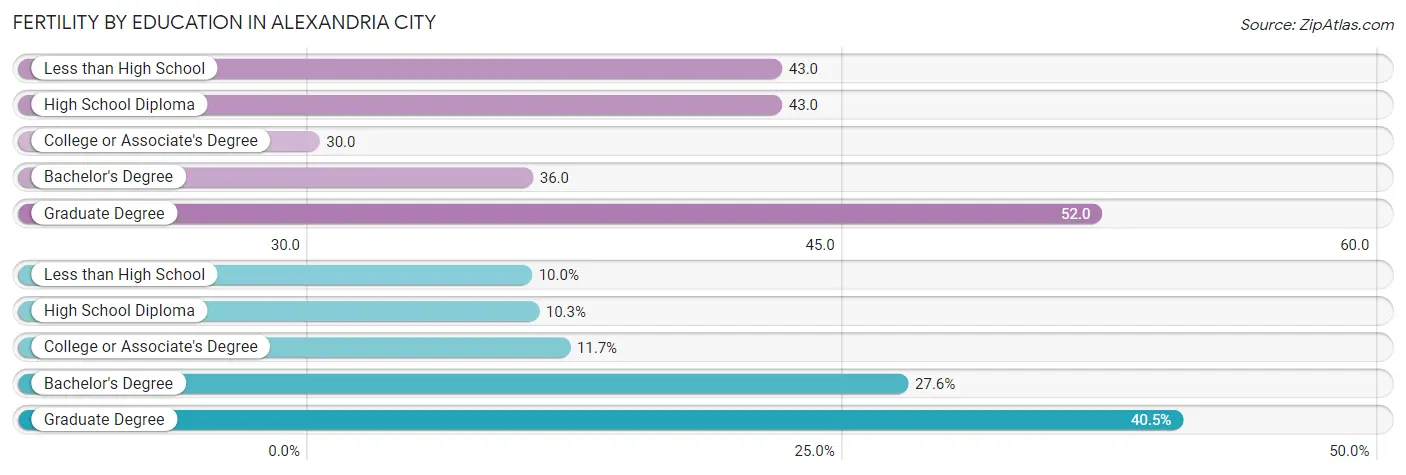
| Educational Attainment | Women with Births | Births / 1,000 Women |
| Less than High School | 184 (10.0%) | 43.0 |
| High School Diploma | 190 (10.3%) | 43.0 |
| College or Associate's Degree | 217 (11.7%) | 30.0 |
| Bachelor's Degree | 510 (27.6%) | 36.0 |
| Graduate Degree | 748 (40.5%) | 52.0 |
| Total | 1,849 (100.0%) | 42.0 |
Fertility by Education by Marriage Status in Alexandria city
18.8% of women with births in Alexandria city are unmarried. Women with the educational attainment of bachelor's degree are most likely to be married with 100.0% of them married at childbirth, while women with the educational attainment of high school diploma are least likely to be married with 93.2% of them unmarried at childbirth.
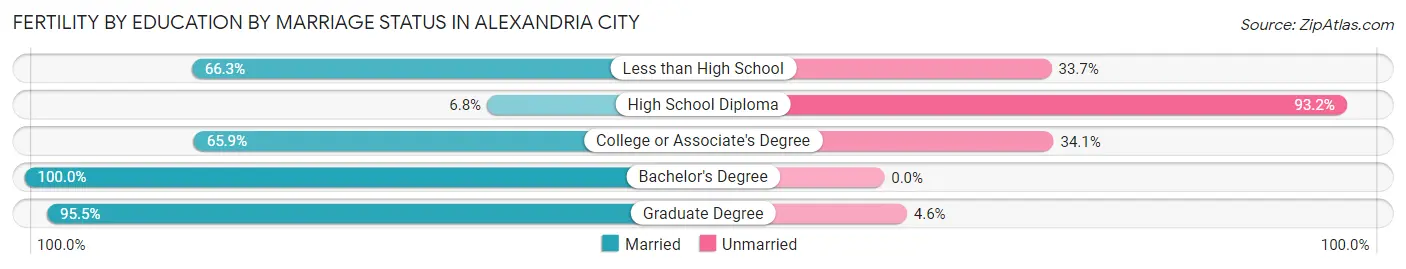
| Educational Attainment | Married | Unmarried |
| Less than High School | 122 (66.3%) | 62 (33.7%) |
| High School Diploma | 13 (6.8%) | 177 (93.2%) |
| College or Associate's Degree | 143 (65.9%) | 74 (34.1%) |
| Bachelor's Degree | 510 (100.0%) | 0 (0.0%) |
| Graduate Degree | 714 (95.5%) | 34 (4.5%) |
| Total | 1,501 (81.2%) | 348 (18.8%) |
Employment Characteristics in Alexandria city
Employment by Class of Employer in Alexandria city
Among the 97,901 employed individuals in Alexandria city, private company employees (50,310 | 51.4%), federal government employees (20,937 | 21.4%), and not-for-profit organizations (12,423 | 12.7%) make up the most common classes of employment.
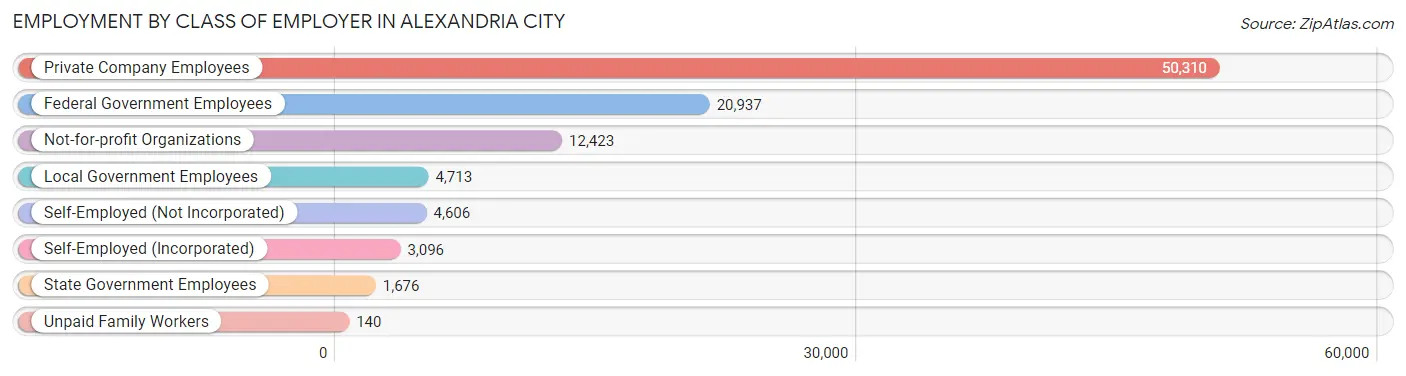
| Employer Class | # Employees | % Employees |
| Private Company Employees | 50,310 | 51.4% |
| Self-Employed (Incorporated) | 3,096 | 3.2% |
| Self-Employed (Not Incorporated) | 4,606 | 4.7% |
| Not-for-profit Organizations | 12,423 | 12.7% |
| Local Government Employees | 4,713 | 4.8% |
| State Government Employees | 1,676 | 1.7% |
| Federal Government Employees | 20,937 | 21.4% |
| Unpaid Family Workers | 140 | 0.1% |
| Total | 97,901 | 100.0% |
Employment Status by Age in Alexandria city
According to the labor force statistics for Alexandria city, out of the total population over 16 years of age (131,404), 78.0% or 102,495 individuals are in the labor force, with 3.2% or 3,280 of them unemployed. The age group with the highest labor force participation rate is 30 to 34 years, with 93.8% or 16,377 individuals in the labor force. Within the labor force, the 16 to 19 years age range has the highest percentage of unemployed individuals, with 12.2% or 171 of them being unemployed.
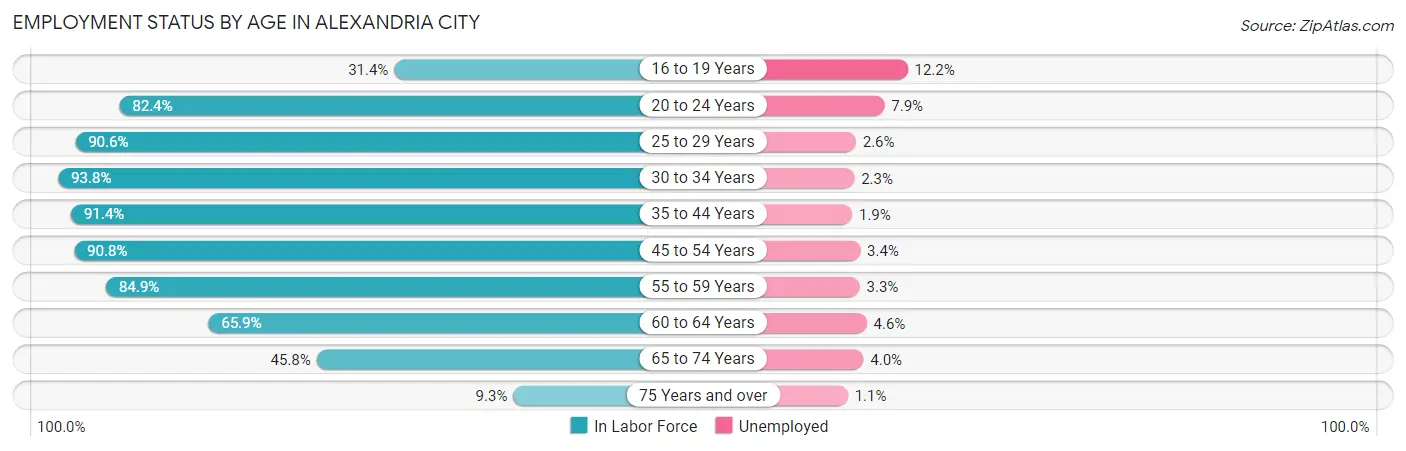
| Age Bracket | In Labor Force | Unemployed |
| 16 to 19 Years | 1,405 (31.4%) | 171 (12.2%) |
| 20 to 24 Years | 5,982 (82.4%) | 473 (7.9%) |
| 25 to 29 Years | 13,114 (90.6%) | 341 (2.6%) |
| 30 to 34 Years | 16,377 (93.8%) | 377 (2.3%) |
| 35 to 44 Years | 26,972 (91.4%) | 512 (1.9%) |
| 45 to 54 Years | 19,261 (90.8%) | 655 (3.4%) |
| 55 to 59 Years | 7,572 (84.9%) | 250 (3.3%) |
| 60 to 64 Years | 5,699 (65.9%) | 262 (4.6%) |
| 65 to 74 Years | 5,466 (45.8%) | 219 (4.0%) |
| 75 Years and over | 699 (9.3%) | 8 (1.1%) |
| Total | 102,495 (78.0%) | 3,280 (3.2%) |
Employment Status by Educational Attainment in Alexandria city
According to labor force statistics for Alexandria city, 88.8% of individuals (88,999) out of the total population between 25 and 64 years of age (100,224) are in the labor force, with 2.7% or 2,403 of them being unemployed. The group with the highest labor force participation rate are those with the educational attainment of bachelor's degree or higher, with 92.2% or 62,125 individuals in the labor force. Within the labor force, individuals with less than high school education have the highest percentage of unemployment, with 7.1% or 332 of them being unemployed.
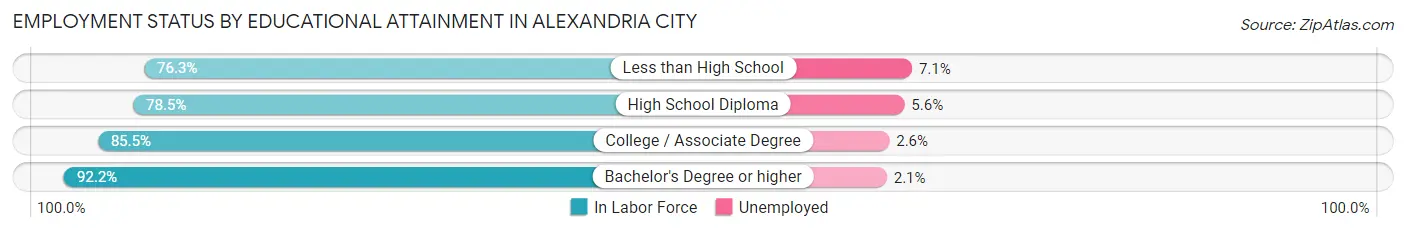
| Educational Attainment | In Labor Force | Unemployed |
| Less than High School | 4,676 (76.3%) | 435 (7.1%) |
| High School Diploma | 7,483 (78.5%) | 534 (5.6%) |
| College / Associate Degree | 14,691 (85.5%) | 447 (2.6%) |
| Bachelor's Degree or higher | 62,125 (92.2%) | 1,415 (2.1%) |
| Total | 88,999 (88.8%) | 2,706 (2.7%) |
Employment Occupations by Sex in Alexandria city
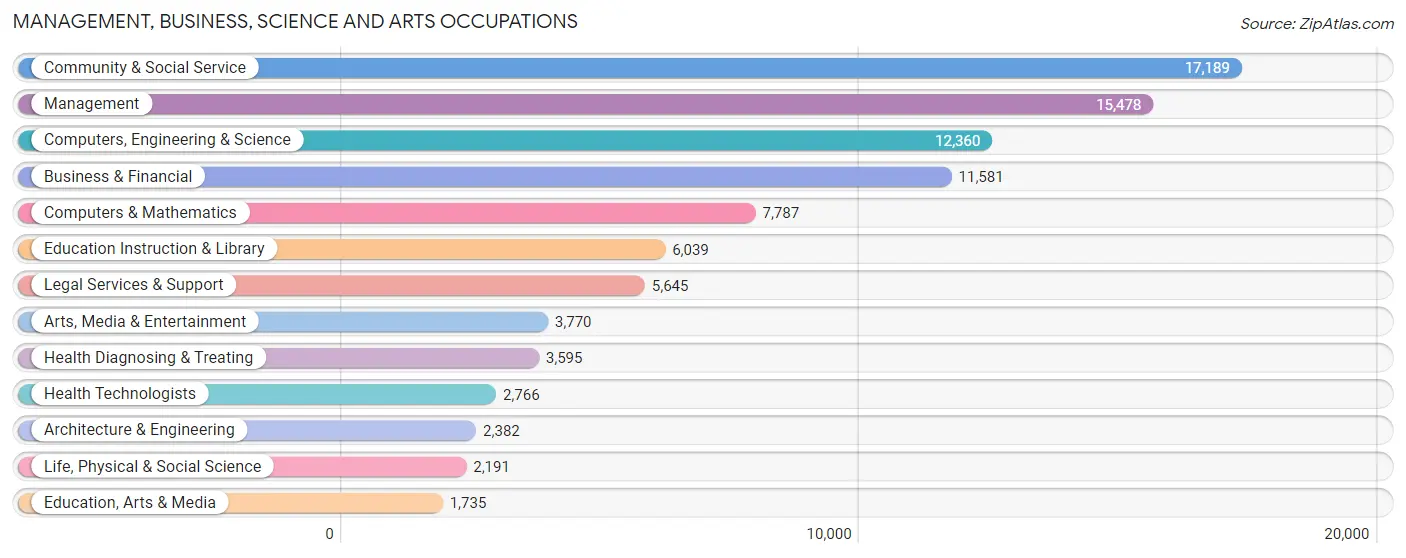
Management, Business, Science and Arts Occupations
The most common Management, Business, Science and Arts occupations in Alexandria city are Community & Social Service (17,189 | 17.9%), Management (15,478 | 16.1%), Computers, Engineering & Science (12,360 | 12.9%), Business & Financial (11,581 | 12.0%), and Computers & Mathematics (7,787 | 8.1%).
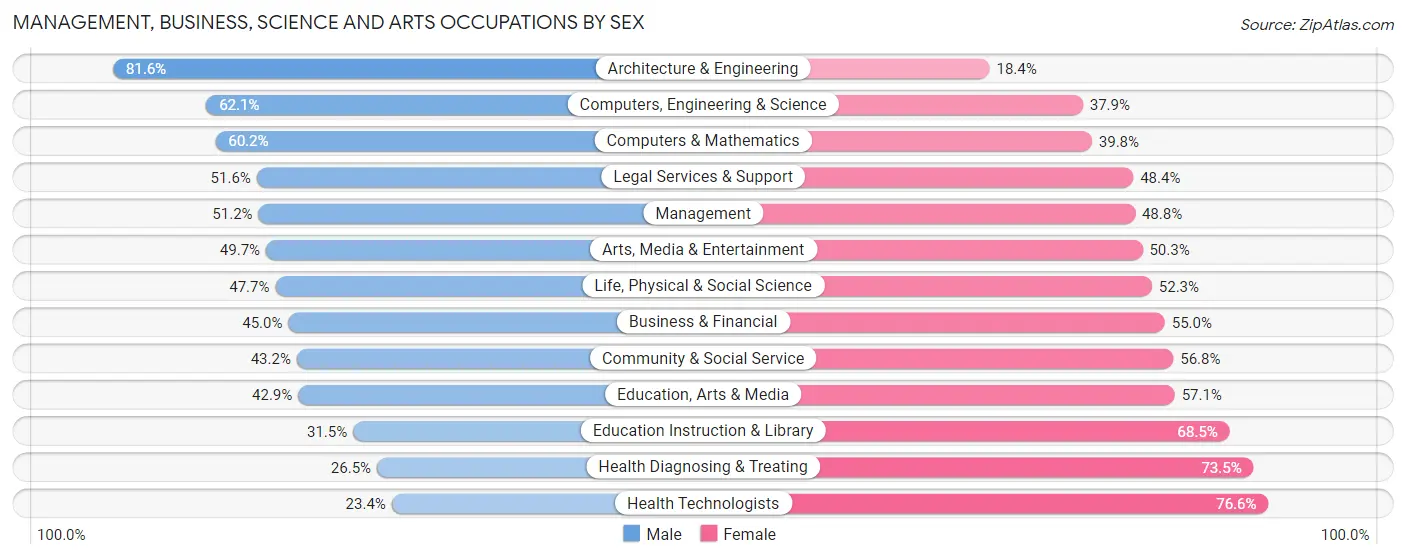
Management, Business, Science and Arts Occupations by Sex
Within the Management, Business, Science and Arts occupations in Alexandria city, the most male-oriented occupations are Architecture & Engineering (81.6%), Computers, Engineering & Science (62.1%), and Computers & Mathematics (60.2%), while the most female-oriented occupations are Health Technologists (76.6%), Health Diagnosing & Treating (73.5%), and Education Instruction & Library (68.5%).
| Occupation | Male | Female |
| Management | 7,929 (51.2%) | 7,549 (48.8%) |
| Business & Financial | 5,211 (45.0%) | 6,370 (55.0%) |
| Computers, Engineering & Science | 7,677 (62.1%) | 4,683 (37.9%) |
| Computers & Mathematics | 4,689 (60.2%) | 3,098 (39.8%) |
| Architecture & Engineering | 1,943 (81.6%) | 439 (18.4%) |
| Life, Physical & Social Science | 1,045 (47.7%) | 1,146 (52.3%) |
| Community & Social Service | 7,430 (43.2%) | 9,759 (56.8%) |
| Education, Arts & Media | 745 (42.9%) | 990 (57.1%) |
| Legal Services & Support | 2,912 (51.6%) | 2,733 (48.4%) |
| Education Instruction & Library | 1,901 (31.5%) | 4,138 (68.5%) |
| Arts, Media & Entertainment | 1,872 (49.7%) | 1,898 (50.3%) |
| Health Diagnosing & Treating | 953 (26.5%) | 2,642 (73.5%) |
| Health Technologists | 648 (23.4%) | 2,118 (76.6%) |
| Total (Category) | 29,200 (48.5%) | 31,003 (51.5%) |
| Total (Overall) | 48,736 (50.6%) | 47,487 (49.3%) |
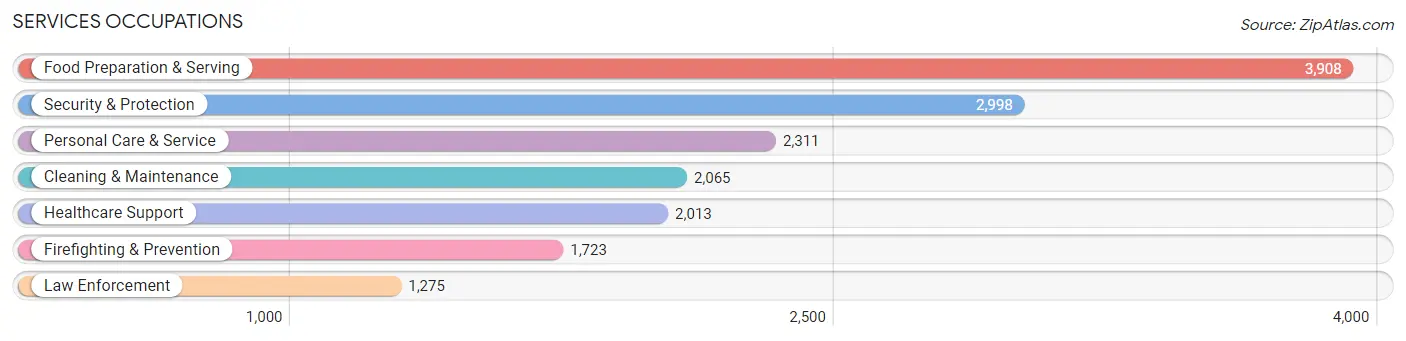
Services Occupations
The most common Services occupations in Alexandria city are Food Preparation & Serving (3,908 | 4.1%), Security & Protection (2,998 | 3.1%), Personal Care & Service (2,311 | 2.4%), Cleaning & Maintenance (2,065 | 2.1%), and Healthcare Support (2,013 | 2.1%).
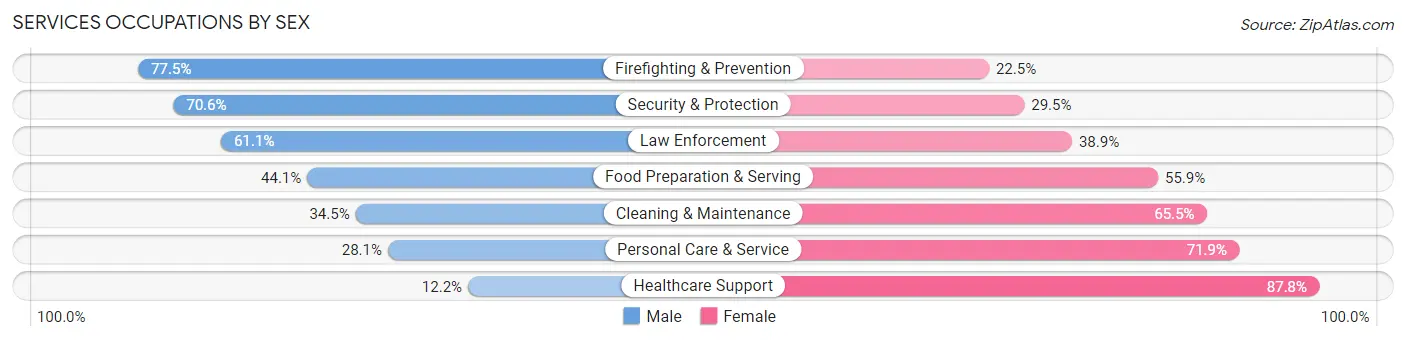
Services Occupations by Sex
Within the Services occupations in Alexandria city, the most male-oriented occupations are Firefighting & Prevention (77.5%), Security & Protection (70.6%), and Law Enforcement (61.1%), while the most female-oriented occupations are Healthcare Support (87.8%), Personal Care & Service (71.9%), and Cleaning & Maintenance (65.5%).
| Occupation | Male | Female |
| Healthcare Support | 246 (12.2%) | 1,767 (87.8%) |
| Security & Protection | 2,115 (70.6%) | 883 (29.4%) |
| Firefighting & Prevention | 1,336 (77.5%) | 387 (22.5%) |
| Law Enforcement | 779 (61.1%) | 496 (38.9%) |
| Food Preparation & Serving | 1,722 (44.1%) | 2,186 (55.9%) |
| Cleaning & Maintenance | 712 (34.5%) | 1,353 (65.5%) |
| Personal Care & Service | 649 (28.1%) | 1,662 (71.9%) |
| Total (Category) | 5,444 (40.9%) | 7,851 (59.1%) |
| Total (Overall) | 48,736 (50.6%) | 47,487 (49.3%) |
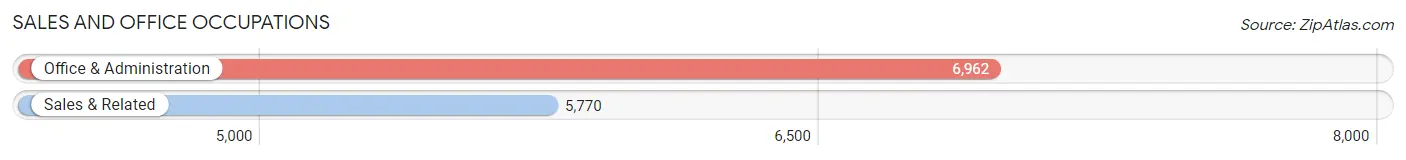
Sales and Office Occupations
The most common Sales and Office occupations in Alexandria city are Office & Administration (6,962 | 7.2%), and Sales & Related (5,770 | 6.0%).
Sales and Office Occupations by Sex
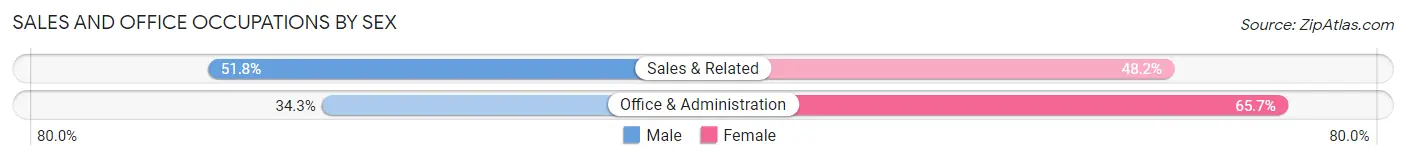
| Occupation | Male | Female |
| Sales & Related | 2,989 (51.8%) | 2,781 (48.2%) |
| Office & Administration | 2,389 (34.3%) | 4,573 (65.7%) |
| Total (Category) | 5,378 (42.2%) | 7,354 (57.8%) |
| Total (Overall) | 48,736 (50.6%) | 47,487 (49.3%) |
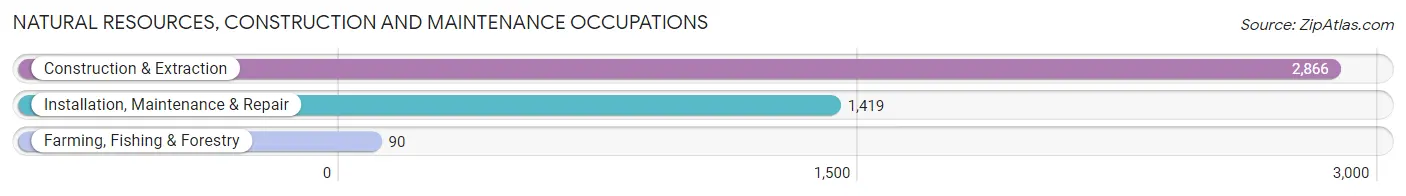
Natural Resources, Construction and Maintenance Occupations
The most common Natural Resources, Construction and Maintenance occupations in Alexandria city are Construction & Extraction (2,866 | 3.0%), Installation, Maintenance & Repair (1,419 | 1.5%), and Farming, Fishing & Forestry (90 | 0.1%).
Natural Resources, Construction and Maintenance Occupations by Sex
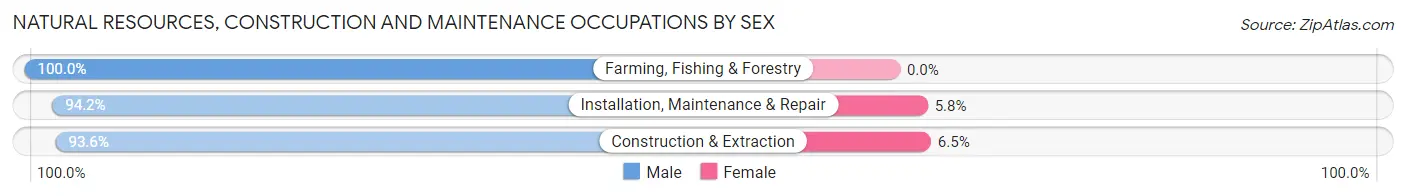
| Occupation | Male | Female |
| Farming, Fishing & Forestry | 90 (100.0%) | 0 (0.0%) |
| Construction & Extraction | 2,681 (93.5%) | 185 (6.5%) |
| Installation, Maintenance & Repair | 1,337 (94.2%) | 82 (5.8%) |
| Total (Category) | 4,108 (93.9%) | 267 (6.1%) |
| Total (Overall) | 48,736 (50.6%) | 47,487 (49.3%) |
Production, Transportation and Moving Occupations
The most common Production, Transportation and Moving occupations in Alexandria city are Transportation (3,285 | 3.4%), Material Moving (1,285 | 1.3%), and Production (1,048 | 1.1%).
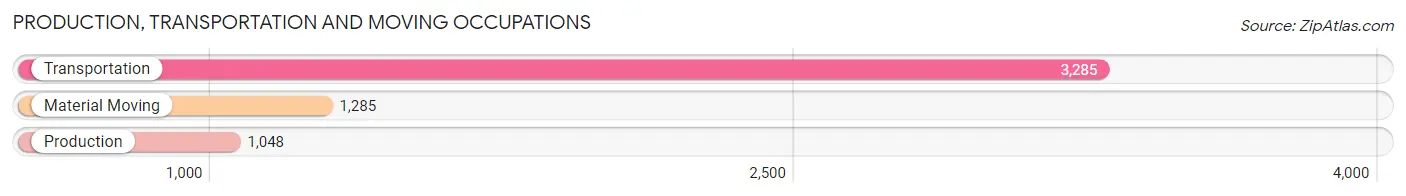
Production, Transportation and Moving Occupations by Sex
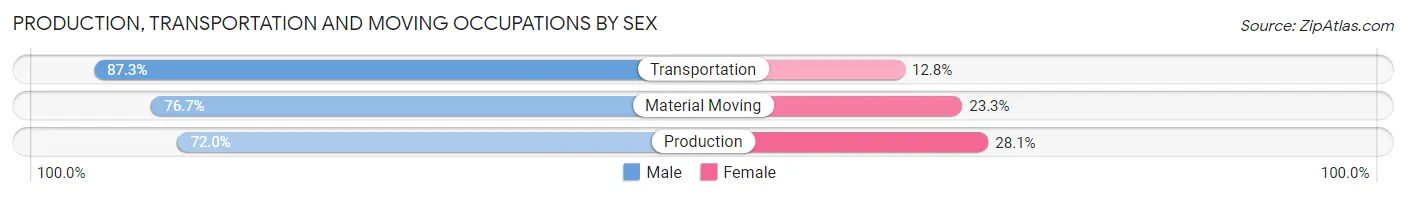
| Occupation | Male | Female |
| Production | 754 (72.0%) | 294 (28.1%) |
| Transportation | 2,866 (87.3%) | 419 (12.8%) |
| Material Moving | 986 (76.7%) | 299 (23.3%) |
| Total (Category) | 4,606 (82.0%) | 1,012 (18.0%) |
| Total (Overall) | 48,736 (50.6%) | 47,487 (49.3%) |
Employment Industries by Sex in Alexandria city
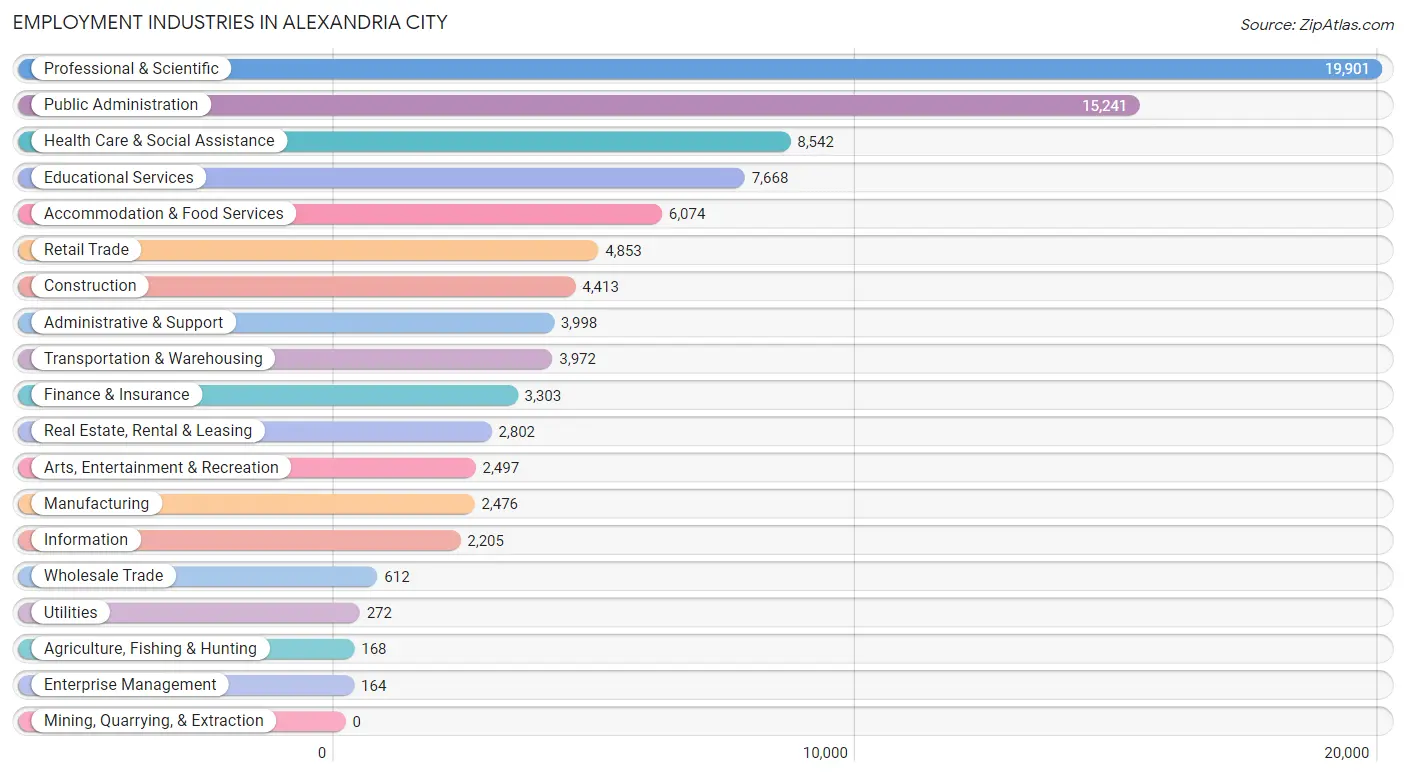
Employment Industries in Alexandria city
The major employment industries in Alexandria city include Professional & Scientific (19,901 | 20.7%), Public Administration (15,241 | 15.8%), Health Care & Social Assistance (8,542 | 8.9%), Educational Services (7,668 | 8.0%), and Accommodation & Food Services (6,074 | 6.3%).
Employment Industries by Sex in Alexandria city
The Alexandria city industries that see more men than women are Agriculture, Fishing & Hunting (94.1%), Construction (82.2%), and Utilities (79.4%), whereas the industries that tend to have a higher number of women are Health Care & Social Assistance (77.1%), Educational Services (68.0%), and Accommodation & Food Services (57.5%).
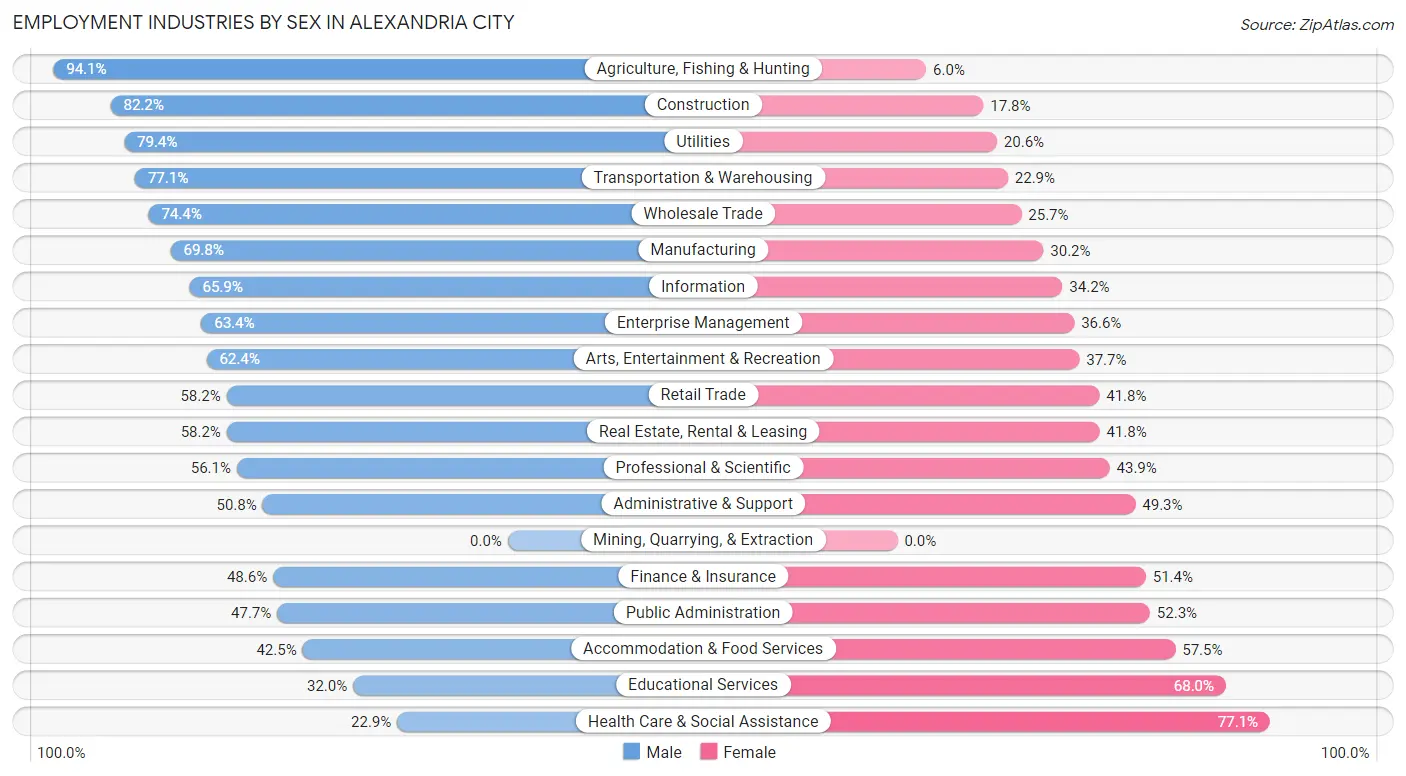
| Industry | Male | Female |
| Agriculture, Fishing & Hunting | 158 (94.1%) | 10 (5.9%) |
| Mining, Quarrying, & Extraction | 0 (0.0%) | 0 (0.0%) |
| Construction | 3,628 (82.2%) | 785 (17.8%) |
| Manufacturing | 1,728 (69.8%) | 748 (30.2%) |
| Wholesale Trade | 455 (74.4%) | 157 (25.7%) |
| Retail Trade | 2,825 (58.2%) | 2,028 (41.8%) |
| Transportation & Warehousing | 3,064 (77.1%) | 908 (22.9%) |
| Utilities | 216 (79.4%) | 56 (20.6%) |
| Information | 1,452 (65.8%) | 753 (34.2%) |
| Finance & Insurance | 1,605 (48.6%) | 1,698 (51.4%) |
| Real Estate, Rental & Leasing | 1,630 (58.2%) | 1,172 (41.8%) |
| Professional & Scientific | 11,160 (56.1%) | 8,741 (43.9%) |
| Enterprise Management | 104 (63.4%) | 60 (36.6%) |
| Administrative & Support | 2,029 (50.7%) | 1,969 (49.2%) |
| Educational Services | 2,455 (32.0%) | 5,213 (68.0%) |
| Health Care & Social Assistance | 1,956 (22.9%) | 6,586 (77.1%) |
| Arts, Entertainment & Recreation | 1,557 (62.4%) | 940 (37.7%) |
| Accommodation & Food Services | 2,580 (42.5%) | 3,494 (57.5%) |
| Public Administration | 7,276 (47.7%) | 7,965 (52.3%) |
| Total | 48,736 (50.6%) | 47,487 (49.3%) |
Education in Alexandria city
School Enrollment in Alexandria city
The most common levels of schooling among the 30,663 students in Alexandria city are elementary school (5,939 | 19.4%), college / undergraduate (5,378 | 17.5%), and high school (5,342 | 17.4%).

| School Level | # Students | % Students |
| Nursery / Preschool | 2,710 | 8.8% |
| Kindergarten | 1,601 | 5.2% |
| Elementary School | 5,939 | 19.4% |
| Middle School | 5,111 | 16.7% |
| High School | 5,342 | 17.4% |
| College / Undergraduate | 5,378 | 17.5% |
| Graduate / Professional | 4,582 | 14.9% |
| Total | 30,663 | 100.0% |
School Enrollment by Age by Funding Source in Alexandria city
Out of a total of 30,663 students who are enrolled in schools in Alexandria city, 8,616 (28.1%) attend a private institution, while the remaining 22,047 (71.9%) are enrolled in public schools. The age group of 3 to 4 year olds has the highest likelihood of being enrolled in private schools, with 1,448 (58.7% in the age bracket) enrolled. Conversely, the age group of 18 to 19 year olds has the lowest likelihood of being enrolled in a private school, with 1,400 (81.5% in the age bracket) attending a public institution.
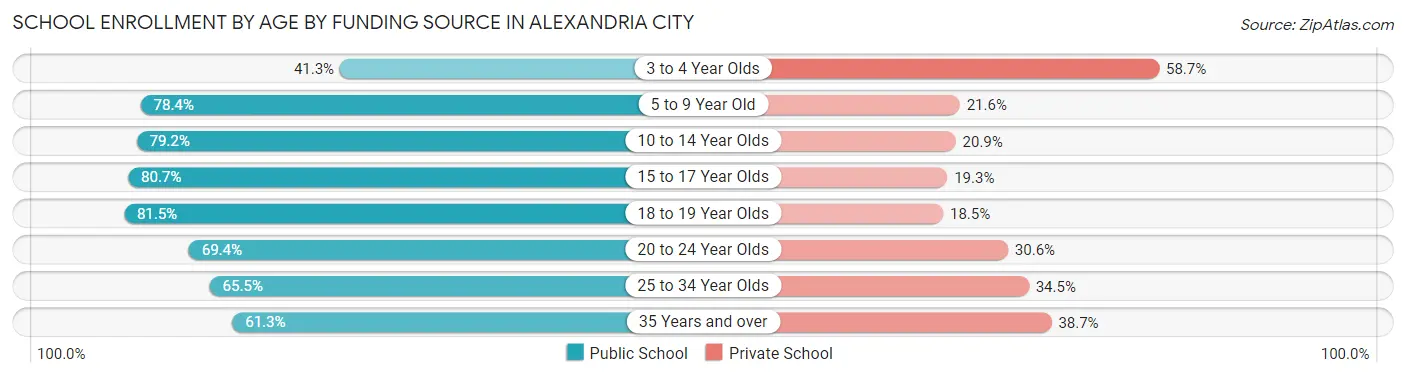
| Age Bracket | Public School | Private School |
| 3 to 4 Year Olds | 1,017 (41.3%) | 1,448 (58.7%) |
| 5 to 9 Year Old | 5,529 (78.4%) | 1,525 (21.6%) |
| 10 to 14 Year Olds | 5,194 (79.1%) | 1,368 (20.8%) |
| 15 to 17 Year Olds | 2,757 (80.7%) | 659 (19.3%) |
| 18 to 19 Year Olds | 1,400 (81.5%) | 318 (18.5%) |
| 20 to 24 Year Olds | 1,715 (69.4%) | 756 (30.6%) |
| 25 to 34 Year Olds | 2,652 (65.5%) | 1,395 (34.5%) |
| 35 Years and over | 1,796 (61.3%) | 1,134 (38.7%) |
| Total | 22,047 (71.9%) | 8,616 (28.1%) |
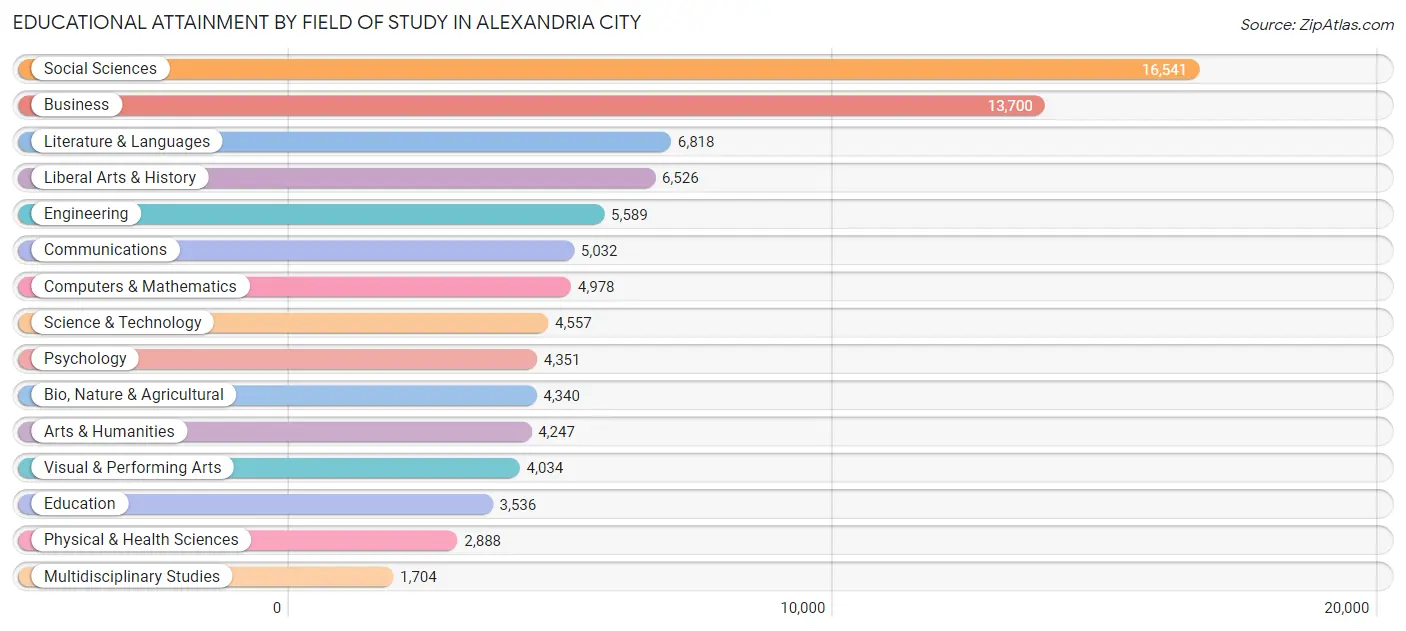
Educational Attainment by Field of Study in Alexandria city
Social sciences (16,541 | 18.6%), business (13,700 | 15.4%), literature & languages (6,818 | 7.7%), liberal arts & history (6,526 | 7.3%), and engineering (5,589 | 6.3%) are the most common fields of study among 88,841 individuals in Alexandria city who have obtained a bachelor's degree or higher.
| Field of Study | # Graduates | % Graduates |
| Computers & Mathematics | 4,978 | 5.6% |
| Bio, Nature & Agricultural | 4,340 | 4.9% |
| Physical & Health Sciences | 2,888 | 3.3% |
| Psychology | 4,351 | 4.9% |
| Social Sciences | 16,541 | 18.6% |
| Engineering | 5,589 | 6.3% |
| Multidisciplinary Studies | 1,704 | 1.9% |
| Science & Technology | 4,557 | 5.1% |
| Business | 13,700 | 15.4% |
| Education | 3,536 | 4.0% |
| Literature & Languages | 6,818 | 7.7% |
| Liberal Arts & History | 6,526 | 7.3% |
| Visual & Performing Arts | 4,034 | 4.5% |
| Communications | 5,032 | 5.7% |
| Arts & Humanities | 4,247 | 4.8% |
| Total | 88,841 | 100.0% |
Transportation & Commute in Alexandria city
Vehicle Availability by Sex in Alexandria city
The most prevalent vehicle ownership categories in Alexandria city are males with 2 vehicles (21,416, accounting for 42.3%) and females with 2 vehicles (17,468, making up 45.5%).
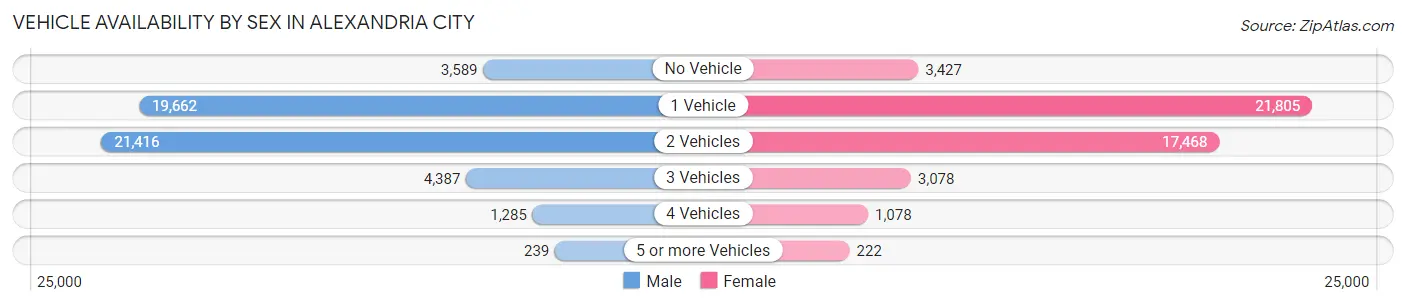
| Vehicles Available | Male | Female |
| No Vehicle | 3,589 (7.1%) | 3,427 (7.3%) |
| 1 Vehicle | 19,662 (38.9%) | 21,805 (46.3%) |
| 2 Vehicles | 21,416 (42.3%) | 17,468 (37.1%) |
| 3 Vehicles | 4,387 (8.7%) | 3,078 (6.5%) |
| 4 Vehicles | 1,285 (2.5%) | 1,078 (2.3%) |
| 5 or more Vehicles | 239 (0.5%) | 222 (0.5%) |
| Total | 50,578 (100.0%) | 47,078 (100.0%) |
Commute Time in Alexandria city
The most frequently occuring commute durations in Alexandria city are 30 to 34 minutes (13,302 commuters, 17.4%), 20 to 24 minutes (11,213 commuters, 14.7%), and 45 to 59 minutes (10,454 commuters, 13.7%).
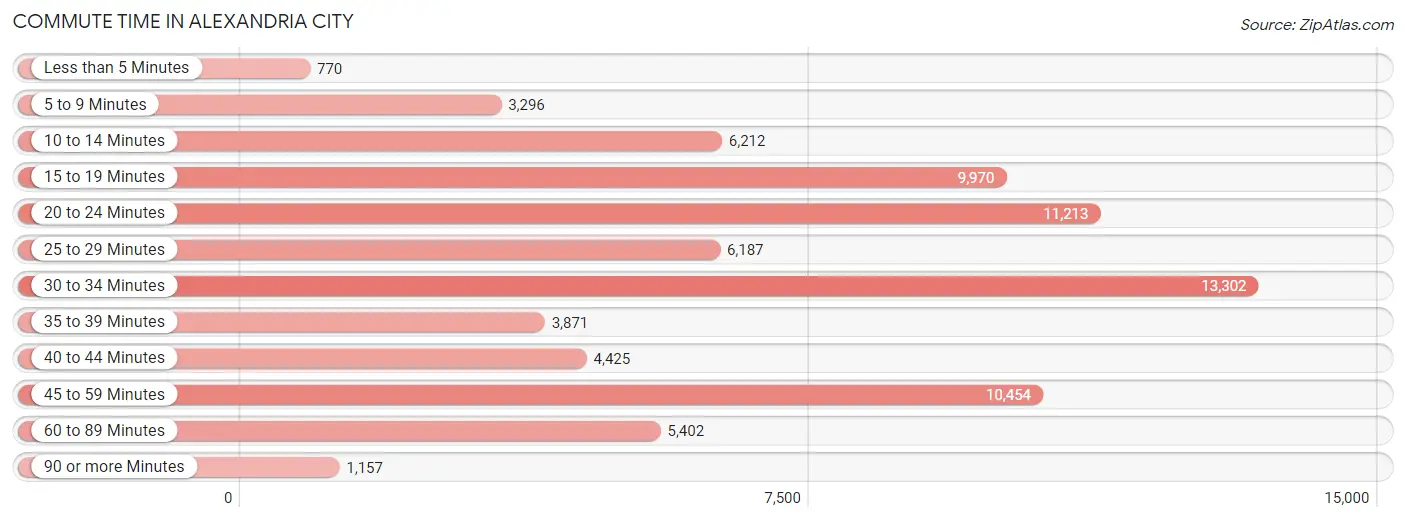
| Commute Time | # Commuters | % Commuters |
| Less than 5 Minutes | 770 | 1.0% |
| 5 to 9 Minutes | 3,296 | 4.3% |
| 10 to 14 Minutes | 6,212 | 8.2% |
| 15 to 19 Minutes | 9,970 | 13.1% |
| 20 to 24 Minutes | 11,213 | 14.7% |
| 25 to 29 Minutes | 6,187 | 8.1% |
| 30 to 34 Minutes | 13,302 | 17.4% |
| 35 to 39 Minutes | 3,871 | 5.1% |
| 40 to 44 Minutes | 4,425 | 5.8% |
| 45 to 59 Minutes | 10,454 | 13.7% |
| 60 to 89 Minutes | 5,402 | 7.1% |
| 90 or more Minutes | 1,157 | 1.5% |
Commute Time by Sex in Alexandria city
The most common commute times in Alexandria city are 30 to 34 minutes (7,144 commuters, 17.6%) for males and 30 to 34 minutes (6,158 commuters, 17.3%) for females.
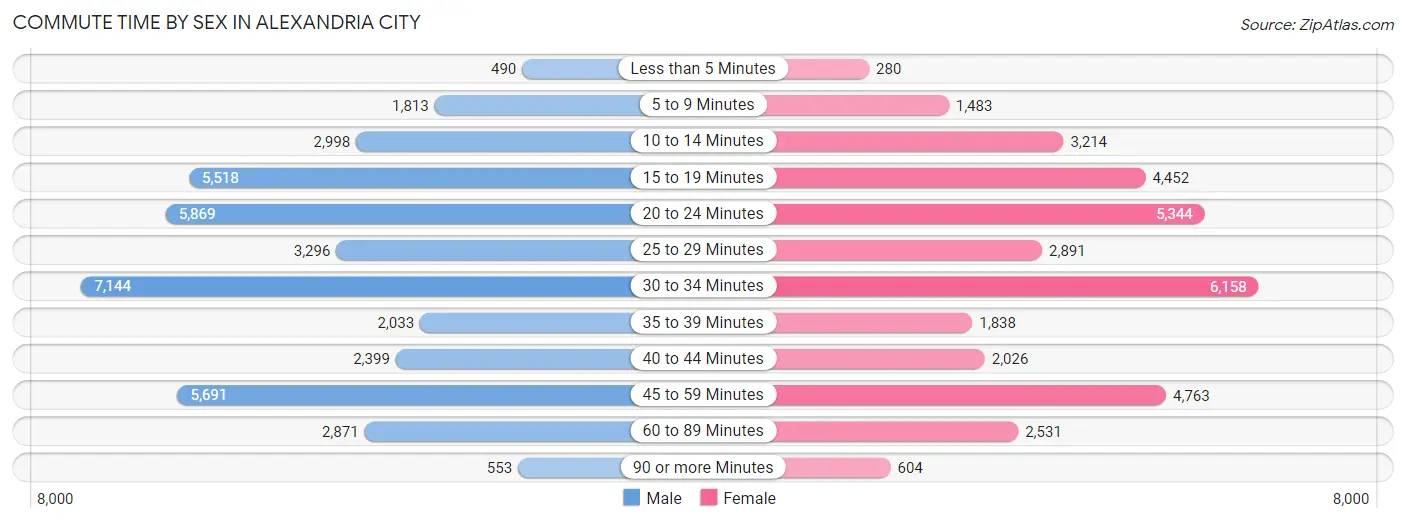
| Commute Time | Male | Female |
| Less than 5 Minutes | 490 (1.2%) | 280 (0.8%) |
| 5 to 9 Minutes | 1,813 (4.5%) | 1,483 (4.2%) |
| 10 to 14 Minutes | 2,998 (7.4%) | 3,214 (9.0%) |
| 15 to 19 Minutes | 5,518 (13.6%) | 4,452 (12.5%) |
| 20 to 24 Minutes | 5,869 (14.4%) | 5,344 (15.0%) |
| 25 to 29 Minutes | 3,296 (8.1%) | 2,891 (8.1%) |
| 30 to 34 Minutes | 7,144 (17.6%) | 6,158 (17.3%) |
| 35 to 39 Minutes | 2,033 (5.0%) | 1,838 (5.2%) |
| 40 to 44 Minutes | 2,399 (5.9%) | 2,026 (5.7%) |
| 45 to 59 Minutes | 5,691 (14.0%) | 4,763 (13.4%) |
| 60 to 89 Minutes | 2,871 (7.1%) | 2,531 (7.1%) |
| 90 or more Minutes | 553 (1.4%) | 604 (1.7%) |
Time of Departure to Work by Sex in Alexandria city
The most frequent times of departure to work in Alexandria city are 7:00 AM to 7:29 AM (6,464, 15.9%) for males and 7:30 AM to 7:59 AM (5,757, 16.2%) for females.
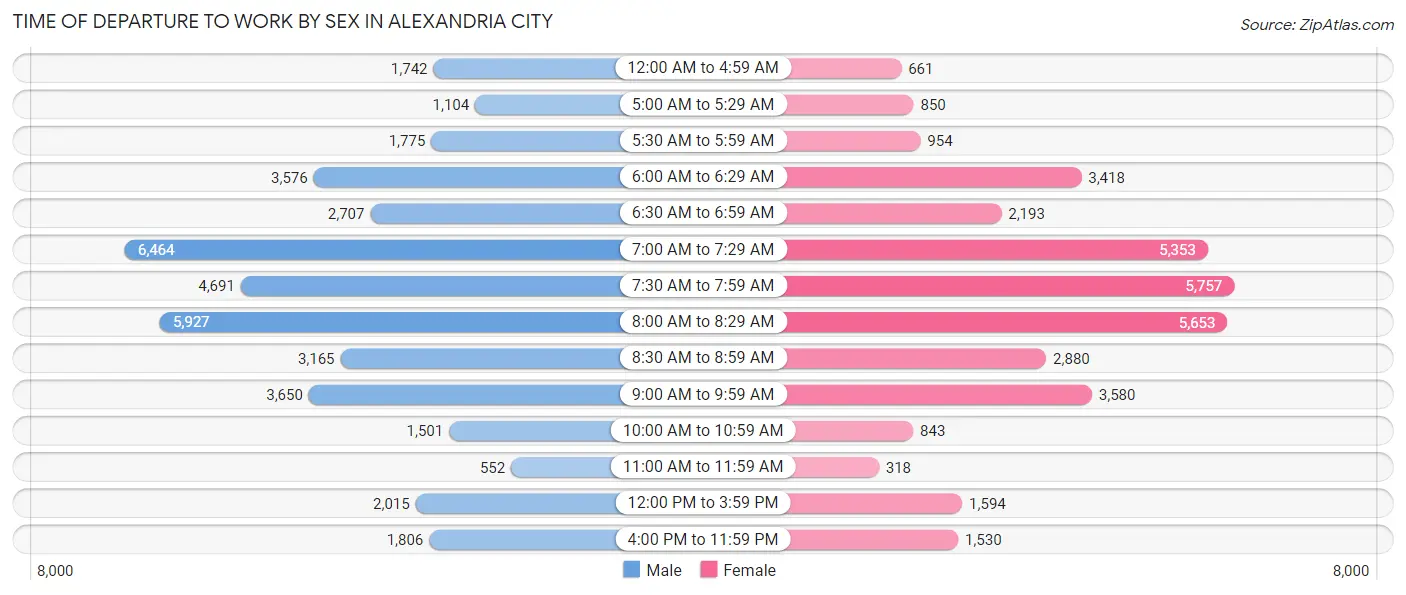
| Time of Departure | Male | Female |
| 12:00 AM to 4:59 AM | 1,742 (4.3%) | 661 (1.9%) |
| 5:00 AM to 5:29 AM | 1,104 (2.7%) | 850 (2.4%) |
| 5:30 AM to 5:59 AM | 1,775 (4.4%) | 954 (2.7%) |
| 6:00 AM to 6:29 AM | 3,576 (8.8%) | 3,418 (9.6%) |
| 6:30 AM to 6:59 AM | 2,707 (6.7%) | 2,193 (6.2%) |
| 7:00 AM to 7:29 AM | 6,464 (15.9%) | 5,353 (15.0%) |
| 7:30 AM to 7:59 AM | 4,691 (11.5%) | 5,757 (16.2%) |
| 8:00 AM to 8:29 AM | 5,927 (14.6%) | 5,653 (15.9%) |
| 8:30 AM to 8:59 AM | 3,165 (7.8%) | 2,880 (8.1%) |
| 9:00 AM to 9:59 AM | 3,650 (9.0%) | 3,580 (10.1%) |
| 10:00 AM to 10:59 AM | 1,501 (3.7%) | 843 (2.4%) |
| 11:00 AM to 11:59 AM | 552 (1.4%) | 318 (0.9%) |
| 12:00 PM to 3:59 PM | 2,015 (5.0%) | 1,594 (4.5%) |
| 4:00 PM to 11:59 PM | 1,806 (4.4%) | 1,530 (4.3%) |
| Total | 40,675 (100.0%) | 35,584 (100.0%) |
Housing Occupancy in Alexandria city
Occupancy by Ownership in Alexandria city
Of the total 74,818 dwellings in Alexandria city, owner-occupied units account for 31,933 (42.7%), while renter-occupied units make up 42,885 (57.3%).
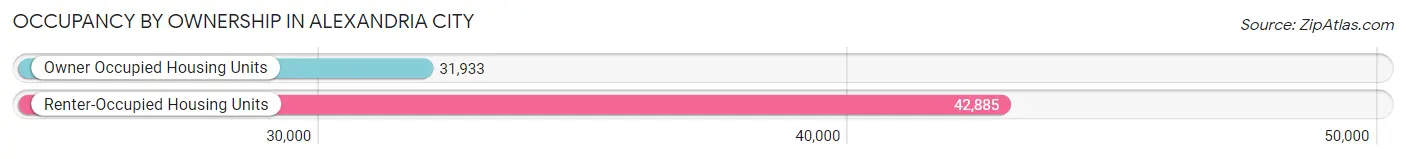
| Occupancy | # Housing Units | % Housing Units |
| Owner Occupied Housing Units | 31,933 | 42.7% |
| Renter-Occupied Housing Units | 42,885 | 57.3% |
| Total Occupied Housing Units | 74,818 | 100.0% |
Occupancy by Household Size in Alexandria city
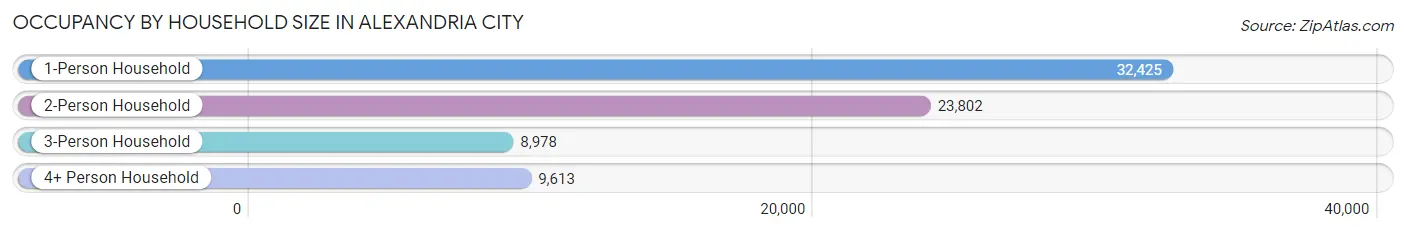
| Household Size | # Housing Units | % Housing Units |
| 1-Person Household | 32,425 | 43.3% |
| 2-Person Household | 23,802 | 31.8% |
| 3-Person Household | 8,978 | 12.0% |
| 4+ Person Household | 9,613 | 12.9% |
| Total Housing Units | 74,818 | 100.0% |
Occupancy by Ownership by Household Size in Alexandria city
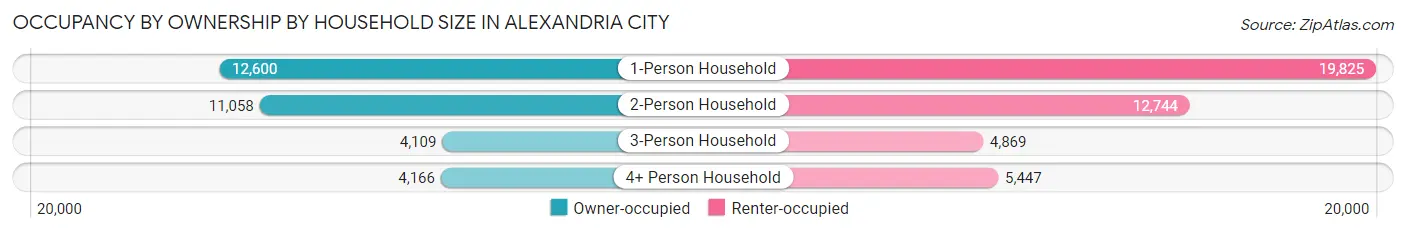
| Household Size | Owner-occupied | Renter-occupied |
| 1-Person Household | 12,600 (38.9%) | 19,825 (61.1%) |
| 2-Person Household | 11,058 (46.5%) | 12,744 (53.5%) |
| 3-Person Household | 4,109 (45.8%) | 4,869 (54.2%) |
| 4+ Person Household | 4,166 (43.3%) | 5,447 (56.7%) |
| Total Housing Units | 31,933 (42.7%) | 42,885 (57.3%) |
Occupancy by Educational Attainment in Alexandria city
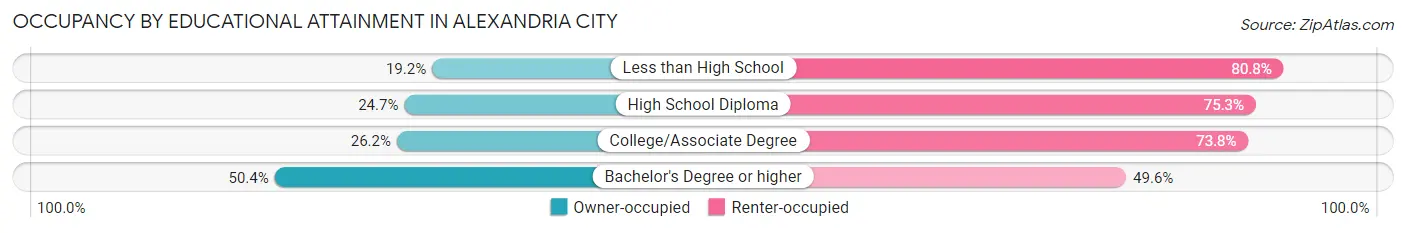
| Household Size | Owner-occupied | Renter-occupied |
| Less than High School | 690 (19.2%) | 2,899 (80.8%) |
| High School Diploma | 1,632 (24.7%) | 4,968 (75.3%) |
| College/Associate Degree | 3,232 (26.2%) | 9,098 (73.8%) |
| Bachelor's Degree or higher | 26,379 (50.4%) | 25,920 (49.6%) |
Occupancy by Age of Householder in Alexandria city
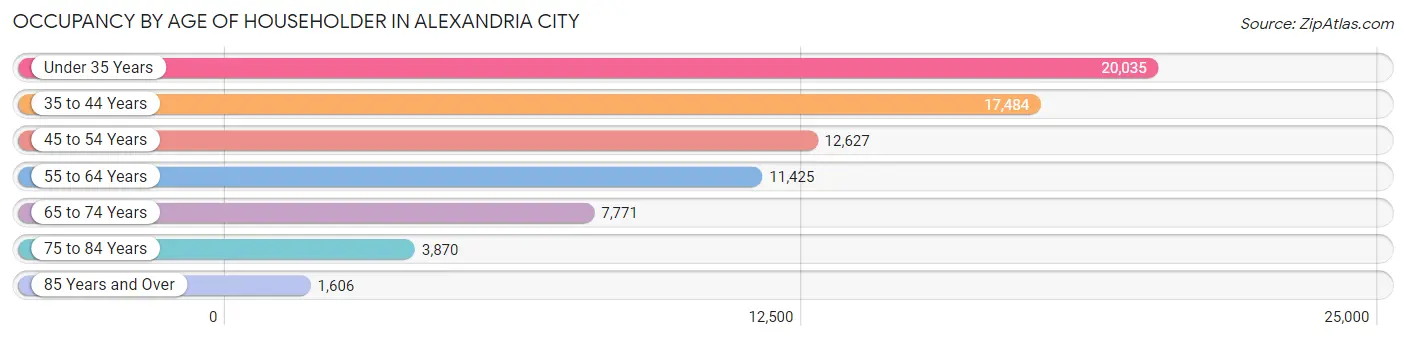
| Age Bracket | # Households | % Households |
| Under 35 Years | 20,035 | 26.8% |
| 35 to 44 Years | 17,484 | 23.4% |
| 45 to 54 Years | 12,627 | 16.9% |
| 55 to 64 Years | 11,425 | 15.3% |
| 65 to 74 Years | 7,771 | 10.4% |
| 75 to 84 Years | 3,870 | 5.2% |
| 85 Years and Over | 1,606 | 2.1% |
| Total | 74,818 | 100.0% |
Housing Finances in Alexandria city
Median Income by Occupancy in Alexandria city
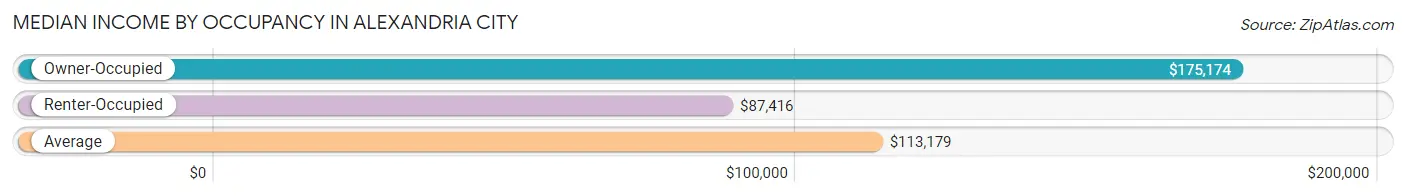
| Occupancy Type | # Households | Median Income |
| Owner-Occupied | 31,933 (42.7%) | $175,174 |
| Renter-Occupied | 42,885 (57.3%) | $87,416 |
| Average | 74,818 (100.0%) | $113,179 |
Occupancy by Householder Income Bracket in Alexandria city
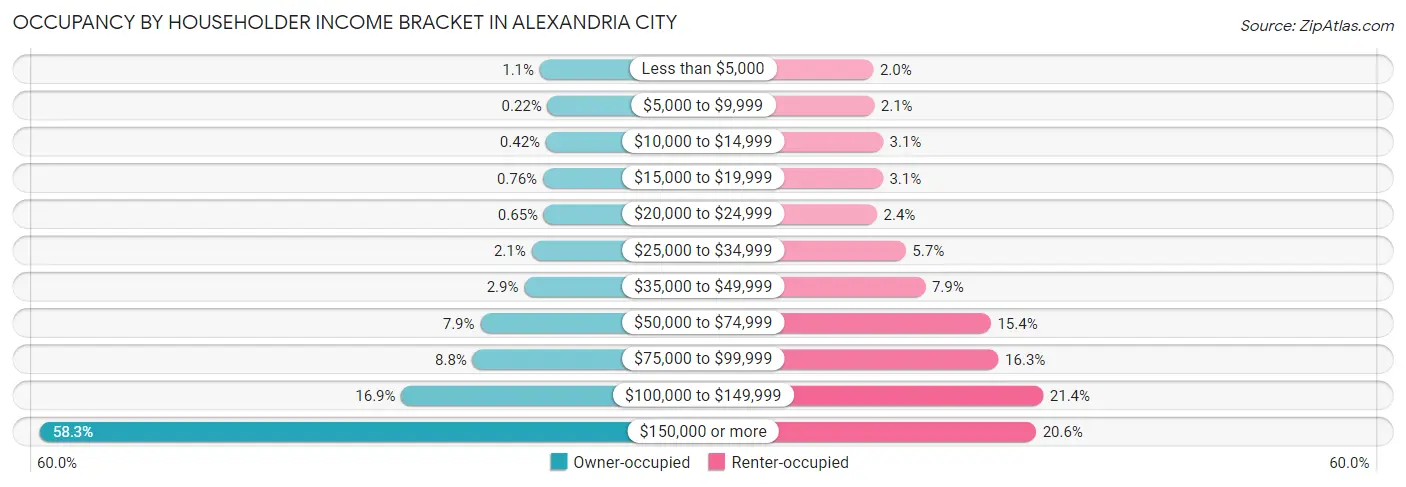
| Income Bracket | Owner-occupied | Renter-occupied |
| Less than $5,000 | 355 (1.1%) | 853 (2.0%) |
| $5,000 to $9,999 | 71 (0.2%) | 895 (2.1%) |
| $10,000 to $14,999 | 134 (0.4%) | 1,325 (3.1%) |
| $15,000 to $19,999 | 244 (0.8%) | 1,322 (3.1%) |
| $20,000 to $24,999 | 206 (0.6%) | 1,033 (2.4%) |
| $25,000 to $34,999 | 659 (2.1%) | 2,443 (5.7%) |
| $35,000 to $49,999 | 924 (2.9%) | 3,399 (7.9%) |
| $50,000 to $74,999 | 2,526 (7.9%) | 6,612 (15.4%) |
| $75,000 to $99,999 | 2,806 (8.8%) | 6,992 (16.3%) |
| $100,000 to $149,999 | 5,408 (16.9%) | 9,182 (21.4%) |
| $150,000 or more | 18,600 (58.3%) | 8,829 (20.6%) |
| Total | 31,933 (100.0%) | 42,885 (100.0%) |
Monthly Housing Cost Tiers in Alexandria city
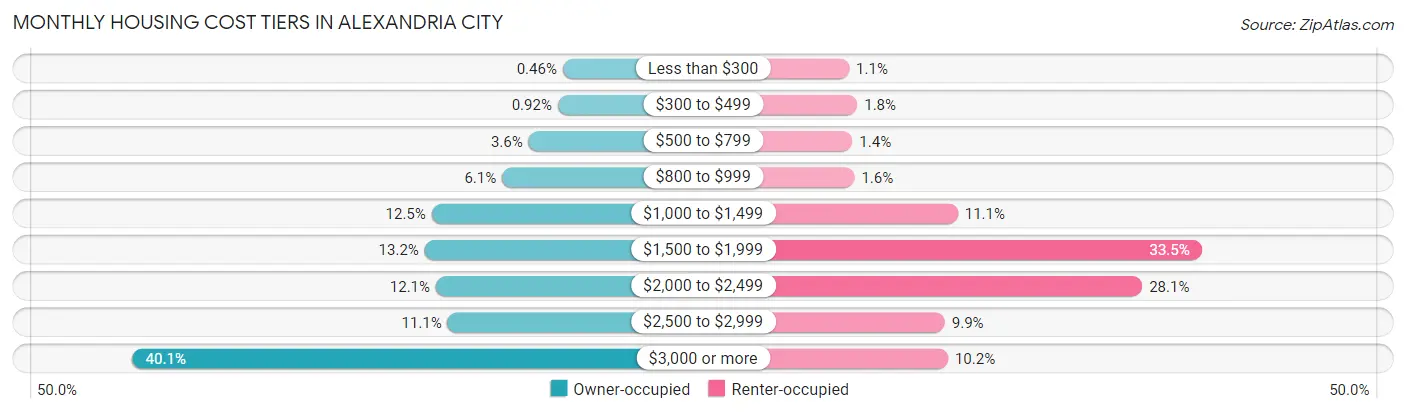
| Monthly Cost | Owner-occupied | Renter-occupied |
| Less than $300 | 146 (0.5%) | 462 (1.1%) |
| $300 to $499 | 294 (0.9%) | 783 (1.8%) |
| $500 to $799 | 1,152 (3.6%) | 591 (1.4%) |
| $800 to $999 | 1,933 (6.0%) | 672 (1.6%) |
| $1,000 to $1,499 | 4,001 (12.5%) | 4,751 (11.1%) |
| $1,500 to $1,999 | 4,207 (13.2%) | 14,374 (33.5%) |
| $2,000 to $2,499 | 3,878 (12.1%) | 12,034 (28.1%) |
| $2,500 to $2,999 | 3,532 (11.1%) | 4,240 (9.9%) |
| $3,000 or more | 12,790 (40.1%) | 4,367 (10.2%) |
| Total | 31,933 (100.0%) | 42,885 (100.0%) |
Physical Housing Characteristics in Alexandria city
Housing Structures in Alexandria city
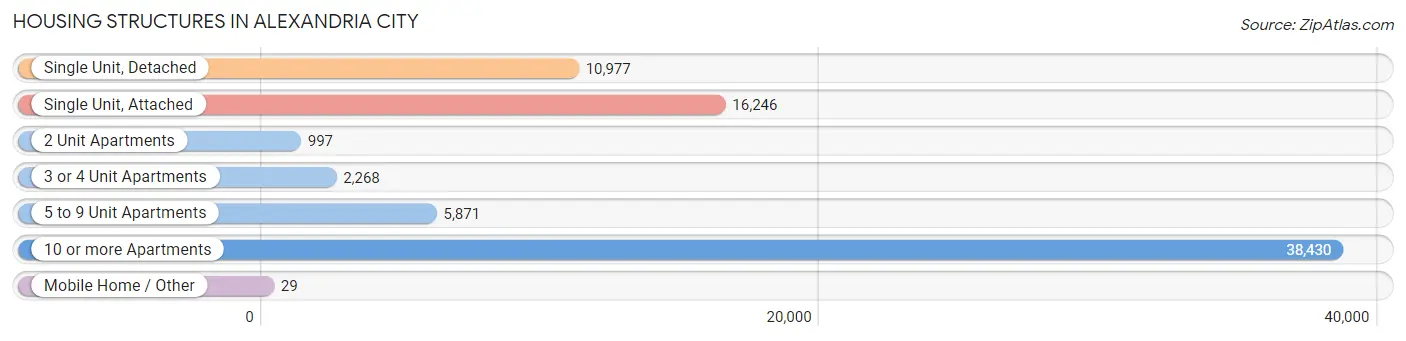
| Structure Type | # Housing Units | % Housing Units |
| Single Unit, Detached | 10,977 | 14.7% |
| Single Unit, Attached | 16,246 | 21.7% |
| 2 Unit Apartments | 997 | 1.3% |
| 3 or 4 Unit Apartments | 2,268 | 3.0% |
| 5 to 9 Unit Apartments | 5,871 | 7.9% |
| 10 or more Apartments | 38,430 | 51.4% |
| Mobile Home / Other | 29 | 0.0% |
| Total | 74,818 | 100.0% |
Housing Structures by Occupancy in Alexandria city
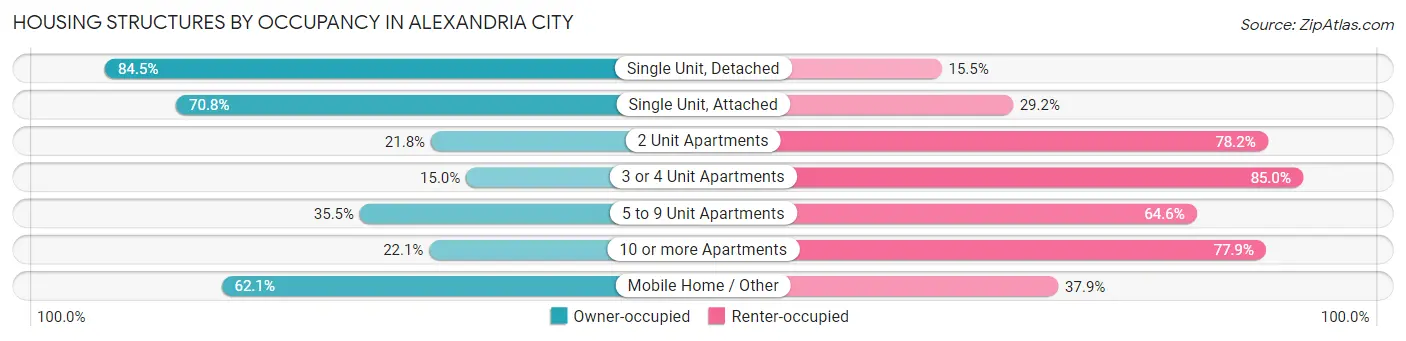
| Structure Type | Owner-occupied | Renter-occupied |
| Single Unit, Detached | 9,278 (84.5%) | 1,699 (15.5%) |
| Single Unit, Attached | 11,505 (70.8%) | 4,741 (29.2%) |
| 2 Unit Apartments | 217 (21.8%) | 780 (78.2%) |
| 3 or 4 Unit Apartments | 340 (15.0%) | 1,928 (85.0%) |
| 5 to 9 Unit Apartments | 2,081 (35.4%) | 3,790 (64.5%) |
| 10 or more Apartments | 8,494 (22.1%) | 29,936 (77.9%) |
| Mobile Home / Other | 18 (62.1%) | 11 (37.9%) |
| Total | 31,933 (42.7%) | 42,885 (57.3%) |
Housing Structures by Number of Rooms in Alexandria city
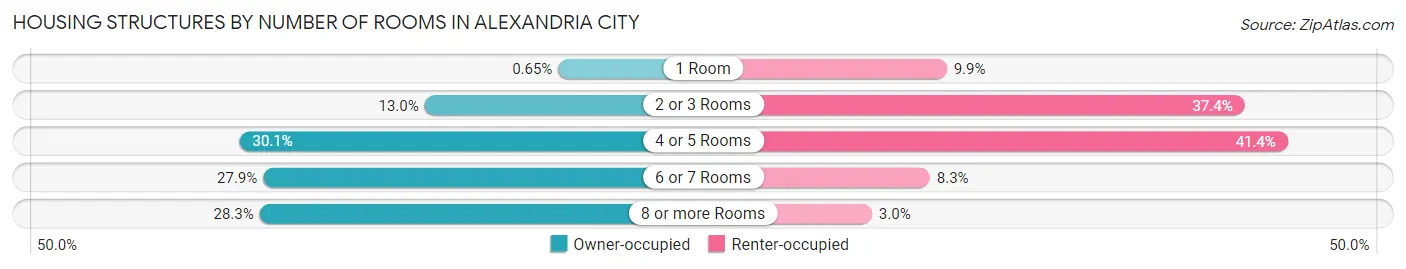
| Number of Rooms | Owner-occupied | Renter-occupied |
| 1 Room | 209 (0.6%) | 4,235 (9.9%) |
| 2 or 3 Rooms | 4,155 (13.0%) | 16,053 (37.4%) |
| 4 or 5 Rooms | 9,620 (30.1%) | 17,758 (41.4%) |
| 6 or 7 Rooms | 8,922 (27.9%) | 3,569 (8.3%) |
| 8 or more Rooms | 9,027 (28.3%) | 1,270 (3.0%) |
| Total | 31,933 (100.0%) | 42,885 (100.0%) |
Housing Structure by Heating Type in Alexandria city
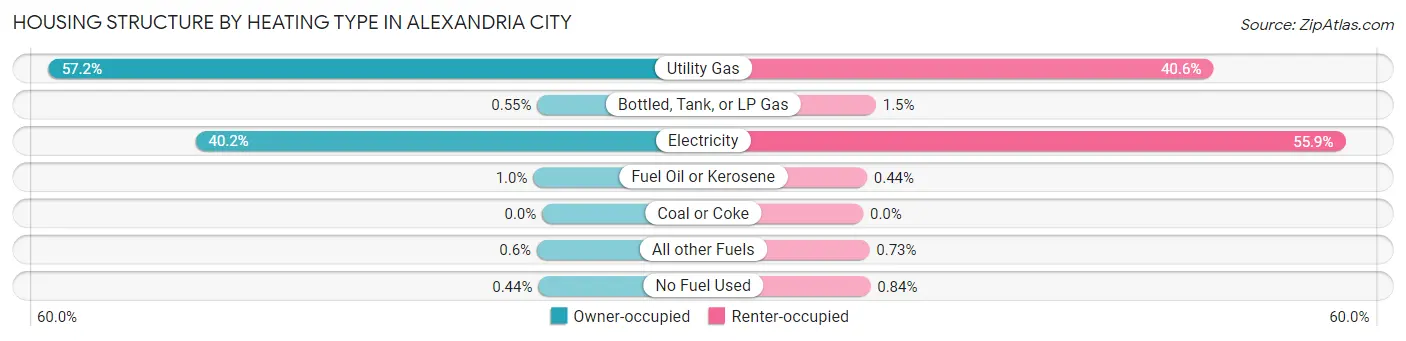
| Heating Type | Owner-occupied | Renter-occupied |
| Utility Gas | 18,267 (57.2%) | 17,412 (40.6%) |
| Bottled, Tank, or LP Gas | 175 (0.5%) | 636 (1.5%) |
| Electricity | 12,833 (40.2%) | 23,976 (55.9%) |
| Fuel Oil or Kerosene | 327 (1.0%) | 188 (0.4%) |
| Coal or Coke | 0 (0.0%) | 0 (0.0%) |
| All other Fuels | 192 (0.6%) | 314 (0.7%) |
| No Fuel Used | 139 (0.4%) | 359 (0.8%) |
| Total | 31,933 (100.0%) | 42,885 (100.0%) |
Household Vehicle Usage in Alexandria city
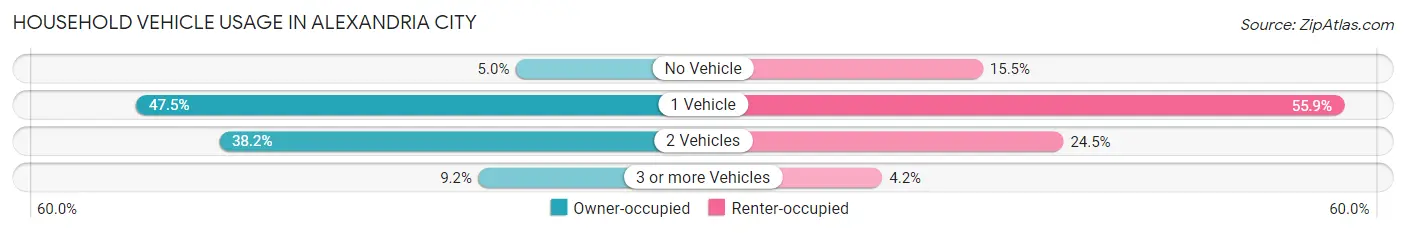
| Vehicles per Household | Owner-occupied | Renter-occupied |
| No Vehicle | 1,609 (5.0%) | 6,626 (15.4%) |
| 1 Vehicle | 15,171 (47.5%) | 23,962 (55.9%) |
| 2 Vehicles | 12,206 (38.2%) | 10,500 (24.5%) |
| 3 or more Vehicles | 2,947 (9.2%) | 1,797 (4.2%) |
| Total | 31,933 (100.0%) | 42,885 (100.0%) |
Real Estate & Mortgages in Alexandria city
Real Estate and Mortgage Overview in Alexandria city
| Characteristic | Without Mortgage | With Mortgage |
| Housing Units | 7,678 | 24,255 |
| Median Property Value | $661,500 | $653,900 |
| Median Household Income | $123,537 | $15,307 |
| Monthly Housing Costs | $1,116 | $12,596 |
| Real Estate Taxes | $6,778 | $261 |
Property Value by Mortgage Status in Alexandria city
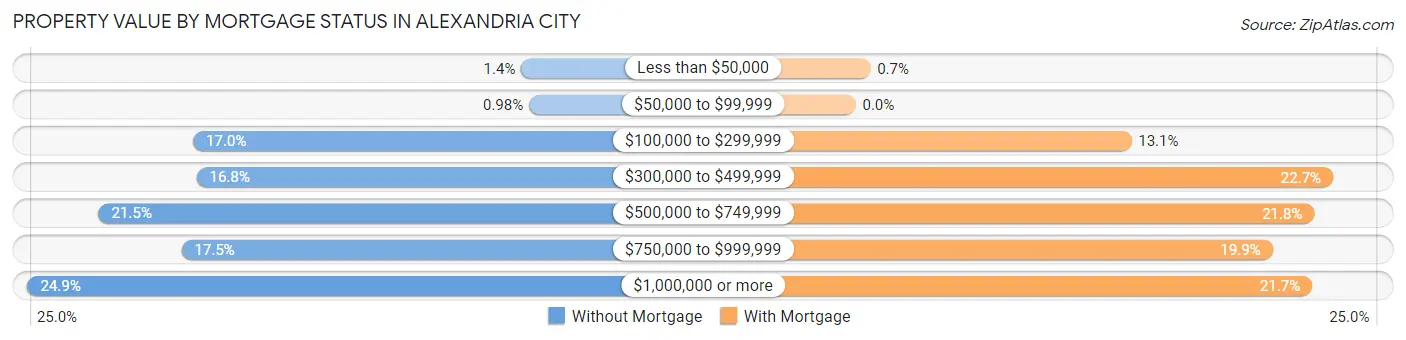
| Property Value | Without Mortgage | With Mortgage |
| Less than $50,000 | 104 (1.3%) | 170 (0.7%) |
| $50,000 to $99,999 | 75 (1.0%) | 0 (0.0%) |
| $100,000 to $299,999 | 1,304 (17.0%) | 3,184 (13.1%) |
| $300,000 to $499,999 | 1,291 (16.8%) | 5,513 (22.7%) |
| $500,000 to $749,999 | 1,649 (21.5%) | 5,297 (21.8%) |
| $750,000 to $999,999 | 1,346 (17.5%) | 4,818 (19.9%) |
| $1,000,000 or more | 1,909 (24.9%) | 5,273 (21.7%) |
| Total | 7,678 (100.0%) | 24,255 (100.0%) |
Household Income by Mortgage Status in Alexandria city
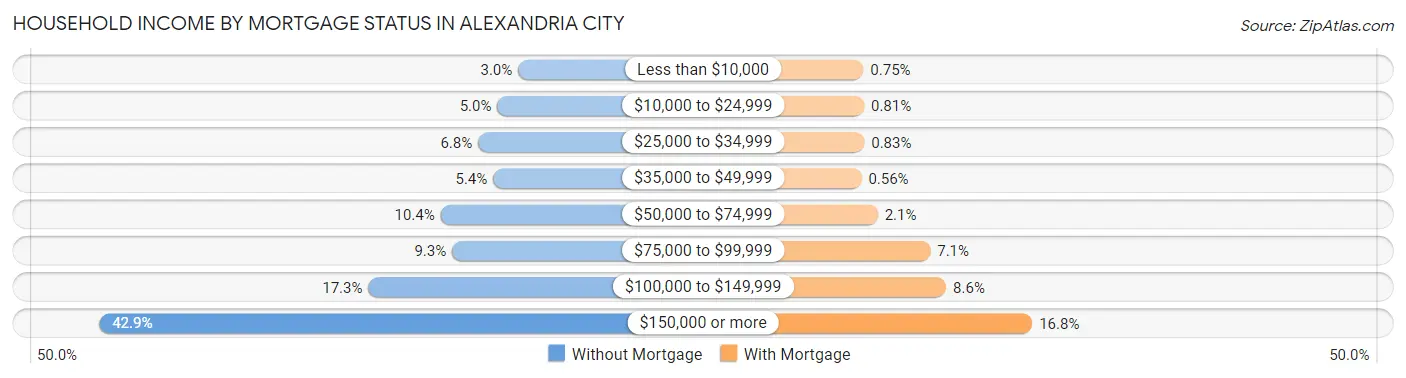
| Household Income | Without Mortgage | With Mortgage |
| Less than $10,000 | 230 (3.0%) | 182 (0.7%) |
| $10,000 to $24,999 | 382 (5.0%) | 196 (0.8%) |
| $25,000 to $34,999 | 523 (6.8%) | 202 (0.8%) |
| $35,000 to $49,999 | 413 (5.4%) | 136 (0.6%) |
| $50,000 to $74,999 | 798 (10.4%) | 511 (2.1%) |
| $75,000 to $99,999 | 713 (9.3%) | 1,728 (7.1%) |
| $100,000 to $149,999 | 1,326 (17.3%) | 2,093 (8.6%) |
| $150,000 or more | 3,293 (42.9%) | 4,082 (16.8%) |
| Total | 7,678 (100.0%) | 24,255 (100.0%) |
Property Value to Household Income Ratio in Alexandria city
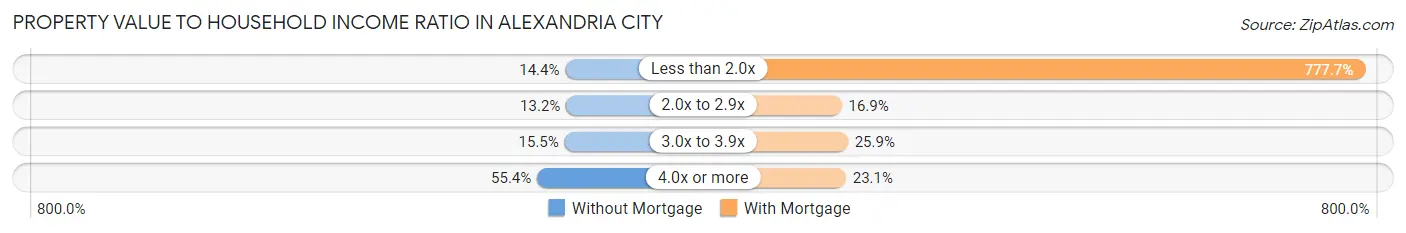
| Value-to-Income Ratio | Without Mortgage | With Mortgage |
| Less than 2.0x | 1,106 (14.4%) | 188,628 (777.7%) |
| 2.0x to 2.9x | 1,012 (13.2%) | 4,100 (16.9%) |
| 3.0x to 3.9x | 1,186 (15.4%) | 6,277 (25.9%) |
| 4.0x or more | 4,254 (55.4%) | 5,601 (23.1%) |
| Total | 7,678 (100.0%) | 24,255 (100.0%) |
Real Estate Taxes by Mortgage Status in Alexandria city
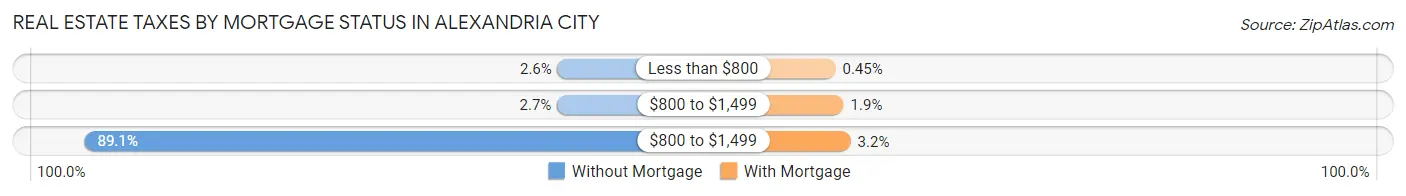
| Property Taxes | Without Mortgage | With Mortgage |
| Less than $800 | 203 (2.6%) | 109 (0.4%) |
| $800 to $1,499 | 209 (2.7%) | 470 (1.9%) |
| $800 to $1,499 | 6,837 (89.0%) | 781 (3.2%) |
| Total | 7,678 (100.0%) | 24,255 (100.0%) |
Health & Disability in Alexandria city
Health Insurance Coverage by Age in Alexandria city
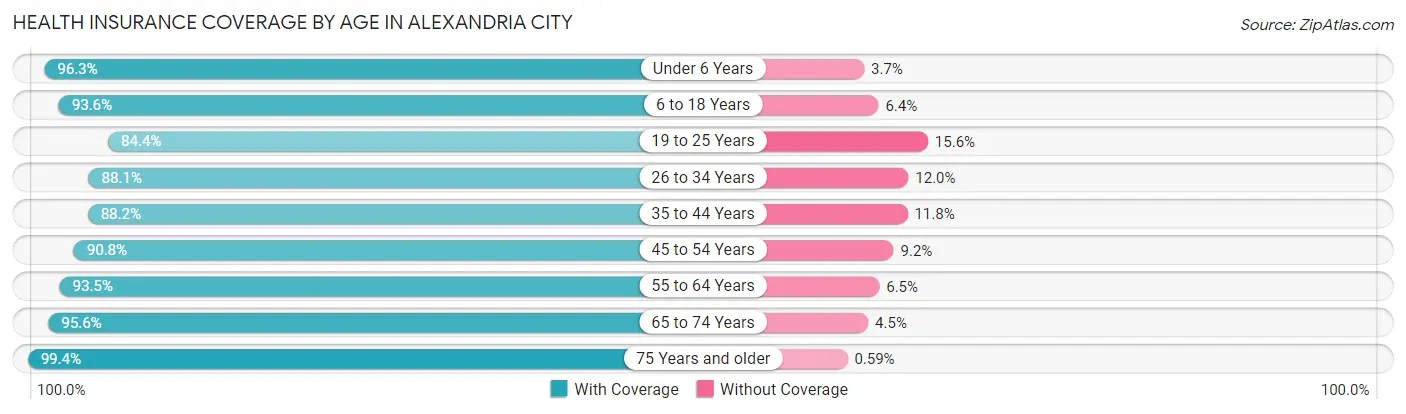
| Age Bracket | With Coverage | Without Coverage |
| Under 6 Years | 11,828 (96.3%) | 453 (3.7%) |
| 6 to 18 Years | 16,338 (93.6%) | 1,113 (6.4%) |
| 19 to 25 Years | 8,845 (84.4%) | 1,634 (15.6%) |
| 26 to 34 Years | 24,727 (88.0%) | 3,357 (11.9%) |
| 35 to 44 Years | 24,844 (88.2%) | 3,319 (11.8%) |
| 45 to 54 Years | 18,830 (90.8%) | 1,905 (9.2%) |
| 55 to 64 Years | 16,117 (93.5%) | 1,125 (6.5%) |
| 65 to 74 Years | 11,242 (95.6%) | 524 (4.4%) |
| 75 Years and older | 7,300 (99.4%) | 43 (0.6%) |
| Total | 140,071 (91.2%) | 13,473 (8.8%) |
Health Insurance Coverage by Citizenship Status in Alexandria city
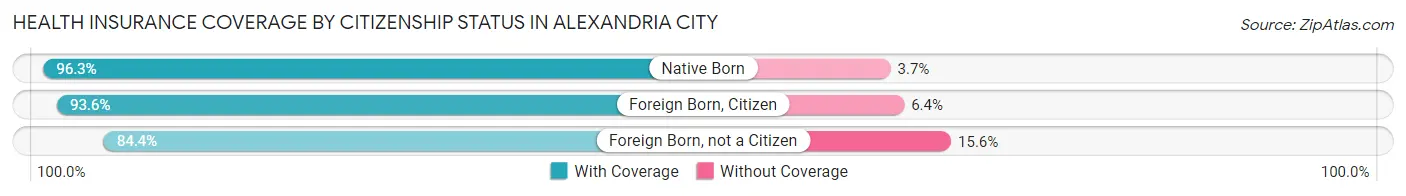
| Citizenship Status | With Coverage | Without Coverage |
| Native Born | 11,828 (96.3%) | 453 (3.7%) |
| Foreign Born, Citizen | 16,338 (93.6%) | 1,113 (6.4%) |
| Foreign Born, not a Citizen | 8,845 (84.4%) | 1,634 (15.6%) |
Health Insurance Coverage by Household Income in Alexandria city
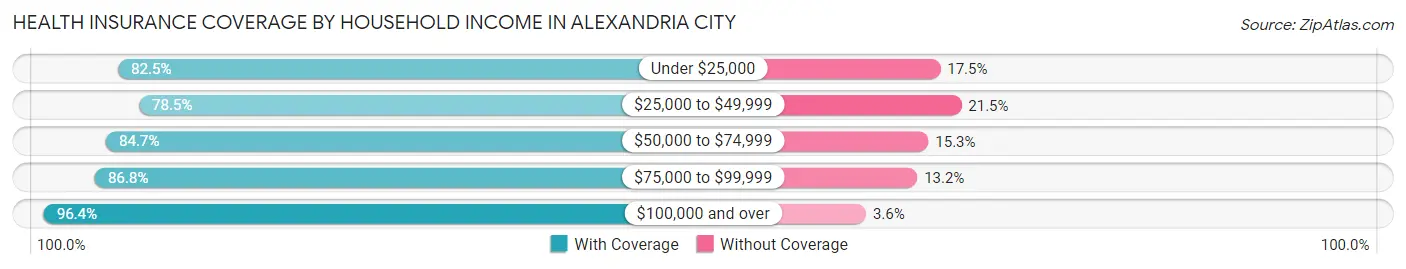
| Household Income | With Coverage | Without Coverage |
| Under $25,000 | 9,188 (82.5%) | 1,952 (17.5%) |
| $25,000 to $49,999 | 11,556 (78.5%) | 3,157 (21.5%) |
| $50,000 to $74,999 | 14,324 (84.7%) | 2,583 (15.3%) |
| $75,000 to $99,999 | 15,307 (86.8%) | 2,325 (13.2%) |
| $100,000 and over | 89,216 (96.4%) | 3,333 (3.6%) |
Public vs Private Health Insurance Coverage by Age in Alexandria city
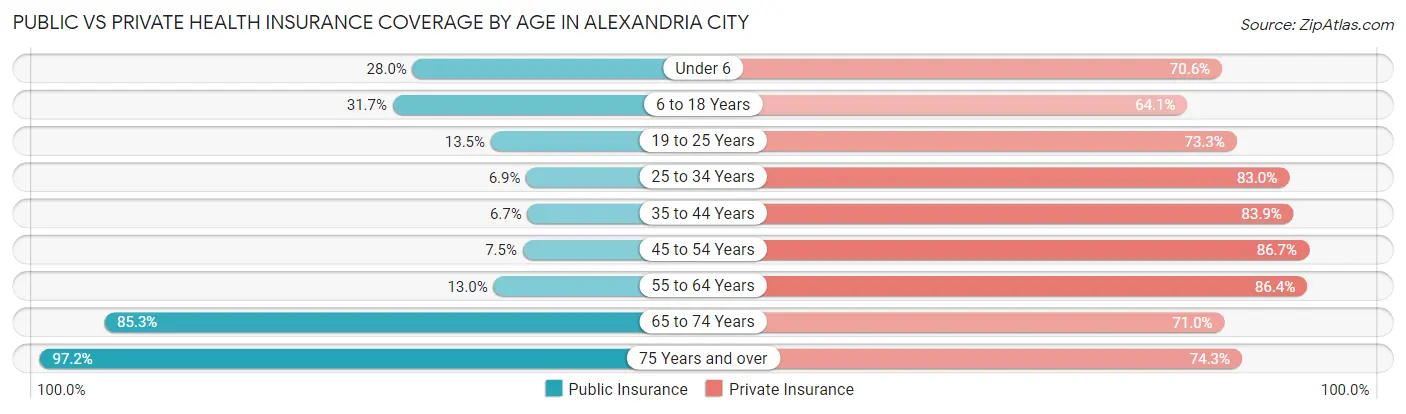
| Age Bracket | Public Insurance | Private Insurance |
| Under 6 | 3,435 (28.0%) | 8,664 (70.6%) |
| 6 to 18 Years | 5,523 (31.7%) | 11,190 (64.1%) |
| 19 to 25 Years | 1,410 (13.5%) | 7,679 (73.3%) |
| 25 to 34 Years | 1,930 (6.9%) | 23,311 (83.0%) |
| 35 to 44 Years | 1,873 (6.7%) | 23,619 (83.9%) |
| 45 to 54 Years | 1,559 (7.5%) | 17,974 (86.7%) |
| 55 to 64 Years | 2,237 (13.0%) | 14,891 (86.4%) |
| 65 to 74 Years | 10,033 (85.3%) | 8,356 (71.0%) |
| 75 Years and over | 7,140 (97.2%) | 5,452 (74.3%) |
| Total | 35,140 (22.9%) | 121,136 (78.9%) |
Disability Status by Sex by Age in Alexandria city
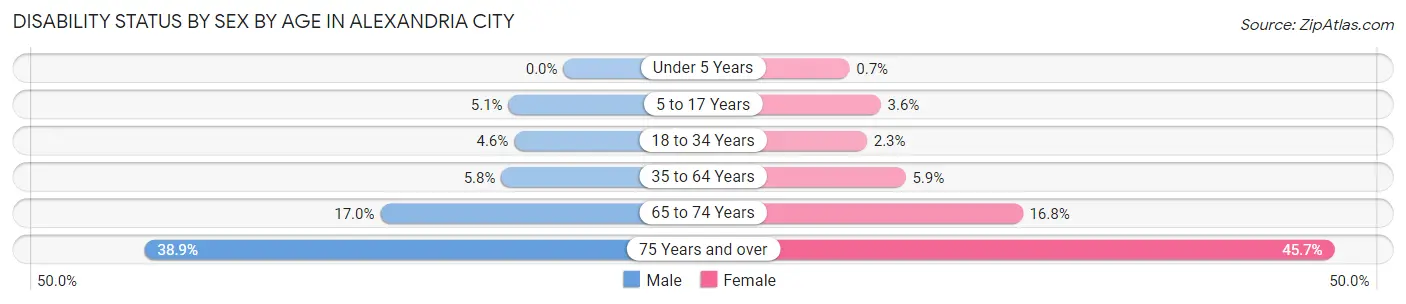
| Age Bracket | Male | Female |
| Under 5 Years | 0 (0.0%) | 37 (0.7%) |
| 5 to 17 Years | 463 (5.1%) | 312 (3.6%) |
| 18 to 34 Years | 837 (4.6%) | 497 (2.3%) |
| 35 to 64 Years | 1,865 (5.8%) | 1,996 (5.9%) |
| 65 to 74 Years | 901 (17.0%) | 1,084 (16.8%) |
| 75 Years and over | 1,157 (38.9%) | 1,996 (45.7%) |
Disability Class by Sex by Age in Alexandria city
Disability Class: Hearing Difficulty
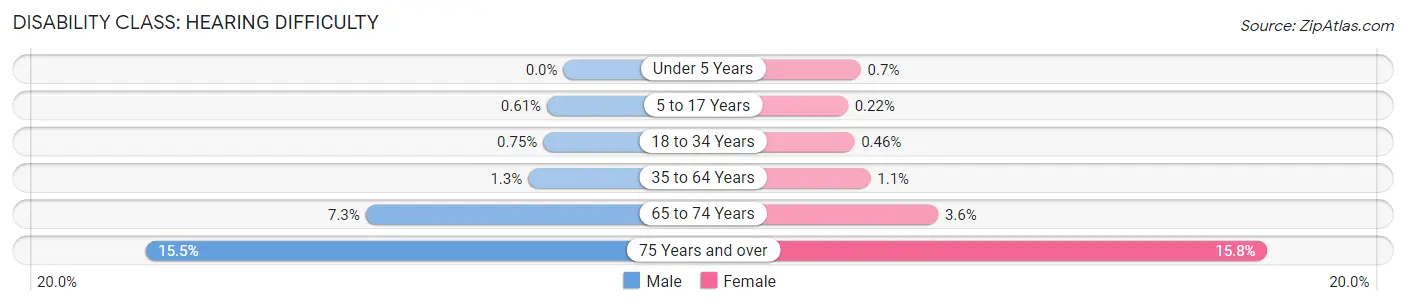
| Age Bracket | Male | Female |
| Under 5 Years | 0 (0.0%) | 37 (0.7%) |
| 5 to 17 Years | 55 (0.6%) | 19 (0.2%) |
| 18 to 34 Years | 137 (0.7%) | 98 (0.5%) |
| 35 to 64 Years | 424 (1.3%) | 359 (1.1%) |
| 65 to 74 Years | 389 (7.3%) | 231 (3.6%) |
| 75 Years and over | 462 (15.5%) | 690 (15.8%) |
Disability Class: Vision Difficulty
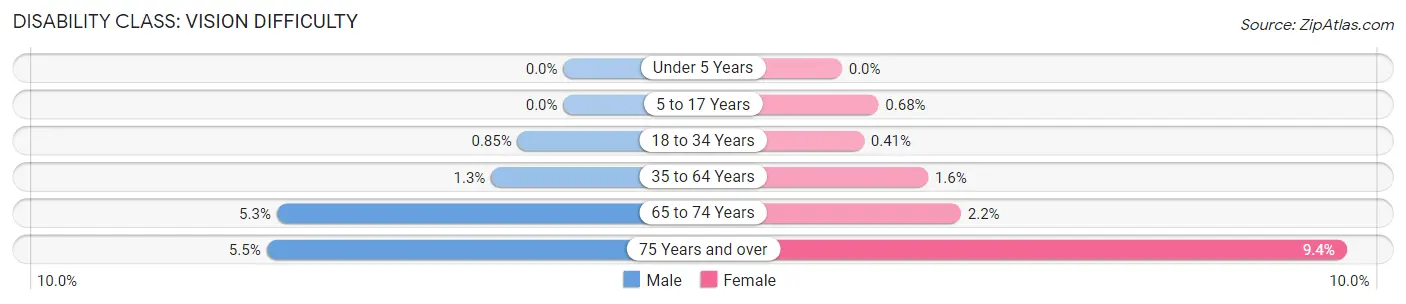
| Age Bracket | Male | Female |
| Under 5 Years | 0 (0.0%) | 0 (0.0%) |
| 5 to 17 Years | 0 (0.0%) | 59 (0.7%) |
| 18 to 34 Years | 156 (0.9%) | 88 (0.4%) |
| 35 to 64 Years | 433 (1.3%) | 540 (1.6%) |
| 65 to 74 Years | 282 (5.3%) | 143 (2.2%) |
| 75 Years and over | 164 (5.5%) | 409 (9.4%) |
Disability Class: Cognitive Difficulty
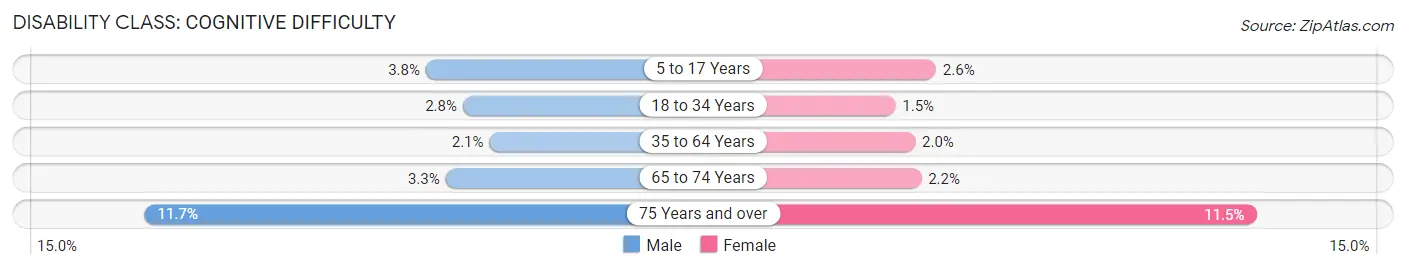
| Age Bracket | Male | Female |
| 5 to 17 Years | 348 (3.8%) | 227 (2.6%) |
| 18 to 34 Years | 513 (2.8%) | 320 (1.5%) |
| 35 to 64 Years | 668 (2.1%) | 690 (2.0%) |
| 65 to 74 Years | 174 (3.3%) | 143 (2.2%) |
| 75 Years and over | 347 (11.7%) | 504 (11.5%) |
Disability Class: Ambulatory Difficulty
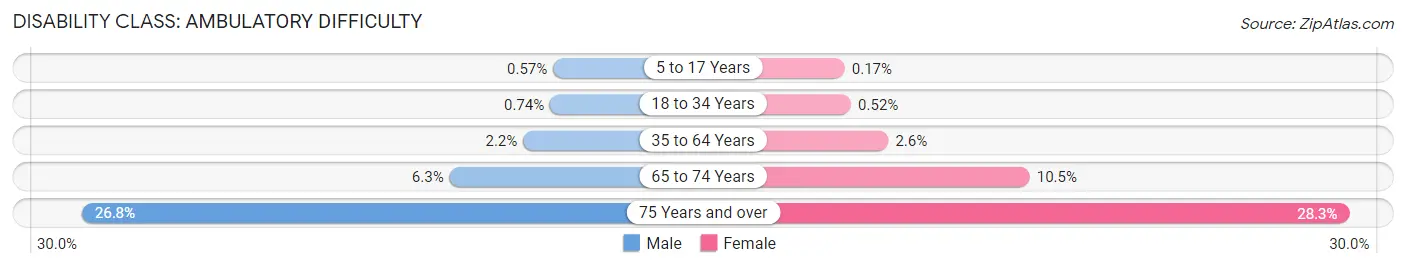
| Age Bracket | Male | Female |
| 5 to 17 Years | 52 (0.6%) | 15 (0.2%) |
| 18 to 34 Years | 135 (0.7%) | 112 (0.5%) |
| 35 to 64 Years | 724 (2.2%) | 879 (2.6%) |
| 65 to 74 Years | 336 (6.3%) | 677 (10.5%) |
| 75 Years and over | 798 (26.8%) | 1,234 (28.3%) |
Disability Class: Self-Care Difficulty
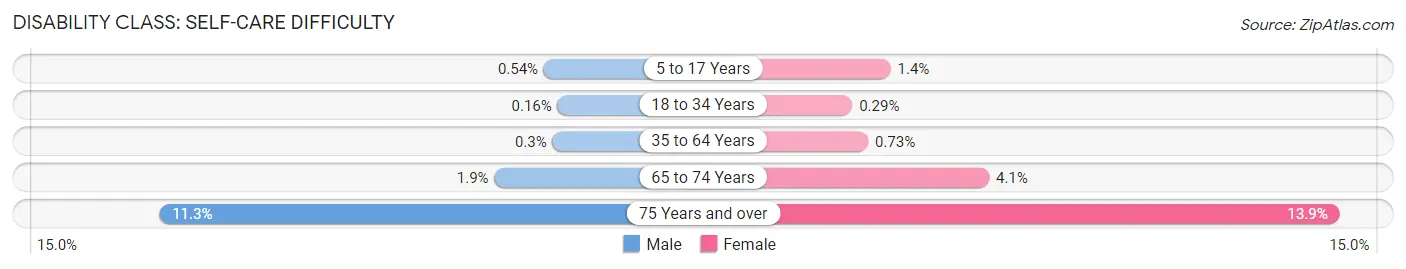
| Age Bracket | Male | Female |
| 5 to 17 Years | 49 (0.5%) | 118 (1.4%) |
| 18 to 34 Years | 30 (0.2%) | 62 (0.3%) |
| 35 to 64 Years | 97 (0.3%) | 247 (0.7%) |
| 65 to 74 Years | 102 (1.9%) | 265 (4.1%) |
| 75 Years and over | 335 (11.3%) | 605 (13.9%) |
Technology Access in Alexandria city
Computing Device Access in Alexandria city
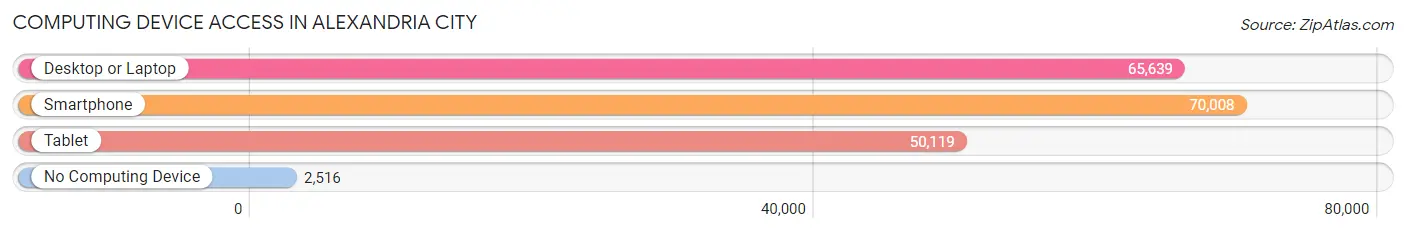
| Device Type | # Households | % Households |
| Desktop or Laptop | 65,639 | 87.7% |
| Smartphone | 70,008 | 93.6% |
| Tablet | 50,119 | 67.0% |
| No Computing Device | 2,516 | 3.4% |
| Total | 74,818 | 100.0% |
Internet Access in Alexandria city
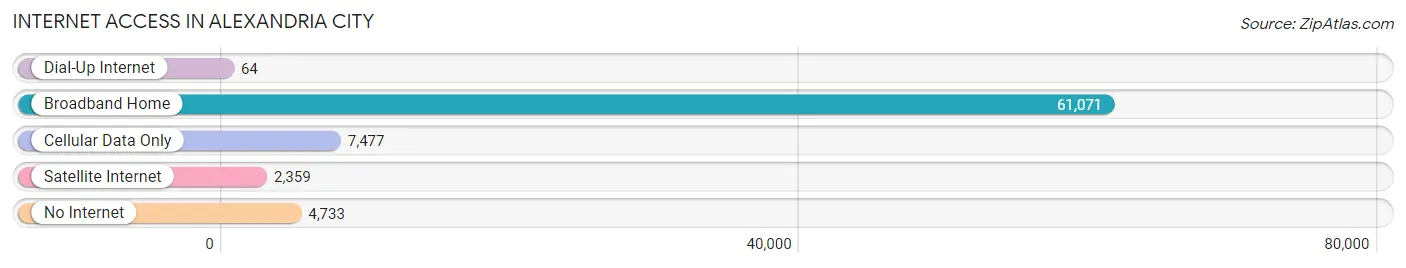
| Internet Type | # Households | % Households |
| Dial-Up Internet | 64 | 0.1% |
| Broadband Home | 61,071 | 81.6% |
| Cellular Data Only | 7,477 | 10.0% |
| Satellite Internet | 2,359 | 3.2% |
| No Internet | 4,733 | 6.3% |
| Total | 74,818 | 100.0% |
Alexandria city Summary
Alexandria City, Virginia is a city located in the Commonwealth of Virginia, in the United States of America. It is located along the Potomac River, just south of Washington, D.C. Alexandria is an independent city, and is the seventh-largest city in Virginia. As of the 2010 census, the population of Alexandria was 139,966.
History
The area that is now Alexandria was first settled in 1669, when John Alexander and his family established a plantation on the banks of the Potomac River. The area was known as Belhaven, and was part of the larger Fairfax County. In 1749, the town of Alexandria was officially established, and was named after John Alexander.
In 1791, Alexandria was designated as part of the new District of Columbia, and was the first capital of the United States. The city was a major port and trading center, and was home to many prominent figures in American history, including George Washington, Robert E. Lee, and James Monroe.
In 1846, Alexandria was returned to Virginia, and became an independent city. The city continued to grow and prosper, and by the end of the 19th century, it had become a major industrial center.
Geography
Alexandria is located in the Commonwealth of Virginia, in the United States of America. It is located along the Potomac River, just south of Washington, D.C. The city covers an area of 15.75 square miles, and is located at an elevation of 39 feet above sea level.
The city is divided into four distinct neighborhoods: Old Town, Del Ray, Arlandria, and West End. Old Town is the historic center of the city, and is home to many of the city’s most popular attractions, including the George Washington Masonic National Memorial, the Torpedo Factory Art Center, and the Alexandria City Hall. Del Ray is a residential neighborhood, and is known for its small-town charm and vibrant arts scene. Arlandria is a diverse neighborhood, and is home to many immigrants from Latin America and the Caribbean. The West End is a primarily residential neighborhood, and is home to many of the city’s affluent residents.
Economy
Alexandria is a major economic center in the Washington, D.C. metropolitan area. The city’s economy is largely driven by the federal government, as well as by the tourism and hospitality industries.
The city is home to many federal government agencies, including the Department of Defense, the Department of Homeland Security, and the Department of Transportation. The city is also home to many private companies, including the defense contractor Northrop Grumman, the software company Oracle, and the consulting firm Booz Allen Hamilton.
The city’s tourism and hospitality industry is also a major contributor to the local economy. The city is home to many popular attractions, including the George Washington Masonic National Memorial, the Torpedo Factory Art Center, and the Alexandria City Hall. The city is also home to many restaurants, bars, and hotels, which attract visitors from around the world.
Demographics
As of the 2010 census, the population of Alexandria was 139,966. The city has a population density of 8,945 people per square mile. The racial makeup of the city is 57.3% White, 28.2% African American, 8.2% Hispanic or Latino, 4.2% Asian, and 2.1% other.
The median household income in Alexandria is $87,837, and the median family income is $103,837. The city’s poverty rate is 8.3%. The city’s unemployment rate is 4.2%.
Conclusion
Alexandria City, Virginia is a vibrant and diverse city located in the Commonwealth of Virginia, in the United States of America. The city has a rich history, and is home to many popular attractions, including the George Washington Masonic National Memorial, the Torpedo Factory Art Center, and the Alexandria City Hall. The city’s economy is largely driven by the federal government, as well as by the tourism and hospitality industries. As of the 2010 census, the population of Alexandria was 139,966, and the city has a population density of 8,945 people per square mile. The median household income in Alexandria is $87,837, and the median family income is $103,837. The city’s poverty rate is 8.3%, and the unemployment rate is 4.2%.
Common Questions
What is Per Capita Income in Alexandria city?
Per Capita income in Alexandria city is $75,884.
What is the Median Family Income in Alexandria city?
Median Family Income in Alexandria city is $149,526.
What is the Median Household income in Alexandria city?
Median Household Income in Alexandria city is $113,179.
What is Income or Wage Gap in Alexandria city?
Income or Wage Gap in Alexandria city is 8.5%.
Women in Alexandria city earn 91.5 cents for every dollar earned by a man.
What is Family Income Deficit in Alexandria city?
Family Income Deficit in Alexandria city is $10,132.
Families that are below poverty line in Alexandria city earn $10,132 less on average than the poverty threshold level.
What is Inequality or Gini Index in Alexandria city?
Inequality or Gini Index in Alexandria city is 0.46.
What is the Total Population of Alexandria city?
Total Population of Alexandria city is 157,594.
What is the Total Male Population of Alexandria city?
Total Male Population of Alexandria city is 76,589.
What is the Total Female Population of Alexandria city?
Total Female Population of Alexandria city is 81,005.
What is the Ratio of Males per 100 Females in Alexandria city?
There are 94.55 Males per 100 Females in Alexandria city.
What is the Ratio of Females per 100 Males in Alexandria city?
There are 105.77 Females per 100 Males in Alexandria city.
What is the Median Population Age in Alexandria city?
Median Population Age in Alexandria city is 37.4 Years.
What is the Average Family Size in Alexandria city
Average Family Size in Alexandria city is 3.0 People.
What is the Average Household Size in Alexandria city
Average Household Size in Alexandria city is 2.1 People.
How Large is the Labor Force in Alexandria city?
There are 102,495 People in the Labor Forcein in Alexandria city.
What is the Percentage of People in the Labor Force in Alexandria city?
78.0% of People are in the Labor Force in Alexandria city.
What is the Unemployment Rate in Alexandria city?
Unemployment Rate in Alexandria city is 3.2%.