Sanderson, TX Map & Demographics
Sanderson Map
Sanderson Overview
$33,505
PER CAPITA INCOME
$63,984
AVG FAMILY INCOME
$54,219
AVG HOUSEHOLD INCOME
55.4%
WAGE / INCOME GAP [ % ]
44.6¢/ $1
WAGE / INCOME GAP [ $ ]
0.38
INEQUALITY / GINI INDEX
740
TOTAL POPULATION
411
MALE POPULATION
329
FEMALE POPULATION
124.92
MALES / 100 FEMALES
80.05
FEMALES / 100 MALES
57.3
MEDIAN AGE
2.9
AVG FAMILY SIZE
2.1
AVG HOUSEHOLD SIZE
308
LABOR FORCE [ PEOPLE ]
47.0%
PERCENT IN LABOR FORCE
Sanderson Zip Codes
Sanderson Area Codes
Income in Sanderson
Income Overview in Sanderson
Per Capita Income in Sanderson is $33,505, while median incomes of families and households are $63,984 and $54,219 respectively.
| Characteristic | Number | Measure |
| Per Capita Income | 740 | $33,505 |
| Median Family Income | 201 | $63,984 |
| Mean Family Income | 201 | $81,287 |
| Median Household Income | 353 | $54,219 |
| Mean Household Income | 353 | $64,137 |
| Income Deficit | 201 | $0 |
| Wage / Income Gap (%) | 740 | 55.39% |
| Wage / Income Gap ($) | 740 | 44.61¢ per $1 |
| Gini / Inequality Index | 740 | 0.38 |
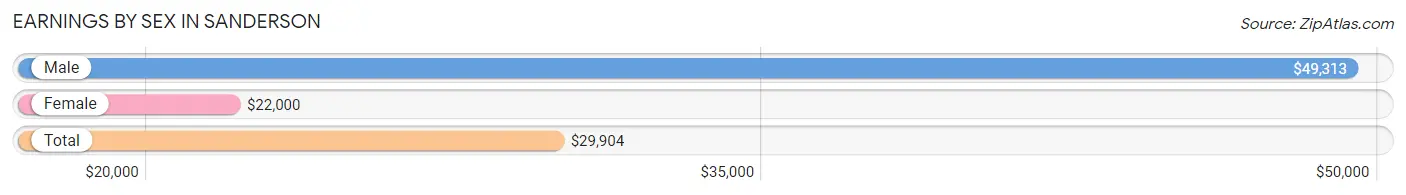
Earnings by Sex in Sanderson
Average Earnings in Sanderson are $29,904, $49,313 for men and $22,000 for women, a difference of 55.4%.
| Sex | Number | Average Earnings |
| Male | 189 (56.8%) | $49,313 |
| Female | 144 (43.2%) | $22,000 |
| Total | 333 (100.0%) | $29,904 |
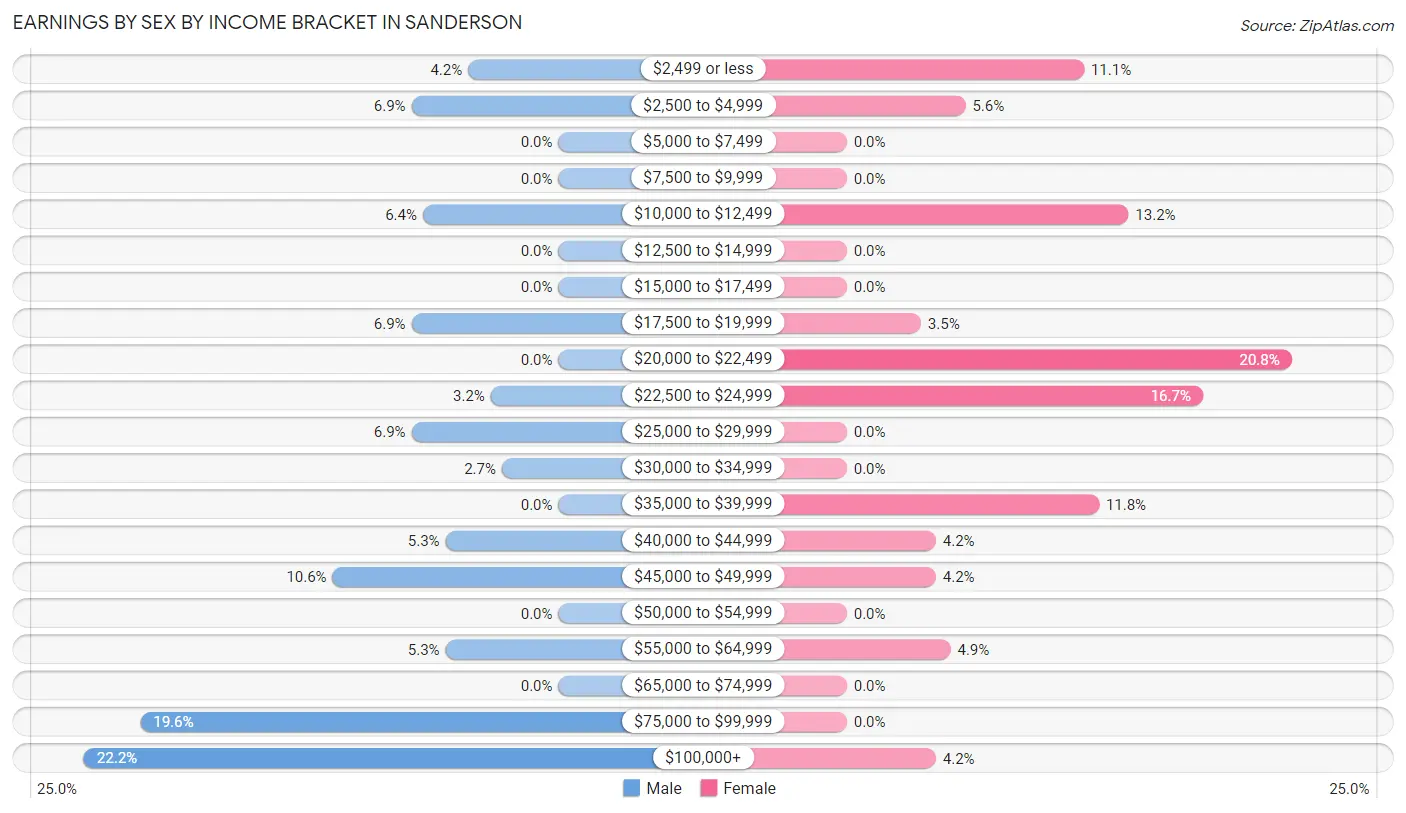
Earnings by Sex by Income Bracket in Sanderson
The most common earnings brackets in Sanderson are $100,000+ for men (42 | 22.2%) and $20,000 to $22,499 for women (30 | 20.8%).
| Income | Male | Female |
| $2,499 or less | 8 (4.2%) | 16 (11.1%) |
| $2,500 to $4,999 | 13 (6.9%) | 8 (5.6%) |
| $5,000 to $7,499 | 0 (0.0%) | 0 (0.0%) |
| $7,500 to $9,999 | 0 (0.0%) | 0 (0.0%) |
| $10,000 to $12,499 | 12 (6.4%) | 19 (13.2%) |
| $12,500 to $14,999 | 0 (0.0%) | 0 (0.0%) |
| $15,000 to $17,499 | 0 (0.0%) | 0 (0.0%) |
| $17,500 to $19,999 | 13 (6.9%) | 5 (3.5%) |
| $20,000 to $22,499 | 0 (0.0%) | 30 (20.8%) |
| $22,500 to $24,999 | 6 (3.2%) | 24 (16.7%) |
| $25,000 to $29,999 | 13 (6.9%) | 0 (0.0%) |
| $30,000 to $34,999 | 5 (2.6%) | 0 (0.0%) |
| $35,000 to $39,999 | 0 (0.0%) | 17 (11.8%) |
| $40,000 to $44,999 | 10 (5.3%) | 6 (4.2%) |
| $45,000 to $49,999 | 20 (10.6%) | 6 (4.2%) |
| $50,000 to $54,999 | 0 (0.0%) | 0 (0.0%) |
| $55,000 to $64,999 | 10 (5.3%) | 7 (4.9%) |
| $65,000 to $74,999 | 0 (0.0%) | 0 (0.0%) |
| $75,000 to $99,999 | 37 (19.6%) | 0 (0.0%) |
| $100,000+ | 42 (22.2%) | 6 (4.2%) |
| Total | 189 (100.0%) | 144 (100.0%) |
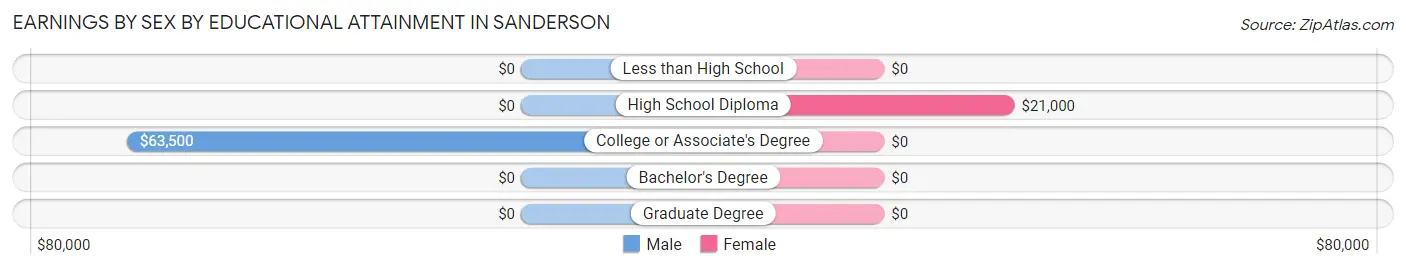
Earnings by Sex by Educational Attainment in Sanderson
Average earnings in Sanderson are $64,250 for men and $22,000 for women, a difference of 65.8%. Men with an educational attainment of college or associate's degree enjoy the highest average annual earnings of $63,500, while those with college or associate's degree education earn the least with $63,500. Women with an educational attainment of high school diploma earn the most with the average annual earnings of $21,000, while those with high school diploma education have the smallest earnings of $21,000.
| Educational Attainment | Male Income | Female Income |
| Less than High School | - | - |
| High School Diploma | - | - |
| College or Associate's Degree | $63,500 | $0 |
| Bachelor's Degree | - | - |
| Graduate Degree | - | - |
| Total | $64,250 | $22,000 |
Family Income in Sanderson
Family Income Brackets in Sanderson
According to the Sanderson family income data, there are 54 families falling into the $50,000 to $74,999 income range, which is the most common income bracket and makes up 26.9% of all families.
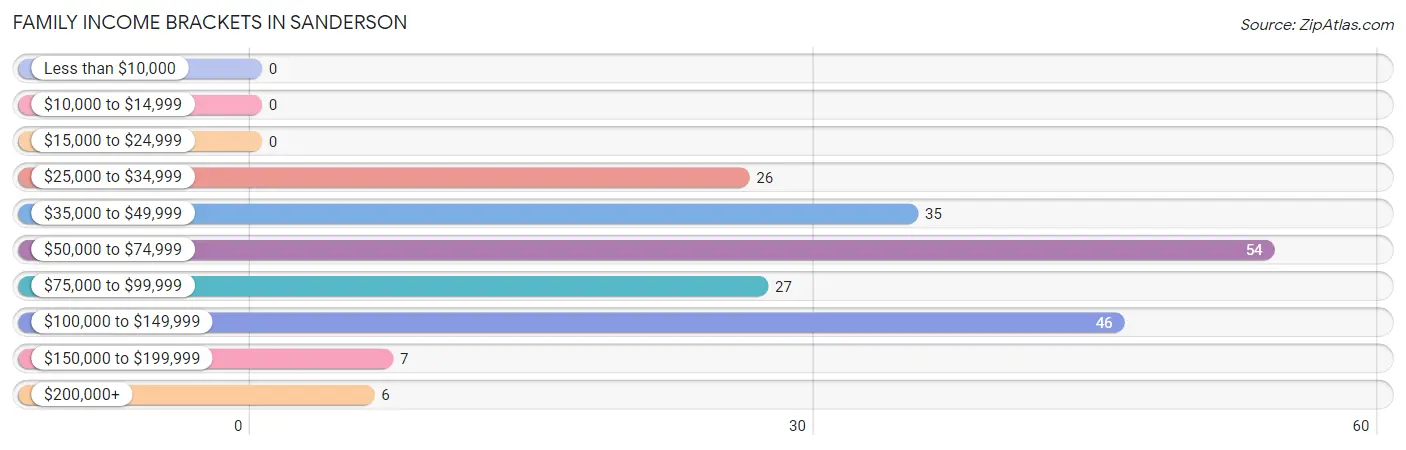
| Income Bracket | # Families | % Families |
| Less than $10,000 | 0 | 0.0% |
| $10,000 to $14,999 | 0 | 0.0% |
| $15,000 to $24,999 | 0 | 0.0% |
| $25,000 to $34,999 | 26 | 12.9% |
| $35,000 to $49,999 | 35 | 17.4% |
| $50,000 to $74,999 | 54 | 26.9% |
| $75,000 to $99,999 | 27 | 13.4% |
| $100,000 to $149,999 | 46 | 22.9% |
| $150,000 to $199,999 | 7 | 3.5% |
| $200,000+ | 6 | 3.0% |
Family Income by Famaliy Size in Sanderson
3-person families (25 | 12.4%) account for the highest median family income in Sanderson with $64,375 per family, while 2-person families (158 | 78.6%) have the highest median income of $30,834 per family member.
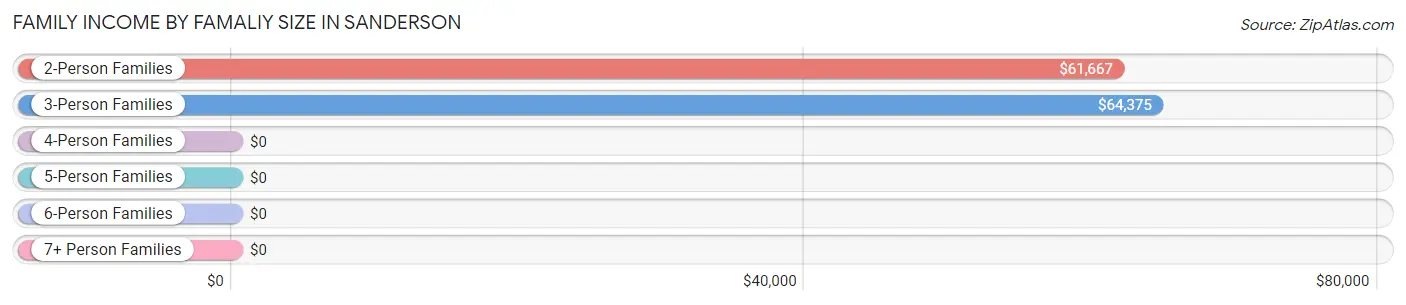
| Income Bracket | # Families | Median Income |
| 2-Person Families | 158 (78.6%) | $61,667 |
| 3-Person Families | 25 (12.4%) | $64,375 |
| 4-Person Families | 13 (6.5%) | $0 |
| 5-Person Families | 0 (0.0%) | $0 |
| 6-Person Families | 5 (2.5%) | $0 |
| 7+ Person Families | 0 (0.0%) | $0 |
| Total | 201 (100.0%) | $63,984 |
Family Income by Number of Earners in Sanderson
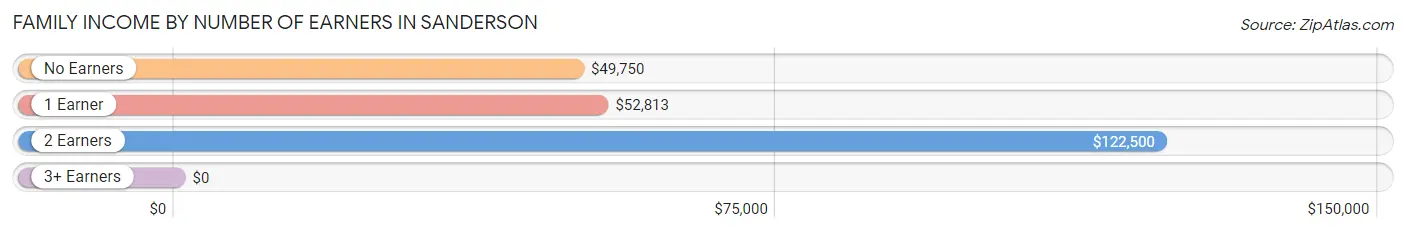
| Number of Earners | # Families | Median Income |
| No Earners | 60 (29.8%) | $49,750 |
| 1 Earner | 38 (18.9%) | $52,813 |
| 2 Earners | 86 (42.8%) | $122,500 |
| 3+ Earners | 17 (8.5%) | $0 |
| Total | 201 (100.0%) | $63,984 |
Household Income in Sanderson
Household Income Brackets in Sanderson
With 82 households falling in the category, the $50,000 to $74,999 income range is the most frequent in Sanderson, accounting for 23.2% of all households. In contrast, only 6 households (1.7%) fall into the $200,000+ income bracket, making it the least populous group.
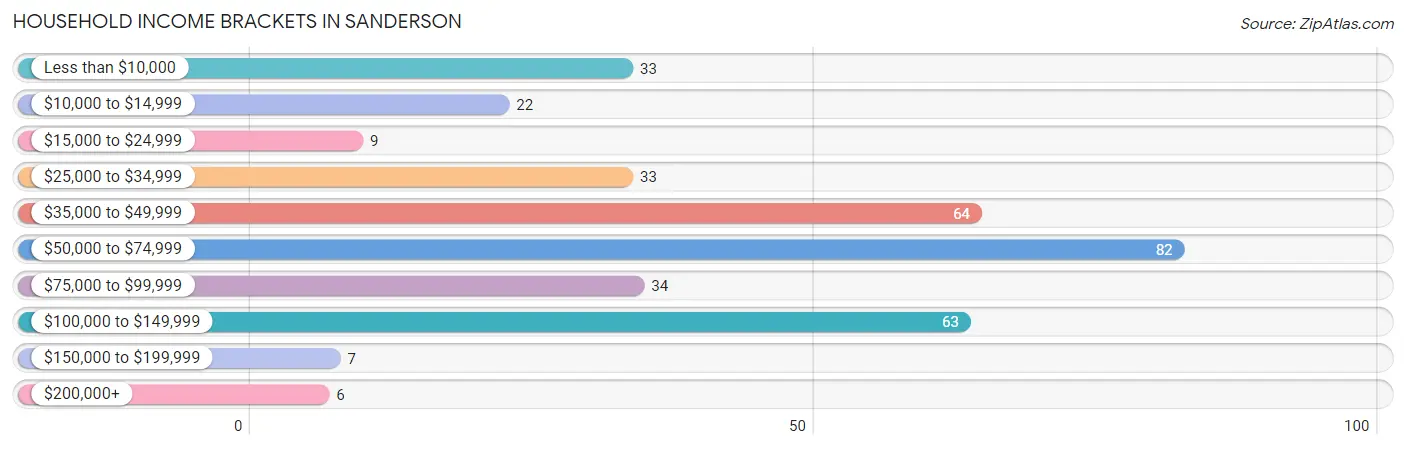
| Income Bracket | # Households | % Households |
| Less than $10,000 | 33 | 9.3% |
| $10,000 to $14,999 | 22 | 6.2% |
| $15,000 to $24,999 | 9 | 2.5% |
| $25,000 to $34,999 | 33 | 9.3% |
| $35,000 to $49,999 | 64 | 18.1% |
| $50,000 to $74,999 | 82 | 23.2% |
| $75,000 to $99,999 | 34 | 9.6% |
| $100,000 to $149,999 | 63 | 17.8% |
| $150,000 to $199,999 | 7 | 2.0% |
| $200,000+ | 6 | 1.7% |
Household Income by Householder Age in Sanderson
The median household income in Sanderson is $54,219, with the highest median household income of $79,773 found in the 45 to 64 years age bracket for the primary householder. A total of 144 households (40.8%) fall into this category.
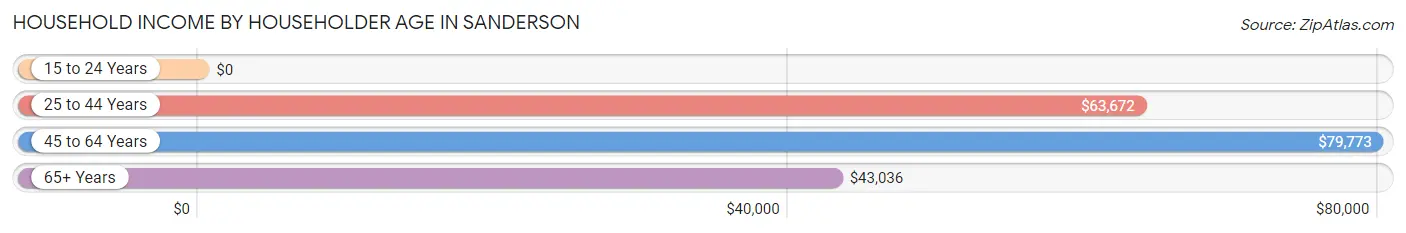
| Income Bracket | # Households | Median Income |
| 15 to 24 Years | 0 (0.0%) | $0 |
| 25 to 44 Years | 41 (11.6%) | $63,672 |
| 45 to 64 Years | 144 (40.8%) | $79,773 |
| 65+ Years | 168 (47.6%) | $43,036 |
| Total | 353 (100.0%) | $54,219 |
Poverty in Sanderson
Income Below Poverty by Sex and Age in Sanderson
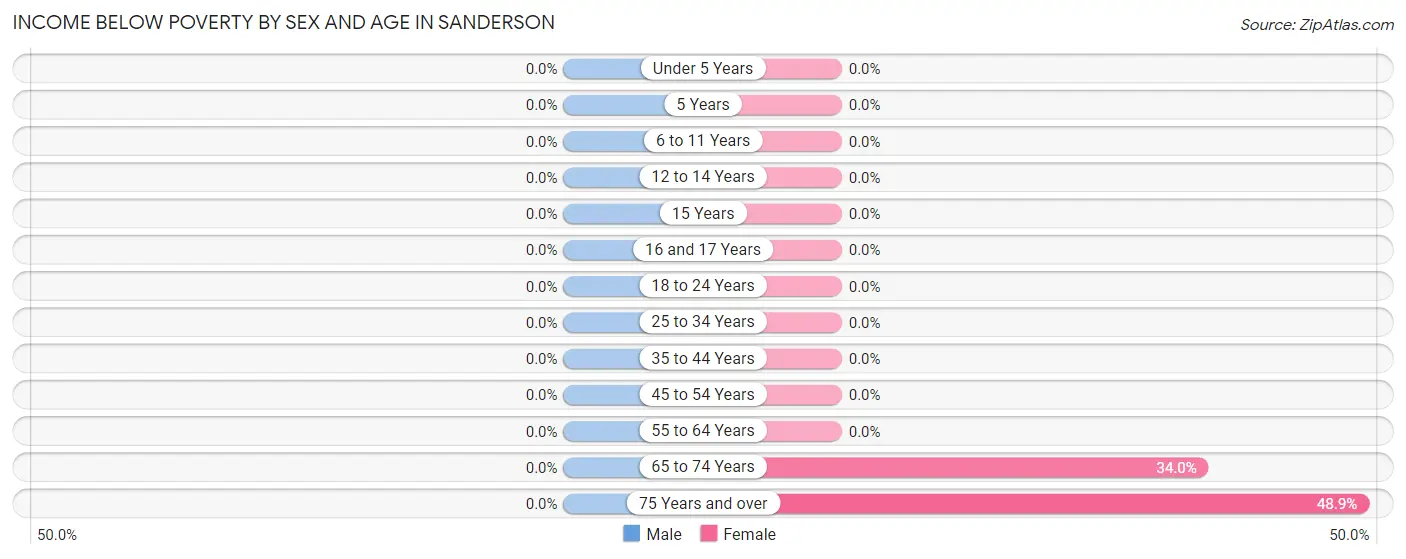
| Age Bracket | Male | Female |
| Under 5 Years | 0 (0.0%) | 0 (0.0%) |
| 5 Years | 0 (0.0%) | 0 (0.0%) |
| 6 to 11 Years | 0 (0.0%) | 0 (0.0%) |
| 12 to 14 Years | 0 (0.0%) | 0 (0.0%) |
| 15 Years | 0 (0.0%) | 0 (0.0%) |
| 16 and 17 Years | 0 (0.0%) | 0 (0.0%) |
| 18 to 24 Years | 0 (0.0%) | 0 (0.0%) |
| 25 to 34 Years | 0 (0.0%) | 0 (0.0%) |
| 35 to 44 Years | 0 (0.0%) | 0 (0.0%) |
| 45 to 54 Years | 0 (0.0%) | 0 (0.0%) |
| 55 to 64 Years | 0 (0.0%) | 0 (0.0%) |
| 65 to 74 Years | 0 (0.0%) | 32 (34.0%) |
| 75 Years and over | 0 (0.0%) | 23 (48.9%) |
| Total | 0 (0.0%) | 55 (16.7%) |
Income Above Poverty by Sex and Age in Sanderson
According to the poverty statistics in Sanderson, males aged under 5 years and females aged under 5 years are the age groups that are most secure financially, with 100.0% of males and 100.0% of females in these age groups living above the poverty line.
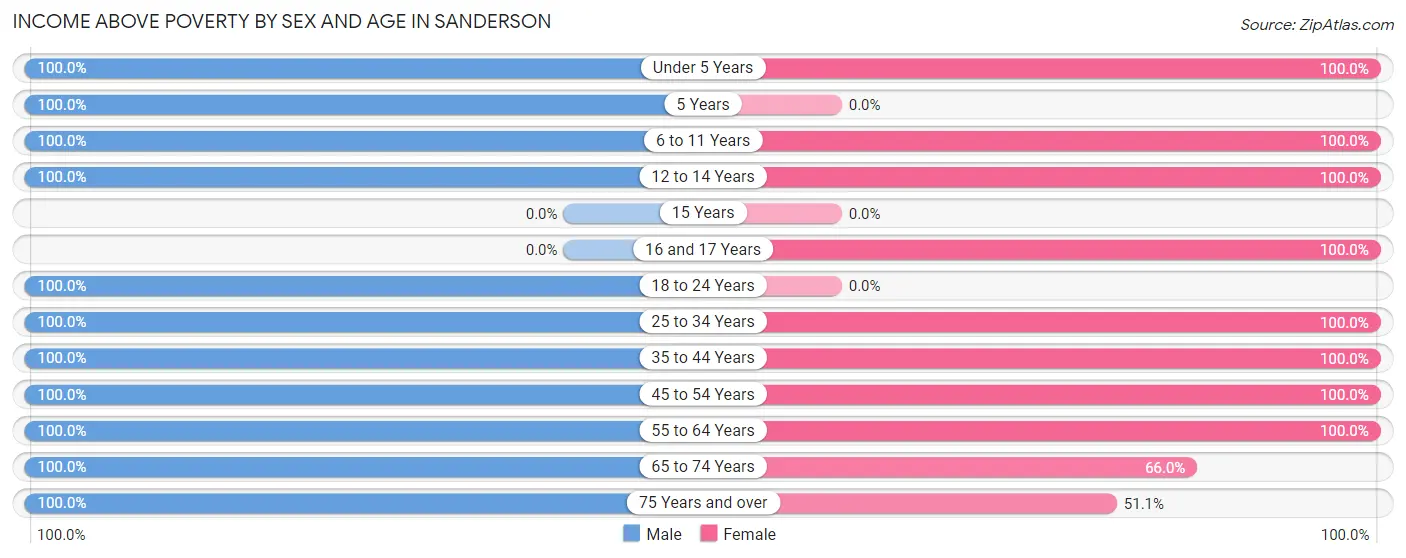
| Age Bracket | Male | Female |
| Under 5 Years | 5 (100.0%) | 6 (100.0%) |
| 5 Years | 17 (100.0%) | 0 (0.0%) |
| 6 to 11 Years | 29 (100.0%) | 18 (100.0%) |
| 12 to 14 Years | 4 (100.0%) | 5 (100.0%) |
| 15 Years | 0 (0.0%) | 0 (0.0%) |
| 16 and 17 Years | 0 (0.0%) | 10 (100.0%) |
| 18 to 24 Years | 36 (100.0%) | 0 (0.0%) |
| 25 to 34 Years | 5 (100.0%) | 5 (100.0%) |
| 35 to 44 Years | 48 (100.0%) | 13 (100.0%) |
| 45 to 54 Years | 63 (100.0%) | 66 (100.0%) |
| 55 to 64 Years | 121 (100.0%) | 65 (100.0%) |
| 65 to 74 Years | 68 (100.0%) | 62 (66.0%) |
| 75 Years and over | 15 (100.0%) | 24 (51.1%) |
| Total | 411 (100.0%) | 274 (83.3%) |
Income Below Poverty Among Married-Couple Families in Sanderson
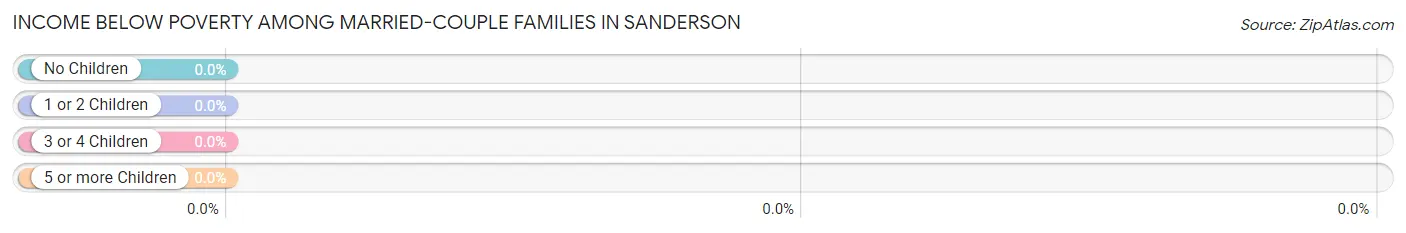
| Children | Above Poverty | Below Poverty |
| No Children | 144 (100.0%) | 0 (0.0%) |
| 1 or 2 Children | 7 (100.0%) | 0 (0.0%) |
| 3 or 4 Children | 5 (100.0%) | 0 (0.0%) |
| 5 or more Children | 0 (0.0%) | 0 (0.0%) |
| Total | 156 (100.0%) | 0 (0.0%) |
Income Below Poverty Among Single-Parent Households in Sanderson
| Children | Single Father | Single Mother |
| No Children | 0 (0.0%) | 0 (0.0%) |
| 1 or 2 Children | 0 (0.0%) | 0 (0.0%) |
| 3 or 4 Children | 0 (0.0%) | 0 (0.0%) |
| 5 or more Children | 0 (0.0%) | 0 (0.0%) |
| Total | 0 (0.0%) | 0 (0.0%) |
Income Below Poverty Among Married-Couple vs Single-Parent Households in Sanderson
| Children | Married-Couple Families | Single-Parent Households |
| No Children | 0 (0.0%) | 0 (0.0%) |
| 1 or 2 Children | 0 (0.0%) | 0 (0.0%) |
| 3 or 4 Children | 0 (0.0%) | 0 (0.0%) |
| 5 or more Children | 0 (0.0%) | 0 (0.0%) |
| Total | 0 (0.0%) | 0 (0.0%) |
Race in Sanderson
The most populous races in Sanderson are White / Caucasian (568 | 76.8%), Hispanic or Latino (405 | 54.7%), and Two or more Races (133 | 18.0%).
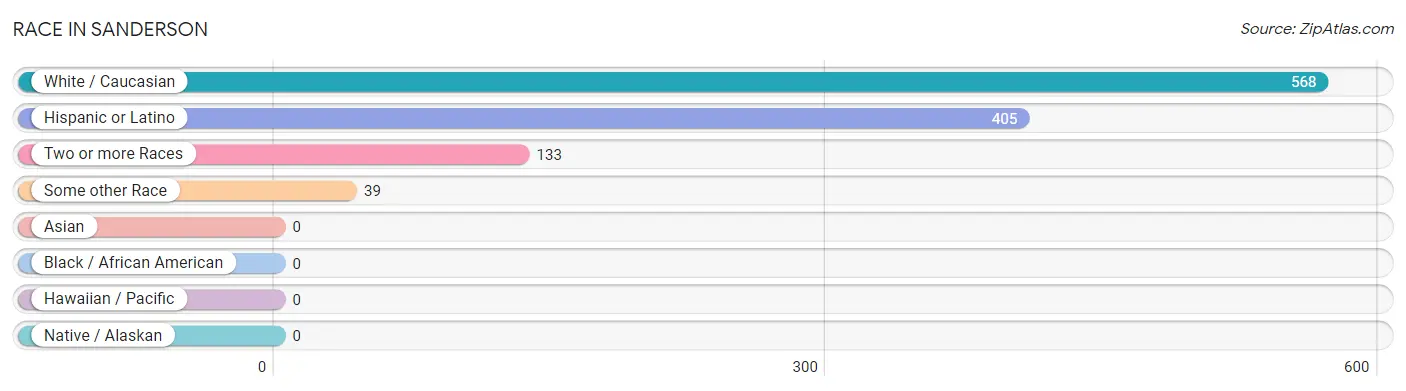
| Race | # Population | % Population |
| Asian | 0 | 0.0% |
| Black / African American | 0 | 0.0% |
| Hawaiian / Pacific | 0 | 0.0% |
| Hispanic or Latino | 405 | 54.7% |
| Native / Alaskan | 0 | 0.0% |
| White / Caucasian | 568 | 76.8% |
| Two or more Races | 133 | 18.0% |
| Some other Race | 39 | 5.3% |
| Total | 740 | 100.0% |
Ancestry in Sanderson
The most populous ancestries reported in Sanderson are Mexican (365 | 49.3%), German (76 | 10.3%), American (71 | 9.6%), English (38 | 5.1%), and Irish (30 | 4.1%), together accounting for 78.4% of all Sanderson residents.
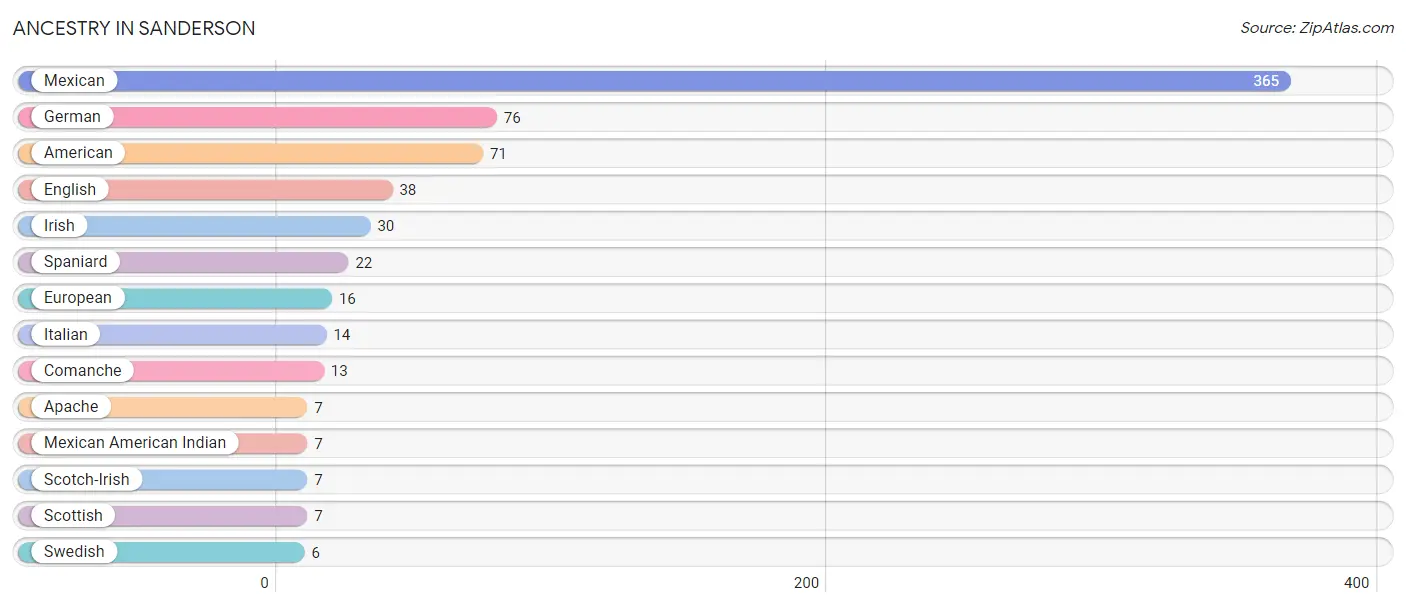
| Ancestry | # Population | % Population |
| American | 71 | 9.6% |
| Apache | 7 | 0.9% |
| Comanche | 13 | 1.8% |
| English | 38 | 5.1% |
| European | 16 | 2.2% |
| German | 76 | 10.3% |
| Irish | 30 | 4.1% |
| Italian | 14 | 1.9% |
| Mexican | 365 | 49.3% |
| Mexican American Indian | 7 | 0.9% |
| Scotch-Irish | 7 | 0.9% |
| Scottish | 7 | 0.9% |
| Spaniard | 22 | 3.0% |
| Swedish | 6 | 0.8% | View All 14 Rows |
Immigrants in Sanderson
The most numerous immigrant groups reported in Sanderson came from Central America (20 | 2.7%), Latin America (20 | 2.7%), and Mexico (20 | 2.7%), together accounting for 8.1% of all Sanderson residents.
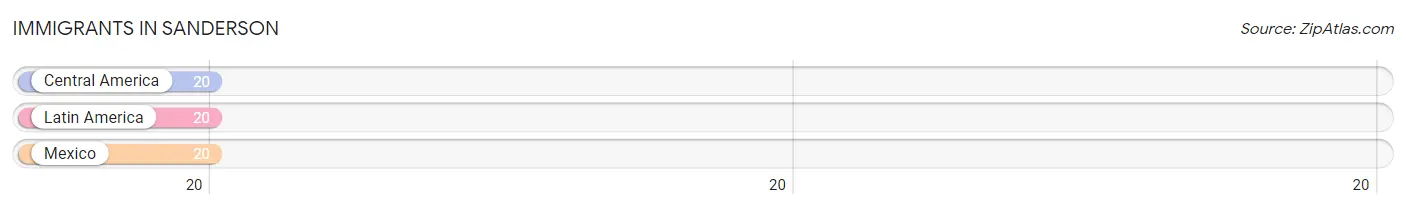
| Immigration Origin | # Population | % Population |
| Central America | 20 | 2.7% |
| Latin America | 20 | 2.7% |
| Mexico | 20 | 2.7% | View All 3 Rows |
Sex and Age in Sanderson
Sex and Age in Sanderson
The most populous age groups in Sanderson are 60 to 64 Years (63 | 15.3%) for men and 65 to 69 Years (56 | 17.0%) for women.
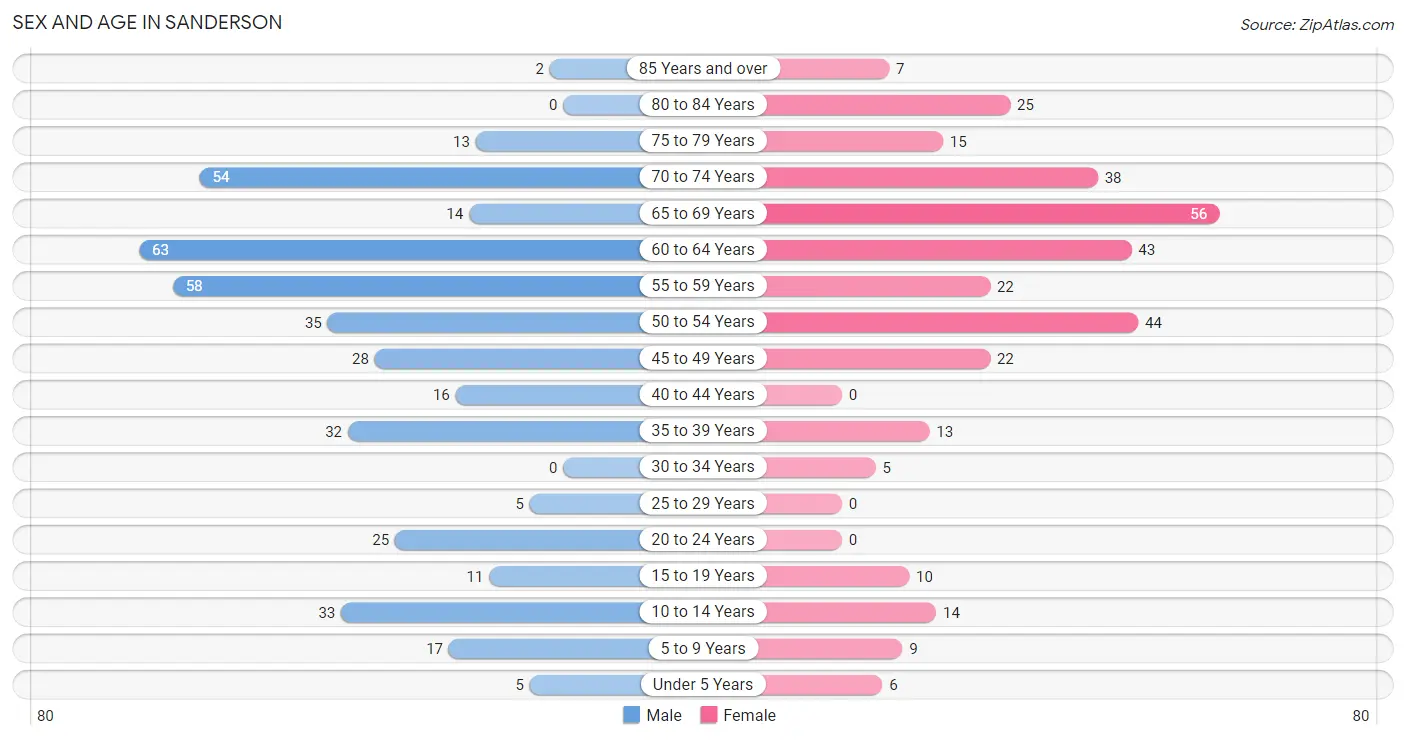
| Age Bracket | Male | Female |
| Under 5 Years | 5 (1.2%) | 6 (1.8%) |
| 5 to 9 Years | 17 (4.1%) | 9 (2.7%) |
| 10 to 14 Years | 33 (8.0%) | 14 (4.3%) |
| 15 to 19 Years | 11 (2.7%) | 10 (3.0%) |
| 20 to 24 Years | 25 (6.1%) | 0 (0.0%) |
| 25 to 29 Years | 5 (1.2%) | 0 (0.0%) |
| 30 to 34 Years | 0 (0.0%) | 5 (1.5%) |
| 35 to 39 Years | 32 (7.8%) | 13 (4.0%) |
| 40 to 44 Years | 16 (3.9%) | 0 (0.0%) |
| 45 to 49 Years | 28 (6.8%) | 22 (6.7%) |
| 50 to 54 Years | 35 (8.5%) | 44 (13.4%) |
| 55 to 59 Years | 58 (14.1%) | 22 (6.7%) |
| 60 to 64 Years | 63 (15.3%) | 43 (13.1%) |
| 65 to 69 Years | 14 (3.4%) | 56 (17.0%) |
| 70 to 74 Years | 54 (13.1%) | 38 (11.6%) |
| 75 to 79 Years | 13 (3.2%) | 15 (4.6%) |
| 80 to 84 Years | 0 (0.0%) | 25 (7.6%) |
| 85 Years and over | 2 (0.5%) | 7 (2.1%) |
| Total | 411 (100.0%) | 329 (100.0%) |
Families and Households in Sanderson
Median Family Size in Sanderson
The median family size in Sanderson is 2.93 persons per family, with single female/mother families (32 | 15.9%) accounting for the largest median family size of 4.13 persons per family. On the other hand, married-couple families (156 | 77.6%) represent the smallest median family size with 2.69 persons per family.
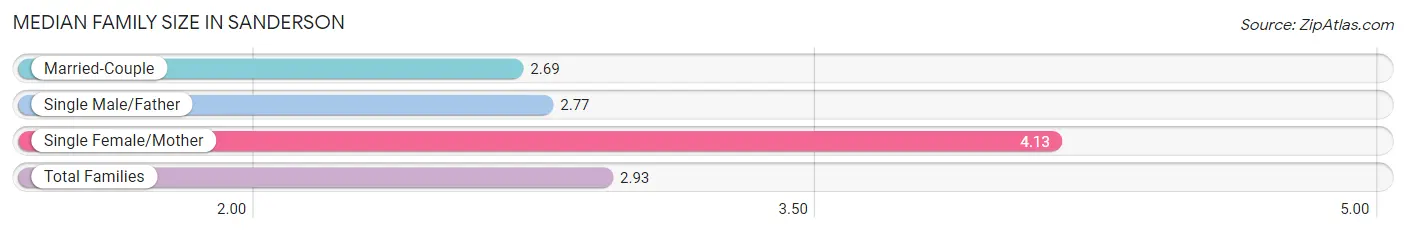
| Family Type | # Families | Family Size |
| Married-Couple | 156 (77.6%) | 2.69 |
| Single Male/Father | 13 (6.5%) | 2.77 |
| Single Female/Mother | 32 (15.9%) | 4.13 |
| Total Families | 201 (100.0%) | 2.93 |
Median Household Size in Sanderson
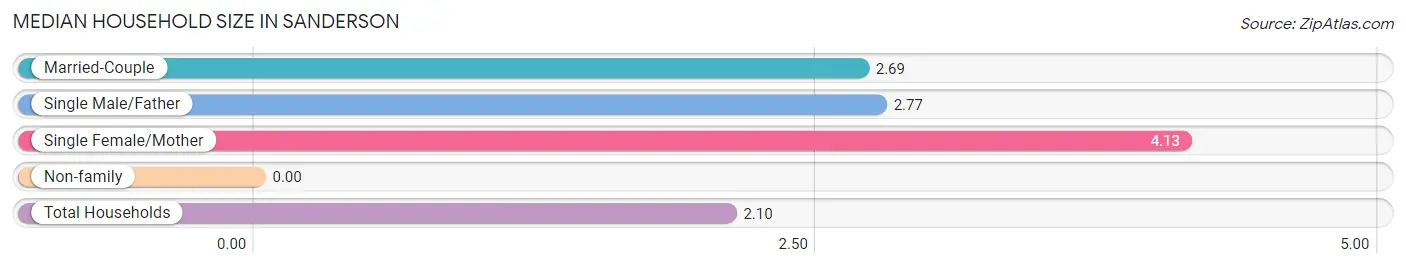
| Household Type | # Households | Household Size |
| Married-Couple | 156 (44.2%) | 2.69 |
| Single Male/Father | 13 (3.7%) | 2.77 |
| Single Female/Mother | 32 (9.1%) | 4.13 |
| Non-family | 152 (43.1%) | - |
| Total Households | 353 (100.0%) | 2.10 |
Household Size by Marriage Status in Sanderson
Out of a total of 353 households in Sanderson, 201 (56.9%) are family households, while 152 (43.1%) are nonfamily households. The most numerous type of family households are 2-person households, comprising 158, and the most common type of nonfamily households are 1-person households, comprising 152.
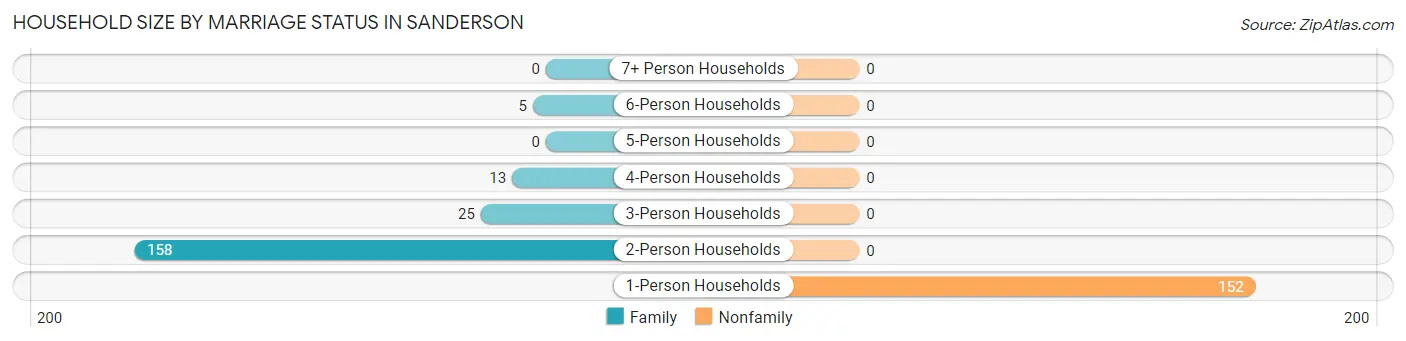
| Household Size | Family Households | Nonfamily Households |
| 1-Person Households | - | 152 (43.1%) |
| 2-Person Households | 158 (44.8%) | 0 (0.0%) |
| 3-Person Households | 25 (7.1%) | 0 (0.0%) |
| 4-Person Households | 13 (3.7%) | 0 (0.0%) |
| 5-Person Households | 0 (0.0%) | 0 (0.0%) |
| 6-Person Households | 5 (1.4%) | 0 (0.0%) |
| 7+ Person Households | 0 (0.0%) | 0 (0.0%) |
| Total | 201 (56.9%) | 152 (43.1%) |
Female Fertility in Sanderson
Fertility by Age in Sanderson
| Age Bracket | Women with Births | Births / 1,000 Women |
| 15 to 19 years | 0 (0.0%) | 0.0 |
| 20 to 34 years | 0 (0.0%) | 0.0 |
| 35 to 50 years | 0 (0.0%) | 0.0 |
| Total | 0 (0.0%) | 0.0 |
Fertility by Age by Marriage Status in Sanderson
| Age Bracket | Married | Unmarried |
| 15 to 19 years | 0 (0.0%) | 0 (0.0%) |
| 20 to 34 years | 0 (0.0%) | 0 (0.0%) |
| 35 to 50 years | 0 (0.0%) | 0 (0.0%) |
| Total | 0 (0.0%) | 0 (0.0%) |
Fertility by Education in Sanderson
| Educational Attainment | Women with Births | Births / 1,000 Women |
| Less than High School | 0 (0.0%) | 0.0 |
| High School Diploma | 0 (0.0%) | 0.0 |
| College or Associate's Degree | 0 (0.0%) | 0.0 |
| Bachelor's Degree | 0 (0.0%) | 0.0 |
| Graduate Degree | 0 (0.0%) | 0.0 |
| Total | 0 (0.0%) | 0.0 |
Fertility by Education by Marriage Status in Sanderson
| Educational Attainment | Married | Unmarried |
| Less than High School | 0 (0.0%) | 0 (0.0%) |
| High School Diploma | 0 (0.0%) | 0 (0.0%) |
| College or Associate's Degree | 0 (0.0%) | 0 (0.0%) |
| Bachelor's Degree | 0 (0.0%) | 0 (0.0%) |
| Graduate Degree | 0 (0.0%) | 0 (0.0%) |
| Total | 0 (0.0%) | 0 (0.0%) |
Employment Characteristics in Sanderson
Employment by Class of Employer in Sanderson
Among the 308 employed individuals in Sanderson, private company employees (131 | 42.5%), local government employees (77 | 25.0%), and self-employed (not incorporated) (59 | 19.2%) make up the most common classes of employment.

| Employer Class | # Employees | % Employees |
| Private Company Employees | 131 | 42.5% |
| Self-Employed (Incorporated) | 0 | 0.0% |
| Self-Employed (Not Incorporated) | 59 | 19.2% |
| Not-for-profit Organizations | 6 | 1.9% |
| Local Government Employees | 77 | 25.0% |
| State Government Employees | 19 | 6.2% |
| Federal Government Employees | 16 | 5.2% |
| Unpaid Family Workers | 0 | 0.0% |
| Total | 308 | 100.0% |
Employment Status by Age in Sanderson
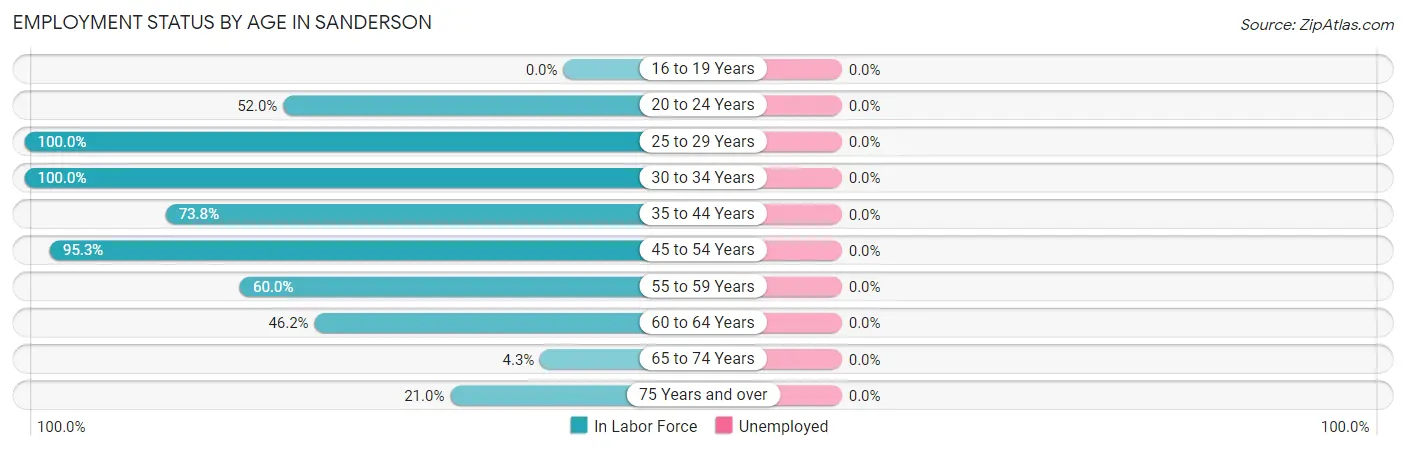
| Age Bracket | In Labor Force | Unemployed |
| 16 to 19 Years | 0 (0.0%) | 0 (0.0%) |
| 20 to 24 Years | 13 (52.0%) | 0 (0.0%) |
| 25 to 29 Years | 5 (100.0%) | 0 (0.0%) |
| 30 to 34 Years | 5 (100.0%) | 0 (0.0%) |
| 35 to 44 Years | 45 (73.8%) | 0 (0.0%) |
| 45 to 54 Years | 123 (95.3%) | 0 (0.0%) |
| 55 to 59 Years | 48 (60.0%) | 0 (0.0%) |
| 60 to 64 Years | 49 (46.2%) | 0 (0.0%) |
| 65 to 74 Years | 7 (4.3%) | 0 (0.0%) |
| 75 Years and over | 13 (21.0%) | 0 (0.0%) |
| Total | 308 (47.0%) | 0 (0.0%) |
Employment Status by Educational Attainment in Sanderson
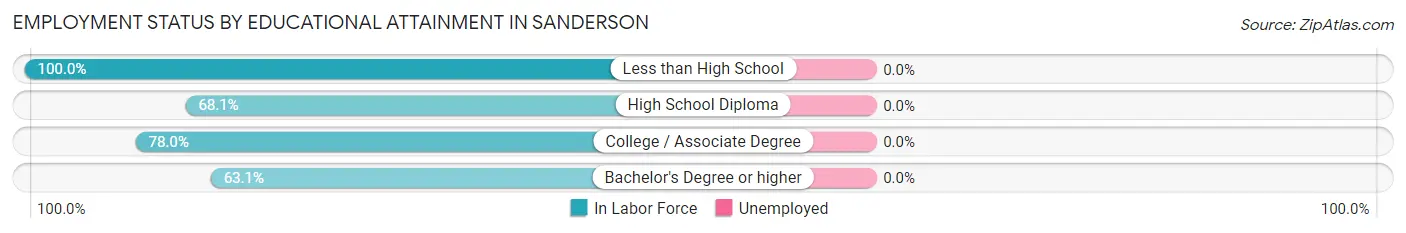
| Educational Attainment | In Labor Force | Unemployed |
| Less than High School | 23 (100.0%) | 0 (0.0%) |
| High School Diploma | 147 (68.1%) | 0 (0.0%) |
| College / Associate Degree | 64 (78.0%) | 0 (0.0%) |
| Bachelor's Degree or higher | 41 (63.1%) | 0 (0.0%) |
| Total | 275 (71.2%) | 0 (0.0%) |
Employment Occupations by Sex in Sanderson
Management, Business, Science and Arts Occupations
The most common Management, Business, Science and Arts occupations in Sanderson are Management (41 | 13.3%), Community & Social Service (28 | 9.1%), Education Instruction & Library (28 | 9.1%), Business & Financial (6 | 1.9%), and Health Diagnosing & Treating (3 | 1.0%).
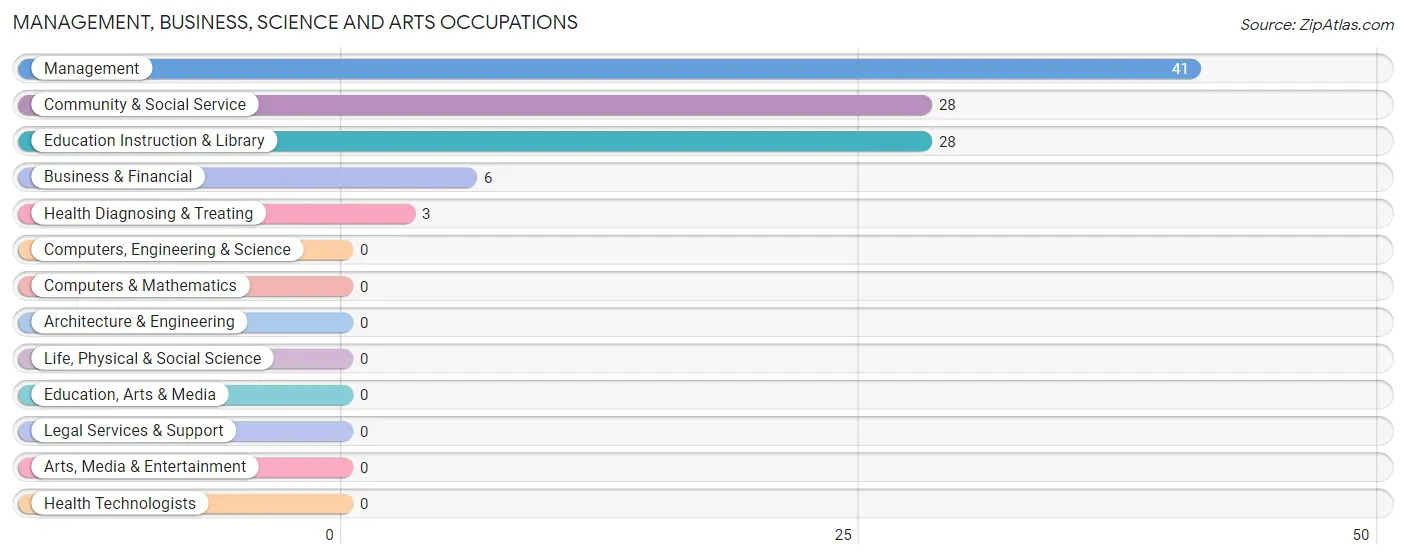
Management, Business, Science and Arts Occupations by Sex
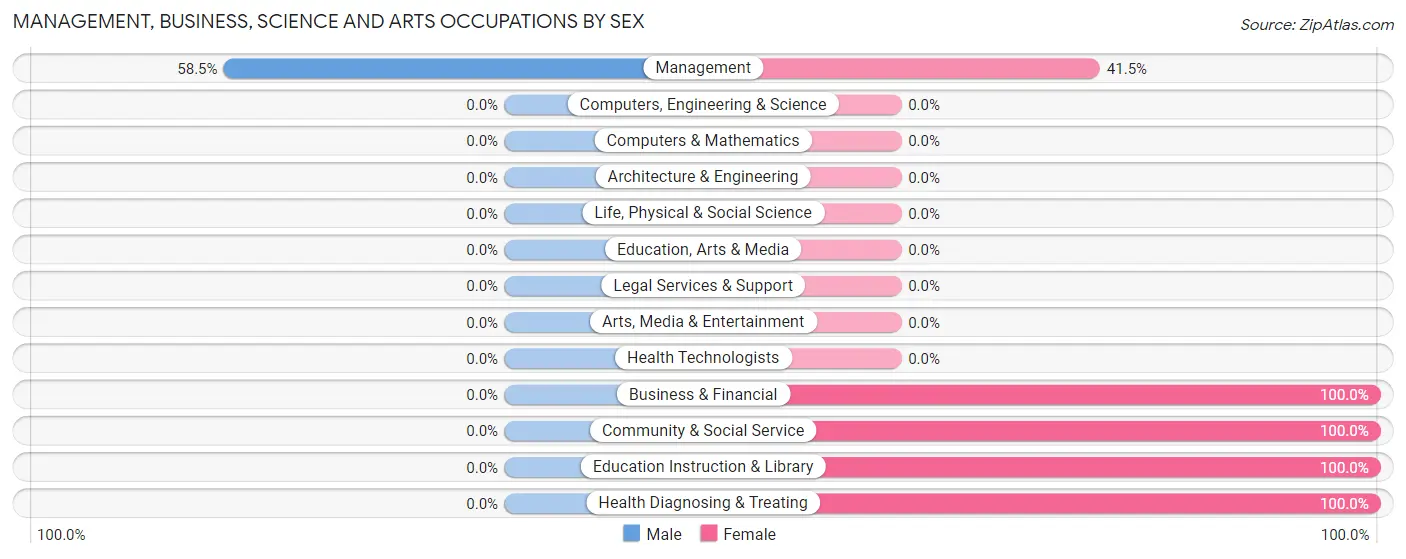
| Occupation | Male | Female |
| Management | 24 (58.5%) | 17 (41.5%) |
| Business & Financial | 0 (0.0%) | 6 (100.0%) |
| Computers, Engineering & Science | 0 (0.0%) | 0 (0.0%) |
| Computers & Mathematics | 0 (0.0%) | 0 (0.0%) |
| Architecture & Engineering | 0 (0.0%) | 0 (0.0%) |
| Life, Physical & Social Science | 0 (0.0%) | 0 (0.0%) |
| Community & Social Service | 0 (0.0%) | 28 (100.0%) |
| Education, Arts & Media | 0 (0.0%) | 0 (0.0%) |
| Legal Services & Support | 0 (0.0%) | 0 (0.0%) |
| Education Instruction & Library | 0 (0.0%) | 28 (100.0%) |
| Arts, Media & Entertainment | 0 (0.0%) | 0 (0.0%) |
| Health Diagnosing & Treating | 0 (0.0%) | 3 (100.0%) |
| Health Technologists | 0 (0.0%) | 0 (0.0%) |
| Total (Category) | 24 (30.8%) | 54 (69.2%) |
| Total (Overall) | 177 (57.5%) | 131 (42.5%) |
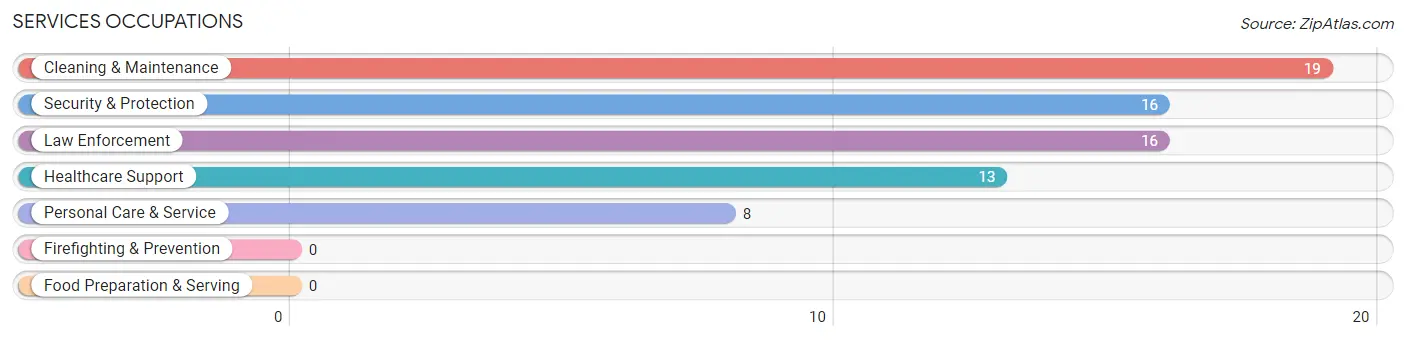
Services Occupations
The most common Services occupations in Sanderson are Cleaning & Maintenance (19 | 6.2%), Security & Protection (16 | 5.2%), Law Enforcement (16 | 5.2%), Healthcare Support (13 | 4.2%), and Personal Care & Service (8 | 2.6%).
Services Occupations by Sex
Within the Services occupations in Sanderson, the most male-oriented occupations are Cleaning & Maintenance (100.0%), Security & Protection (37.5%), and Law Enforcement (37.5%), while the most female-oriented occupations are Healthcare Support (100.0%), Personal Care & Service (100.0%), and Security & Protection (62.5%).
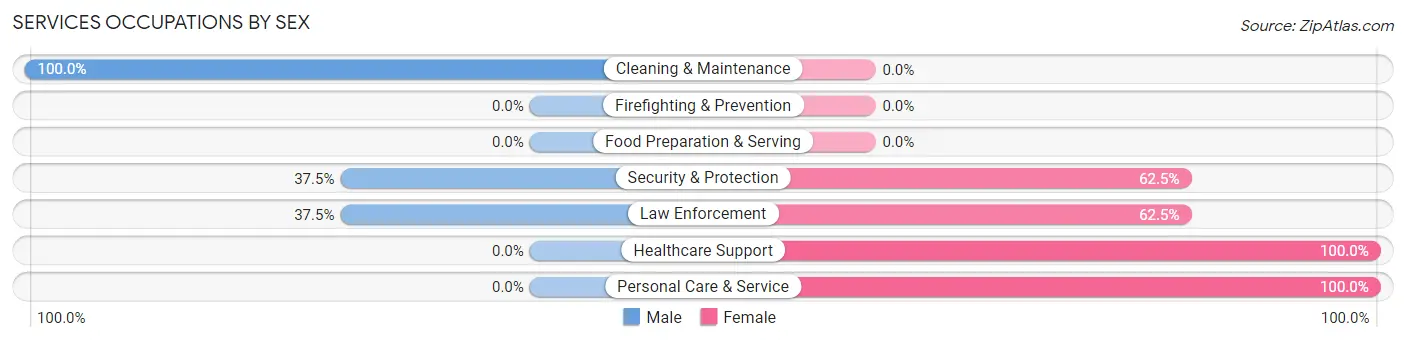
| Occupation | Male | Female |
| Healthcare Support | 0 (0.0%) | 13 (100.0%) |
| Security & Protection | 6 (37.5%) | 10 (62.5%) |
| Firefighting & Prevention | 0 (0.0%) | 0 (0.0%) |
| Law Enforcement | 6 (37.5%) | 10 (62.5%) |
| Food Preparation & Serving | 0 (0.0%) | 0 (0.0%) |
| Cleaning & Maintenance | 19 (100.0%) | 0 (0.0%) |
| Personal Care & Service | 0 (0.0%) | 8 (100.0%) |
| Total (Category) | 25 (44.6%) | 31 (55.4%) |
| Total (Overall) | 177 (57.5%) | 131 (42.5%) |
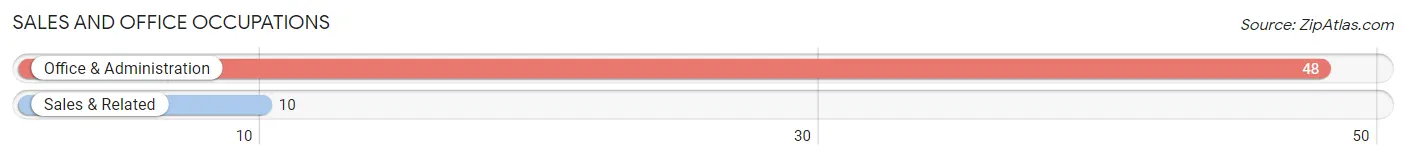
Sales and Office Occupations
The most common Sales and Office occupations in Sanderson are Office & Administration (48 | 15.6%), and Sales & Related (10 | 3.3%).
Sales and Office Occupations by Sex
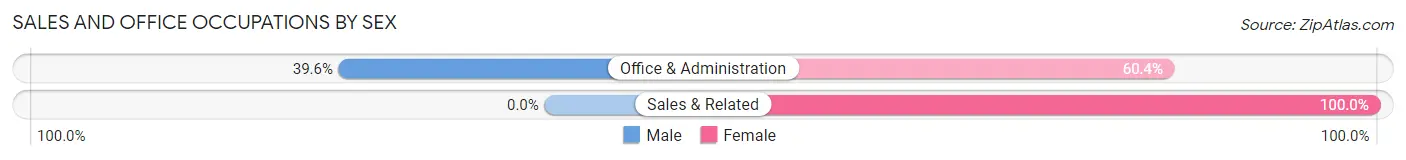
| Occupation | Male | Female |
| Sales & Related | 0 (0.0%) | 10 (100.0%) |
| Office & Administration | 19 (39.6%) | 29 (60.4%) |
| Total (Category) | 19 (32.8%) | 39 (67.2%) |
| Total (Overall) | 177 (57.5%) | 131 (42.5%) |
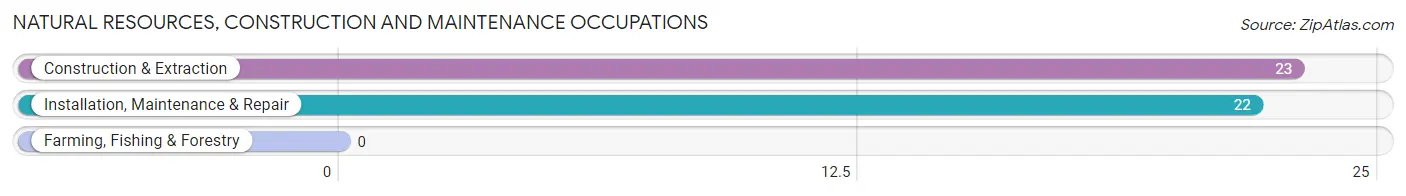
Natural Resources, Construction and Maintenance Occupations
The most common Natural Resources, Construction and Maintenance occupations in Sanderson are Construction & Extraction (23 | 7.5%), and Installation, Maintenance & Repair (22 | 7.1%).
Natural Resources, Construction and Maintenance Occupations by Sex
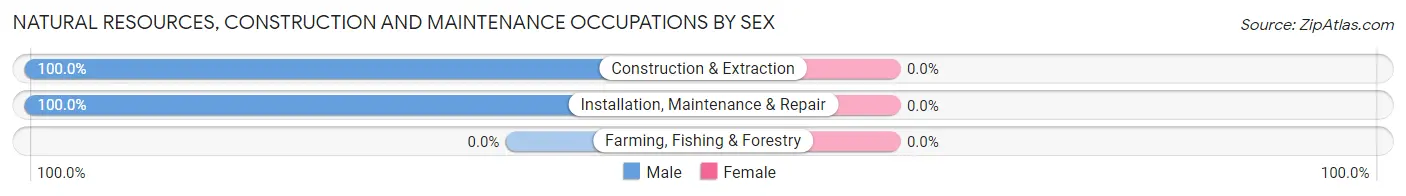
| Occupation | Male | Female |
| Farming, Fishing & Forestry | 0 (0.0%) | 0 (0.0%) |
| Construction & Extraction | 23 (100.0%) | 0 (0.0%) |
| Installation, Maintenance & Repair | 22 (100.0%) | 0 (0.0%) |
| Total (Category) | 45 (100.0%) | 0 (0.0%) |
| Total (Overall) | 177 (57.5%) | 131 (42.5%) |
Production, Transportation and Moving Occupations
The most common Production, Transportation and Moving occupations in Sanderson are Transportation (47 | 15.3%), Material Moving (17 | 5.5%), and Production (7 | 2.3%).
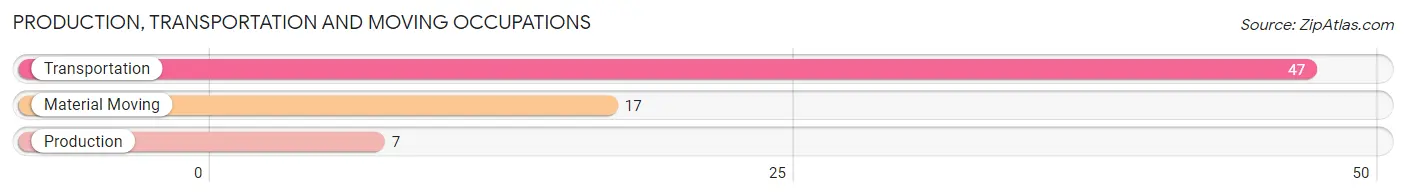
Production, Transportation and Moving Occupations by Sex
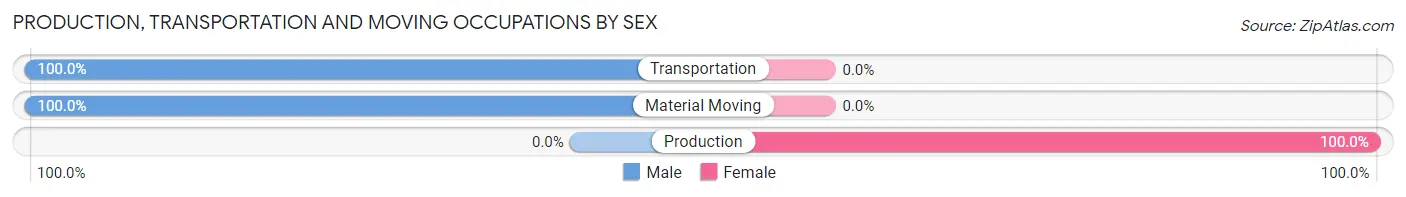
| Occupation | Male | Female |
| Production | 0 (0.0%) | 7 (100.0%) |
| Transportation | 47 (100.0%) | 0 (0.0%) |
| Material Moving | 17 (100.0%) | 0 (0.0%) |
| Total (Category) | 64 (90.1%) | 7 (9.9%) |
| Total (Overall) | 177 (57.5%) | 131 (42.5%) |
Employment Industries by Sex in Sanderson
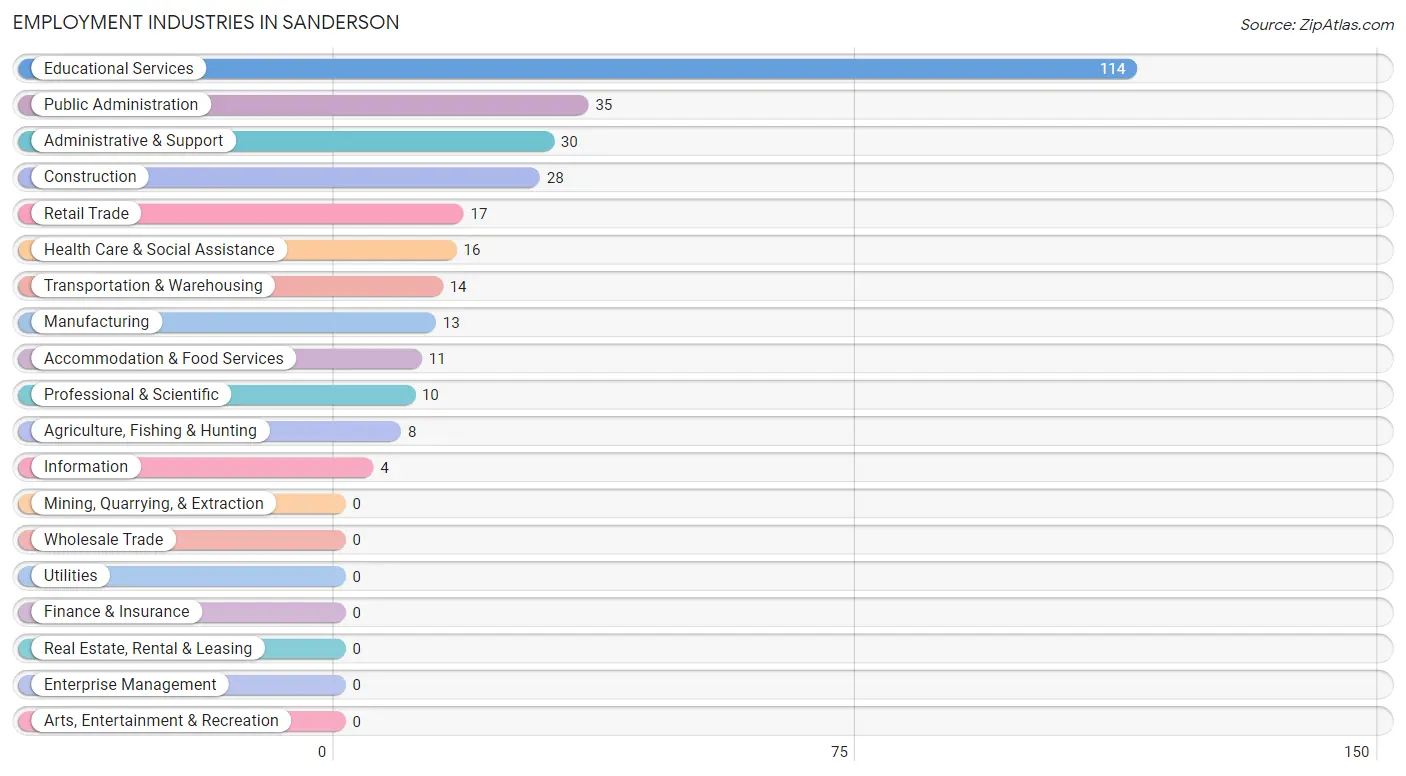
Employment Industries in Sanderson
The major employment industries in Sanderson include Educational Services (114 | 37.0%), Public Administration (35 | 11.4%), Administrative & Support (30 | 9.7%), Construction (28 | 9.1%), and Retail Trade (17 | 5.5%).
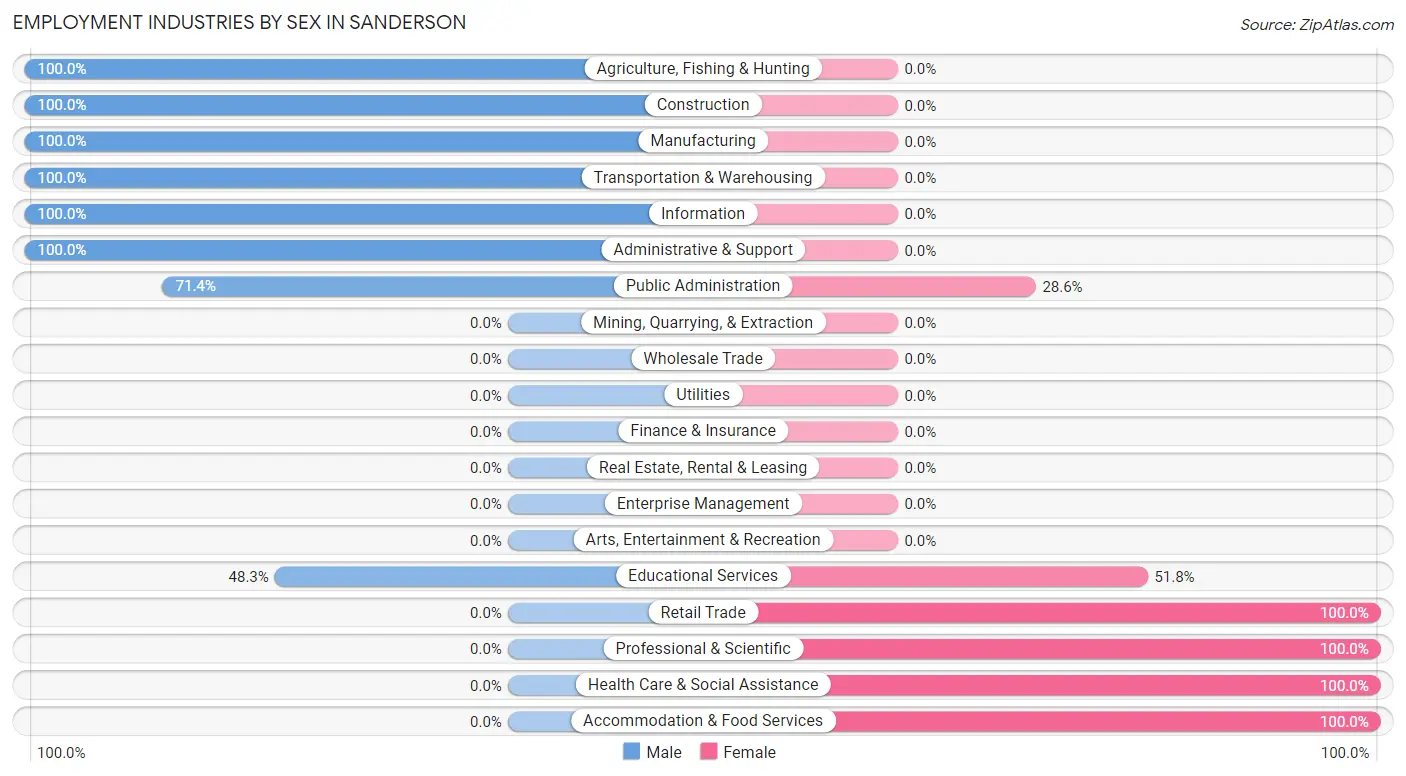
Employment Industries by Sex in Sanderson
The Sanderson industries that see more men than women are Agriculture, Fishing & Hunting (100.0%), Construction (100.0%), and Manufacturing (100.0%), whereas the industries that tend to have a higher number of women are Retail Trade (100.0%), Professional & Scientific (100.0%), and Health Care & Social Assistance (100.0%).
| Industry | Male | Female |
| Agriculture, Fishing & Hunting | 8 (100.0%) | 0 (0.0%) |
| Mining, Quarrying, & Extraction | 0 (0.0%) | 0 (0.0%) |
| Construction | 28 (100.0%) | 0 (0.0%) |
| Manufacturing | 13 (100.0%) | 0 (0.0%) |
| Wholesale Trade | 0 (0.0%) | 0 (0.0%) |
| Retail Trade | 0 (0.0%) | 17 (100.0%) |
| Transportation & Warehousing | 14 (100.0%) | 0 (0.0%) |
| Utilities | 0 (0.0%) | 0 (0.0%) |
| Information | 4 (100.0%) | 0 (0.0%) |
| Finance & Insurance | 0 (0.0%) | 0 (0.0%) |
| Real Estate, Rental & Leasing | 0 (0.0%) | 0 (0.0%) |
| Professional & Scientific | 0 (0.0%) | 10 (100.0%) |
| Enterprise Management | 0 (0.0%) | 0 (0.0%) |
| Administrative & Support | 30 (100.0%) | 0 (0.0%) |
| Educational Services | 55 (48.2%) | 59 (51.7%) |
| Health Care & Social Assistance | 0 (0.0%) | 16 (100.0%) |
| Arts, Entertainment & Recreation | 0 (0.0%) | 0 (0.0%) |
| Accommodation & Food Services | 0 (0.0%) | 11 (100.0%) |
| Public Administration | 25 (71.4%) | 10 (28.6%) |
| Total | 177 (57.5%) | 131 (42.5%) |
Education in Sanderson
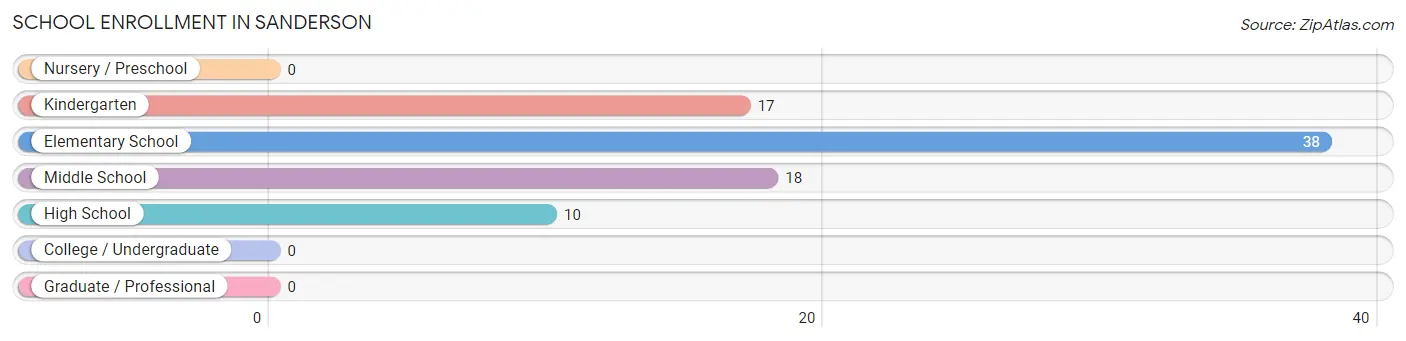
School Enrollment in Sanderson
The most common levels of schooling among the 83 students in Sanderson are elementary school (38 | 45.8%), middle school (18 | 21.7%), and kindergarten (17 | 20.5%).
| School Level | # Students | % Students |
| Nursery / Preschool | 0 | 0.0% |
| Kindergarten | 17 | 20.5% |
| Elementary School | 38 | 45.8% |
| Middle School | 18 | 21.7% |
| High School | 10 | 12.0% |
| College / Undergraduate | 0 | 0.0% |
| Graduate / Professional | 0 | 0.0% |
| Total | 83 | 100.0% |
School Enrollment by Age by Funding Source in Sanderson
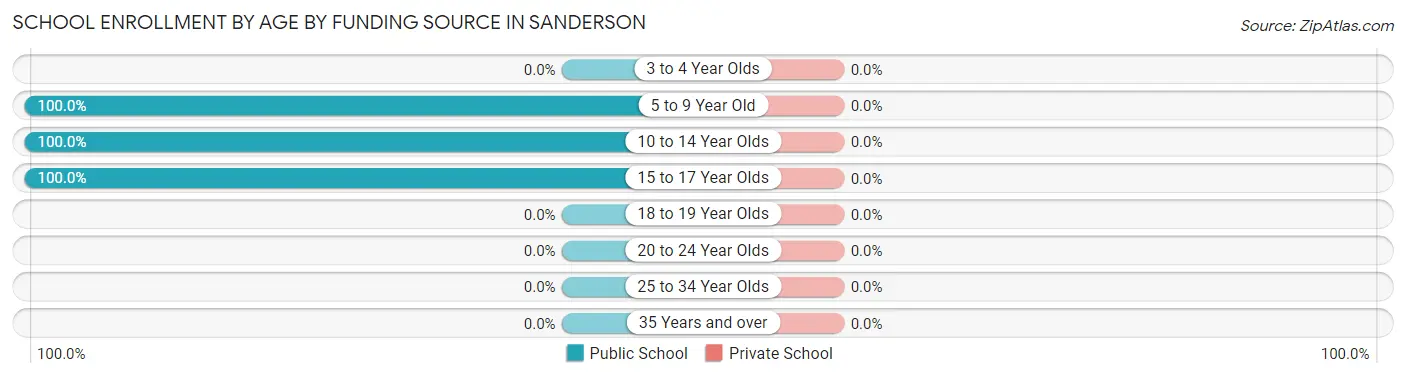
| Age Bracket | Public School | Private School |
| 3 to 4 Year Olds | 0 (0.0%) | 0 (0.0%) |
| 5 to 9 Year Old | 26 (100.0%) | 0 (0.0%) |
| 10 to 14 Year Olds | 47 (100.0%) | 0 (0.0%) |
| 15 to 17 Year Olds | 10 (100.0%) | 0 (0.0%) |
| 18 to 19 Year Olds | 0 (0.0%) | 0 (0.0%) |
| 20 to 24 Year Olds | 0 (0.0%) | 0 (0.0%) |
| 25 to 34 Year Olds | 0 (0.0%) | 0 (0.0%) |
| 35 Years and over | 0 (0.0%) | 0 (0.0%) |
| Total | 83 (100.0%) | 0 (0.0%) |
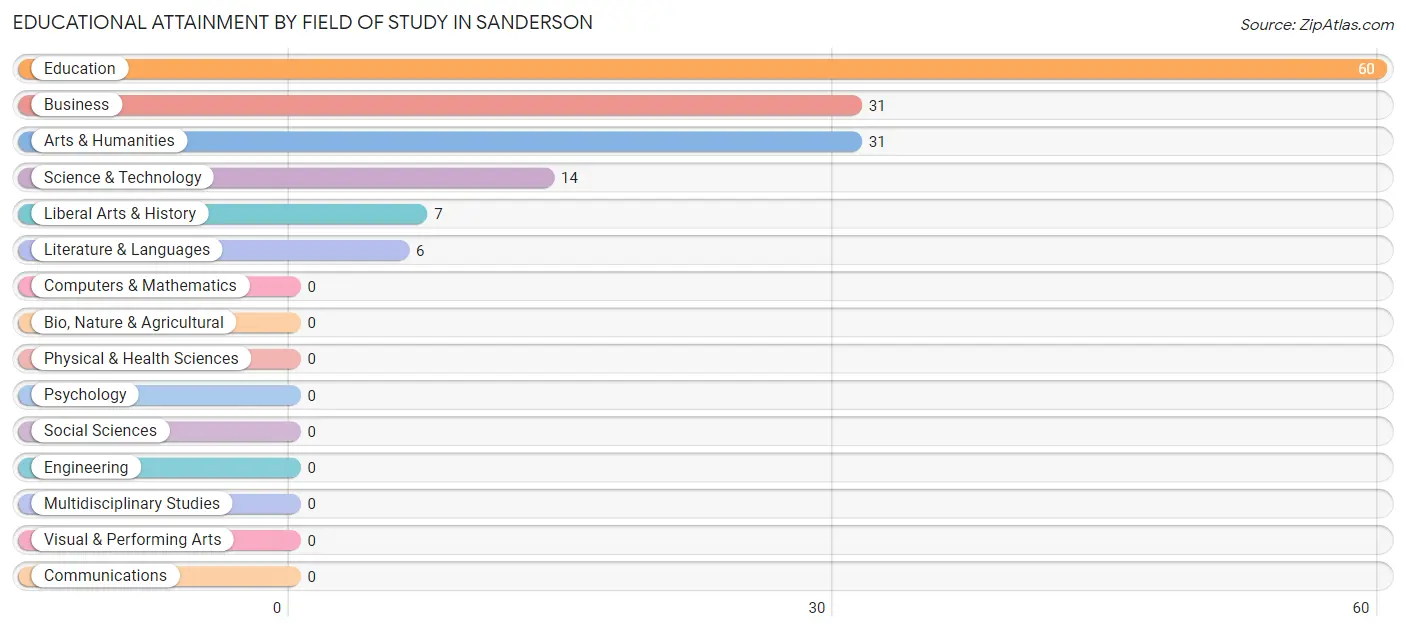
Educational Attainment by Field of Study in Sanderson
Education (60 | 40.3%), business (31 | 20.8%), arts & humanities (31 | 20.8%), science & technology (14 | 9.4%), and liberal arts & history (7 | 4.7%) are the most common fields of study among 149 individuals in Sanderson who have obtained a bachelor's degree or higher.
| Field of Study | # Graduates | % Graduates |
| Computers & Mathematics | 0 | 0.0% |
| Bio, Nature & Agricultural | 0 | 0.0% |
| Physical & Health Sciences | 0 | 0.0% |
| Psychology | 0 | 0.0% |
| Social Sciences | 0 | 0.0% |
| Engineering | 0 | 0.0% |
| Multidisciplinary Studies | 0 | 0.0% |
| Science & Technology | 14 | 9.4% |
| Business | 31 | 20.8% |
| Education | 60 | 40.3% |
| Literature & Languages | 6 | 4.0% |
| Liberal Arts & History | 7 | 4.7% |
| Visual & Performing Arts | 0 | 0.0% |
| Communications | 0 | 0.0% |
| Arts & Humanities | 31 | 20.8% |
| Total | 149 | 100.0% |
Transportation & Commute in Sanderson
Vehicle Availability by Sex in Sanderson
The most prevalent vehicle ownership categories in Sanderson are males with 3 vehicles (75, accounting for 42.4%) and females with 3 vehicles (60, making up 57.3%).
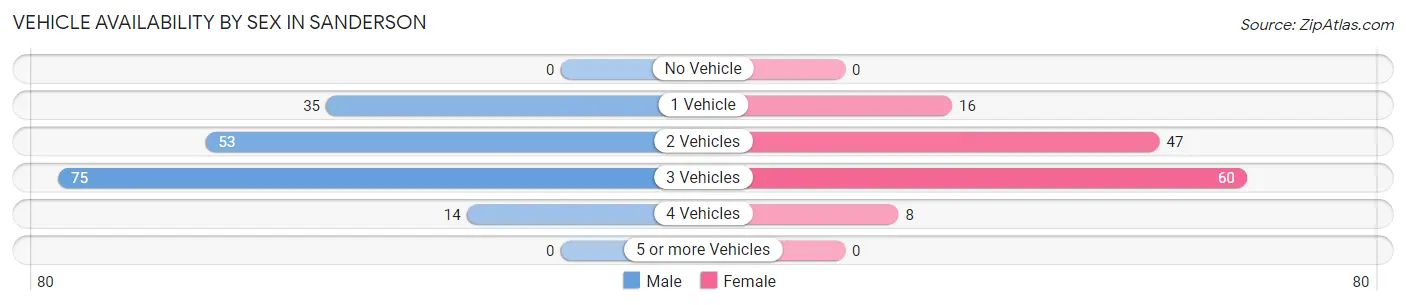
| Vehicles Available | Male | Female |
| No Vehicle | 0 (0.0%) | 0 (0.0%) |
| 1 Vehicle | 35 (19.8%) | 16 (12.2%) |
| 2 Vehicles | 53 (29.9%) | 47 (35.9%) |
| 3 Vehicles | 75 (42.4%) | 60 (45.8%) |
| 4 Vehicles | 14 (7.9%) | 8 (6.1%) |
| 5 or more Vehicles | 0 (0.0%) | 0 (0.0%) |
| Total | 177 (100.0%) | 131 (100.0%) |
Commute Time in Sanderson
The most frequently occuring commute durations in Sanderson are less than 5 minutes (165 commuters, 56.1%), 5 to 9 minutes (81 commuters, 27.6%), and 40 to 44 minutes (21 commuters, 7.1%).
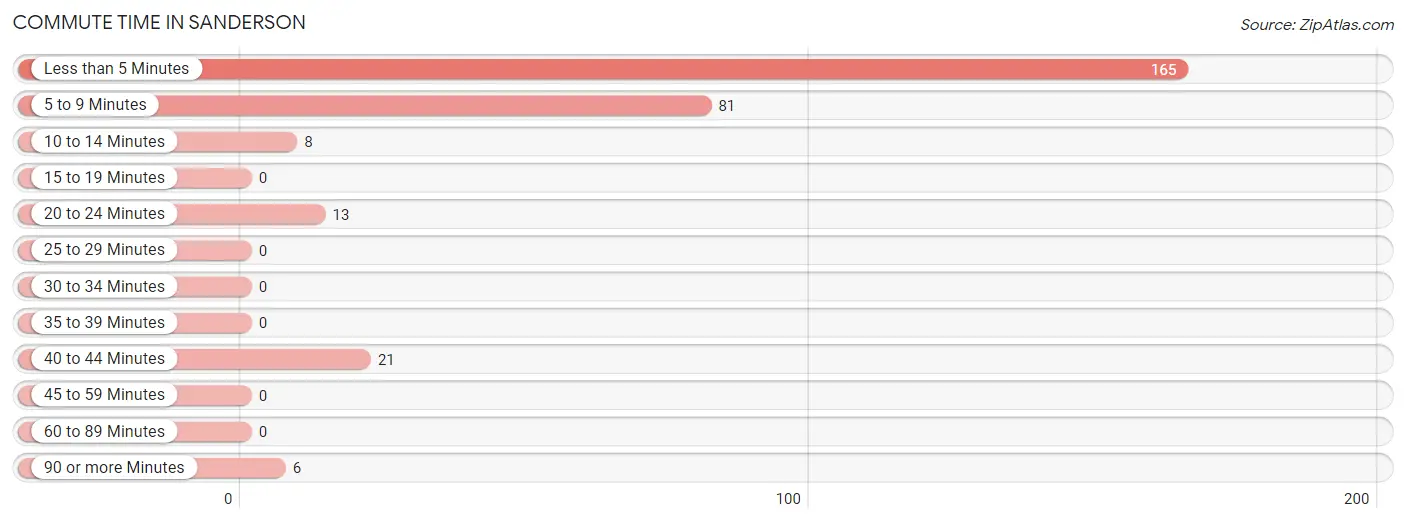
| Commute Time | # Commuters | % Commuters |
| Less than 5 Minutes | 165 | 56.1% |
| 5 to 9 Minutes | 81 | 27.6% |
| 10 to 14 Minutes | 8 | 2.7% |
| 15 to 19 Minutes | 0 | 0.0% |
| 20 to 24 Minutes | 13 | 4.4% |
| 25 to 29 Minutes | 0 | 0.0% |
| 30 to 34 Minutes | 0 | 0.0% |
| 35 to 39 Minutes | 0 | 0.0% |
| 40 to 44 Minutes | 21 | 7.1% |
| 45 to 59 Minutes | 0 | 0.0% |
| 60 to 89 Minutes | 0 | 0.0% |
| 90 or more Minutes | 6 | 2.0% |
Commute Time by Sex in Sanderson
The most common commute times in Sanderson are less than 5 minutes (89 commuters, 50.3%) for males and less than 5 minutes (76 commuters, 65.0%) for females.
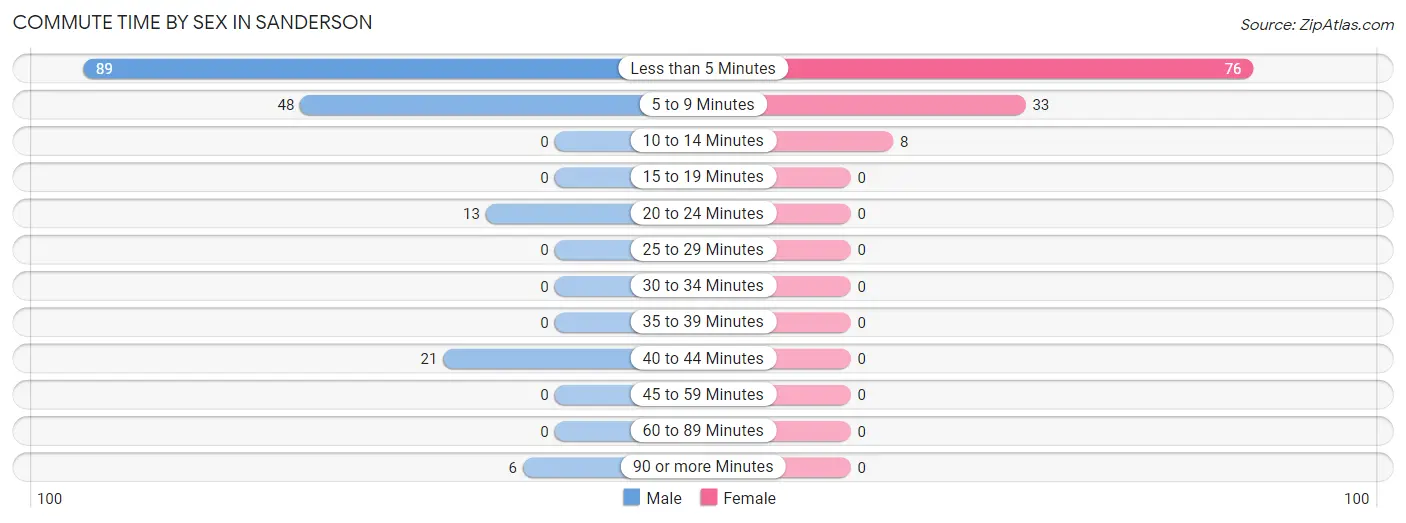
| Commute Time | Male | Female |
| Less than 5 Minutes | 89 (50.3%) | 76 (65.0%) |
| 5 to 9 Minutes | 48 (27.1%) | 33 (28.2%) |
| 10 to 14 Minutes | 0 (0.0%) | 8 (6.8%) |
| 15 to 19 Minutes | 0 (0.0%) | 0 (0.0%) |
| 20 to 24 Minutes | 13 (7.3%) | 0 (0.0%) |
| 25 to 29 Minutes | 0 (0.0%) | 0 (0.0%) |
| 30 to 34 Minutes | 0 (0.0%) | 0 (0.0%) |
| 35 to 39 Minutes | 0 (0.0%) | 0 (0.0%) |
| 40 to 44 Minutes | 21 (11.9%) | 0 (0.0%) |
| 45 to 59 Minutes | 0 (0.0%) | 0 (0.0%) |
| 60 to 89 Minutes | 0 (0.0%) | 0 (0.0%) |
| 90 or more Minutes | 6 (3.4%) | 0 (0.0%) |
Time of Departure to Work by Sex in Sanderson
The most frequent times of departure to work in Sanderson are 6:30 AM to 6:59 AM (50, 28.2%) for males and 7:30 AM to 7:59 AM (54, 46.2%) for females.
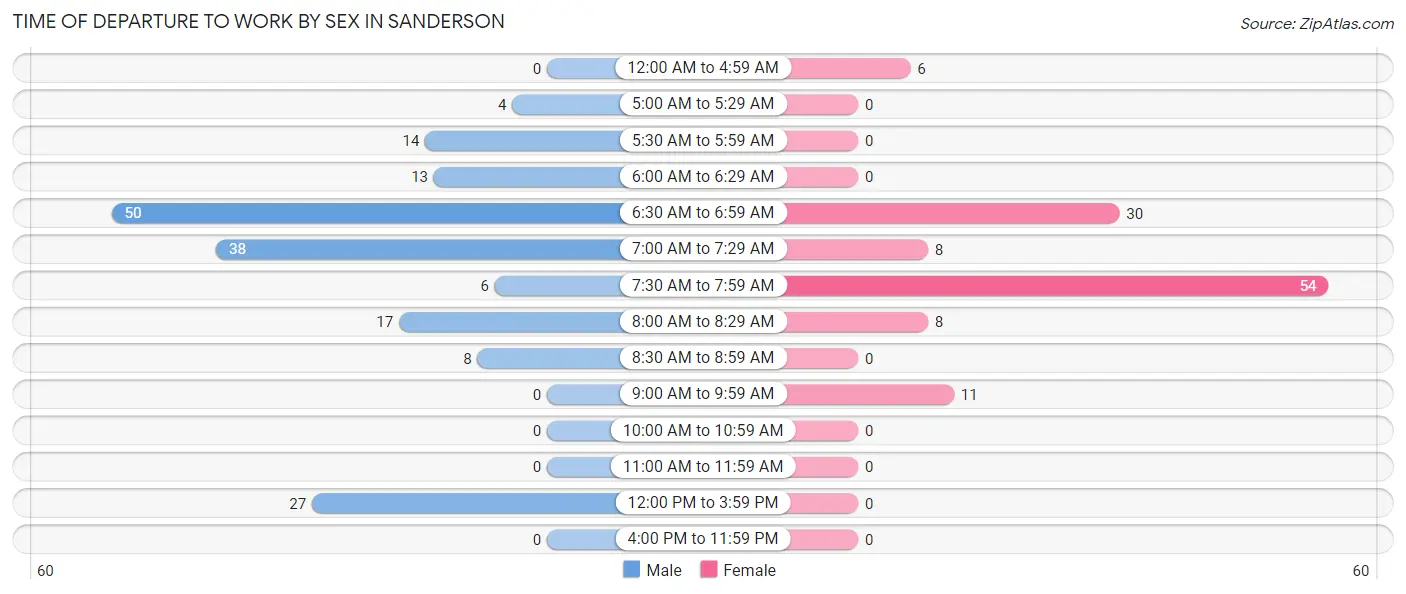
| Time of Departure | Male | Female |
| 12:00 AM to 4:59 AM | 0 (0.0%) | 6 (5.1%) |
| 5:00 AM to 5:29 AM | 4 (2.3%) | 0 (0.0%) |
| 5:30 AM to 5:59 AM | 14 (7.9%) | 0 (0.0%) |
| 6:00 AM to 6:29 AM | 13 (7.3%) | 0 (0.0%) |
| 6:30 AM to 6:59 AM | 50 (28.2%) | 30 (25.6%) |
| 7:00 AM to 7:29 AM | 38 (21.5%) | 8 (6.8%) |
| 7:30 AM to 7:59 AM | 6 (3.4%) | 54 (46.2%) |
| 8:00 AM to 8:29 AM | 17 (9.6%) | 8 (6.8%) |
| 8:30 AM to 8:59 AM | 8 (4.5%) | 0 (0.0%) |
| 9:00 AM to 9:59 AM | 0 (0.0%) | 11 (9.4%) |
| 10:00 AM to 10:59 AM | 0 (0.0%) | 0 (0.0%) |
| 11:00 AM to 11:59 AM | 0 (0.0%) | 0 (0.0%) |
| 12:00 PM to 3:59 PM | 27 (15.2%) | 0 (0.0%) |
| 4:00 PM to 11:59 PM | 0 (0.0%) | 0 (0.0%) |
| Total | 177 (100.0%) | 117 (100.0%) |
Housing Occupancy in Sanderson
Occupancy by Ownership in Sanderson
Of the total 353 dwellings in Sanderson, owner-occupied units account for 319 (90.4%), while renter-occupied units make up 34 (9.6%).
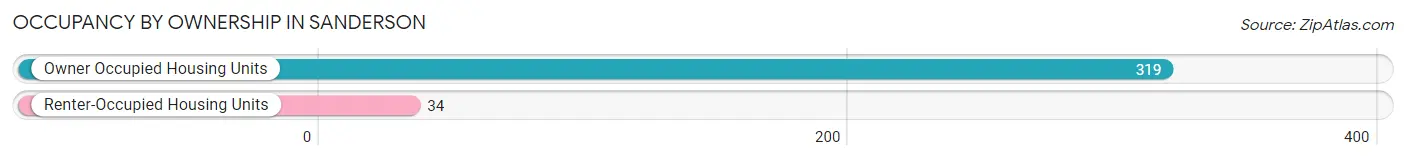
| Occupancy | # Housing Units | % Housing Units |
| Owner Occupied Housing Units | 319 | 90.4% |
| Renter-Occupied Housing Units | 34 | 9.6% |
| Total Occupied Housing Units | 353 | 100.0% |
Occupancy by Household Size in Sanderson
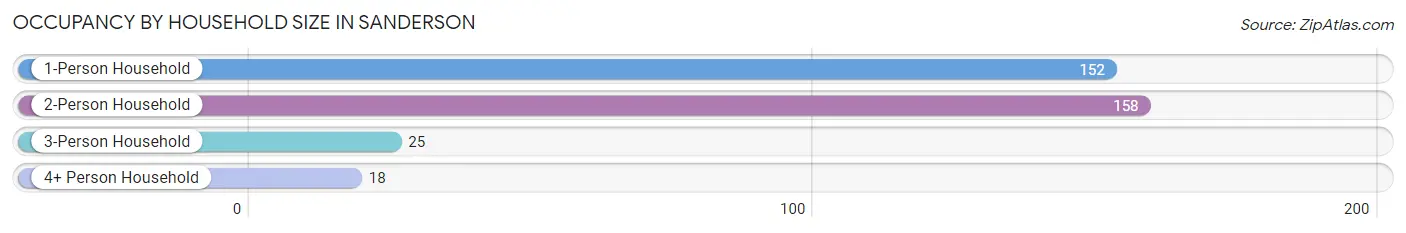
| Household Size | # Housing Units | % Housing Units |
| 1-Person Household | 152 | 43.1% |
| 2-Person Household | 158 | 44.8% |
| 3-Person Household | 25 | 7.1% |
| 4+ Person Household | 18 | 5.1% |
| Total Housing Units | 353 | 100.0% |
Occupancy by Ownership by Household Size in Sanderson
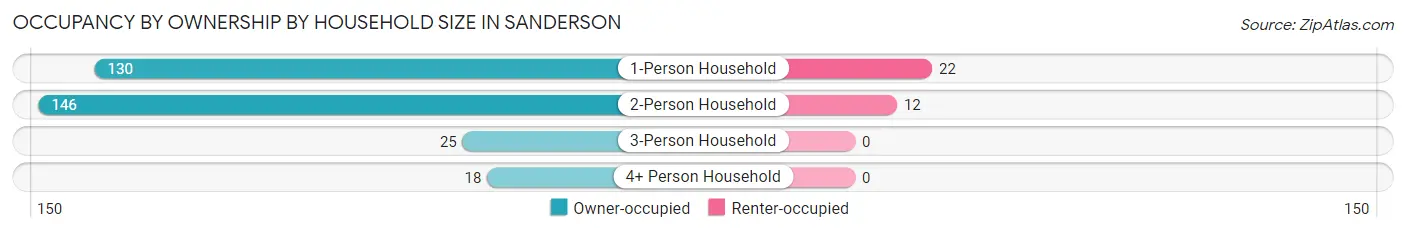
| Household Size | Owner-occupied | Renter-occupied |
| 1-Person Household | 130 (85.5%) | 22 (14.5%) |
| 2-Person Household | 146 (92.4%) | 12 (7.6%) |
| 3-Person Household | 25 (100.0%) | 0 (0.0%) |
| 4+ Person Household | 18 (100.0%) | 0 (0.0%) |
| Total Housing Units | 319 (90.4%) | 34 (9.6%) |
Occupancy by Educational Attainment in Sanderson
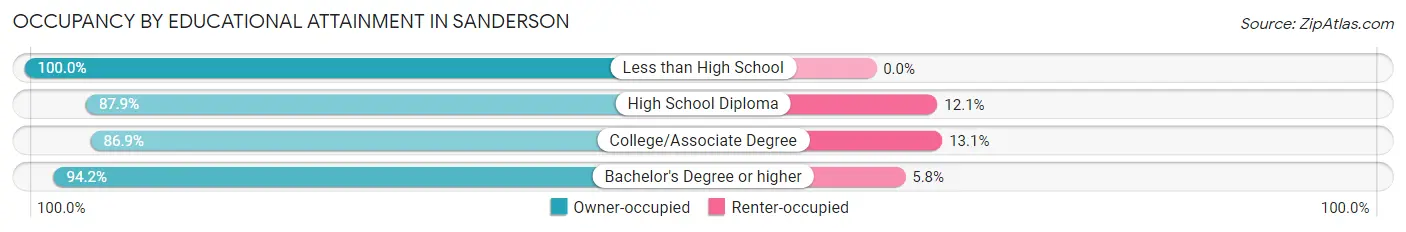
| Household Size | Owner-occupied | Renter-occupied |
| Less than High School | 25 (100.0%) | 0 (0.0%) |
| High School Diploma | 123 (87.9%) | 17 (12.1%) |
| College/Associate Degree | 73 (86.9%) | 11 (13.1%) |
| Bachelor's Degree or higher | 98 (94.2%) | 6 (5.8%) |
Occupancy by Age of Householder in Sanderson
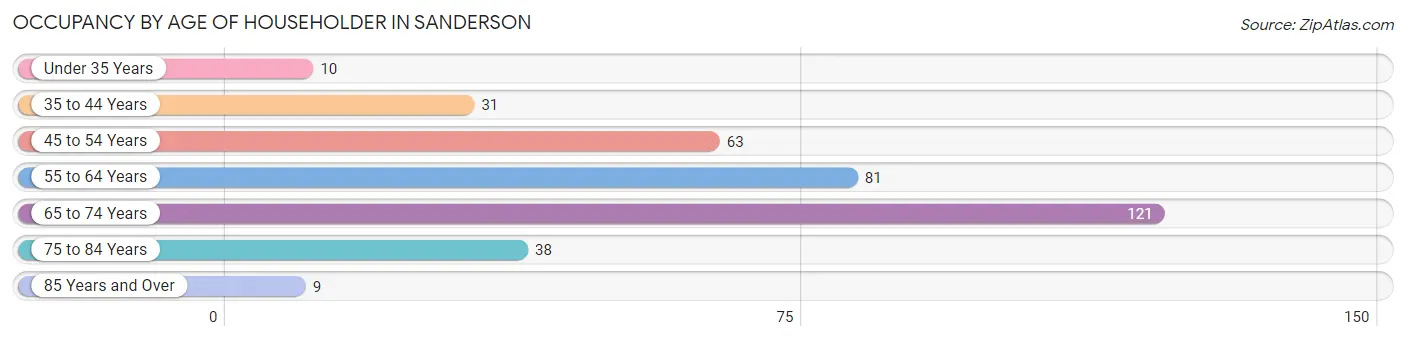
| Age Bracket | # Households | % Households |
| Under 35 Years | 10 | 2.8% |
| 35 to 44 Years | 31 | 8.8% |
| 45 to 54 Years | 63 | 17.8% |
| 55 to 64 Years | 81 | 23.0% |
| 65 to 74 Years | 121 | 34.3% |
| 75 to 84 Years | 38 | 10.8% |
| 85 Years and Over | 9 | 2.5% |
| Total | 353 | 100.0% |
Housing Finances in Sanderson
Median Income by Occupancy in Sanderson
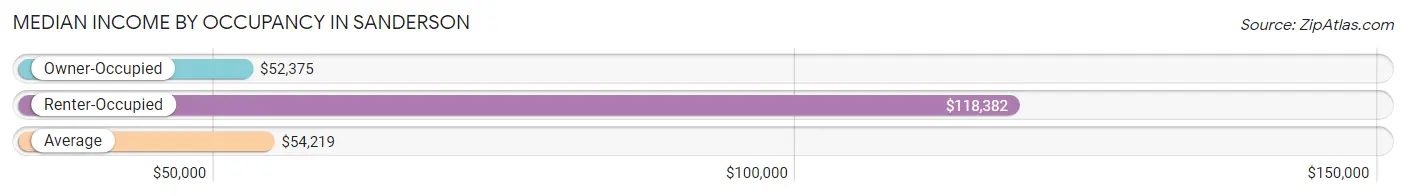
| Occupancy Type | # Households | Median Income |
| Owner-Occupied | 319 (90.4%) | $52,375 |
| Renter-Occupied | 34 (9.6%) | $118,382 |
| Average | 353 (100.0%) | $54,219 |
Occupancy by Householder Income Bracket in Sanderson
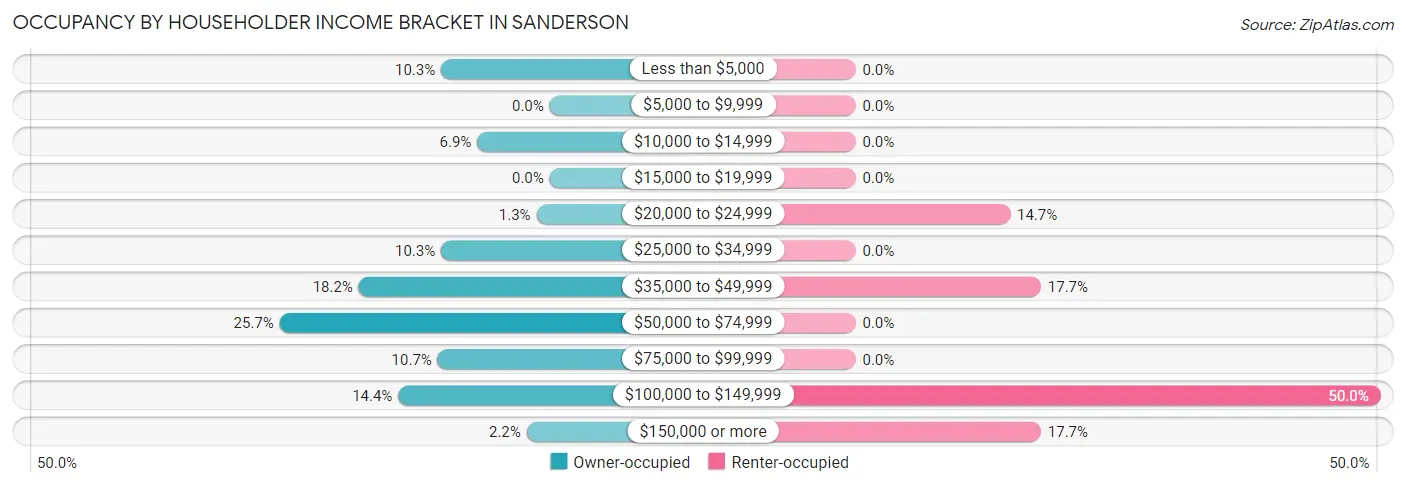
| Income Bracket | Owner-occupied | Renter-occupied |
| Less than $5,000 | 33 (10.3%) | 0 (0.0%) |
| $5,000 to $9,999 | 0 (0.0%) | 0 (0.0%) |
| $10,000 to $14,999 | 22 (6.9%) | 0 (0.0%) |
| $15,000 to $19,999 | 0 (0.0%) | 0 (0.0%) |
| $20,000 to $24,999 | 4 (1.3%) | 5 (14.7%) |
| $25,000 to $34,999 | 33 (10.3%) | 0 (0.0%) |
| $35,000 to $49,999 | 58 (18.2%) | 6 (17.6%) |
| $50,000 to $74,999 | 82 (25.7%) | 0 (0.0%) |
| $75,000 to $99,999 | 34 (10.7%) | 0 (0.0%) |
| $100,000 to $149,999 | 46 (14.4%) | 17 (50.0%) |
| $150,000 or more | 7 (2.2%) | 6 (17.6%) |
| Total | 319 (100.0%) | 34 (100.0%) |
Monthly Housing Cost Tiers in Sanderson
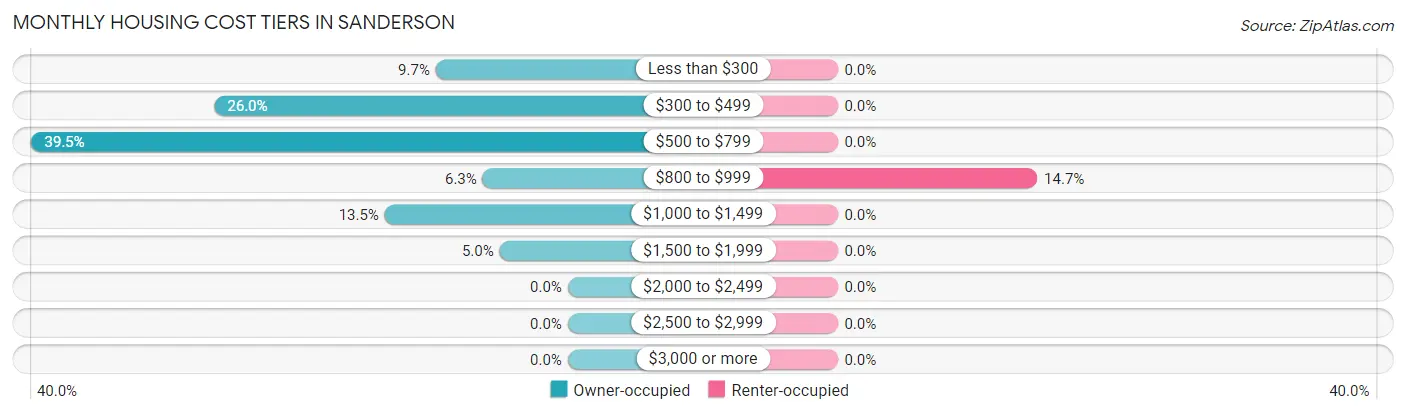
| Monthly Cost | Owner-occupied | Renter-occupied |
| Less than $300 | 31 (9.7%) | 0 (0.0%) |
| $300 to $499 | 83 (26.0%) | 0 (0.0%) |
| $500 to $799 | 126 (39.5%) | 0 (0.0%) |
| $800 to $999 | 20 (6.3%) | 5 (14.7%) |
| $1,000 to $1,499 | 43 (13.5%) | 0 (0.0%) |
| $1,500 to $1,999 | 16 (5.0%) | 0 (0.0%) |
| $2,000 to $2,499 | 0 (0.0%) | 0 (0.0%) |
| $2,500 to $2,999 | 0 (0.0%) | 0 (0.0%) |
| $3,000 or more | 0 (0.0%) | 0 (0.0%) |
| Total | 319 (100.0%) | 34 (100.0%) |
Physical Housing Characteristics in Sanderson
Housing Structures in Sanderson
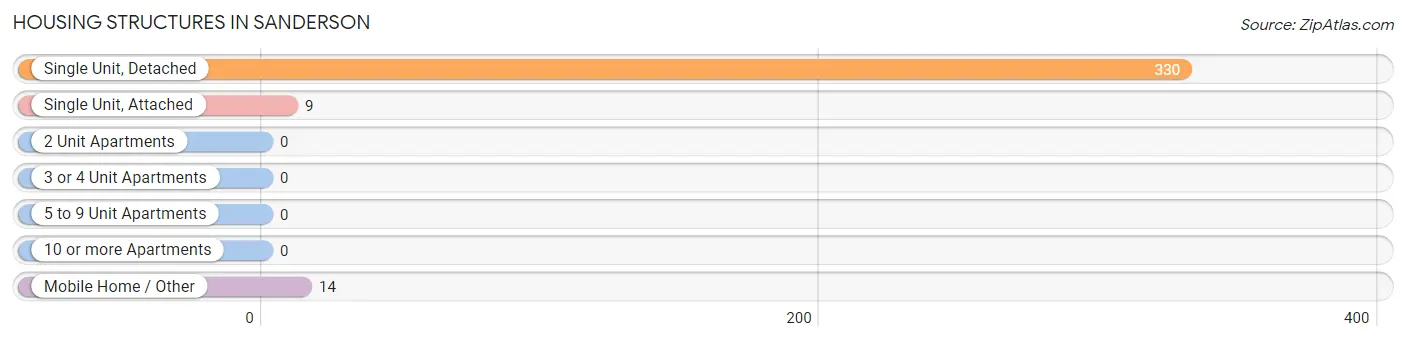
| Structure Type | # Housing Units | % Housing Units |
| Single Unit, Detached | 330 | 93.5% |
| Single Unit, Attached | 9 | 2.5% |
| 2 Unit Apartments | 0 | 0.0% |
| 3 or 4 Unit Apartments | 0 | 0.0% |
| 5 to 9 Unit Apartments | 0 | 0.0% |
| 10 or more Apartments | 0 | 0.0% |
| Mobile Home / Other | 14 | 4.0% |
| Total | 353 | 100.0% |
Housing Structures by Occupancy in Sanderson
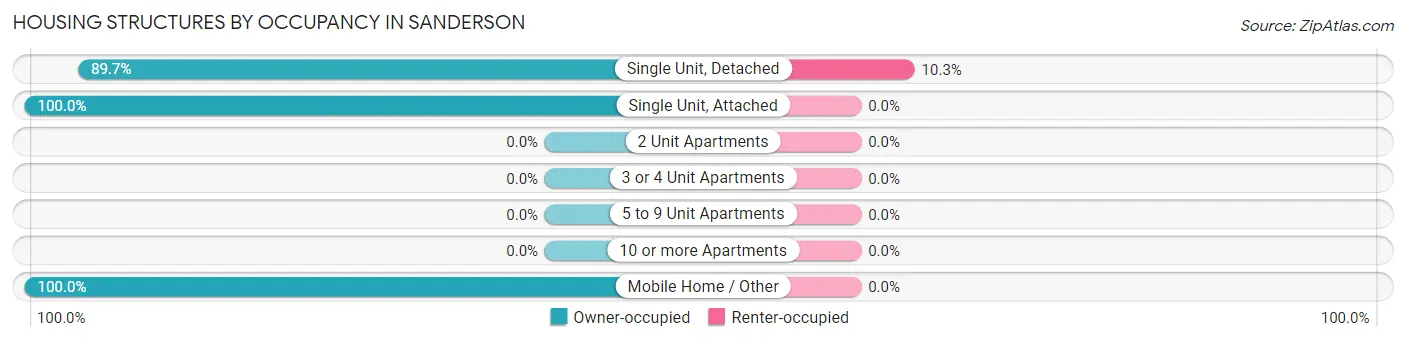
| Structure Type | Owner-occupied | Renter-occupied |
| Single Unit, Detached | 296 (89.7%) | 34 (10.3%) |
| Single Unit, Attached | 9 (100.0%) | 0 (0.0%) |
| 2 Unit Apartments | 0 (0.0%) | 0 (0.0%) |
| 3 or 4 Unit Apartments | 0 (0.0%) | 0 (0.0%) |
| 5 to 9 Unit Apartments | 0 (0.0%) | 0 (0.0%) |
| 10 or more Apartments | 0 (0.0%) | 0 (0.0%) |
| Mobile Home / Other | 14 (100.0%) | 0 (0.0%) |
| Total | 319 (90.4%) | 34 (9.6%) |
Housing Structures by Number of Rooms in Sanderson
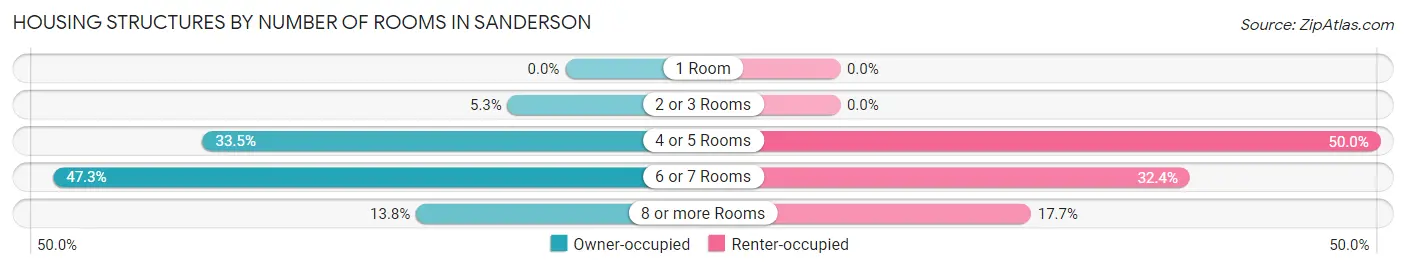
| Number of Rooms | Owner-occupied | Renter-occupied |
| 1 Room | 0 (0.0%) | 0 (0.0%) |
| 2 or 3 Rooms | 17 (5.3%) | 0 (0.0%) |
| 4 or 5 Rooms | 107 (33.5%) | 17 (50.0%) |
| 6 or 7 Rooms | 151 (47.3%) | 11 (32.4%) |
| 8 or more Rooms | 44 (13.8%) | 6 (17.6%) |
| Total | 319 (100.0%) | 34 (100.0%) |
Housing Structure by Heating Type in Sanderson
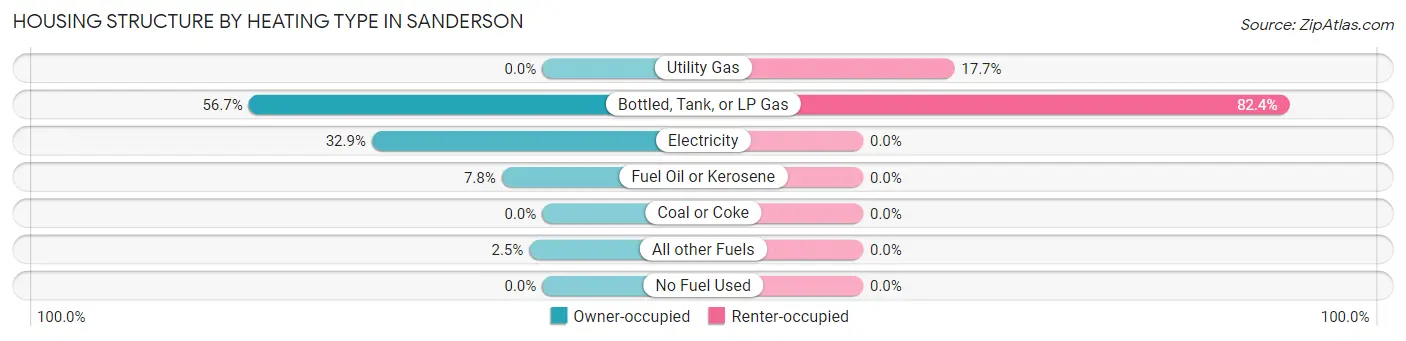
| Heating Type | Owner-occupied | Renter-occupied |
| Utility Gas | 0 (0.0%) | 6 (17.6%) |
| Bottled, Tank, or LP Gas | 181 (56.7%) | 28 (82.4%) |
| Electricity | 105 (32.9%) | 0 (0.0%) |
| Fuel Oil or Kerosene | 25 (7.8%) | 0 (0.0%) |
| Coal or Coke | 0 (0.0%) | 0 (0.0%) |
| All other Fuels | 8 (2.5%) | 0 (0.0%) |
| No Fuel Used | 0 (0.0%) | 0 (0.0%) |
| Total | 319 (100.0%) | 34 (100.0%) |
Household Vehicle Usage in Sanderson
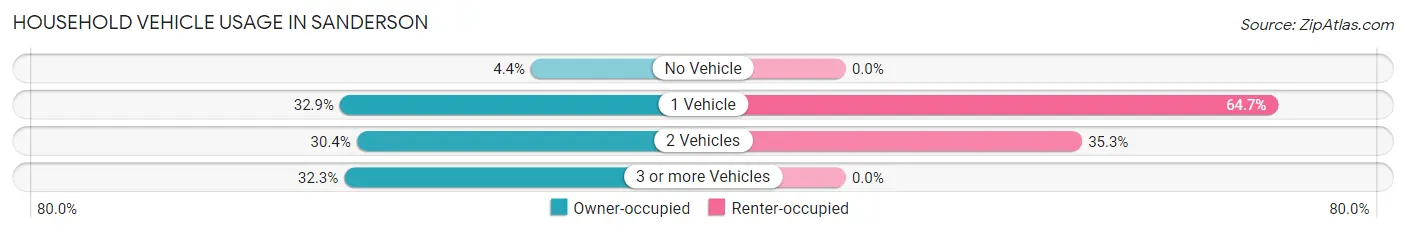
| Vehicles per Household | Owner-occupied | Renter-occupied |
| No Vehicle | 14 (4.4%) | 0 (0.0%) |
| 1 Vehicle | 105 (32.9%) | 22 (64.7%) |
| 2 Vehicles | 97 (30.4%) | 12 (35.3%) |
| 3 or more Vehicles | 103 (32.3%) | 0 (0.0%) |
| Total | 319 (100.0%) | 34 (100.0%) |
Real Estate & Mortgages in Sanderson
Real Estate and Mortgage Overview in Sanderson
| Characteristic | Without Mortgage | With Mortgage |
| Housing Units | 240 | 79 |
| Median Property Value | $101,300 | $112,500 |
| Median Household Income | $50,750 | $7 |
| Monthly Housing Costs | $506 | $0 |
| Real Estate Taxes | $940 | $5 |
Property Value by Mortgage Status in Sanderson
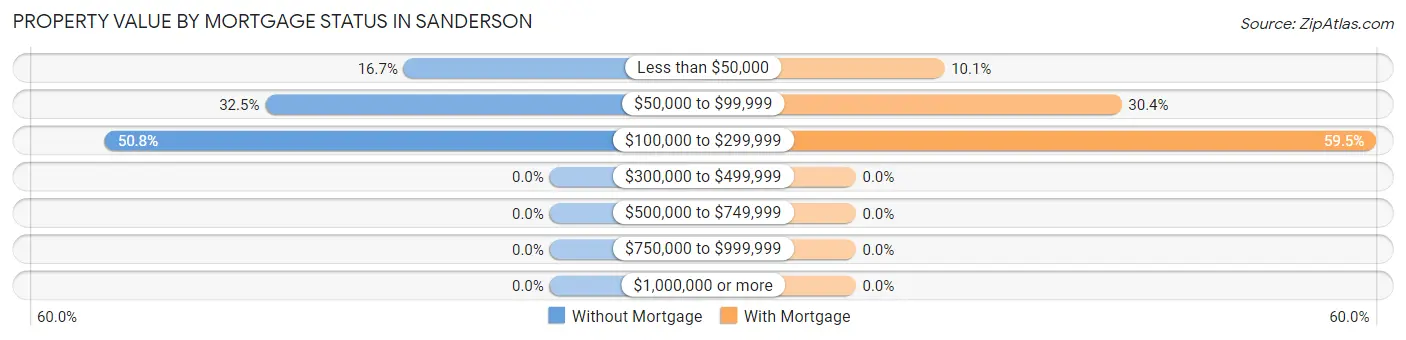
| Property Value | Without Mortgage | With Mortgage |
| Less than $50,000 | 40 (16.7%) | 8 (10.1%) |
| $50,000 to $99,999 | 78 (32.5%) | 24 (30.4%) |
| $100,000 to $299,999 | 122 (50.8%) | 47 (59.5%) |
| $300,000 to $499,999 | 0 (0.0%) | 0 (0.0%) |
| $500,000 to $749,999 | 0 (0.0%) | 0 (0.0%) |
| $750,000 to $999,999 | 0 (0.0%) | 0 (0.0%) |
| $1,000,000 or more | 0 (0.0%) | 0 (0.0%) |
| Total | 240 (100.0%) | 79 (100.0%) |
Household Income by Mortgage Status in Sanderson
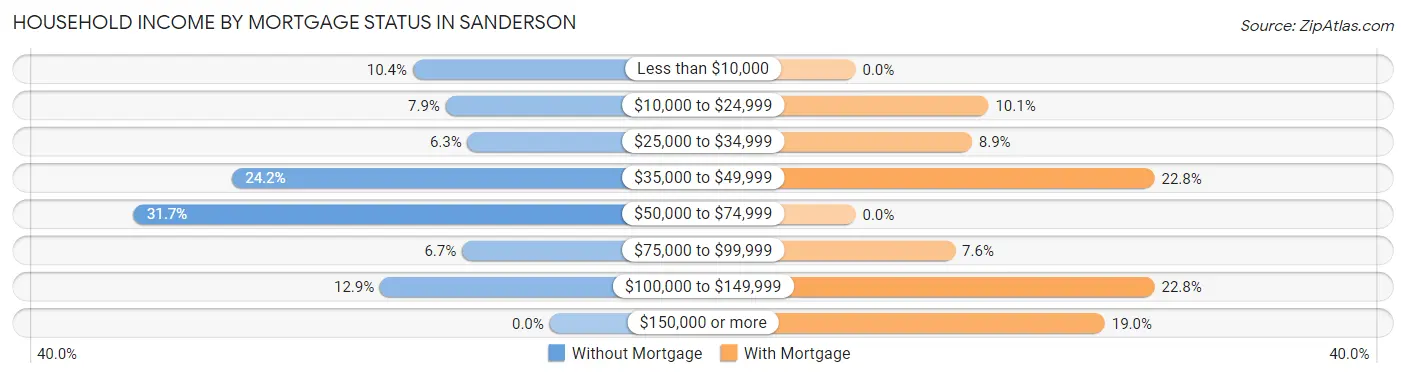
| Household Income | Without Mortgage | With Mortgage |
| Less than $10,000 | 25 (10.4%) | 0 (0.0%) |
| $10,000 to $24,999 | 19 (7.9%) | 8 (10.1%) |
| $25,000 to $34,999 | 15 (6.2%) | 7 (8.9%) |
| $35,000 to $49,999 | 58 (24.2%) | 18 (22.8%) |
| $50,000 to $74,999 | 76 (31.7%) | 0 (0.0%) |
| $75,000 to $99,999 | 16 (6.7%) | 6 (7.6%) |
| $100,000 to $149,999 | 31 (12.9%) | 18 (22.8%) |
| $150,000 or more | 0 (0.0%) | 15 (19.0%) |
| Total | 240 (100.0%) | 79 (100.0%) |
Property Value to Household Income Ratio in Sanderson
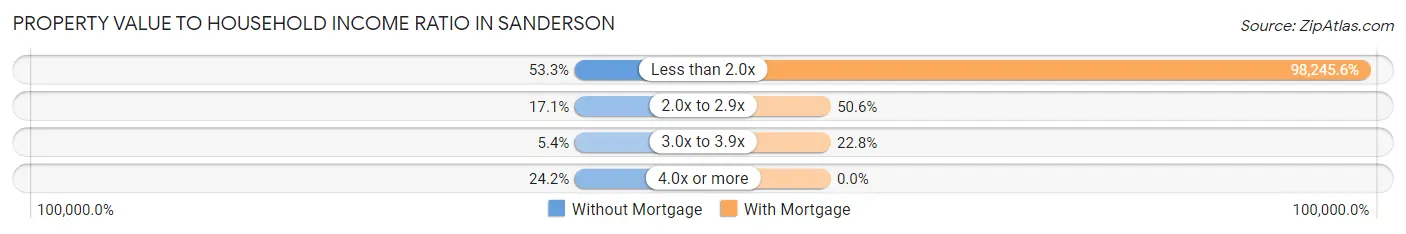
| Value-to-Income Ratio | Without Mortgage | With Mortgage |
| Less than 2.0x | 128 (53.3%) | 77,614 (98,245.6%) |
| 2.0x to 2.9x | 41 (17.1%) | 40 (50.6%) |
| 3.0x to 3.9x | 13 (5.4%) | 18 (22.8%) |
| 4.0x or more | 58 (24.2%) | 0 (0.0%) |
| Total | 240 (100.0%) | 79 (100.0%) |
Real Estate Taxes by Mortgage Status in Sanderson

| Property Taxes | Without Mortgage | With Mortgage |
| Less than $800 | 109 (45.4%) | 0 (0.0%) |
| $800 to $1,499 | 64 (26.7%) | 30 (38.0%) |
| $800 to $1,499 | 59 (24.6%) | 11 (13.9%) |
| Total | 240 (100.0%) | 79 (100.0%) |
Health & Disability in Sanderson
Health Insurance Coverage by Age in Sanderson
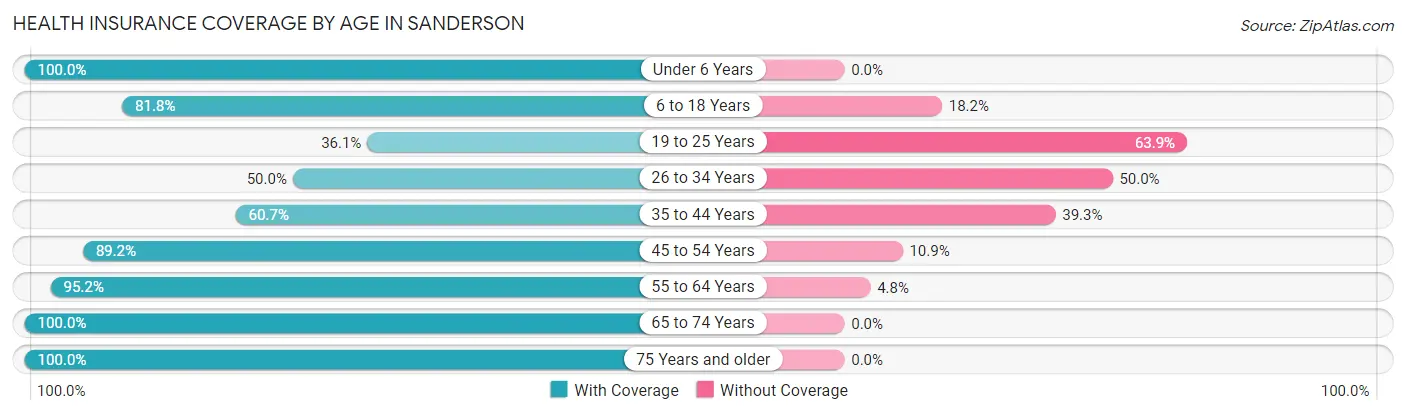
| Age Bracket | With Coverage | Without Coverage |
| Under 6 Years | 28 (100.0%) | 0 (0.0%) |
| 6 to 18 Years | 54 (81.8%) | 12 (18.2%) |
| 19 to 25 Years | 13 (36.1%) | 23 (63.9%) |
| 26 to 34 Years | 5 (50.0%) | 5 (50.0%) |
| 35 to 44 Years | 37 (60.7%) | 24 (39.3%) |
| 45 to 54 Years | 115 (89.1%) | 14 (10.8%) |
| 55 to 64 Years | 177 (95.2%) | 9 (4.8%) |
| 65 to 74 Years | 162 (100.0%) | 0 (0.0%) |
| 75 Years and older | 62 (100.0%) | 0 (0.0%) |
| Total | 653 (88.2%) | 87 (11.8%) |
Health Insurance Coverage by Citizenship Status in Sanderson
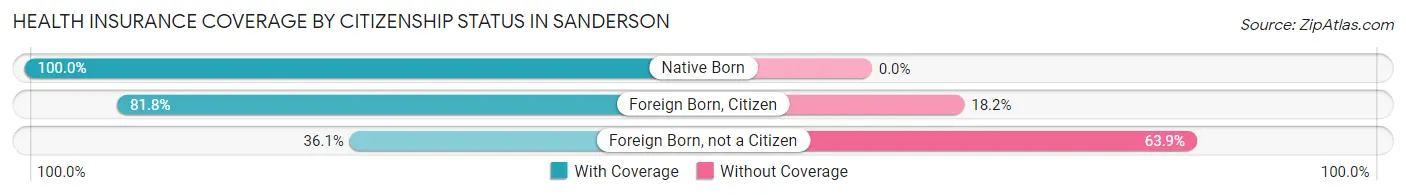
| Citizenship Status | With Coverage | Without Coverage |
| Native Born | 28 (100.0%) | 0 (0.0%) |
| Foreign Born, Citizen | 54 (81.8%) | 12 (18.2%) |
| Foreign Born, not a Citizen | 13 (36.1%) | 23 (63.9%) |
Health Insurance Coverage by Household Income in Sanderson
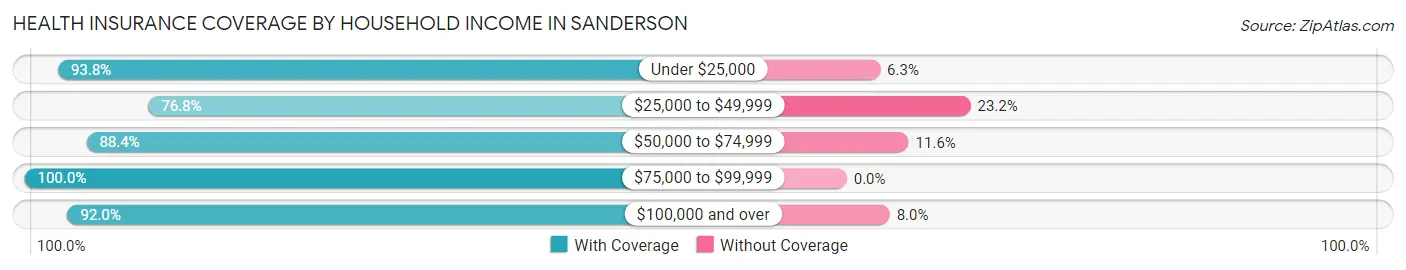
| Household Income | With Coverage | Without Coverage |
| Under $25,000 | 60 (93.8%) | 4 (6.2%) |
| $25,000 to $49,999 | 159 (76.8%) | 48 (23.2%) |
| $50,000 to $74,999 | 145 (88.4%) | 19 (11.6%) |
| $75,000 to $99,999 | 106 (100.0%) | 0 (0.0%) |
| $100,000 and over | 183 (92.0%) | 16 (8.0%) |
Public vs Private Health Insurance Coverage by Age in Sanderson
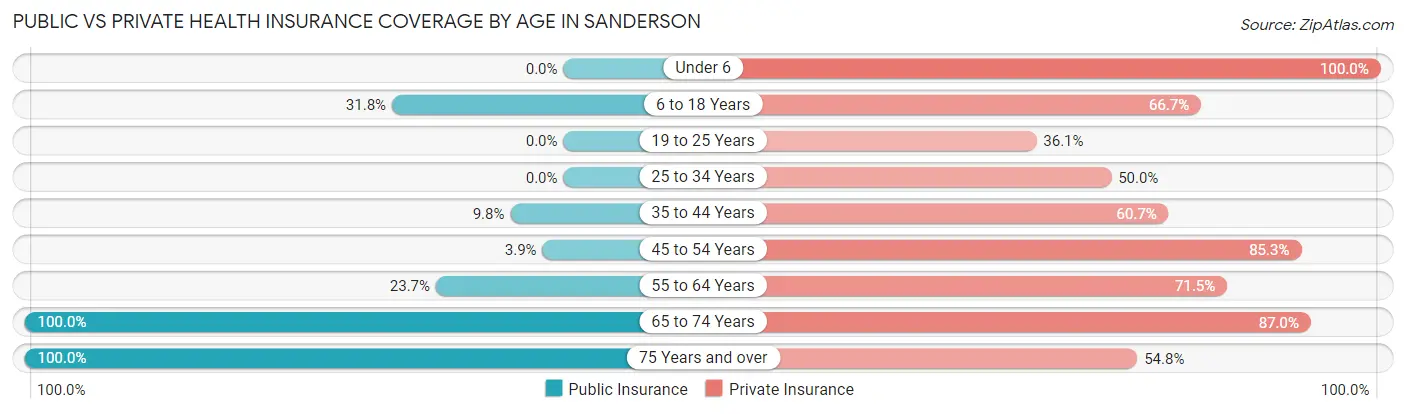
| Age Bracket | Public Insurance | Private Insurance |
| Under 6 | 0 (0.0%) | 28 (100.0%) |
| 6 to 18 Years | 21 (31.8%) | 44 (66.7%) |
| 19 to 25 Years | 0 (0.0%) | 13 (36.1%) |
| 25 to 34 Years | 0 (0.0%) | 5 (50.0%) |
| 35 to 44 Years | 6 (9.8%) | 37 (60.7%) |
| 45 to 54 Years | 5 (3.9%) | 110 (85.3%) |
| 55 to 64 Years | 44 (23.7%) | 133 (71.5%) |
| 65 to 74 Years | 162 (100.0%) | 141 (87.0%) |
| 75 Years and over | 62 (100.0%) | 34 (54.8%) |
| Total | 300 (40.5%) | 545 (73.7%) |
Disability Status by Sex by Age in Sanderson
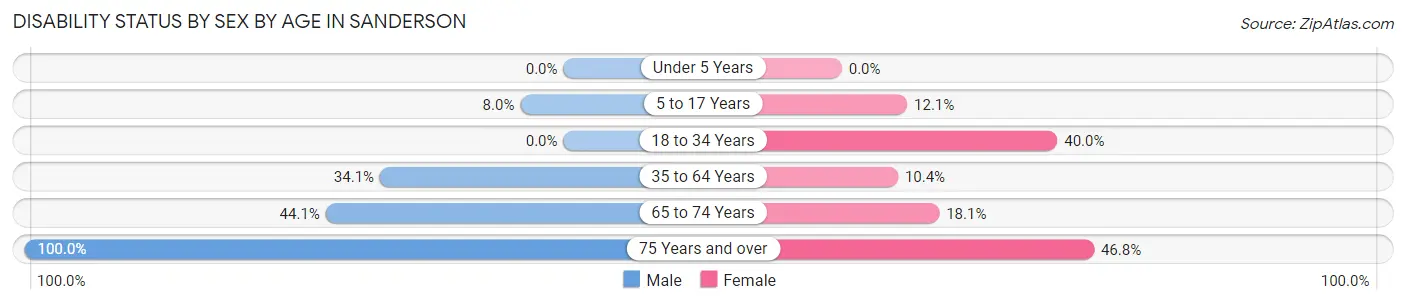
| Age Bracket | Male | Female |
| Under 5 Years | 0 (0.0%) | 0 (0.0%) |
| 5 to 17 Years | 4 (8.0%) | 4 (12.1%) |
| 18 to 34 Years | 0 (0.0%) | 2 (40.0%) |
| 35 to 64 Years | 79 (34.1%) | 15 (10.4%) |
| 65 to 74 Years | 30 (44.1%) | 17 (18.1%) |
| 75 Years and over | 15 (100.0%) | 22 (46.8%) |
Disability Class by Sex by Age in Sanderson
Disability Class: Hearing Difficulty
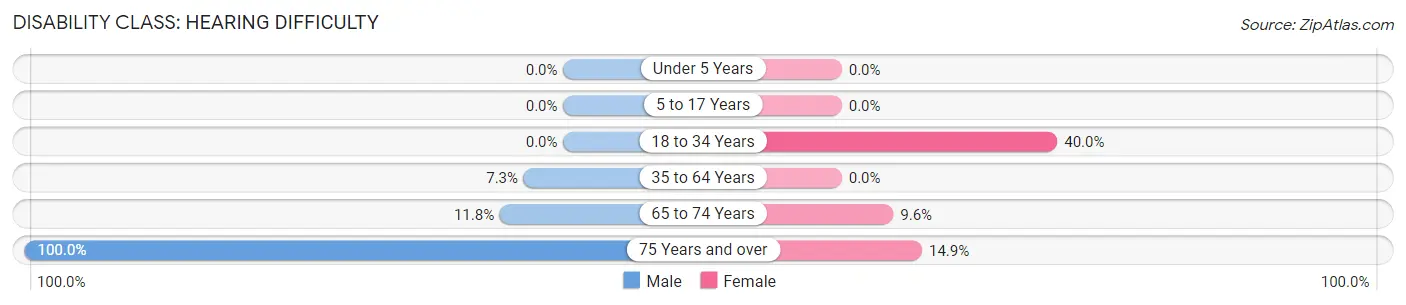
| Age Bracket | Male | Female |
| Under 5 Years | 0 (0.0%) | 0 (0.0%) |
| 5 to 17 Years | 0 (0.0%) | 0 (0.0%) |
| 18 to 34 Years | 0 (0.0%) | 2 (40.0%) |
| 35 to 64 Years | 17 (7.3%) | 0 (0.0%) |
| 65 to 74 Years | 8 (11.8%) | 9 (9.6%) |
| 75 Years and over | 15 (100.0%) | 7 (14.9%) |
Disability Class: Vision Difficulty
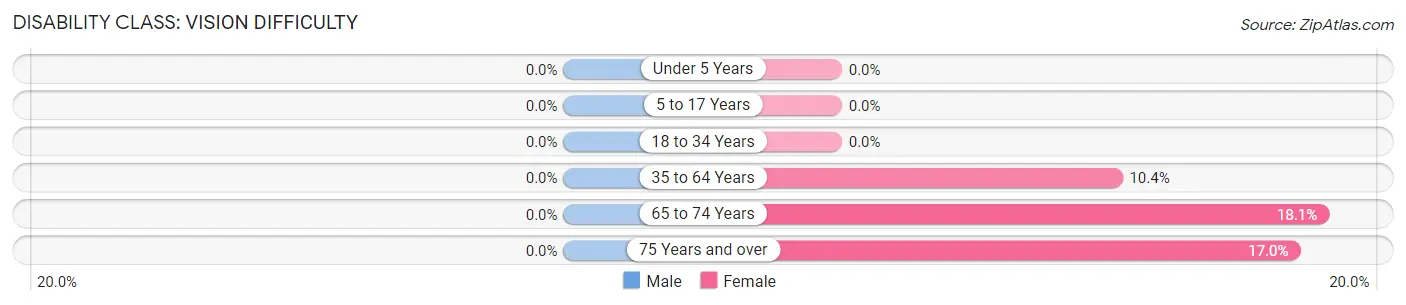
| Age Bracket | Male | Female |
| Under 5 Years | 0 (0.0%) | 0 (0.0%) |
| 5 to 17 Years | 0 (0.0%) | 0 (0.0%) |
| 18 to 34 Years | 0 (0.0%) | 0 (0.0%) |
| 35 to 64 Years | 0 (0.0%) | 15 (10.4%) |
| 65 to 74 Years | 0 (0.0%) | 17 (18.1%) |
| 75 Years and over | 0 (0.0%) | 8 (17.0%) |
Disability Class: Cognitive Difficulty
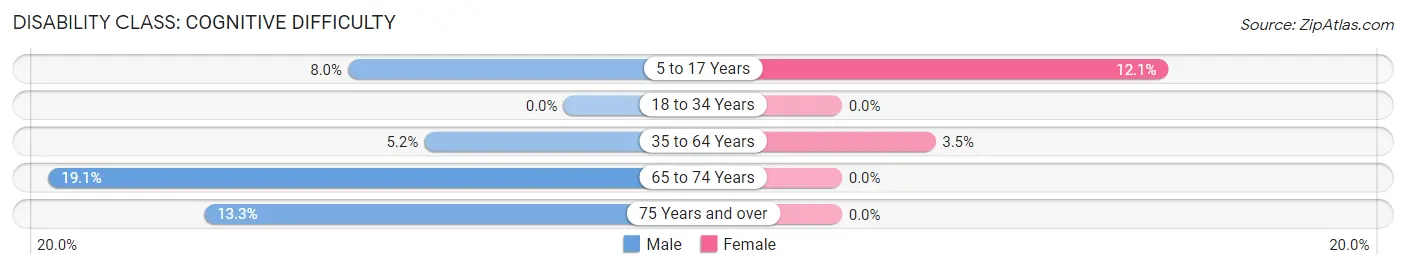
| Age Bracket | Male | Female |
| 5 to 17 Years | 4 (8.0%) | 4 (12.1%) |
| 18 to 34 Years | 0 (0.0%) | 0 (0.0%) |
| 35 to 64 Years | 12 (5.2%) | 5 (3.5%) |
| 65 to 74 Years | 13 (19.1%) | 0 (0.0%) |
| 75 Years and over | 2 (13.3%) | 0 (0.0%) |
Disability Class: Ambulatory Difficulty
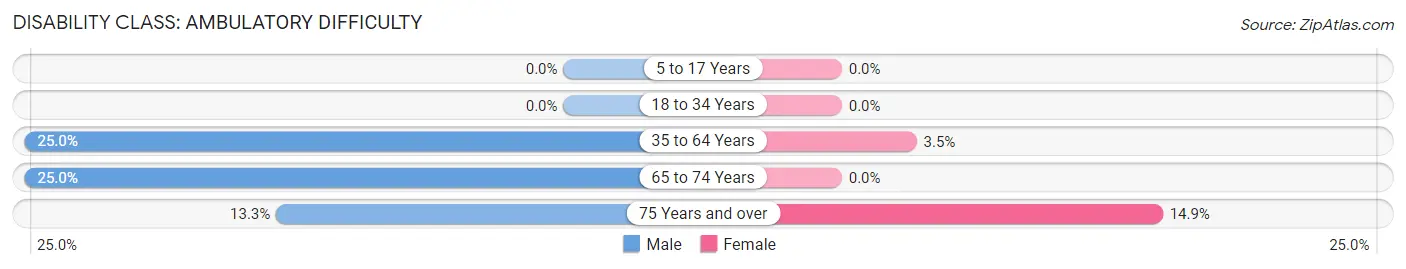
| Age Bracket | Male | Female |
| 5 to 17 Years | 0 (0.0%) | 0 (0.0%) |
| 18 to 34 Years | 0 (0.0%) | 0 (0.0%) |
| 35 to 64 Years | 58 (25.0%) | 5 (3.5%) |
| 65 to 74 Years | 17 (25.0%) | 0 (0.0%) |
| 75 Years and over | 2 (13.3%) | 7 (14.9%) |
Disability Class: Self-Care Difficulty
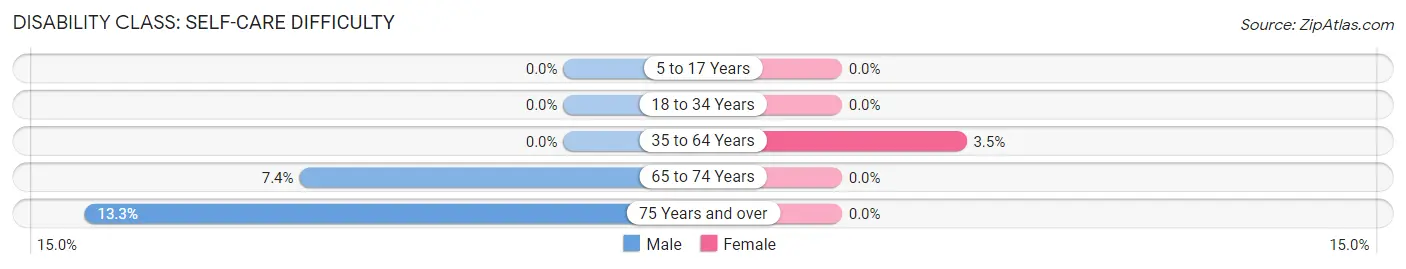
| Age Bracket | Male | Female |
| 5 to 17 Years | 0 (0.0%) | 0 (0.0%) |
| 18 to 34 Years | 0 (0.0%) | 0 (0.0%) |
| 35 to 64 Years | 0 (0.0%) | 5 (3.5%) |
| 65 to 74 Years | 5 (7.3%) | 0 (0.0%) |
| 75 Years and over | 2 (13.3%) | 0 (0.0%) |
Technology Access in Sanderson
Computing Device Access in Sanderson
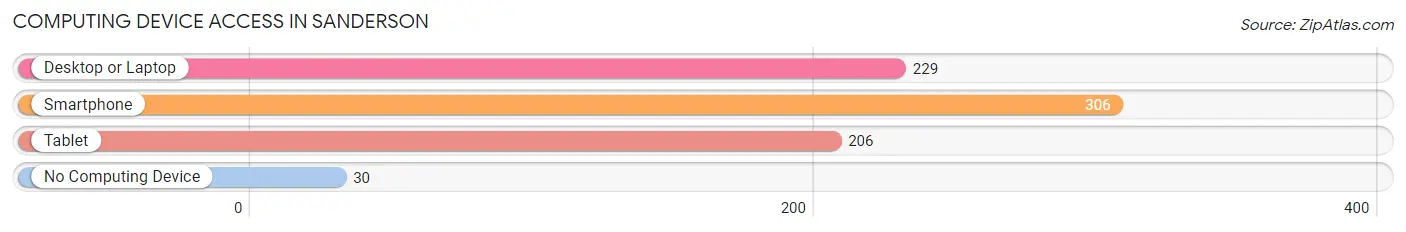
| Device Type | # Households | % Households |
| Desktop or Laptop | 229 | 64.9% |
| Smartphone | 306 | 86.7% |
| Tablet | 206 | 58.4% |
| No Computing Device | 30 | 8.5% |
| Total | 353 | 100.0% |
Internet Access in Sanderson
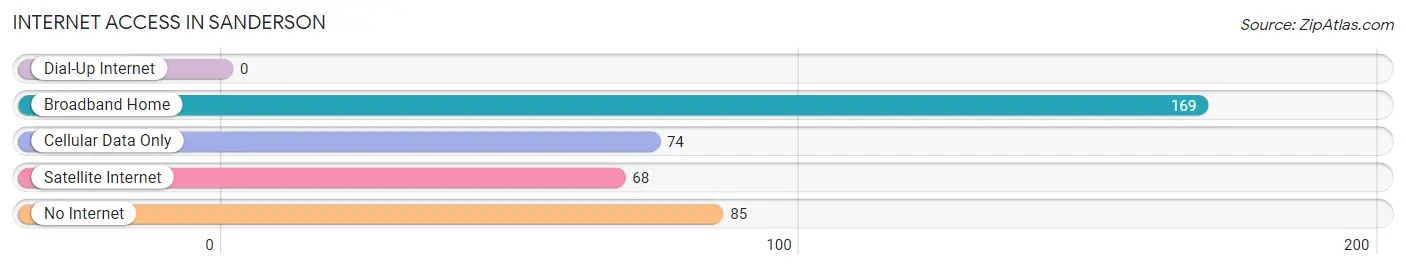
| Internet Type | # Households | % Households |
| Dial-Up Internet | 0 | 0.0% |
| Broadband Home | 169 | 47.9% |
| Cellular Data Only | 74 | 21.0% |
| Satellite Internet | 68 | 19.3% |
| No Internet | 85 | 24.1% |
| Total | 353 | 100.0% |
Sanderson Summary
Sanderson is a small town located in the western part of Texas, in the county of Terrell. It is situated on the banks of the Pecos River, about 100 miles south of the state capital, Austin. The town has a population of about 1,000 people, and is the county seat of Terrell County.
History
The area around Sanderson was first settled in the late 1800s by ranchers and farmers. The town was officially founded in 1891, when the Texas and Pacific Railway built a line through the area. The town was named after a local rancher, John Sanderson.
In the early 1900s, Sanderson became a center for the local cattle industry. The town was also home to several large ranches, including the famous Pitchfork Ranch. The town was also home to a number of businesses, including a bank, a hotel, and a general store.
In the 1920s, the town began to decline as the cattle industry moved away from the area. The Great Depression further hurt the town, and by the 1940s, the population had dropped to just over 500 people.
In the 1950s, the town began to experience a resurgence. The oil industry moved into the area, and the town became a center for oil production. The population of the town began to grow, and by the 1970s, the population had reached 1,000 people.
Geography
Sanderson is located in the western part of Texas, in the county of Terrell. It is situated on the banks of the Pecos River, about 100 miles south of the state capital, Austin. The town is located in a semi-arid region, and the climate is hot and dry. The average temperature in the summer is around 90 degrees Fahrenheit, and in the winter it is around 50 degrees Fahrenheit.
The town is surrounded by several small towns, including Dryden, Sheffield, and Langtry. The nearest major city is El Paso, which is about 200 miles away.
Economy
The economy of Sanderson is largely based on the oil industry. The town is home to several oil companies, and the oil industry is the main source of employment in the area. The town is also home to several small businesses, including restaurants, stores, and other services.
The town is also home to a number of tourist attractions, including the Pitchfork Ranch, which is a popular destination for visitors. The town is also home to a number of historic sites, including the old courthouse and the old jail.
Demographics
As of the 2010 census, the population of Sanderson was 1,000 people. The racial makeup of the town was 94.2% White, 0.7% African American, 0.2% Native American, 0.2% Asian, 0.1% Pacific Islander, and 4.7% from other races. The median household income was $30,000, and the median age was 37 years.
Conclusion
Sanderson is a small town located in the western part of Texas, in the county of Terrell. It is situated on the banks of the Pecos River, about 100 miles south of the state capital, Austin. The town has a population of about 1,000 people, and is the county seat of Terrell County. The economy of the town is largely based on the oil industry, and the town is also home to several tourist attractions. The population of the town is mostly White, with a small percentage of African American, Native American, Asian, and Pacific Islander residents.
Common Questions
What is Per Capita Income in Sanderson?
Per Capita income in Sanderson is $33,505.
What is the Median Family Income in Sanderson?
Median Family Income in Sanderson is $63,984.
What is the Median Household income in Sanderson?
Median Household Income in Sanderson is $54,219.
What is Income or Wage Gap in Sanderson?
Income or Wage Gap in Sanderson is 55.4%.
Women in Sanderson earn 44.6 cents for every dollar earned by a man.
What is Inequality or Gini Index in Sanderson?
Inequality or Gini Index in Sanderson is 0.38.
What is the Total Population of Sanderson?
Total Population of Sanderson is 740.
What is the Total Male Population of Sanderson?
Total Male Population of Sanderson is 411.
What is the Total Female Population of Sanderson?
Total Female Population of Sanderson is 329.
What is the Ratio of Males per 100 Females in Sanderson?
There are 124.92 Males per 100 Females in Sanderson.
What is the Ratio of Females per 100 Males in Sanderson?
There are 80.05 Females per 100 Males in Sanderson.
What is the Median Population Age in Sanderson?
Median Population Age in Sanderson is 57.3 Years.
What is the Average Family Size in Sanderson
Average Family Size in Sanderson is 2.9 People.
What is the Average Household Size in Sanderson
Average Household Size in Sanderson is 2.1 People.
How Large is the Labor Force in Sanderson?
There are 308 People in the Labor Forcein in Sanderson.
What is the Percentage of People in the Labor Force in Sanderson?
47.0% of People are in the Labor Force in Sanderson.