Zip Codes with the Highest Percentage of Families with Income Below $10,000 in Tennessee
RELATED REPORTS & OPTIONS
Family Income | $0-10k
Tennessee
Compare Zip Codes
Map of Zip Codes with the Highest Percentage of Families with Income Below $10,000 in Tennessee
0.0%
80.0%
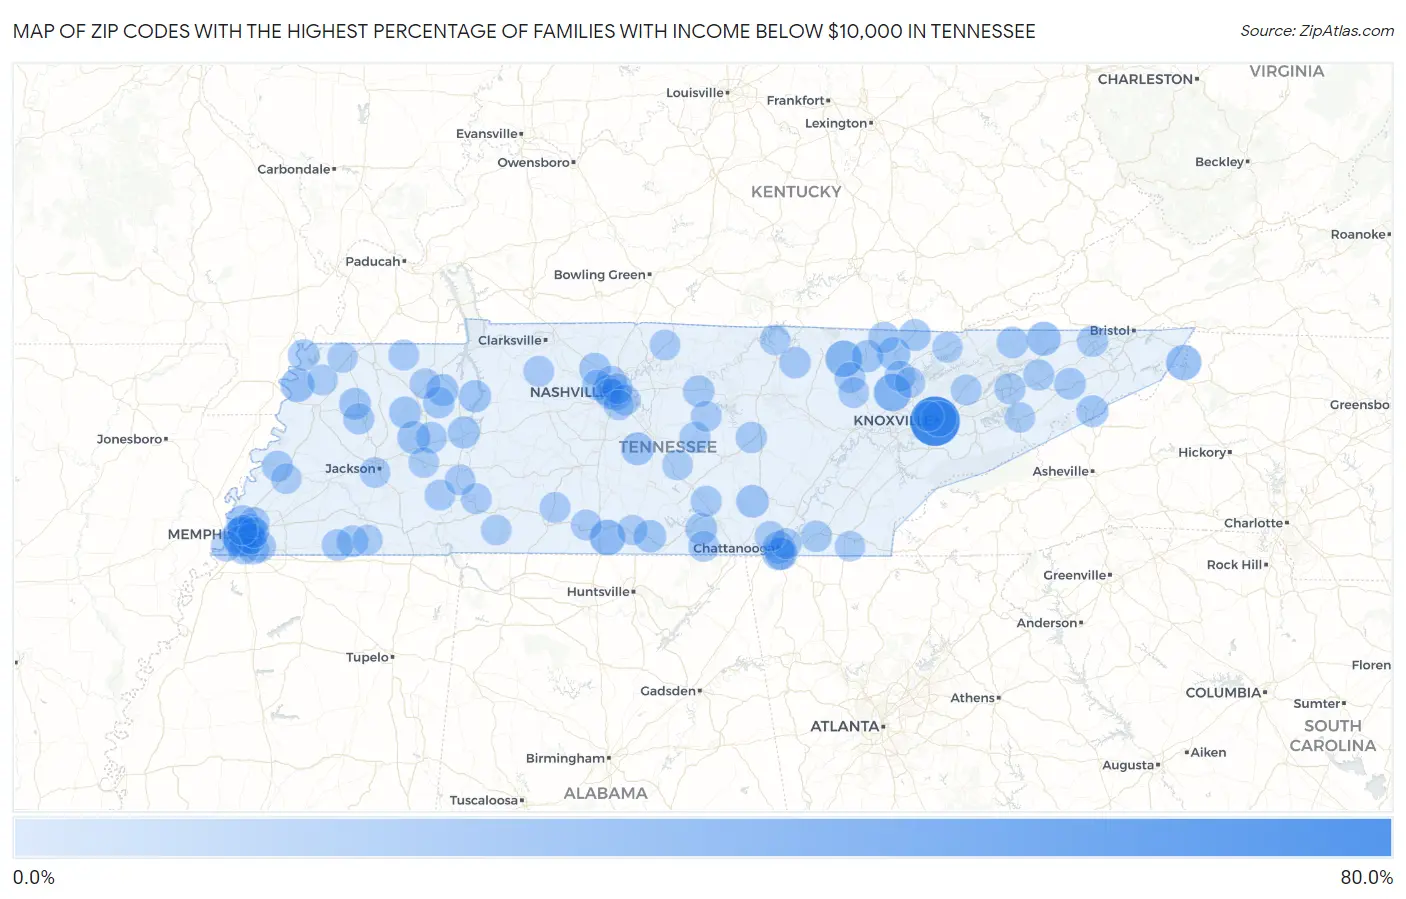
Zip Codes with the Highest Percentage of Families with Income Below $10,000 in Tennessee
| Zip Code | Families with Income < $10k | vs State | vs National | |
| 1. | 37916 | 63.1% | 3.5%(+59.6)#1 | 3.1%(+60.0)#36 |
| 2. | 37710 | 26.7% | 3.5%(+23.2)#2 | 3.1%(+23.6)#261 |
| 3. | 38504 | 24.2% | 3.5%(+20.7)#3 | 3.1%(+21.1)#325 |
| 4. | 38126 | 23.1% | 3.5%(+19.6)#4 | 3.1%(+20.0)#367 |
| 5. | 37915 | 22.2% | 3.5%(+18.7)#5 | 3.1%(+19.1)#395 |
| 6. | 38453 | 21.8% | 3.5%(+18.3)#6 | 3.1%(+18.7)#411 |
| 7. | 37691 | 20.8% | 3.5%(+17.3)#7 | 3.1%(+17.7)#444 |
| 8. | 38080 | 17.1% | 3.5%(+13.6)#8 | 3.1%(+14.0)#659 |
| 9. | 37731 | 17.1% | 3.5%(+13.6)#9 | 3.1%(+14.0)#662 |
| 10. | 37847 | 14.3% | 3.5%(+10.8)#10 | 3.1%(+11.2)#933 |
| 11. | 37410 | 13.9% | 3.5%(+10.4)#11 | 3.1%(+10.8)#985 |
| 12. | 38321 | 13.7% | 3.5%(+10.2)#12 | 3.1%(+10.6)#1,017 |
| 13. | 37153 | 13.5% | 3.5%(+10.00)#13 | 3.1%(+10.4)#1,046 |
| 14. | 37365 | 13.3% | 3.5%(+9.80)#14 | 3.1%(+10.2)#1,070 |
| 15. | 38112 | 13.2% | 3.5%(+9.70)#15 | 3.1%(+10.1)#1,088 |
| 16. | 38114 | 12.9% | 3.5%(+9.40)#16 | 3.1%(+9.80)#1,133 |
| 17. | 37402 | 12.8% | 3.5%(+9.30)#17 | 3.1%(+9.70)#1,158 |
| 18. | 37348 | 12.7% | 3.5%(+9.20)#18 | 3.1%(+9.60)#1,187 |
| 19. | 38333 | 12.2% | 3.5%(+8.70)#19 | 3.1%(+9.10)#1,294 |
| 20. | 37407 | 11.9% | 3.5%(+8.40)#20 | 3.1%(+8.80)#1,344 |
| 21. | 38108 | 11.8% | 3.5%(+8.30)#21 | 3.1%(+8.70)#1,370 |
| 22. | 38127 | 11.7% | 3.5%(+8.20)#22 | 3.1%(+8.60)#1,390 |
| 23. | 37755 | 11.7% | 3.5%(+8.20)#23 | 3.1%(+8.60)#1,400 |
| 24. | 38341 | 11.7% | 3.5%(+8.20)#24 | 3.1%(+8.60)#1,402 |
| 25. | 38105 | 11.6% | 3.5%(+8.10)#25 | 3.1%(+8.50)#1,418 |
| 26. | 38236 | 11.6% | 3.5%(+8.10)#26 | 3.1%(+8.50)#1,431 |
| 27. | 37657 | 11.3% | 3.5%(+7.80)#27 | 3.1%(+8.20)#1,518 |
| 28. | 38258 | 11.2% | 3.5%(+7.70)#28 | 3.1%(+8.10)#1,540 |
| 29. | 38330 | 11.1% | 3.5%(+7.60)#29 | 3.1%(+8.00)#1,563 |
| 30. | 37318 | 10.8% | 3.5%(+7.30)#30 | 3.1%(+7.70)#1,659 |
| 31. | 37080 | 10.7% | 3.5%(+7.20)#31 | 3.1%(+7.60)#1,681 |
| 32. | 37762 | 10.7% | 3.5%(+7.20)#32 | 3.1%(+7.60)#1,684 |
| 33. | 38115 | 10.4% | 3.5%(+6.90)#33 | 3.1%(+7.30)#1,774 |
| 34. | 38106 | 10.2% | 3.5%(+6.70)#34 | 3.1%(+7.10)#1,831 |
| 35. | 37616 | 10.2% | 3.5%(+6.70)#35 | 3.1%(+7.10)#1,841 |
| 36. | 38067 | 10.2% | 3.5%(+6.70)#36 | 3.1%(+7.10)#1,849 |
| 37. | 38342 | 10.2% | 3.5%(+6.70)#37 | 3.1%(+7.10)#1,850 |
| 38. | 38079 | 10.1% | 3.5%(+6.60)#38 | 3.1%(+7.00)#1,879 |
| 39. | 38543 | 10.1% | 3.5%(+6.60)#39 | 3.1%(+7.00)#1,899 |
| 40. | 37869 | 9.9% | 3.5%(+6.40)#40 | 3.1%(+6.80)#1,960 |
| 41. | 38547 | 9.9% | 3.5%(+6.40)#41 | 3.1%(+6.80)#1,969 |
| 42. | 38039 | 9.8% | 3.5%(+6.30)#42 | 3.1%(+6.70)#2,009 |
| 43. | 38118 | 9.7% | 3.5%(+6.20)#43 | 3.1%(+6.60)#2,029 |
| 44. | 38390 | 9.7% | 3.5%(+6.20)#44 | 3.1%(+6.60)#2,055 |
| 45. | 37353 | 9.5% | 3.5%(+6.00)#45 | 3.1%(+6.40)#2,119 |
| 46. | 37660 | 9.3% | 3.5%(+5.80)#46 | 3.1%(+6.20)#2,189 |
| 47. | 38579 | 9.3% | 3.5%(+5.80)#47 | 3.1%(+6.20)#2,219 |
| 48. | 38116 | 9.2% | 3.5%(+5.70)#48 | 3.1%(+6.10)#2,242 |
| 49. | 37190 | 9.1% | 3.5%(+5.60)#49 | 3.1%(+6.00)#2,306 |
| 50. | 37813 | 9.0% | 3.5%(+5.50)#50 | 3.1%(+5.90)#2,362 |
| 51. | 37892 | 9.0% | 3.5%(+5.50)#51 | 3.1%(+5.90)#2,383 |
| 52. | 37210 | 8.9% | 3.5%(+5.40)#52 | 3.1%(+5.80)#2,408 |
| 53. | 38382 | 8.9% | 3.5%(+5.40)#53 | 3.1%(+5.80)#2,413 |
| 54. | 38128 | 8.7% | 3.5%(+5.20)#54 | 3.1%(+5.60)#2,502 |
| 55. | 38111 | 8.7% | 3.5%(+5.20)#55 | 3.1%(+5.60)#2,503 |
| 56. | 37207 | 8.7% | 3.5%(+5.20)#56 | 3.1%(+5.60)#2,505 |
| 57. | 37711 | 8.6% | 3.5%(+5.10)#57 | 3.1%(+5.50)#2,576 |
| 58. | 37714 | 8.6% | 3.5%(+5.10)#58 | 3.1%(+5.50)#2,580 |
| 59. | 38122 | 8.5% | 3.5%(+5.00)#59 | 3.1%(+5.40)#2,631 |
| 60. | 38041 | 8.5% | 3.5%(+5.00)#60 | 3.1%(+5.40)#2,651 |
| 61. | 37342 | 8.5% | 3.5%(+5.00)#61 | 3.1%(+5.40)#2,655 |
| 62. | 37208 | 8.4% | 3.5%(+4.90)#62 | 3.1%(+5.30)#2,718 |
| 63. | 37376 | 8.3% | 3.5%(+4.80)#63 | 3.1%(+5.20)#2,822 |
| 64. | 37218 | 8.2% | 3.5%(+4.70)#64 | 3.1%(+5.10)#2,853 |
| 65. | 37051 | 8.2% | 3.5%(+4.70)#65 | 3.1%(+5.10)#2,863 |
| 66. | 37709 | 8.2% | 3.5%(+4.70)#66 | 3.1%(+5.10)#2,864 |
| 67. | 38478 | 8.1% | 3.5%(+4.60)#67 | 3.1%(+5.00)#2,908 |
| 68. | 37406 | 8.1% | 3.5%(+4.60)#68 | 3.1%(+5.00)#2,913 |
| 69. | 38425 | 8.1% | 3.5%(+4.60)#69 | 3.1%(+5.00)#2,921 |
| 70. | 37872 | 8.1% | 3.5%(+4.60)#70 | 3.1%(+5.00)#2,924 |
| 71. | 38240 | 8.1% | 3.5%(+4.60)#71 | 3.1%(+5.00)#2,926 |
| 72. | 38241 | 8.1% | 3.5%(+4.60)#72 | 3.1%(+5.00)#2,937 |
| 73. | 37095 | 8.0% | 3.5%(+4.50)#73 | 3.1%(+4.90)#2,987 |
| 74. | 38371 | 8.0% | 3.5%(+4.50)#74 | 3.1%(+4.90)#2,999 |
| 75. | 38456 | 7.9% | 3.5%(+4.40)#75 | 3.1%(+4.80)#3,044 |
| 76. | 37203 | 7.8% | 3.5%(+4.30)#76 | 3.1%(+4.70)#3,084 |
| 77. | 37018 | 7.8% | 3.5%(+4.30)#77 | 3.1%(+4.70)#3,100 |
| 78. | 37770 | 7.7% | 3.5%(+4.20)#78 | 3.1%(+4.60)#3,149 |
| 79. | 38109 | 7.6% | 3.5%(+4.10)#79 | 3.1%(+4.50)#3,194 |
| 80. | 37217 | 7.6% | 3.5%(+4.10)#80 | 3.1%(+4.50)#3,201 |
| 81. | 37206 | 7.6% | 3.5%(+4.10)#81 | 3.1%(+4.50)#3,203 |
| 82. | 38231 | 7.6% | 3.5%(+4.10)#82 | 3.1%(+4.50)#3,242 |
| 83. | 37022 | 7.5% | 3.5%(+4.00)#83 | 3.1%(+4.40)#3,288 |
| 84. | 38301 | 7.4% | 3.5%(+3.90)#84 | 3.1%(+4.30)#3,337 |
| 85. | 38107 | 7.4% | 3.5%(+3.90)#85 | 3.1%(+4.30)#3,348 |
| 86. | 38329 | 7.3% | 3.5%(+3.80)#86 | 3.1%(+4.20)#3,428 |
| 87. | 38450 | 7.3% | 3.5%(+3.80)#87 | 3.1%(+4.20)#3,430 |
| 88. | 38351 | 7.2% | 3.5%(+3.70)#88 | 3.1%(+4.10)#3,484 |
| 89. | 38019 | 7.2% | 3.5%(+3.70)#89 | 3.1%(+4.10)#3,486 |
| 90. | 38541 | 7.2% | 3.5%(+3.70)#90 | 3.1%(+4.10)#3,514 |
| 91. | 37405 | 7.1% | 3.5%(+3.60)#91 | 3.1%(+4.00)#3,555 |
| 92. | 37769 | 7.1% | 3.5%(+3.60)#92 | 3.1%(+4.00)#3,572 |
| 93. | 38261 | 7.0% | 3.5%(+3.50)#93 | 3.1%(+3.90)#3,641 |
| 94. | 37921 | 6.9% | 3.5%(+3.40)#94 | 3.1%(+3.80)#3,699 |
| 95. | 38052 | 6.9% | 3.5%(+3.40)#95 | 3.1%(+3.80)#3,736 |
| 96. | 37334 | 6.8% | 3.5%(+3.30)#96 | 3.1%(+3.70)#3,803 |
| 97. | 37821 | 6.8% | 3.5%(+3.30)#97 | 3.1%(+3.70)#3,807 |
| 98. | 37870 | 6.8% | 3.5%(+3.30)#98 | 3.1%(+3.70)#3,833 |
| 99. | 37362 | 6.8% | 3.5%(+3.30)#99 | 3.1%(+3.70)#3,834 |
| 100. | 37211 | 6.7% | 3.5%(+3.20)#100 | 3.1%(+3.60)#3,885 |
Common Questions
What are the Top 10 Zip Codes with the Highest Percentage of Families with Income Below $10,000 in Tennessee?
Top 10 Zip Codes with the Highest Percentage of Families with Income Below $10,000 in Tennessee are:
What zip code has the Highest Percentage of Families with Income Below $10,000 in Tennessee?
37916 has the Highest Percentage of Families with Income Below $10,000 in Tennessee with 63.1%.
What is the Percentage of Families with Income Below $10,000 in the State of Tennessee?
Percentage of Families with Income Below $10,000 in Tennessee is 3.5%.
What is the Percentage of Families with Income Below $10,000 in the United States?
Percentage of Families with Income Below $10,000 in the United States is 3.1%.