Zip Codes with the Highest Percentage of Families with Income Above $200,000 in Mississippi
RELATED REPORTS & OPTIONS
Family Income | $200k+
Mississippi
Compare Zip Codes
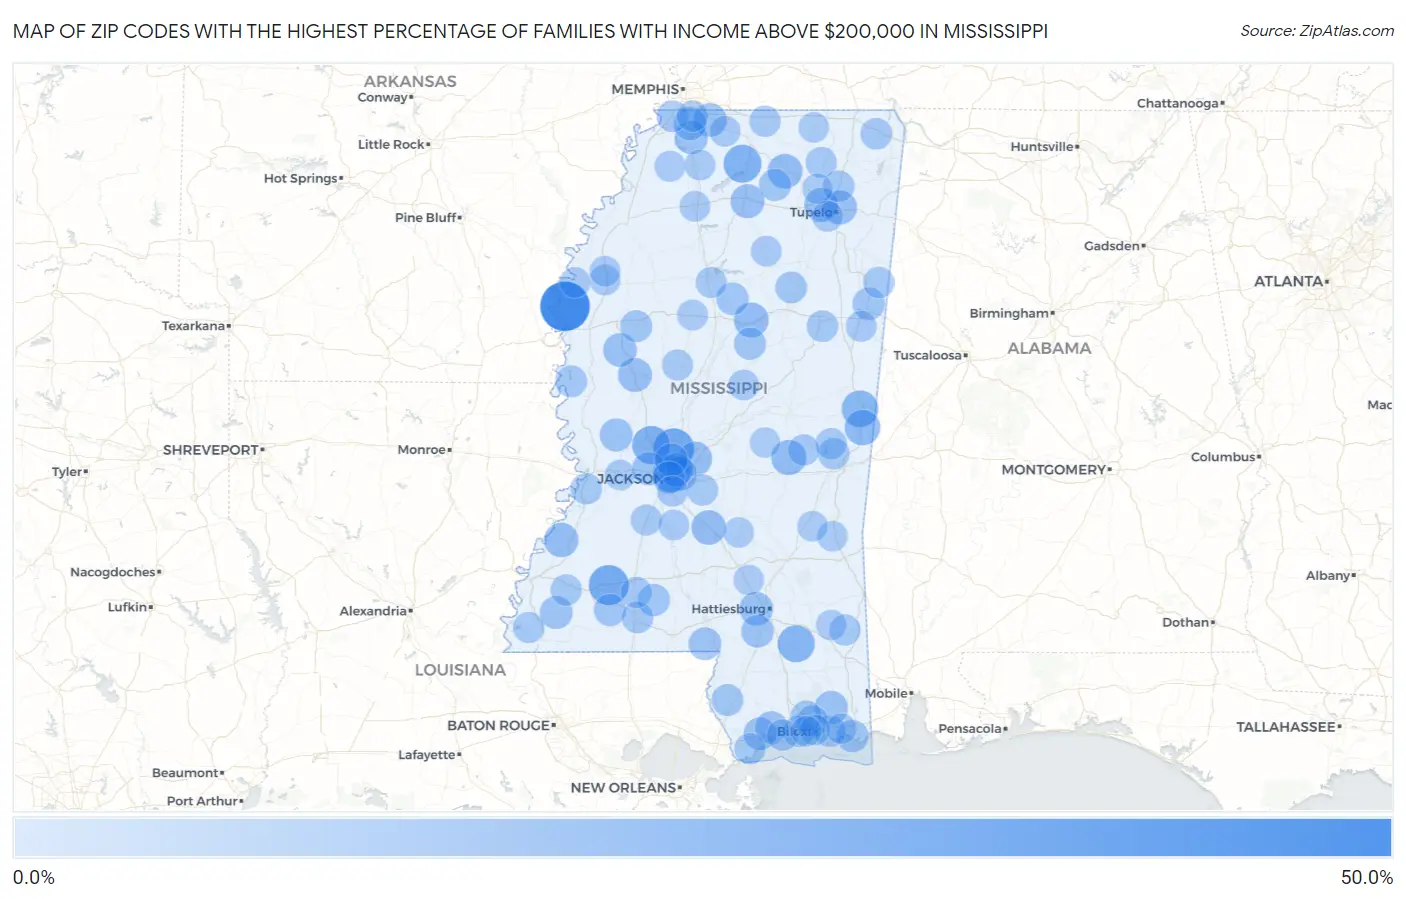
Map of Zip Codes with the Highest Percentage of Families with Income Above $200,000 in Mississippi
0.0%
50.0%
Zip Codes with the Highest Percentage of Families with Income Above $200,000 in Mississippi
| Zip Code | Families with Income > $200k | vs State | vs National | |
| 1. | 38772 | 50.0% | 6.3%(+43.7)#1 | 14.8%(+35.2)#669 |
| 2. | 39110 | 29.4% | 6.3%(+23.1)#2 | 14.8%(+14.6)#2,600 |
| 3. | 39647 | 27.7% | 6.3%(+21.4)#3 | 14.8%(+12.9)#2,922 |
| 4. | 39071 | 23.4% | 6.3%(+17.1)#4 | 14.8%(+8.60)#3,860 |
| 5. | 38685 | 23.1% | 6.3%(+16.8)#5 | 14.8%(+8.30)#3,929 |
| 6. | 39425 | 21.0% | 6.3%(+14.7)#6 | 14.8%(+6.20)#4,511 |
| 7. | 39216 | 20.7% | 6.3%(+14.4)#7 | 14.8%(+5.90)#4,610 |
| 8. | 39358 | 19.9% | 6.3%(+13.6)#8 | 14.8%(+5.10)#4,876 |
| 9. | 39352 | 17.6% | 6.3%(+11.3)#9 | 14.8%(+2.80)#5,752 |
| 10. | 39327 | 16.6% | 6.3%(+10.3)#10 | 14.8%(+1.80)#6,185 |
| 11. | 39767 | 16.0% | 6.3%(+9.70)#11 | 14.8%(+1.20)#6,477 |
| 12. | 38650 | 15.7% | 6.3%(+9.40)#12 | 14.8%(+0.900)#6,604 |
| 13. | 39114 | 15.4% | 6.3%(+9.10)#13 | 14.8%(+0.600)#6,750 |
| 14. | 39096 | 15.1% | 6.3%(+8.80)#14 | 14.8%(+0.300)#6,949 |
| 15. | 39047 | 14.8% | 6.3%(+8.50)#15 | 14.8%(=0.000)#7,081 |
| 16. | 38804 | 14.2% | 6.3%(+7.90)#16 | 14.8%(-0.600)#7,443 |
| 17. | 39232 | 14.1% | 6.3%(+7.80)#17 | 14.8%(-0.700)#7,488 |
| 18. | 38826 | 14.0% | 6.3%(+7.70)#18 | 14.8%(-0.800)#7,553 |
| 19. | 39166 | 14.0% | 6.3%(+7.70)#19 | 14.8%(-0.800)#7,576 |
| 20. | 38655 | 13.9% | 6.3%(+7.60)#20 | 14.8%(-0.900)#7,589 |
| 21. | 39211 | 13.6% | 6.3%(+7.30)#21 | 14.8%(-1.20)#7,809 |
| 22. | 38654 | 13.3% | 6.3%(+7.00)#22 | 14.8%(-1.50)#7,977 |
| 23. | 39402 | 13.3% | 6.3%(+7.00)#23 | 14.8%(-1.50)#7,982 |
| 24. | 38754 | 13.3% | 6.3%(+7.00)#24 | 14.8%(-1.50)#8,035 |
| 25. | 39056 | 12.4% | 6.3%(+6.10)#25 | 14.8%(-2.40)#8,646 |
| 26. | 39157 | 12.4% | 6.3%(+6.10)#26 | 14.8%(-2.40)#8,648 |
| 27. | 39565 | 12.4% | 6.3%(+6.10)#27 | 14.8%(-2.40)#8,654 |
| 28. | 38632 | 12.1% | 6.3%(+5.80)#28 | 14.8%(-2.70)#8,889 |
| 29. | 38651 | 12.1% | 6.3%(+5.80)#29 | 14.8%(-2.70)#8,908 |
| 30. | 39162 | 12.1% | 6.3%(+5.80)#30 | 14.8%(-2.70)#8,956 |
| 31. | 39633 | 11.7% | 6.3%(+5.40)#31 | 14.8%(-3.10)#9,243 |
| 32. | 39525 | 11.4% | 6.3%(+5.10)#32 | 14.8%(-3.40)#9,453 |
| 33. | 39478 | 11.3% | 6.3%(+5.00)#33 | 14.8%(-3.50)#9,572 |
| 34. | 39571 | 11.1% | 6.3%(+4.80)#34 | 14.8%(-3.70)#9,719 |
| 35. | 39475 | 11.0% | 6.3%(+4.70)#35 | 14.8%(-3.80)#9,825 |
| 36. | 39705 | 10.8% | 6.3%(+4.50)#36 | 14.8%(-4.00)#10,020 |
| 37. | 39664 | 10.4% | 6.3%(+4.10)#37 | 14.8%(-4.40)#10,430 |
| 38. | 39662 | 10.4% | 6.3%(+4.10)#38 | 14.8%(-4.40)#10,440 |
| 39. | 39202 | 10.3% | 6.3%(+4.00)#39 | 14.8%(-4.50)#10,512 |
| 40. | 38925 | 10.3% | 6.3%(+4.00)#40 | 14.8%(-4.50)#10,531 |
| 41. | 39567 | 10.0% | 6.3%(+3.70)#41 | 14.8%(-4.80)#10,803 |
| 42. | 38627 | 9.8% | 6.3%(+3.50)#42 | 14.8%(-5.00)#11,053 |
| 43. | 39745 | 9.6% | 6.3%(+3.30)#43 | 14.8%(-5.20)#11,281 |
| 44. | 38761 | 9.4% | 6.3%(+3.10)#44 | 14.8%(-5.40)#11,475 |
| 45. | 39426 | 9.3% | 6.3%(+3.00)#45 | 14.8%(-5.50)#11,546 |
| 46. | 39751 | 9.1% | 6.3%(+2.80)#46 | 14.8%(-5.70)#11,848 |
| 47. | 38744 | 9.0% | 6.3%(+2.70)#47 | 14.8%(-5.80)#11,999 |
| 48. | 38680 | 8.8% | 6.3%(+2.50)#48 | 14.8%(-6.00)#12,171 |
| 49. | 39564 | 8.7% | 6.3%(+2.40)#49 | 14.8%(-6.10)#12,250 |
| 50. | 39540 | 8.7% | 6.3%(+2.40)#50 | 14.8%(-6.10)#12,286 |
| 51. | 38833 | 8.7% | 6.3%(+2.40)#51 | 14.8%(-6.10)#12,329 |
| 52. | 39759 | 8.6% | 6.3%(+2.30)#52 | 14.8%(-6.20)#12,379 |
| 53. | 38849 | 8.6% | 6.3%(+2.30)#53 | 14.8%(-6.20)#12,433 |
| 54. | 39305 | 8.5% | 6.3%(+2.20)#54 | 14.8%(-6.30)#12,515 |
| 55. | 39507 | 8.5% | 6.3%(+2.20)#55 | 14.8%(-6.30)#12,521 |
| 56. | 39666 | 8.5% | 6.3%(+2.20)#56 | 14.8%(-6.30)#12,534 |
| 57. | 39560 | 8.3% | 6.3%(+2.00)#57 | 14.8%(-6.50)#12,796 |
| 58. | 38672 | 8.2% | 6.3%(+1.90)#58 | 14.8%(-6.60)#12,930 |
| 59. | 39661 | 8.2% | 6.3%(+1.90)#59 | 14.8%(-6.60)#12,972 |
| 60. | 39532 | 8.1% | 6.3%(+1.80)#60 | 14.8%(-6.70)#13,039 |
| 61. | 39180 | 8.1% | 6.3%(+1.80)#61 | 14.8%(-6.70)#13,046 |
| 62. | 39320 | 8.1% | 6.3%(+1.80)#62 | 14.8%(-6.70)#13,127 |
| 63. | 39042 | 8.0% | 6.3%(+1.70)#63 | 14.8%(-6.80)#13,172 |
| 64. | 39740 | 7.9% | 6.3%(+1.60)#64 | 14.8%(-6.90)#13,349 |
| 65. | 39451 | 7.8% | 6.3%(+1.50)#65 | 14.8%(-7.00)#13,480 |
| 66. | 39629 | 7.8% | 6.3%(+1.50)#66 | 14.8%(-7.00)#13,484 |
| 67. | 39669 | 7.8% | 6.3%(+1.50)#67 | 14.8%(-7.00)#13,502 |
| 68. | 38642 | 7.8% | 6.3%(+1.50)#68 | 14.8%(-7.00)#13,524 |
| 69. | 39337 | 7.8% | 6.3%(+1.50)#69 | 14.8%(-7.00)#13,538 |
| 70. | 39520 | 7.7% | 6.3%(+1.40)#70 | 14.8%(-7.10)#13,604 |
| 71. | 38625 | 7.6% | 6.3%(+1.30)#71 | 14.8%(-7.20)#13,813 |
| 72. | 39059 | 7.5% | 6.3%(+1.20)#72 | 14.8%(-7.30)#13,895 |
| 73. | 39095 | 7.5% | 6.3%(+1.20)#73 | 14.8%(-7.30)#13,911 |
| 74. | 38901 | 7.4% | 6.3%(+1.10)#74 | 14.8%(-7.40)#14,041 |
| 75. | 38665 | 7.3% | 6.3%(+1.000)#75 | 14.8%(-7.50)#14,248 |
| 76. | 39218 | 7.2% | 6.3%(+0.900)#76 | 14.8%(-7.60)#14,374 |
| 77. | 38801 | 7.1% | 6.3%(+0.800)#77 | 14.8%(-7.70)#14,474 |
| 78. | 38611 | 7.1% | 6.3%(+0.800)#78 | 14.8%(-7.70)#14,497 |
| 79. | 38917 | 7.1% | 6.3%(+0.800)#79 | 14.8%(-7.70)#14,566 |
| 80. | 38732 | 7.0% | 6.3%(+0.700)#80 | 14.8%(-7.80)#14,703 |
| 81. | 38668 | 6.9% | 6.3%(+0.600)#81 | 14.8%(-7.90)#14,890 |
| 82. | 39701 | 6.8% | 6.3%(+0.500)#82 | 14.8%(-8.00)#15,049 |
| 83. | 38759 | 6.8% | 6.3%(+0.500)#83 | 14.8%(-8.00)#15,122 |
| 84. | 38726 | 6.8% | 6.3%(+0.500)#84 | 14.8%(-8.00)#15,158 |
| 85. | 38606 | 6.7% | 6.3%(+0.400)#85 | 14.8%(-8.10)#15,214 |
| 86. | 39082 | 6.7% | 6.3%(+0.400)#86 | 14.8%(-8.10)#15,320 |
| 87. | 38951 | 6.7% | 6.3%(+0.400)#87 | 14.8%(-8.10)#15,322 |
| 88. | 39090 | 6.6% | 6.3%(+0.300)#88 | 14.8%(-8.20)#15,404 |
| 89. | 39360 | 6.5% | 6.3%(+0.200)#89 | 14.8%(-8.30)#15,582 |
| 90. | 39530 | 6.4% | 6.3%(+0.100)#90 | 14.8%(-8.40)#15,733 |
| 91. | 39531 | 6.3% | 6.3%(=0.000)#91 | 14.8%(-8.50)#15,900 |
| 92. | 39479 | 6.3% | 6.3%(=0.000)#92 | 14.8%(-8.50)#15,947 |
| 93. | 39366 | 6.3% | 6.3%(=0.000)#93 | 14.8%(-8.50)#16,018 |
| 94. | 39461 | 6.3% | 6.3%(=0.000)#94 | 14.8%(-8.50)#16,039 |
| 95. | 39066 | 6.2% | 6.3%(-0.100)#95 | 14.8%(-8.60)#16,150 |
| 96. | 38674 | 6.2% | 6.3%(-0.100)#96 | 14.8%(-8.60)#16,206 |
| 97. | 38828 | 6.1% | 6.3%(-0.200)#97 | 14.8%(-8.70)#16,309 |
| 98. | 39116 | 6.1% | 6.3%(-0.200)#98 | 14.8%(-8.70)#16,336 |
| 99. | 39553 | 6.0% | 6.3%(-0.300)#99 | 14.8%(-8.80)#16,462 |
| 100. | 39359 | 6.0% | 6.3%(-0.300)#100 | 14.8%(-8.80)#16,595 |
Common Questions
What are the Top 10 Zip Codes with the Highest Percentage of Families with Income Above $200,000 in Mississippi?
Top 10 Zip Codes with the Highest Percentage of Families with Income Above $200,000 in Mississippi are:
What zip code has the Highest Percentage of Families with Income Above $200,000 in Mississippi?
38772 has the Highest Percentage of Families with Income Above $200,000 in Mississippi with 50.0%.
What is the Percentage of Families with Income Above $200,000 in the State of Mississippi?
Percentage of Families with Income Above $200,000 in Mississippi is 6.3%.
What is the Percentage of Families with Income Above $200,000 in the United States?
Percentage of Families with Income Above $200,000 in the United States is 14.8%.