Abbeville, MS Map & Demographics
Abbeville Map
Abbeville Overview
$26,548
PER CAPITA INCOME
$65,625
AVG FAMILY INCOME
$52,857
AVG HOUSEHOLD INCOME
0.39
INEQUALITY / GINI INDEX
395
TOTAL POPULATION
144
MALE POPULATION
251
FEMALE POPULATION
57.37
MALES / 100 FEMALES
174.31
FEMALES / 100 MALES
39.5
MEDIAN AGE
4.4
AVG FAMILY SIZE
3.4
AVG HOUSEHOLD SIZE
204
LABOR FORCE [ PEOPLE ]
66.7%
PERCENT IN LABOR FORCE
9.3%
UNEMPLOYMENT RATE
Abbeville Zip Codes
Abbeville Area Codes
Income in Abbeville
Income Overview in Abbeville
Per Capita Income in Abbeville is $26,548, while median incomes of families and households are $65,625 and $52,857 respectively.
| Characteristic | Number | Measure |
| Per Capita Income | 395 | $26,548 |
| Median Family Income | 79 | $65,625 |
| Mean Family Income | 79 | $84,354 |
| Median Household Income | 116 | $52,857 |
| Mean Household Income | 116 | $70,112 |
| Income Deficit | 79 | $0 |
| Wage / Income Gap (%) | 395 | 0.00% |
| Wage / Income Gap ($) | 395 | 100.00¢ per $1 |
| Gini / Inequality Index | 395 | 0.39 |
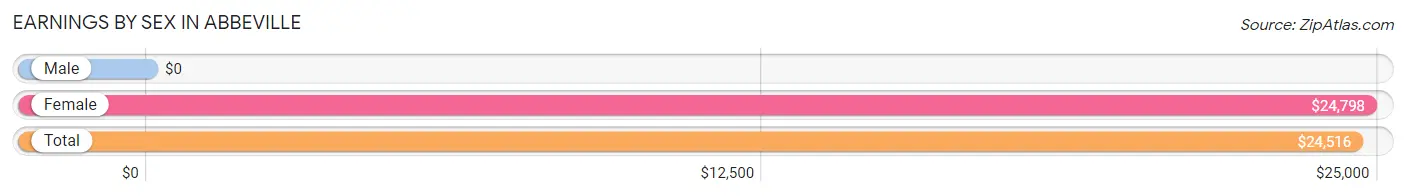
Earnings by Sex in Abbeville
| Sex | Number | Average Earnings |
| Male | 79 (36.9%) | $0 |
| Female | 135 (63.1%) | $24,798 |
| Total | 214 (100.0%) | $24,516 |
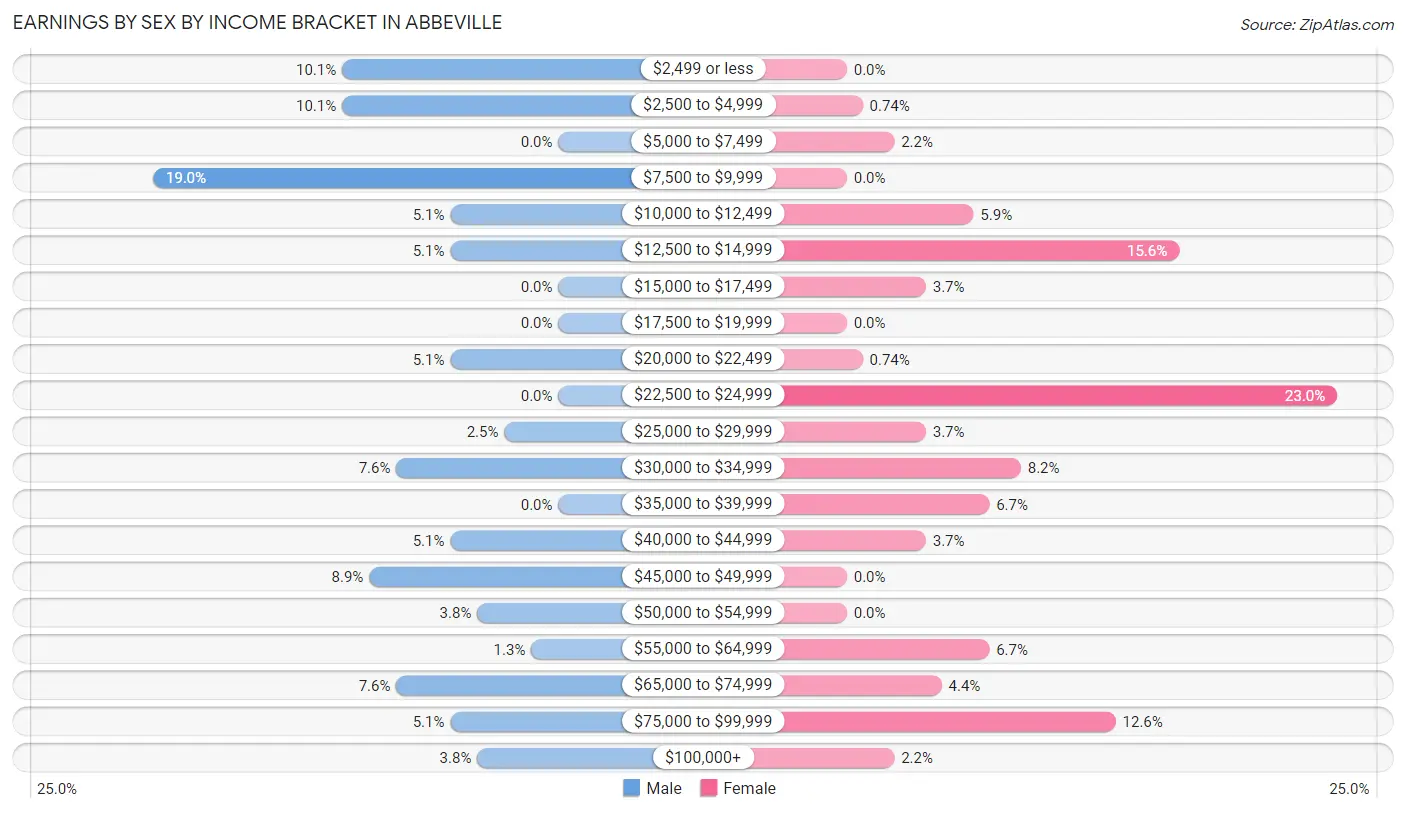
Earnings by Sex by Income Bracket in Abbeville
The most common earnings brackets in Abbeville are $7,500 to $9,999 for men (15 | 19.0%) and $22,500 to $24,999 for women (31 | 23.0%).
| Income | Male | Female |
| $2,499 or less | 8 (10.1%) | 0 (0.0%) |
| $2,500 to $4,999 | 8 (10.1%) | 1 (0.7%) |
| $5,000 to $7,499 | 0 (0.0%) | 3 (2.2%) |
| $7,500 to $9,999 | 15 (19.0%) | 0 (0.0%) |
| $10,000 to $12,499 | 4 (5.1%) | 8 (5.9%) |
| $12,500 to $14,999 | 4 (5.1%) | 21 (15.6%) |
| $15,000 to $17,499 | 0 (0.0%) | 5 (3.7%) |
| $17,500 to $19,999 | 0 (0.0%) | 0 (0.0%) |
| $20,000 to $22,499 | 4 (5.1%) | 1 (0.7%) |
| $22,500 to $24,999 | 0 (0.0%) | 31 (23.0%) |
| $25,000 to $29,999 | 2 (2.5%) | 5 (3.7%) |
| $30,000 to $34,999 | 6 (7.6%) | 11 (8.2%) |
| $35,000 to $39,999 | 0 (0.0%) | 9 (6.7%) |
| $40,000 to $44,999 | 4 (5.1%) | 5 (3.7%) |
| $45,000 to $49,999 | 7 (8.9%) | 0 (0.0%) |
| $50,000 to $54,999 | 3 (3.8%) | 0 (0.0%) |
| $55,000 to $64,999 | 1 (1.3%) | 9 (6.7%) |
| $65,000 to $74,999 | 6 (7.6%) | 6 (4.4%) |
| $75,000 to $99,999 | 4 (5.1%) | 17 (12.6%) |
| $100,000+ | 3 (3.8%) | 3 (2.2%) |
| Total | 79 (100.0%) | 135 (100.0%) |
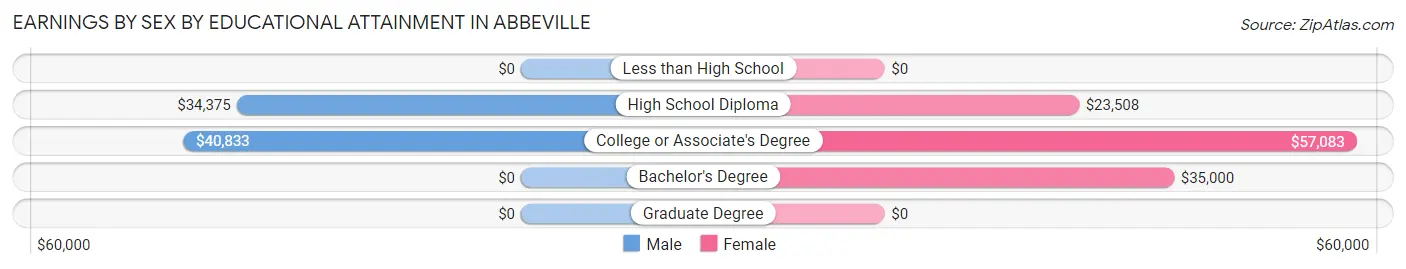
Earnings by Sex by Educational Attainment in Abbeville
Average earnings in Abbeville are $41,563 for men and $29,583 for women, a difference of 28.8%. Men with an educational attainment of college or associate's degree enjoy the highest average annual earnings of $40,833, while those with high school diploma education earn the least with $34,375. Women with an educational attainment of college or associate's degree earn the most with the average annual earnings of $57,083, while those with high school diploma education have the smallest earnings of $23,508.
| Educational Attainment | Male Income | Female Income |
| Less than High School | - | - |
| High School Diploma | $34,375 | $23,508 |
| College or Associate's Degree | $40,833 | $57,083 |
| Bachelor's Degree | - | - |
| Graduate Degree | - | - |
| Total | $41,563 | $29,583 |
Family Income in Abbeville
Family Income Brackets in Abbeville
According to the Abbeville family income data, there are 24 families falling into the $50,000 to $74,999 income range, which is the most common income bracket and makes up 30.4% of all families.
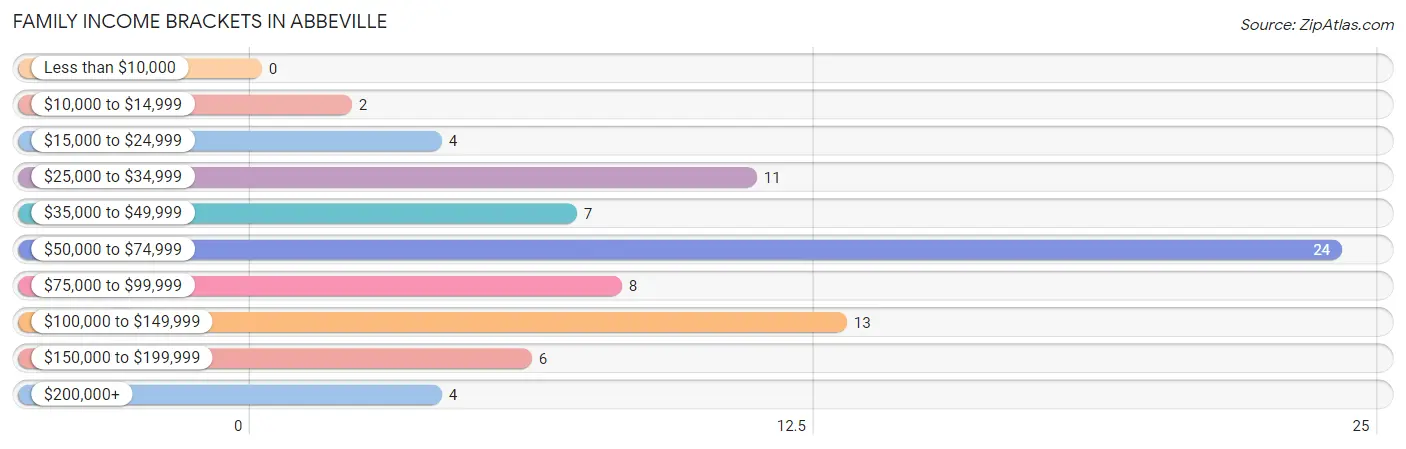
| Income Bracket | # Families | % Families |
| Less than $10,000 | 0 | 0.0% |
| $10,000 to $14,999 | 2 | 2.5% |
| $15,000 to $24,999 | 4 | 5.1% |
| $25,000 to $34,999 | 11 | 13.9% |
| $35,000 to $49,999 | 7 | 8.9% |
| $50,000 to $74,999 | 24 | 30.4% |
| $75,000 to $99,999 | 8 | 10.1% |
| $100,000 to $149,999 | 13 | 16.5% |
| $150,000 to $199,999 | 6 | 7.6% |
| $200,000+ | 4 | 5.1% |
Family Income by Famaliy Size in Abbeville
3-person families (13 | 16.5%) account for the highest median family income in Abbeville with $93,750 per family, while 3-person families (13 | 16.5%) have the highest median income of $31,250 per family member.
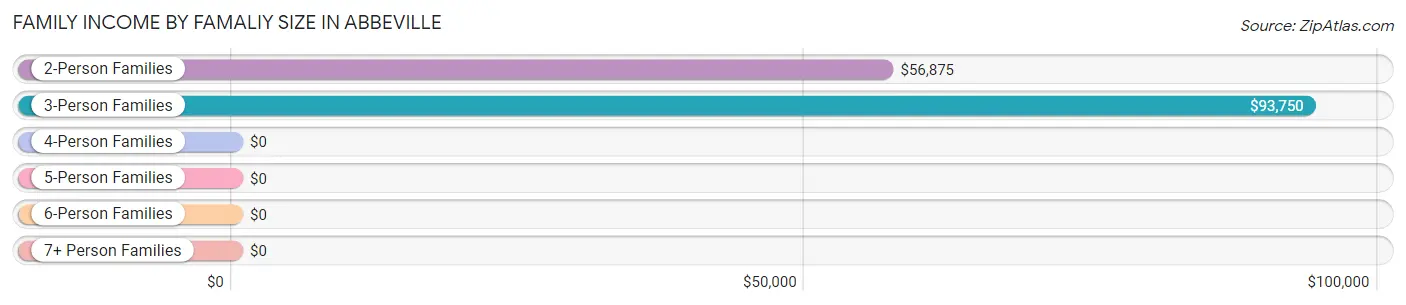
| Income Bracket | # Families | Median Income |
| 2-Person Families | 33 (41.8%) | $56,875 |
| 3-Person Families | 13 (16.5%) | $93,750 |
| 4-Person Families | 26 (32.9%) | $0 |
| 5-Person Families | 5 (6.3%) | $0 |
| 6-Person Families | 2 (2.5%) | $0 |
| 7+ Person Families | 0 (0.0%) | $0 |
| Total | 79 (100.0%) | $65,625 |
Family Income by Number of Earners in Abbeville
The median family income in Abbeville is $65,625, with families comprising 3+ earners (13) having the highest median family income of $118,750, while families with 1 earner (33) have the lowest median family income of $34,844, accounting for 16.5% and 41.8% of families, respectively.
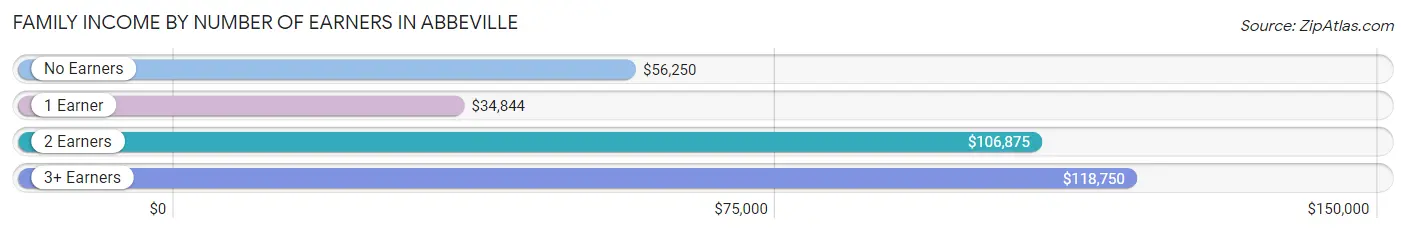
| Number of Earners | # Families | Median Income |
| No Earners | 8 (10.1%) | $56,250 |
| 1 Earner | 33 (41.8%) | $34,844 |
| 2 Earners | 25 (31.7%) | $106,875 |
| 3+ Earners | 13 (16.5%) | $118,750 |
| Total | 79 (100.0%) | $65,625 |
Household Income in Abbeville
Household Income Brackets in Abbeville
With 31 households falling in the category, the $50,000 to $74,999 income range is the most frequent in Abbeville, accounting for 26.7% of all households.
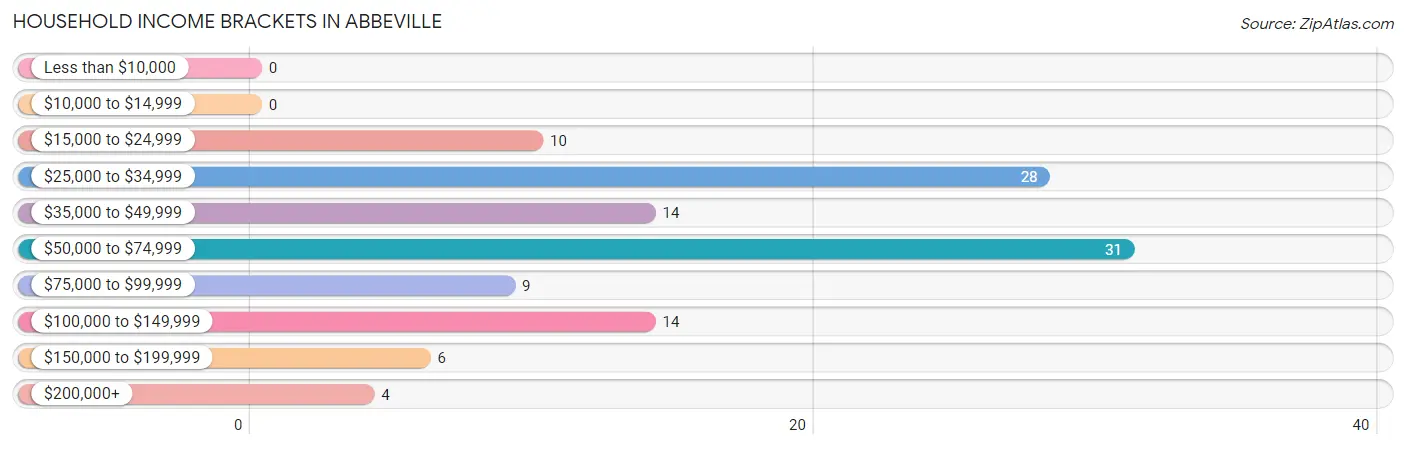
| Income Bracket | # Households | % Households |
| Less than $10,000 | 0 | 0.0% |
| $10,000 to $14,999 | 0 | 0.0% |
| $15,000 to $24,999 | 10 | 8.6% |
| $25,000 to $34,999 | 28 | 24.1% |
| $35,000 to $49,999 | 14 | 12.1% |
| $50,000 to $74,999 | 31 | 26.7% |
| $75,000 to $99,999 | 9 | 7.8% |
| $100,000 to $149,999 | 14 | 12.1% |
| $150,000 to $199,999 | 6 | 5.2% |
| $200,000+ | 4 | 3.4% |
Household Income by Householder Age in Abbeville
The median household income in Abbeville is $52,857, with the highest median household income of $73,750 found in the 25 to 44 years age bracket for the primary householder. A total of 28 households (24.1%) fall into this category.
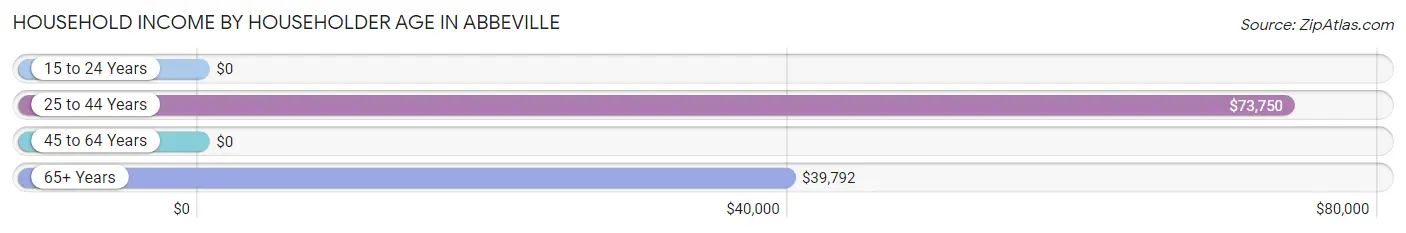
| Income Bracket | # Households | Median Income |
| 15 to 24 Years | 0 (0.0%) | $0 |
| 25 to 44 Years | 28 (24.1%) | $73,750 |
| 45 to 64 Years | 39 (33.6%) | $0 |
| 65+ Years | 49 (42.2%) | $39,792 |
| Total | 116 (100.0%) | $52,857 |
Poverty in Abbeville
Income Below Poverty by Sex and Age in Abbeville
With 17.4% poverty level for males and 4.8% for females among the residents of Abbeville, 6 to 11 year old males and under 5 year old females are the most vulnerable to poverty, with 17 males (100.0%) and 4 females (25.0%) in their respective age groups living below the poverty level.
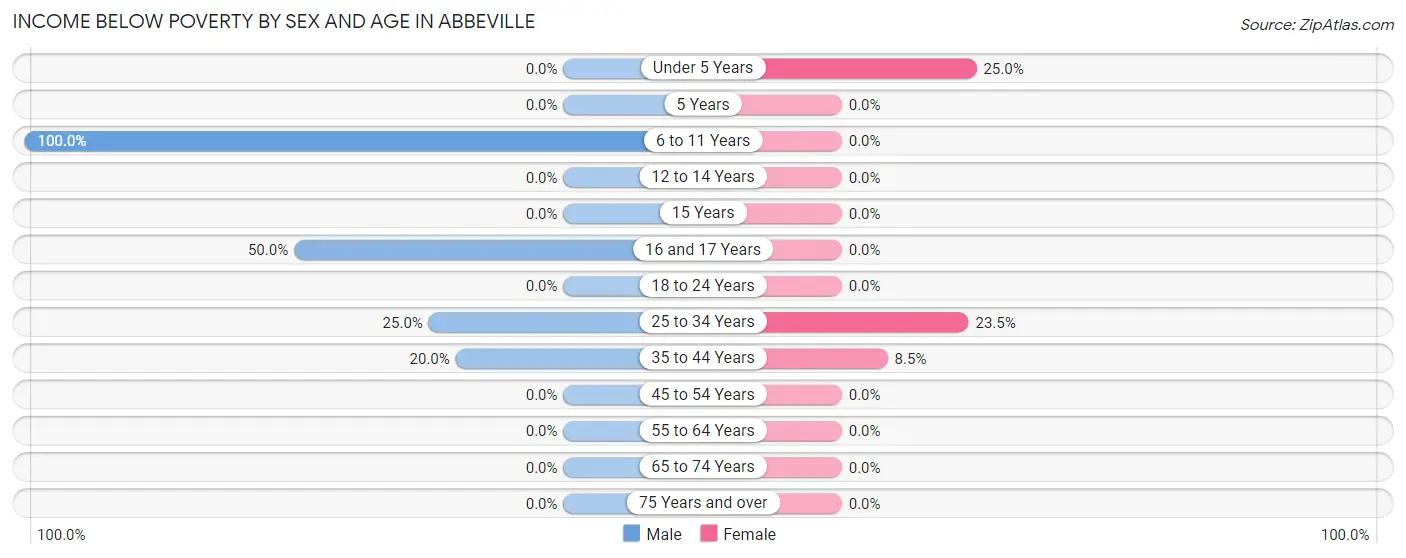
| Age Bracket | Male | Female |
| Under 5 Years | 0 (0.0%) | 4 (25.0%) |
| 5 Years | 0 (0.0%) | 0 (0.0%) |
| 6 to 11 Years | 17 (100.0%) | 0 (0.0%) |
| 12 to 14 Years | 0 (0.0%) | 0 (0.0%) |
| 15 Years | 0 (0.0%) | 0 (0.0%) |
| 16 and 17 Years | 2 (50.0%) | 0 (0.0%) |
| 18 to 24 Years | 0 (0.0%) | 0 (0.0%) |
| 25 to 34 Years | 2 (25.0%) | 4 (23.5%) |
| 35 to 44 Years | 4 (20.0%) | 4 (8.5%) |
| 45 to 54 Years | 0 (0.0%) | 0 (0.0%) |
| 55 to 64 Years | 0 (0.0%) | 0 (0.0%) |
| 65 to 74 Years | 0 (0.0%) | 0 (0.0%) |
| 75 Years and over | 0 (0.0%) | 0 (0.0%) |
| Total | 25 (17.4%) | 12 (4.8%) |
Income Above Poverty by Sex and Age in Abbeville
According to the poverty statistics in Abbeville, males aged under 5 years and females aged 5 years are the age groups that are most secure financially, with 100.0% of males and 100.0% of females in these age groups living above the poverty line.
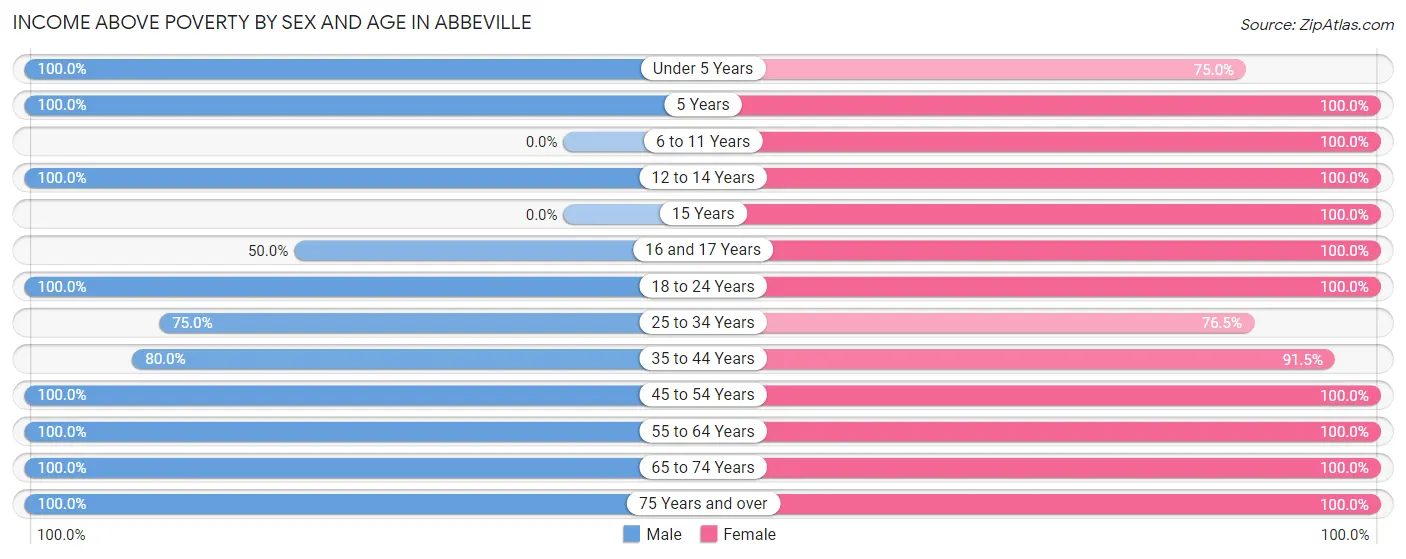
| Age Bracket | Male | Female |
| Under 5 Years | 1 (100.0%) | 12 (75.0%) |
| 5 Years | 4 (100.0%) | 2 (100.0%) |
| 6 to 11 Years | 0 (0.0%) | 20 (100.0%) |
| 12 to 14 Years | 8 (100.0%) | 7 (100.0%) |
| 15 Years | 0 (0.0%) | 14 (100.0%) |
| 16 and 17 Years | 2 (50.0%) | 15 (100.0%) |
| 18 to 24 Years | 29 (100.0%) | 18 (100.0%) |
| 25 to 34 Years | 6 (75.0%) | 13 (76.5%) |
| 35 to 44 Years | 16 (80.0%) | 43 (91.5%) |
| 45 to 54 Years | 13 (100.0%) | 20 (100.0%) |
| 55 to 64 Years | 13 (100.0%) | 38 (100.0%) |
| 65 to 74 Years | 12 (100.0%) | 22 (100.0%) |
| 75 Years and over | 15 (100.0%) | 15 (100.0%) |
| Total | 119 (82.6%) | 239 (95.2%) |
Income Below Poverty Among Married-Couple Families in Abbeville
The poverty statistics for married-couple families in Abbeville show that 6.8% or 4 of the total 59 families live below the poverty line. Families with 3 or 4 children have the highest poverty rate of 100.0%, comprising of 4 families. On the other hand, families with no children have the lowest poverty rate of 0.0%, which includes 0 families.
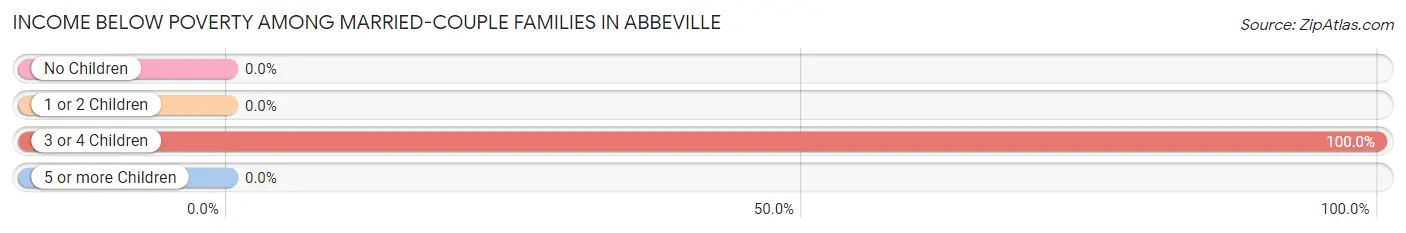
| Children | Above Poverty | Below Poverty |
| No Children | 43 (100.0%) | 0 (0.0%) |
| 1 or 2 Children | 12 (100.0%) | 0 (0.0%) |
| 3 or 4 Children | 0 (0.0%) | 4 (100.0%) |
| 5 or more Children | 0 (0.0%) | 0 (0.0%) |
| Total | 55 (93.2%) | 4 (6.8%) |
Income Below Poverty Among Single-Parent Households in Abbeville
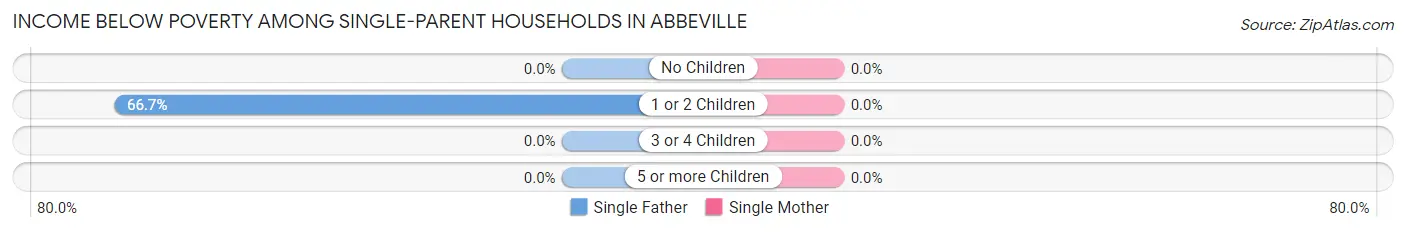
| Children | Single Father | Single Mother |
| No Children | 0 (0.0%) | 0 (0.0%) |
| 1 or 2 Children | 2 (66.7%) | 0 (0.0%) |
| 3 or 4 Children | 0 (0.0%) | 0 (0.0%) |
| 5 or more Children | 0 (0.0%) | 0 (0.0%) |
| Total | 2 (66.7%) | 0 (0.0%) |
Income Below Poverty Among Married-Couple vs Single-Parent Households in Abbeville
The poverty data for Abbeville shows that 4 of the married-couple family households (6.8%) and 2 of the single-parent households (10.0%) are living below the poverty level. Within the married-couple family households, those with 3 or 4 children have the highest poverty rate, with 4 households (100.0%) falling below the poverty line. Among the single-parent households, those with 1 or 2 children have the highest poverty rate, with 2 household (12.5%) living below poverty.
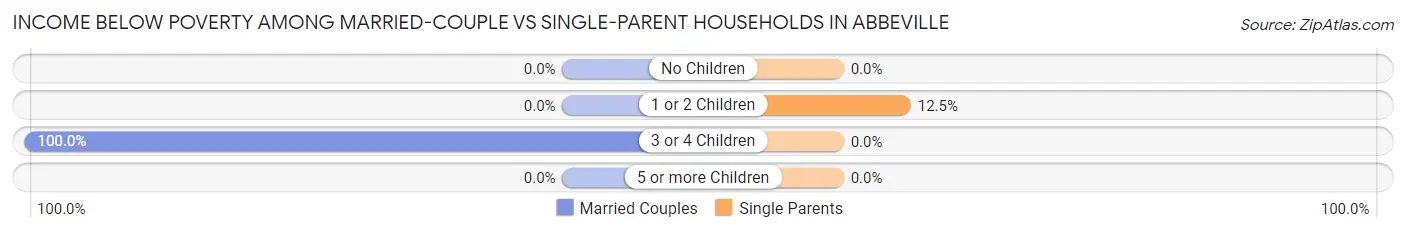
| Children | Married-Couple Families | Single-Parent Households |
| No Children | 0 (0.0%) | 0 (0.0%) |
| 1 or 2 Children | 0 (0.0%) | 2 (12.5%) |
| 3 or 4 Children | 4 (100.0%) | 0 (0.0%) |
| 5 or more Children | 0 (0.0%) | 0 (0.0%) |
| Total | 4 (6.8%) | 2 (10.0%) |
Race in Abbeville
The most populous races in Abbeville are White / Caucasian (305 | 77.2%), Black / African American (68 | 17.2%), and Two or more Races (16 | 4.1%).
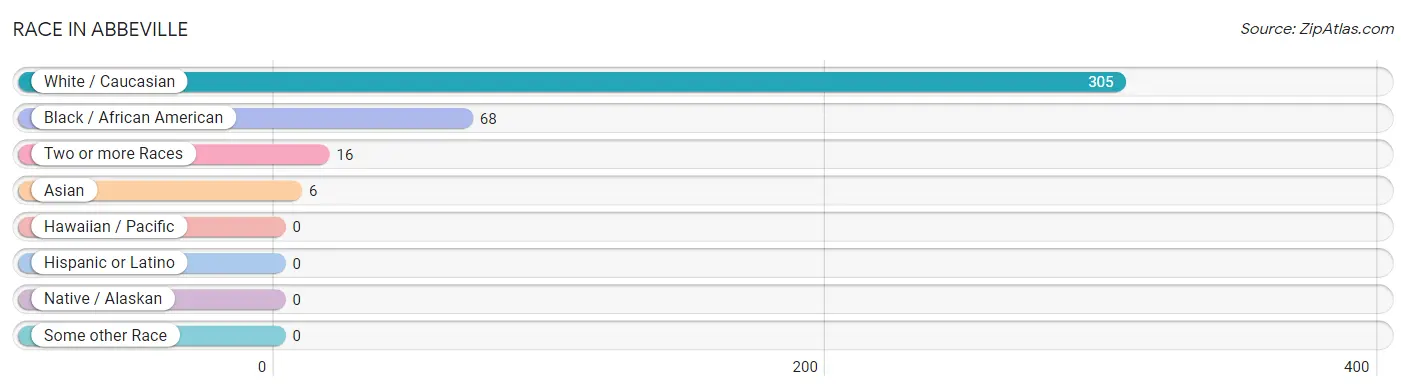
| Race | # Population | % Population |
| Asian | 6 | 1.5% |
| Black / African American | 68 | 17.2% |
| Hawaiian / Pacific | 0 | 0.0% |
| Hispanic or Latino | 0 | 0.0% |
| Native / Alaskan | 0 | 0.0% |
| White / Caucasian | 305 | 77.2% |
| Two or more Races | 16 | 4.1% |
| Some other Race | 0 | 0.0% |
| Total | 395 | 100.0% |
Ancestry in Abbeville
The most populous ancestries reported in Abbeville are English (67 | 17.0%), American (32 | 8.1%), Irish (29 | 7.3%), German (18 | 4.6%), and Scottish (11 | 2.8%), together accounting for 39.7% of all Abbeville residents.
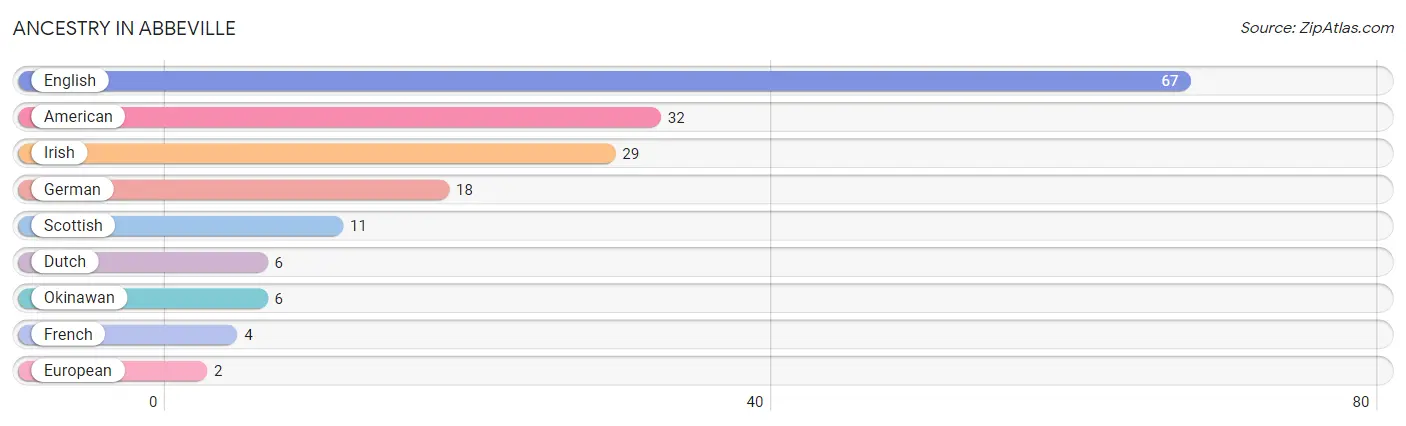
| Ancestry | # Population | % Population |
| American | 32 | 8.1% |
| Dutch | 6 | 1.5% |
| English | 67 | 17.0% |
| European | 2 | 0.5% |
| French | 4 | 1.0% |
| German | 18 | 4.6% |
| Irish | 29 | 7.3% |
| Okinawan | 6 | 1.5% |
| Scottish | 11 | 2.8% | View All 9 Rows |
Immigrants in Abbeville
The most numerous immigrant groups reported in Abbeville came from Asia (6 | 1.5%), Singapore (6 | 1.5%), and South Eastern Asia (6 | 1.5%), together accounting for 4.6% of all Abbeville residents.
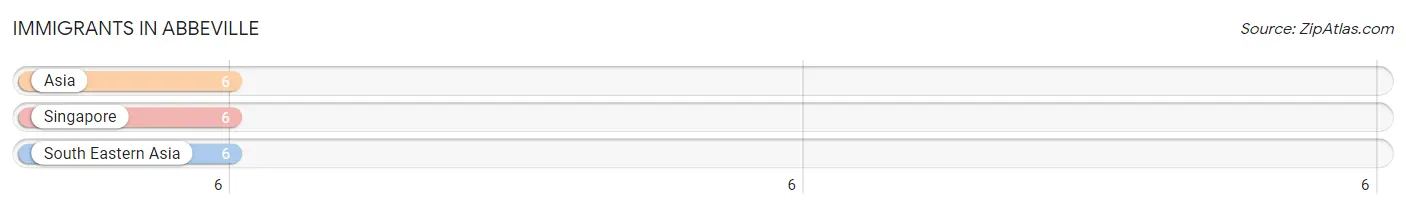
| Immigration Origin | # Population | % Population |
| Asia | 6 | 1.5% |
| Singapore | 6 | 1.5% |
| South Eastern Asia | 6 | 1.5% | View All 3 Rows |
Sex and Age in Abbeville
Sex and Age in Abbeville
The most populous age groups in Abbeville are 20 to 24 Years (21 | 14.6%) for men and 15 to 19 Years (39 | 15.5%) for women.
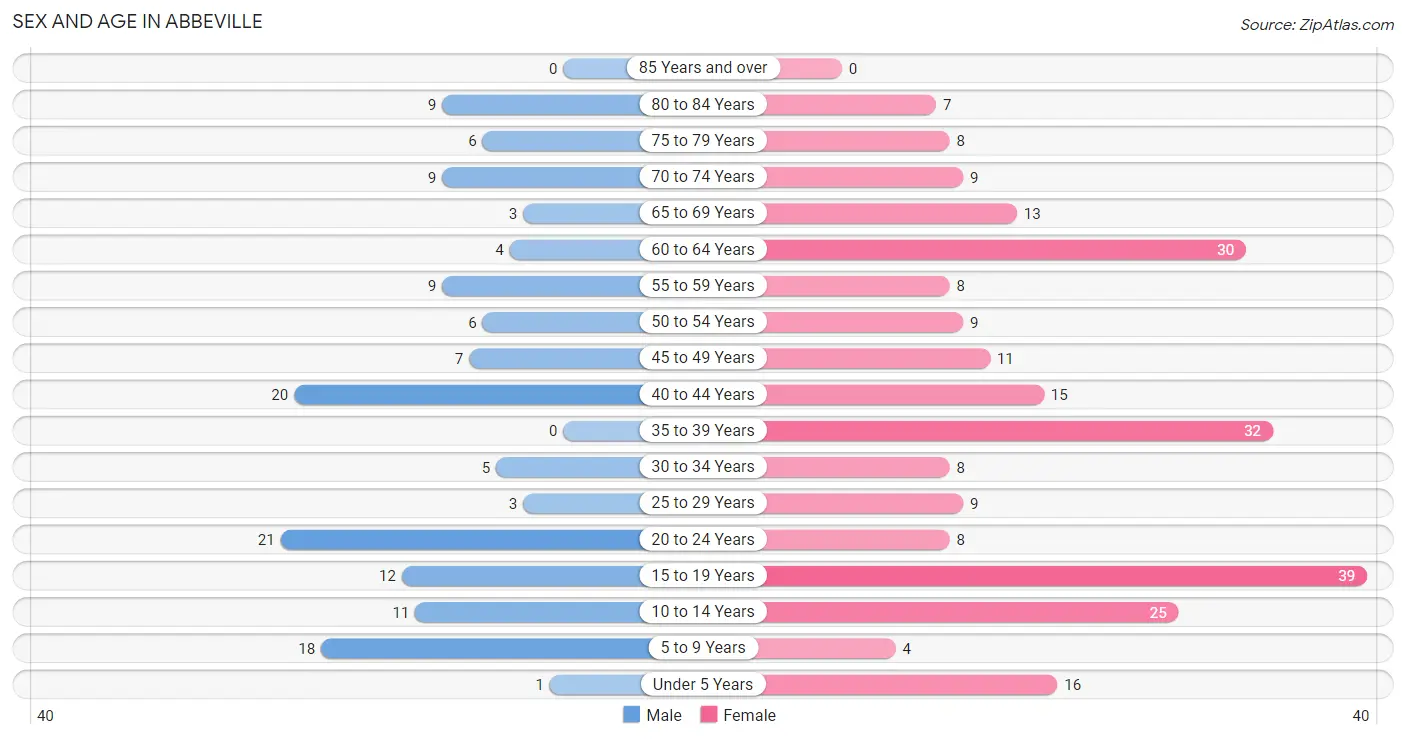
| Age Bracket | Male | Female |
| Under 5 Years | 1 (0.7%) | 16 (6.4%) |
| 5 to 9 Years | 18 (12.5%) | 4 (1.6%) |
| 10 to 14 Years | 11 (7.6%) | 25 (10.0%) |
| 15 to 19 Years | 12 (8.3%) | 39 (15.5%) |
| 20 to 24 Years | 21 (14.6%) | 8 (3.2%) |
| 25 to 29 Years | 3 (2.1%) | 9 (3.6%) |
| 30 to 34 Years | 5 (3.5%) | 8 (3.2%) |
| 35 to 39 Years | 0 (0.0%) | 32 (12.8%) |
| 40 to 44 Years | 20 (13.9%) | 15 (6.0%) |
| 45 to 49 Years | 7 (4.9%) | 11 (4.4%) |
| 50 to 54 Years | 6 (4.2%) | 9 (3.6%) |
| 55 to 59 Years | 9 (6.2%) | 8 (3.2%) |
| 60 to 64 Years | 4 (2.8%) | 30 (11.9%) |
| 65 to 69 Years | 3 (2.1%) | 13 (5.2%) |
| 70 to 74 Years | 9 (6.2%) | 9 (3.6%) |
| 75 to 79 Years | 6 (4.2%) | 8 (3.2%) |
| 80 to 84 Years | 9 (6.2%) | 7 (2.8%) |
| 85 Years and over | 0 (0.0%) | 0 (0.0%) |
| Total | 144 (100.0%) | 251 (100.0%) |
Families and Households in Abbeville
Median Family Size in Abbeville
The median family size in Abbeville is 4.43 persons per family, with single male/father families (3 | 3.8%) accounting for the largest median family size of 12.33 persons per family. On the other hand, married-couple families (59 | 74.7%) represent the smallest median family size with 3.36 persons per family.
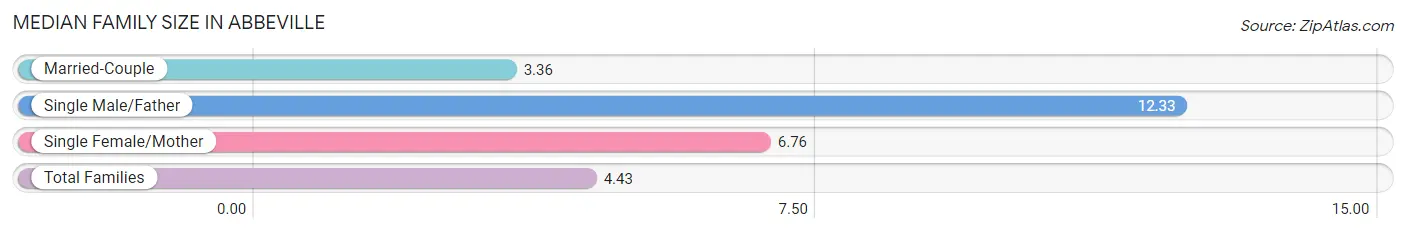
| Family Type | # Families | Family Size |
| Married-Couple | 59 (74.7%) | 3.36 |
| Single Male/Father | 3 (3.8%) | 12.33 |
| Single Female/Mother | 17 (21.5%) | 6.76 |
| Total Families | 79 (100.0%) | 4.43 |
Median Household Size in Abbeville
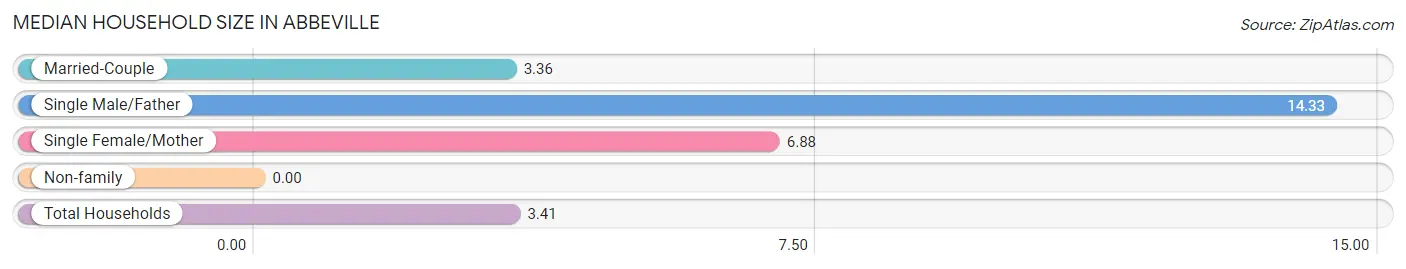
| Household Type | # Households | Household Size |
| Married-Couple | 59 (50.9%) | 3.36 |
| Single Male/Father | 3 (2.6%) | 14.33 |
| Single Female/Mother | 17 (14.7%) | 6.88 |
| Non-family | 37 (31.9%) | - |
| Total Households | 116 (100.0%) | 3.41 |
Household Size by Marriage Status in Abbeville
Out of a total of 116 households in Abbeville, 79 (68.1%) are family households, while 37 (31.9%) are nonfamily households. The most numerous type of family households are 2-person households, comprising 30, and the most common type of nonfamily households are 1-person households, comprising 37.
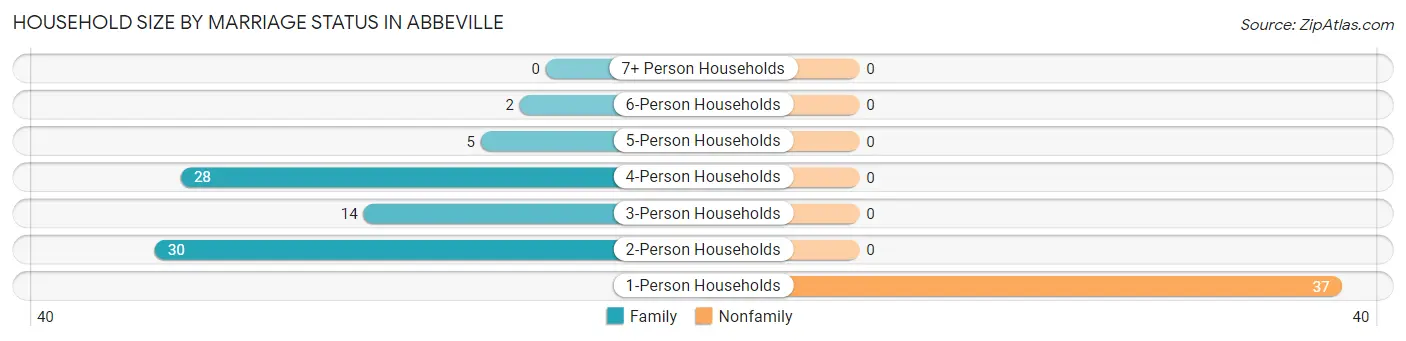
| Household Size | Family Households | Nonfamily Households |
| 1-Person Households | - | 37 (31.9%) |
| 2-Person Households | 30 (25.9%) | 0 (0.0%) |
| 3-Person Households | 14 (12.1%) | 0 (0.0%) |
| 4-Person Households | 28 (24.1%) | 0 (0.0%) |
| 5-Person Households | 5 (4.3%) | 0 (0.0%) |
| 6-Person Households | 2 (1.7%) | 0 (0.0%) |
| 7+ Person Households | 0 (0.0%) | 0 (0.0%) |
| Total | 79 (68.1%) | 37 (31.9%) |
Female Fertility in Abbeville
Fertility by Age in Abbeville
Average fertility rate in Abbeville is 8.0 births per 1,000 women. Women in the age bracket of 20 to 34 years have the highest fertility rate with 40.0 births per 1,000 women. Women in the age bracket of 20 to 34 years acount for 100.0% of all women with births.
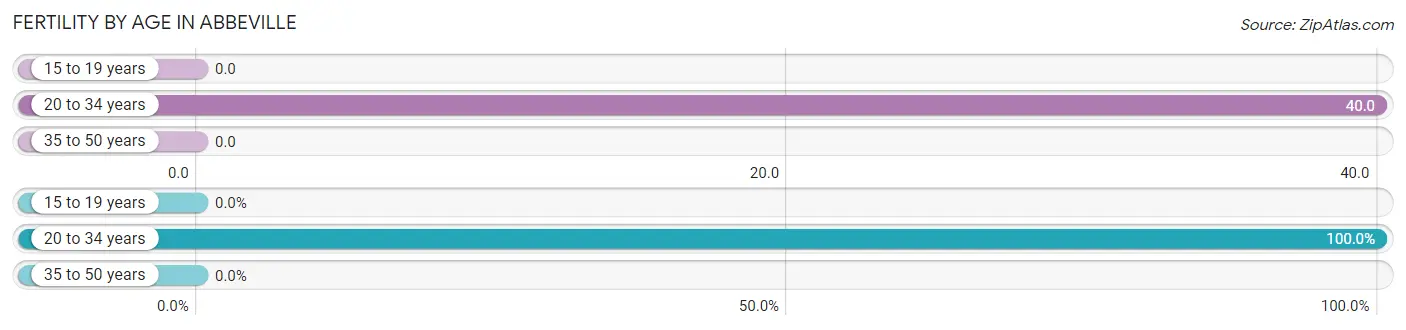
| Age Bracket | Women with Births | Births / 1,000 Women |
| 15 to 19 years | 0 (0.0%) | 0.0 |
| 20 to 34 years | 1 (100.0%) | 40.0 |
| 35 to 50 years | 0 (0.0%) | 0.0 |
| Total | 1 (100.0%) | 8.0 |
Fertility by Age by Marriage Status in Abbeville
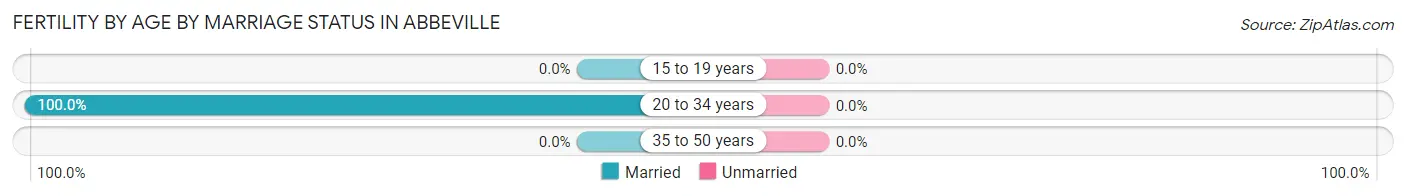
| Age Bracket | Married | Unmarried |
| 15 to 19 years | 0 (0.0%) | 0 (0.0%) |
| 20 to 34 years | 1 (100.0%) | 0 (0.0%) |
| 35 to 50 years | 0 (0.0%) | 0 (0.0%) |
| Total | 1 (100.0%) | 0 (0.0%) |
Fertility by Education in Abbeville
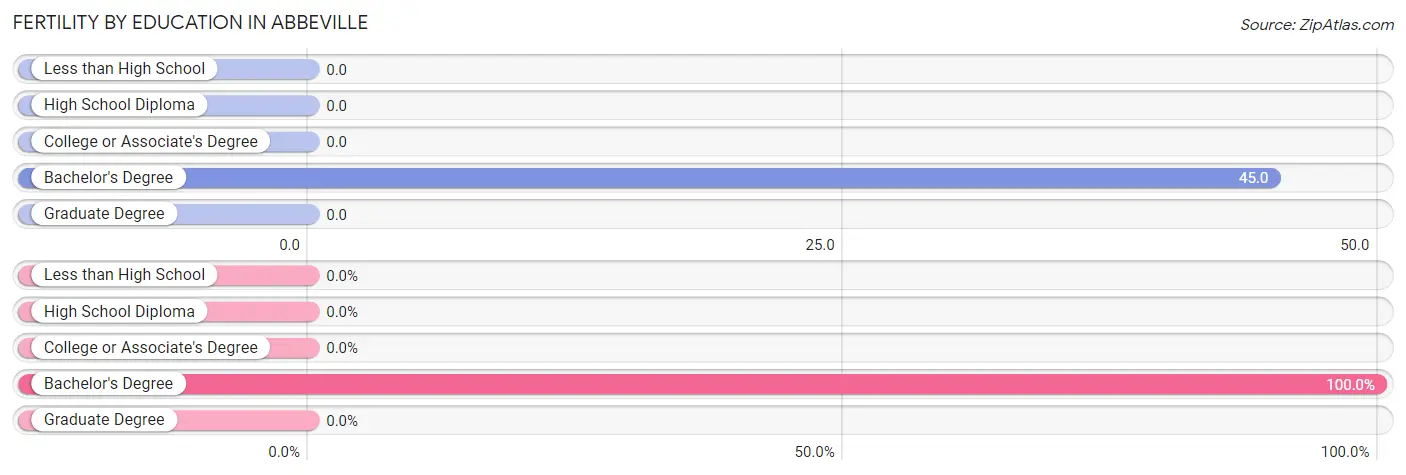
| Educational Attainment | Women with Births | Births / 1,000 Women |
| Less than High School | 0 (0.0%) | 0.0 |
| High School Diploma | 0 (0.0%) | 0.0 |
| College or Associate's Degree | 0 (0.0%) | 0.0 |
| Bachelor's Degree | 1 (100.0%) | 45.0 |
| Graduate Degree | 0 (0.0%) | 0.0 |
| Total | 1 (100.0%) | 8.0 |
Fertility by Education by Marriage Status in Abbeville
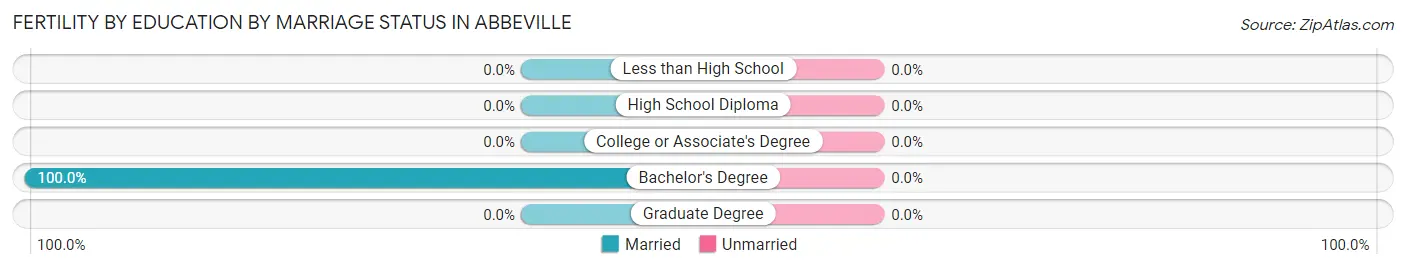
| Educational Attainment | Married | Unmarried |
| Less than High School | 0 (0.0%) | 0 (0.0%) |
| High School Diploma | 0 (0.0%) | 0 (0.0%) |
| College or Associate's Degree | 0 (0.0%) | 0 (0.0%) |
| Bachelor's Degree | 1 (100.0%) | 0 (0.0%) |
| Graduate Degree | 0 (0.0%) | 0 (0.0%) |
| Total | 1 (100.0%) | 0 (0.0%) |
Employment Characteristics in Abbeville
Employment by Class of Employer in Abbeville
Among the 185 employed individuals in Abbeville, private company employees (133 | 71.9%), self-employed (not incorporated) (12 | 6.5%), and not-for-profit organizations (11 | 5.9%) make up the most common classes of employment.
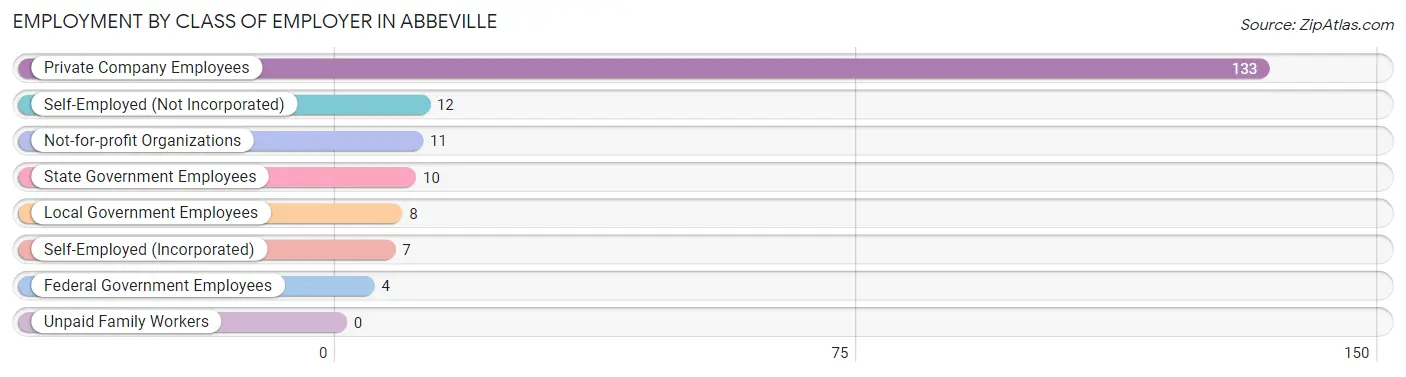
| Employer Class | # Employees | % Employees |
| Private Company Employees | 133 | 71.9% |
| Self-Employed (Incorporated) | 7 | 3.8% |
| Self-Employed (Not Incorporated) | 12 | 6.5% |
| Not-for-profit Organizations | 11 | 5.9% |
| Local Government Employees | 8 | 4.3% |
| State Government Employees | 10 | 5.4% |
| Federal Government Employees | 4 | 2.2% |
| Unpaid Family Workers | 0 | 0.0% |
| Total | 185 | 100.0% |
Employment Status by Age in Abbeville
According to the labor force statistics for Abbeville, out of the total population over 16 years of age (306), 66.7% or 204 individuals are in the labor force, with 9.3% or 19 of them unemployed. The age group with the highest labor force participation rate is 30 to 34 years, with 100.0% or 13 individuals in the labor force. Within the labor force, the 20 to 24 years age range has the highest percentage of unemployed individuals, with 31.8% or 7 of them being unemployed.
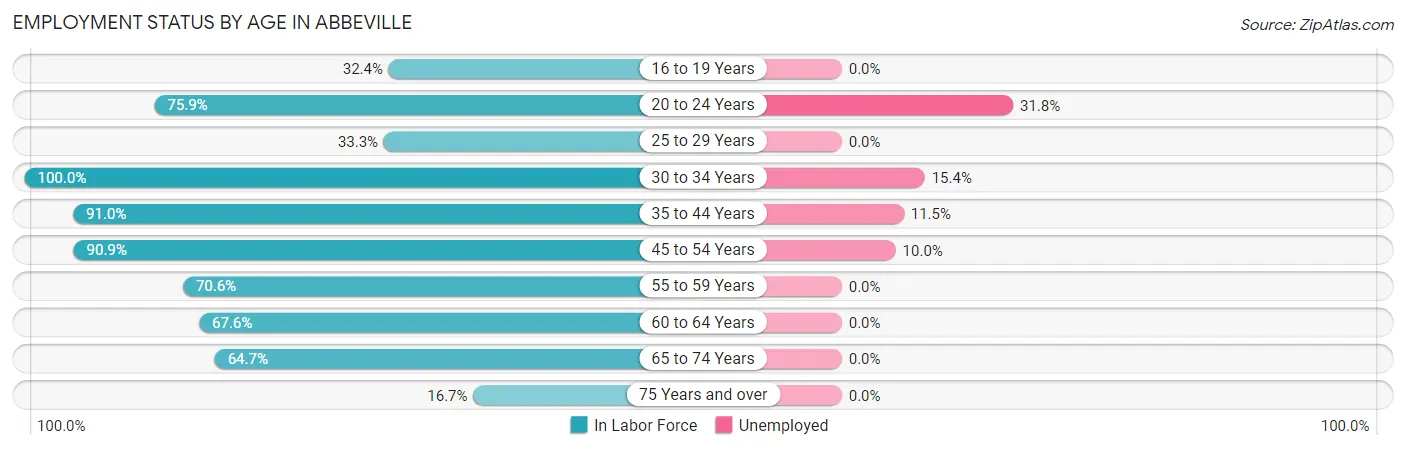
| Age Bracket | In Labor Force | Unemployed |
| 16 to 19 Years | 12 (32.4%) | 0 (0.0%) |
| 20 to 24 Years | 22 (75.9%) | 7 (31.8%) |
| 25 to 29 Years | 4 (33.3%) | 0 (0.0%) |
| 30 to 34 Years | 13 (100.0%) | 2 (15.4%) |
| 35 to 44 Years | 61 (91.0%) | 7 (11.5%) |
| 45 to 54 Years | 30 (90.9%) | 3 (10.0%) |
| 55 to 59 Years | 12 (70.6%) | 0 (0.0%) |
| 60 to 64 Years | 23 (67.6%) | 0 (0.0%) |
| 65 to 74 Years | 22 (64.7%) | 0 (0.0%) |
| 75 Years and over | 5 (16.7%) | 0 (0.0%) |
| Total | 204 (66.7%) | 19 (9.3%) |
Employment Status by Educational Attainment in Abbeville
According to labor force statistics for Abbeville, 81.3% of individuals (143) out of the total population between 25 and 64 years of age (176) are in the labor force, with 8.4% or 12 of them being unemployed. The group with the highest labor force participation rate are those with the educational attainment of college / associate degree, with 96.2% or 50 individuals in the labor force. Within the labor force, individuals with high school diploma education have the highest percentage of unemployment, with 19.0% or 12 of them being unemployed.
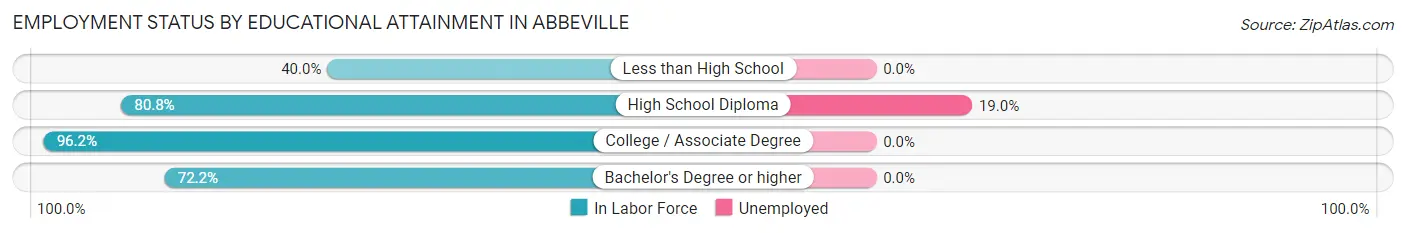
| Educational Attainment | In Labor Force | Unemployed |
| Less than High School | 4 (40.0%) | 0 (0.0%) |
| High School Diploma | 63 (80.8%) | 15 (19.0%) |
| College / Associate Degree | 50 (96.2%) | 0 (0.0%) |
| Bachelor's Degree or higher | 26 (72.2%) | 0 (0.0%) |
| Total | 143 (81.3%) | 15 (8.4%) |
Employment Occupations by Sex in Abbeville
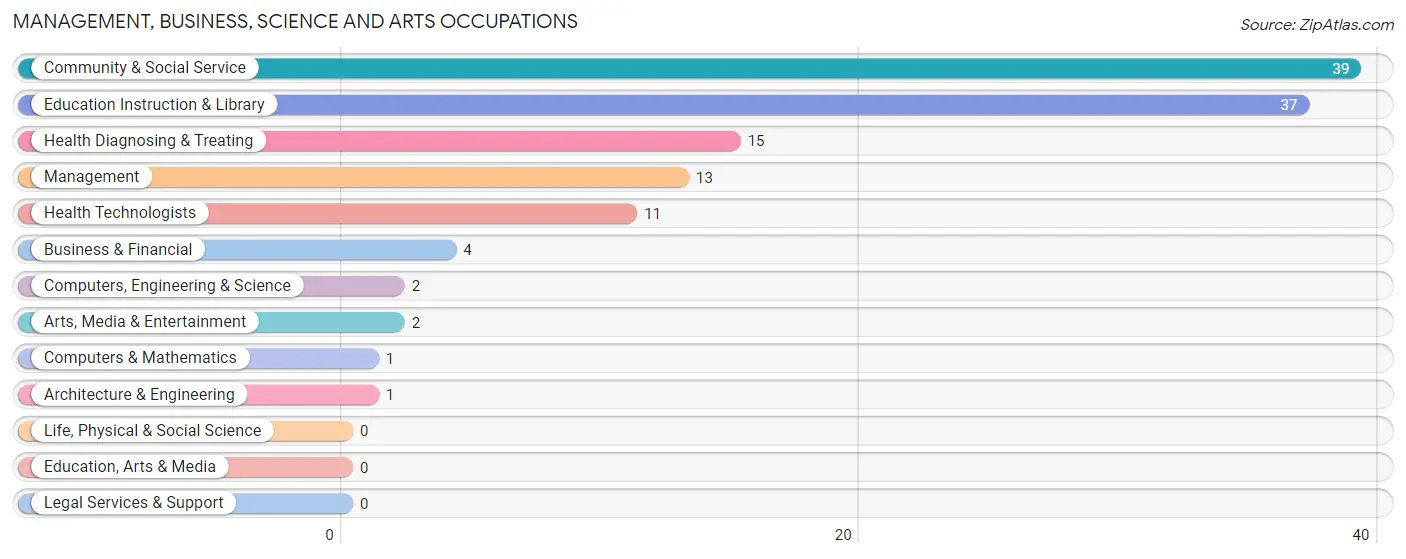
Management, Business, Science and Arts Occupations
The most common Management, Business, Science and Arts occupations in Abbeville are Community & Social Service (39 | 21.1%), Education Instruction & Library (37 | 20.0%), Health Diagnosing & Treating (15 | 8.1%), Management (13 | 7.0%), and Health Technologists (11 | 5.9%).
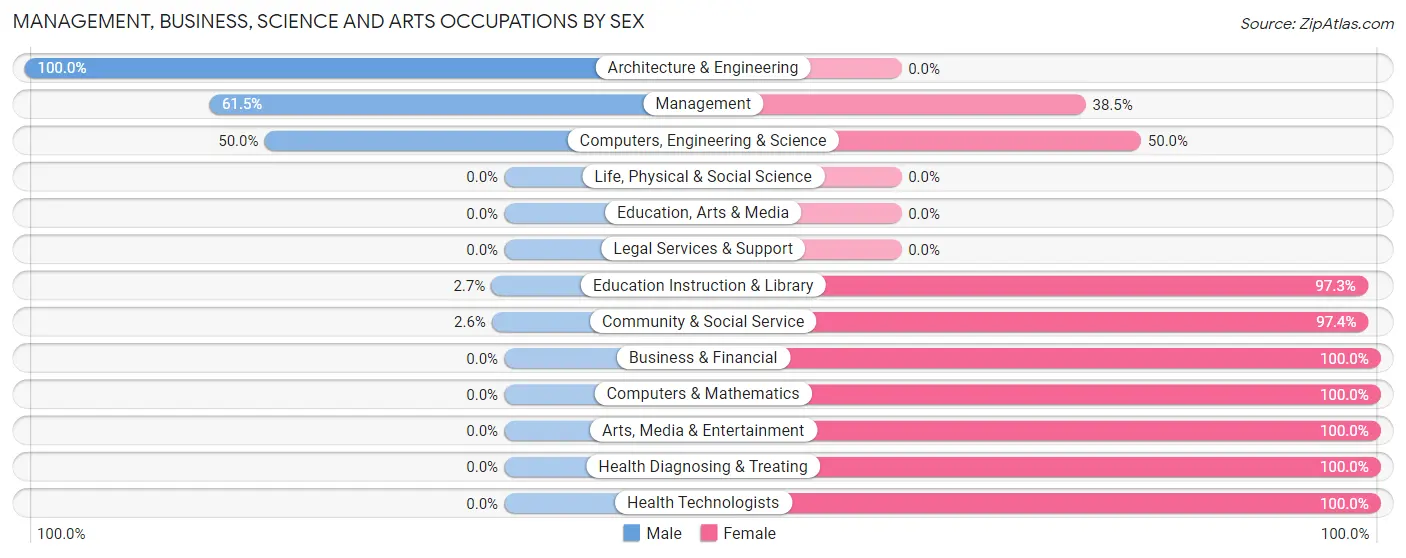
Management, Business, Science and Arts Occupations by Sex
Within the Management, Business, Science and Arts occupations in Abbeville, the most male-oriented occupations are Architecture & Engineering (100.0%), Management (61.5%), and Computers, Engineering & Science (50.0%), while the most female-oriented occupations are Business & Financial (100.0%), Computers & Mathematics (100.0%), and Arts, Media & Entertainment (100.0%).
| Occupation | Male | Female |
| Management | 8 (61.5%) | 5 (38.5%) |
| Business & Financial | 0 (0.0%) | 4 (100.0%) |
| Computers, Engineering & Science | 1 (50.0%) | 1 (50.0%) |
| Computers & Mathematics | 0 (0.0%) | 1 (100.0%) |
| Architecture & Engineering | 1 (100.0%) | 0 (0.0%) |
| Life, Physical & Social Science | 0 (0.0%) | 0 (0.0%) |
| Community & Social Service | 1 (2.6%) | 38 (97.4%) |
| Education, Arts & Media | 0 (0.0%) | 0 (0.0%) |
| Legal Services & Support | 0 (0.0%) | 0 (0.0%) |
| Education Instruction & Library | 1 (2.7%) | 36 (97.3%) |
| Arts, Media & Entertainment | 0 (0.0%) | 2 (100.0%) |
| Health Diagnosing & Treating | 0 (0.0%) | 15 (100.0%) |
| Health Technologists | 0 (0.0%) | 11 (100.0%) |
| Total (Category) | 10 (13.7%) | 63 (86.3%) |
| Total (Overall) | 59 (31.9%) | 126 (68.1%) |
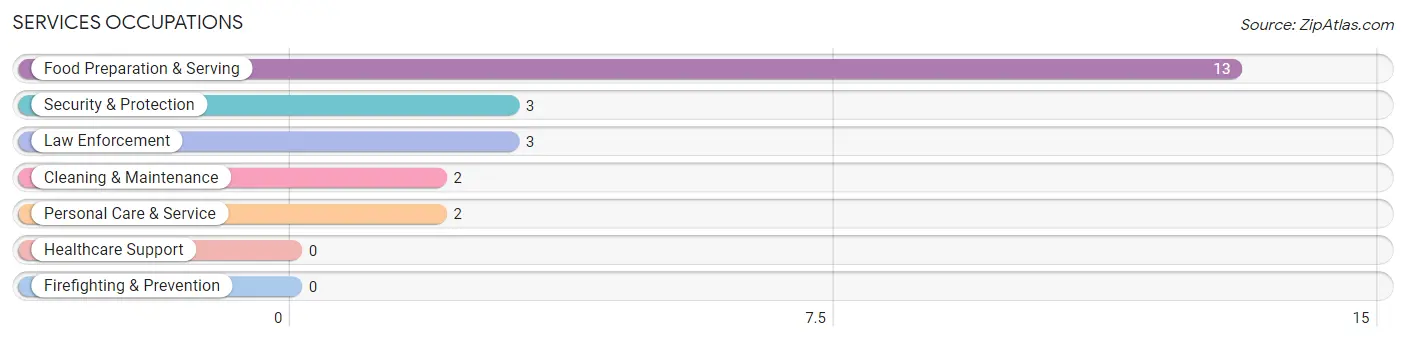
Services Occupations
The most common Services occupations in Abbeville are Food Preparation & Serving (13 | 7.0%), Security & Protection (3 | 1.6%), Law Enforcement (3 | 1.6%), Cleaning & Maintenance (2 | 1.1%), and Personal Care & Service (2 | 1.1%).
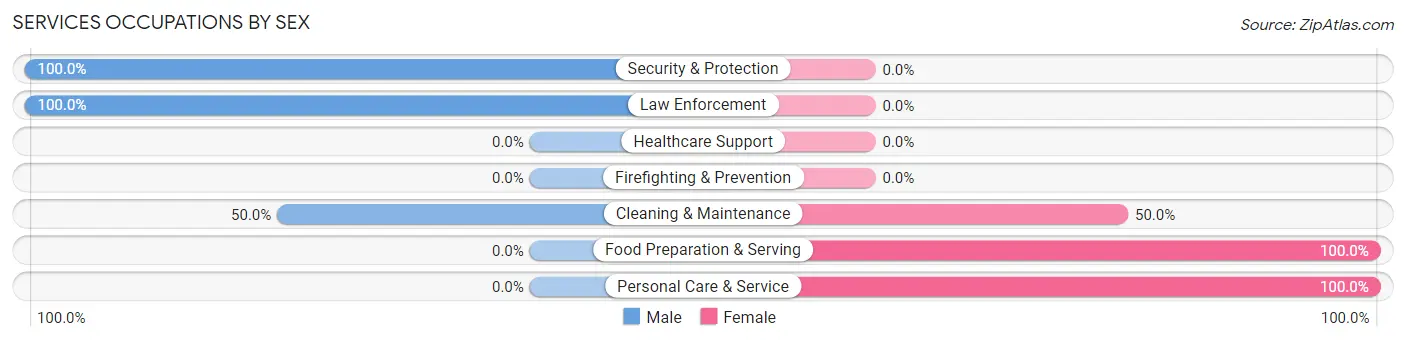
Services Occupations by Sex
Within the Services occupations in Abbeville, the most male-oriented occupations are Security & Protection (100.0%), Law Enforcement (100.0%), and Cleaning & Maintenance (50.0%), while the most female-oriented occupations are Food Preparation & Serving (100.0%), Personal Care & Service (100.0%), and Cleaning & Maintenance (50.0%).
| Occupation | Male | Female |
| Healthcare Support | 0 (0.0%) | 0 (0.0%) |
| Security & Protection | 3 (100.0%) | 0 (0.0%) |
| Firefighting & Prevention | 0 (0.0%) | 0 (0.0%) |
| Law Enforcement | 3 (100.0%) | 0 (0.0%) |
| Food Preparation & Serving | 0 (0.0%) | 13 (100.0%) |
| Cleaning & Maintenance | 1 (50.0%) | 1 (50.0%) |
| Personal Care & Service | 0 (0.0%) | 2 (100.0%) |
| Total (Category) | 4 (20.0%) | 16 (80.0%) |
| Total (Overall) | 59 (31.9%) | 126 (68.1%) |
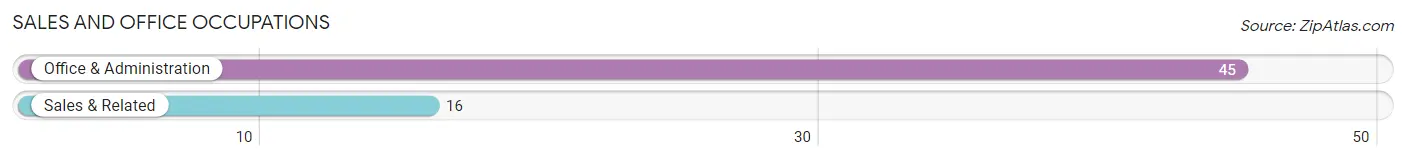
Sales and Office Occupations
The most common Sales and Office occupations in Abbeville are Office & Administration (45 | 24.3%), and Sales & Related (16 | 8.6%).
Sales and Office Occupations by Sex
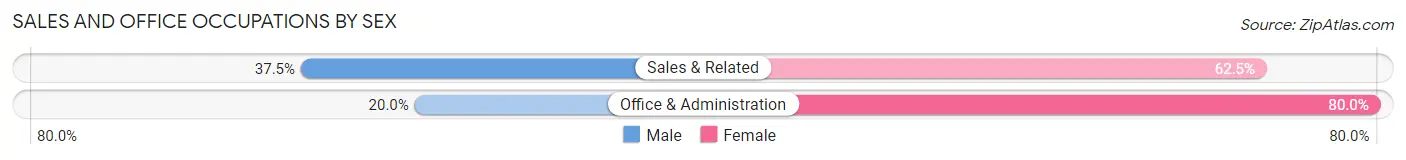
| Occupation | Male | Female |
| Sales & Related | 6 (37.5%) | 10 (62.5%) |
| Office & Administration | 9 (20.0%) | 36 (80.0%) |
| Total (Category) | 15 (24.6%) | 46 (75.4%) |
| Total (Overall) | 59 (31.9%) | 126 (68.1%) |
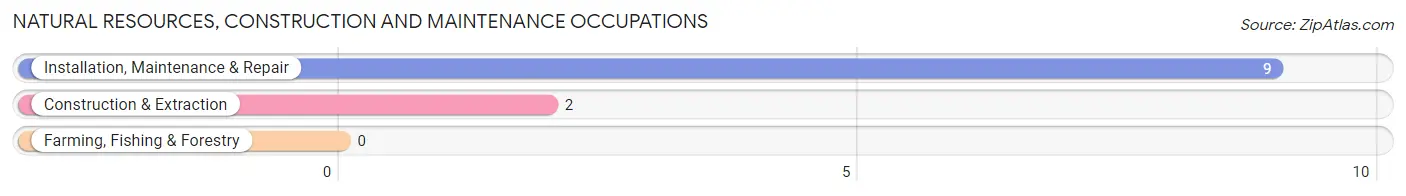
Natural Resources, Construction and Maintenance Occupations
The most common Natural Resources, Construction and Maintenance occupations in Abbeville are Installation, Maintenance & Repair (9 | 4.9%), and Construction & Extraction (2 | 1.1%).
Natural Resources, Construction and Maintenance Occupations by Sex
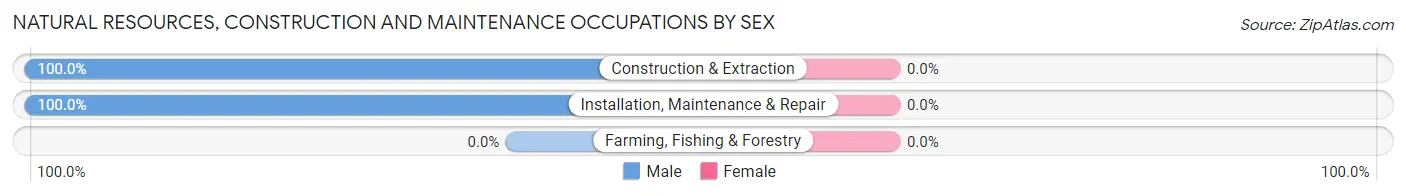
| Occupation | Male | Female |
| Farming, Fishing & Forestry | 0 (0.0%) | 0 (0.0%) |
| Construction & Extraction | 2 (100.0%) | 0 (0.0%) |
| Installation, Maintenance & Repair | 9 (100.0%) | 0 (0.0%) |
| Total (Category) | 11 (100.0%) | 0 (0.0%) |
| Total (Overall) | 59 (31.9%) | 126 (68.1%) |
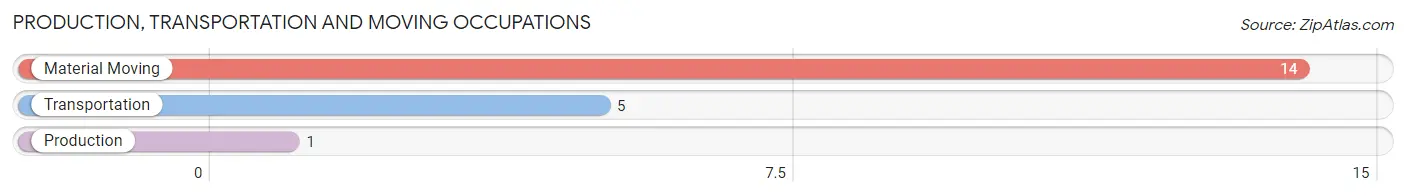
Production, Transportation and Moving Occupations
The most common Production, Transportation and Moving occupations in Abbeville are Material Moving (14 | 7.6%), Transportation (5 | 2.7%), and Production (1 | 0.5%).
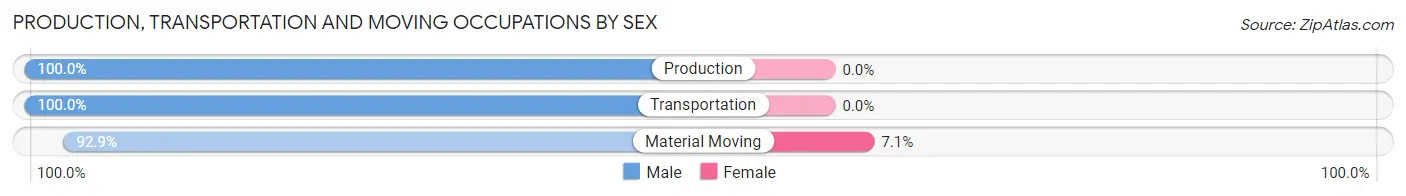
Production, Transportation and Moving Occupations by Sex
| Occupation | Male | Female |
| Production | 1 (100.0%) | 0 (0.0%) |
| Transportation | 5 (100.0%) | 0 (0.0%) |
| Material Moving | 13 (92.9%) | 1 (7.1%) |
| Total (Category) | 19 (95.0%) | 1 (5.0%) |
| Total (Overall) | 59 (31.9%) | 126 (68.1%) |
Employment Industries by Sex in Abbeville
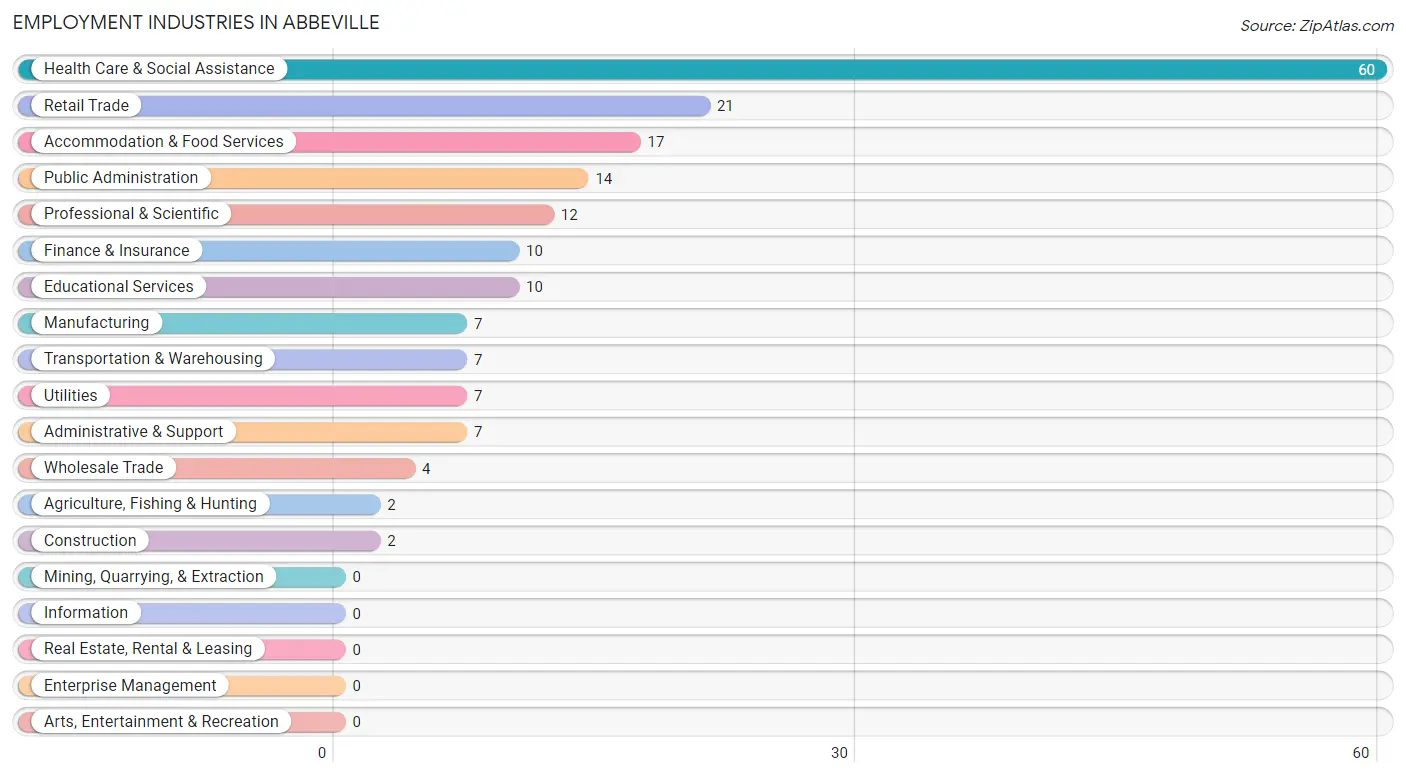
Employment Industries in Abbeville
The major employment industries in Abbeville include Health Care & Social Assistance (60 | 32.4%), Retail Trade (21 | 11.4%), Accommodation & Food Services (17 | 9.2%), Public Administration (14 | 7.6%), and Professional & Scientific (12 | 6.5%).
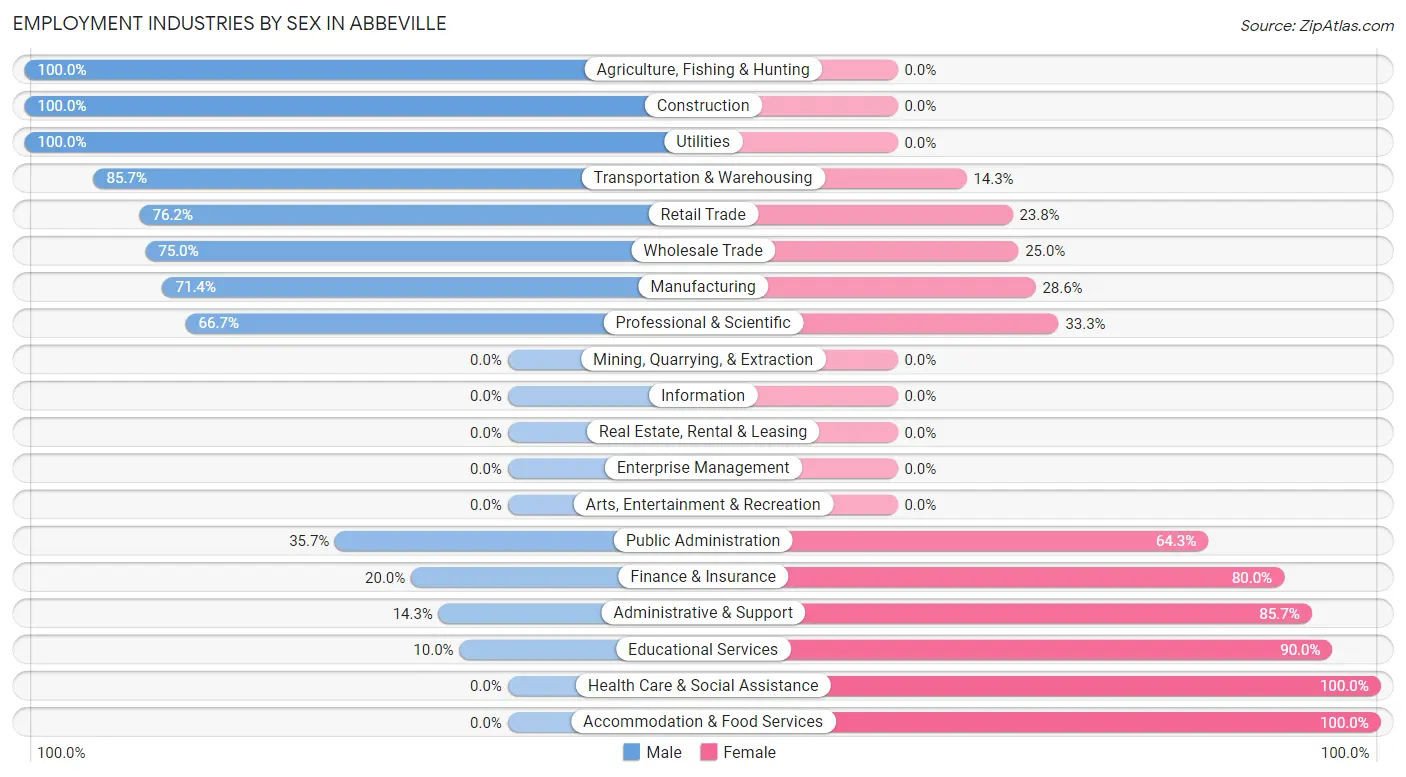
Employment Industries by Sex in Abbeville
The Abbeville industries that see more men than women are Agriculture, Fishing & Hunting (100.0%), Construction (100.0%), and Utilities (100.0%), whereas the industries that tend to have a higher number of women are Health Care & Social Assistance (100.0%), Accommodation & Food Services (100.0%), and Educational Services (90.0%).
| Industry | Male | Female |
| Agriculture, Fishing & Hunting | 2 (100.0%) | 0 (0.0%) |
| Mining, Quarrying, & Extraction | 0 (0.0%) | 0 (0.0%) |
| Construction | 2 (100.0%) | 0 (0.0%) |
| Manufacturing | 5 (71.4%) | 2 (28.6%) |
| Wholesale Trade | 3 (75.0%) | 1 (25.0%) |
| Retail Trade | 16 (76.2%) | 5 (23.8%) |
| Transportation & Warehousing | 6 (85.7%) | 1 (14.3%) |
| Utilities | 7 (100.0%) | 0 (0.0%) |
| Information | 0 (0.0%) | 0 (0.0%) |
| Finance & Insurance | 2 (20.0%) | 8 (80.0%) |
| Real Estate, Rental & Leasing | 0 (0.0%) | 0 (0.0%) |
| Professional & Scientific | 8 (66.7%) | 4 (33.3%) |
| Enterprise Management | 0 (0.0%) | 0 (0.0%) |
| Administrative & Support | 1 (14.3%) | 6 (85.7%) |
| Educational Services | 1 (10.0%) | 9 (90.0%) |
| Health Care & Social Assistance | 0 (0.0%) | 60 (100.0%) |
| Arts, Entertainment & Recreation | 0 (0.0%) | 0 (0.0%) |
| Accommodation & Food Services | 0 (0.0%) | 17 (100.0%) |
| Public Administration | 5 (35.7%) | 9 (64.3%) |
| Total | 59 (31.9%) | 126 (68.1%) |
Education in Abbeville
School Enrollment in Abbeville
The most common levels of schooling among the 137 students in Abbeville are high school (42 | 30.7%), elementary school (34 | 24.8%), and college / undergraduate (28 | 20.4%).
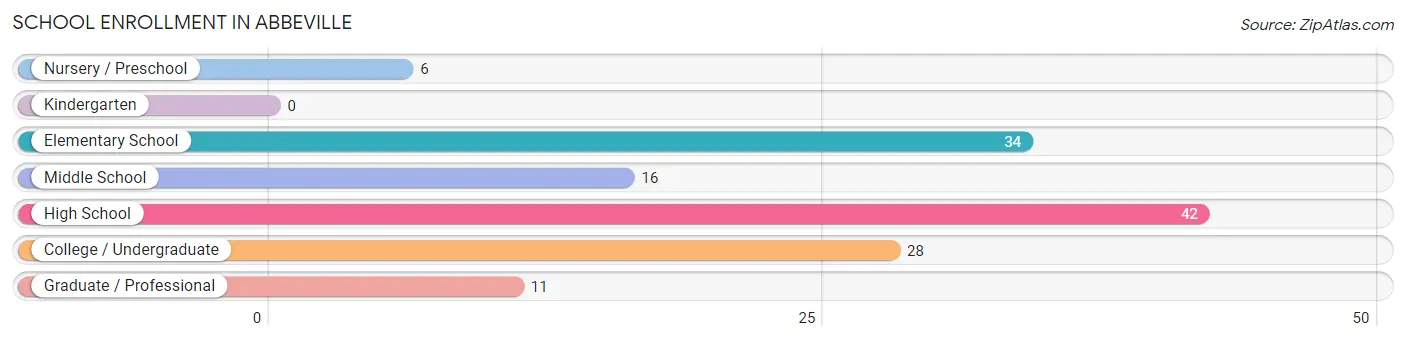
| School Level | # Students | % Students |
| Nursery / Preschool | 6 | 4.4% |
| Kindergarten | 0 | 0.0% |
| Elementary School | 34 | 24.8% |
| Middle School | 16 | 11.7% |
| High School | 42 | 30.7% |
| College / Undergraduate | 28 | 20.4% |
| Graduate / Professional | 11 | 8.0% |
| Total | 137 | 100.0% |
School Enrollment by Age by Funding Source in Abbeville
Out of a total of 137 students who are enrolled in schools in Abbeville, 14 (10.2%) attend a private institution, while the remaining 123 (89.8%) are enrolled in public schools. The age group of 3 to 4 year olds has the highest likelihood of being enrolled in private schools, with 3 (50.0% in the age bracket) enrolled. Conversely, the age group of 5 to 9 year old has the lowest likelihood of being enrolled in a private school, with 16 (100.0% in the age bracket) attending a public institution.
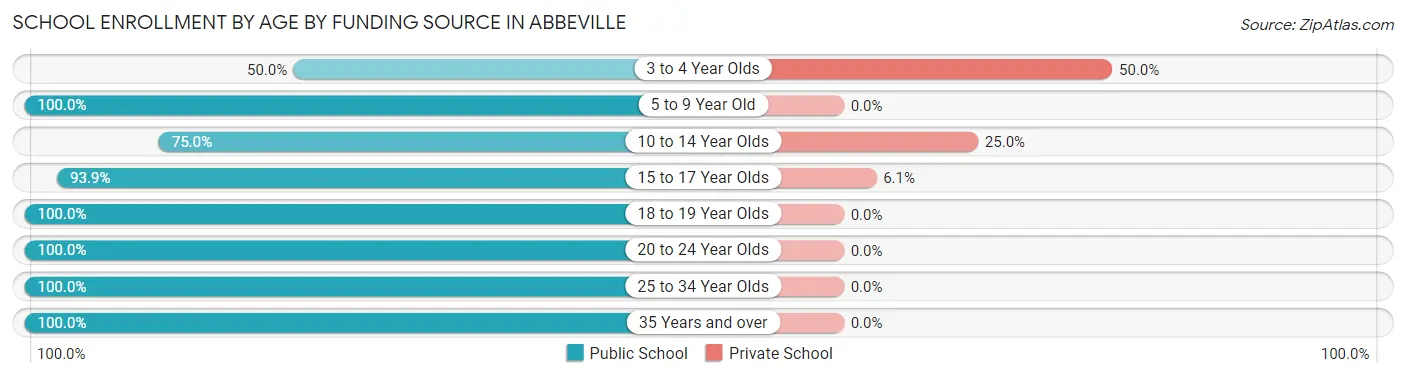
| Age Bracket | Public School | Private School |
| 3 to 4 Year Olds | 3 (50.0%) | 3 (50.0%) |
| 5 to 9 Year Old | 16 (100.0%) | 0 (0.0%) |
| 10 to 14 Year Olds | 27 (75.0%) | 9 (25.0%) |
| 15 to 17 Year Olds | 31 (93.9%) | 2 (6.1%) |
| 18 to 19 Year Olds | 15 (100.0%) | 0 (0.0%) |
| 20 to 24 Year Olds | 20 (100.0%) | 0 (0.0%) |
| 25 to 34 Year Olds | 10 (100.0%) | 0 (0.0%) |
| 35 Years and over | 1 (100.0%) | 0 (0.0%) |
| Total | 123 (89.8%) | 14 (10.2%) |
Educational Attainment by Field of Study in Abbeville
Business (13 | 29.5%), psychology (12 | 27.3%), education (5 | 11.4%), arts & humanities (5 | 11.4%), and literature & languages (3 | 6.8%) are the most common fields of study among 44 individuals in Abbeville who have obtained a bachelor's degree or higher.
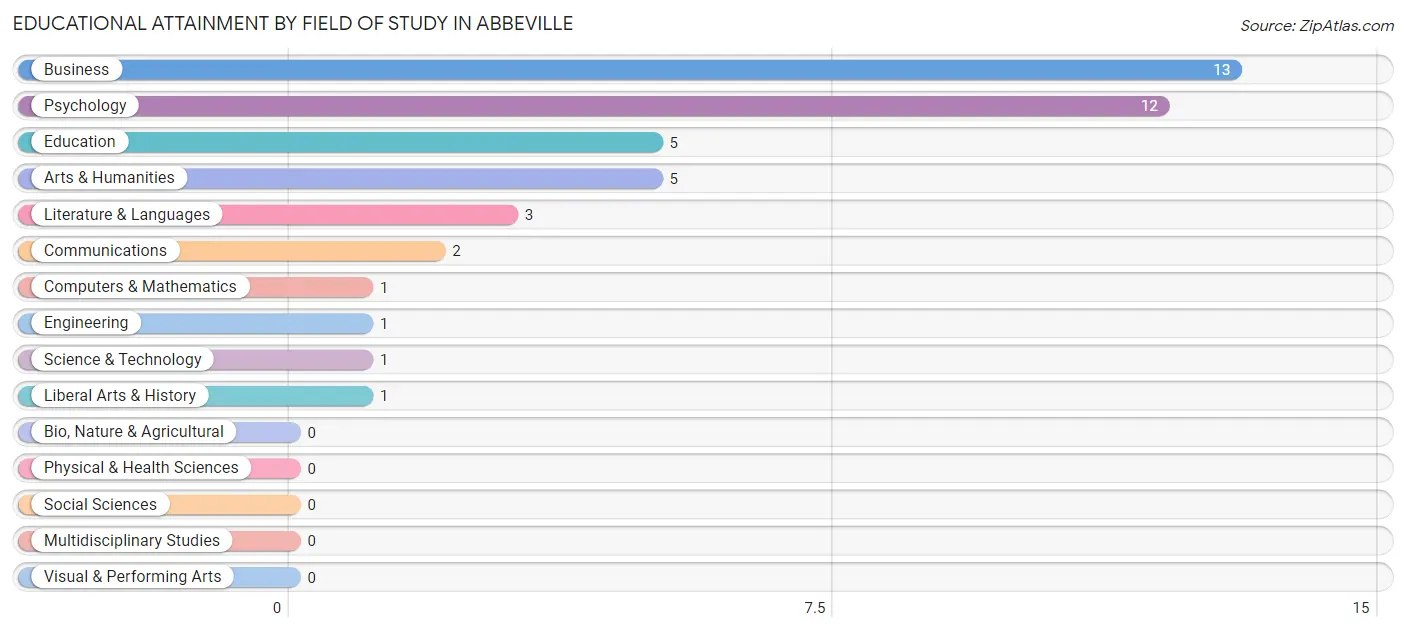
| Field of Study | # Graduates | % Graduates |
| Computers & Mathematics | 1 | 2.3% |
| Bio, Nature & Agricultural | 0 | 0.0% |
| Physical & Health Sciences | 0 | 0.0% |
| Psychology | 12 | 27.3% |
| Social Sciences | 0 | 0.0% |
| Engineering | 1 | 2.3% |
| Multidisciplinary Studies | 0 | 0.0% |
| Science & Technology | 1 | 2.3% |
| Business | 13 | 29.5% |
| Education | 5 | 11.4% |
| Literature & Languages | 3 | 6.8% |
| Liberal Arts & History | 1 | 2.3% |
| Visual & Performing Arts | 0 | 0.0% |
| Communications | 2 | 4.5% |
| Arts & Humanities | 5 | 11.4% |
| Total | 44 | 100.0% |
Transportation & Commute in Abbeville
Vehicle Availability by Sex in Abbeville
The most prevalent vehicle ownership categories in Abbeville are males with 3 vehicles (22, accounting for 37.3%) and females with 3 vehicles (54, making up 17.5%).
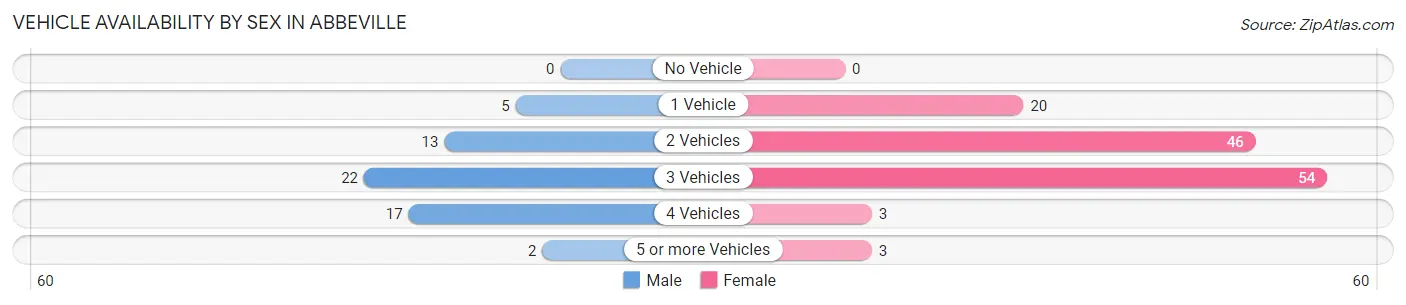
| Vehicles Available | Male | Female |
| No Vehicle | 0 (0.0%) | 0 (0.0%) |
| 1 Vehicle | 5 (8.5%) | 20 (15.9%) |
| 2 Vehicles | 13 (22.0%) | 46 (36.5%) |
| 3 Vehicles | 22 (37.3%) | 54 (42.9%) |
| 4 Vehicles | 17 (28.8%) | 3 (2.4%) |
| 5 or more Vehicles | 2 (3.4%) | 3 (2.4%) |
| Total | 59 (100.0%) | 126 (100.0%) |
Commute Time in Abbeville
The most frequently occuring commute durations in Abbeville are 20 to 24 minutes (62 commuters, 36.7%), 15 to 19 minutes (45 commuters, 26.6%), and 45 to 59 minutes (19 commuters, 11.2%).
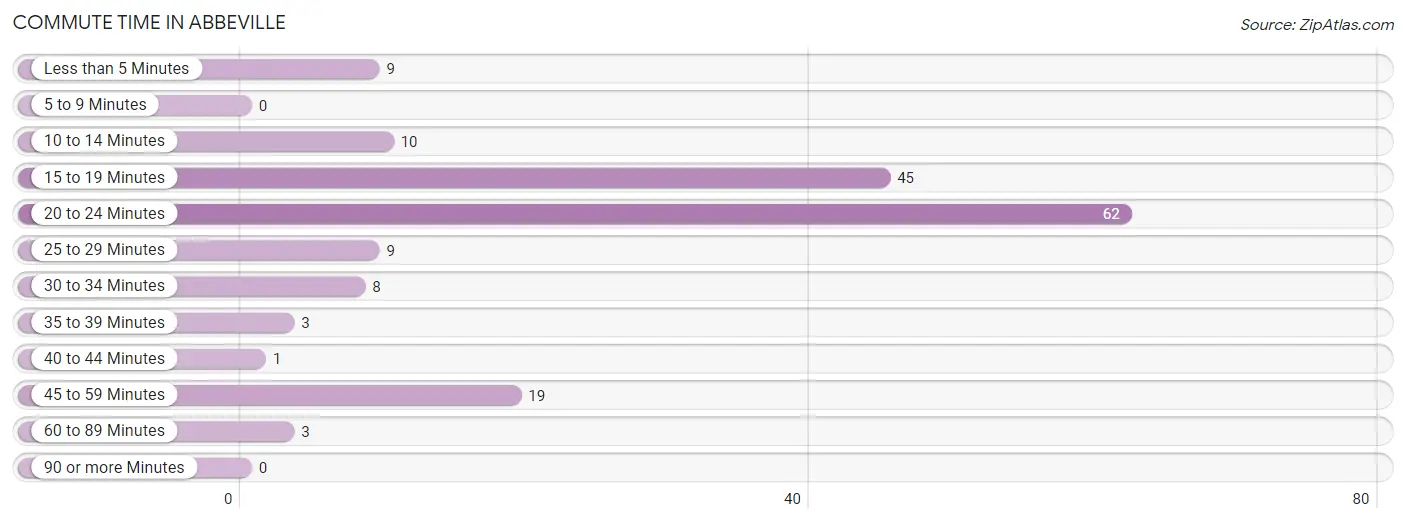
| Commute Time | # Commuters | % Commuters |
| Less than 5 Minutes | 9 | 5.3% |
| 5 to 9 Minutes | 0 | 0.0% |
| 10 to 14 Minutes | 10 | 5.9% |
| 15 to 19 Minutes | 45 | 26.6% |
| 20 to 24 Minutes | 62 | 36.7% |
| 25 to 29 Minutes | 9 | 5.3% |
| 30 to 34 Minutes | 8 | 4.7% |
| 35 to 39 Minutes | 3 | 1.8% |
| 40 to 44 Minutes | 1 | 0.6% |
| 45 to 59 Minutes | 19 | 11.2% |
| 60 to 89 Minutes | 3 | 1.8% |
| 90 or more Minutes | 0 | 0.0% |
Commute Time by Sex in Abbeville
The most common commute times in Abbeville are 45 to 59 minutes (16 commuters, 30.8%) for males and 20 to 24 minutes (59 commuters, 50.4%) for females.
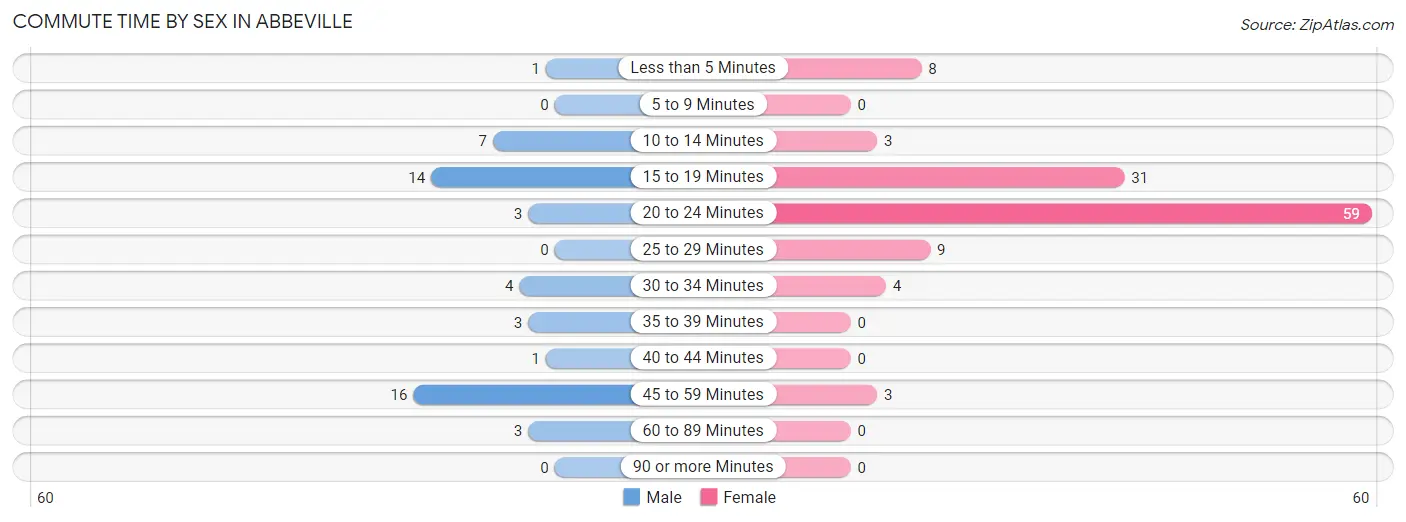
| Commute Time | Male | Female |
| Less than 5 Minutes | 1 (1.9%) | 8 (6.8%) |
| 5 to 9 Minutes | 0 (0.0%) | 0 (0.0%) |
| 10 to 14 Minutes | 7 (13.5%) | 3 (2.6%) |
| 15 to 19 Minutes | 14 (26.9%) | 31 (26.5%) |
| 20 to 24 Minutes | 3 (5.8%) | 59 (50.4%) |
| 25 to 29 Minutes | 0 (0.0%) | 9 (7.7%) |
| 30 to 34 Minutes | 4 (7.7%) | 4 (3.4%) |
| 35 to 39 Minutes | 3 (5.8%) | 0 (0.0%) |
| 40 to 44 Minutes | 1 (1.9%) | 0 (0.0%) |
| 45 to 59 Minutes | 16 (30.8%) | 3 (2.6%) |
| 60 to 89 Minutes | 3 (5.8%) | 0 (0.0%) |
| 90 or more Minutes | 0 (0.0%) | 0 (0.0%) |
Time of Departure to Work by Sex in Abbeville
The most frequent times of departure to work in Abbeville are 7:00 AM to 7:29 AM (15, 28.8%) for males and 7:30 AM to 7:59 AM (46, 39.3%) for females.
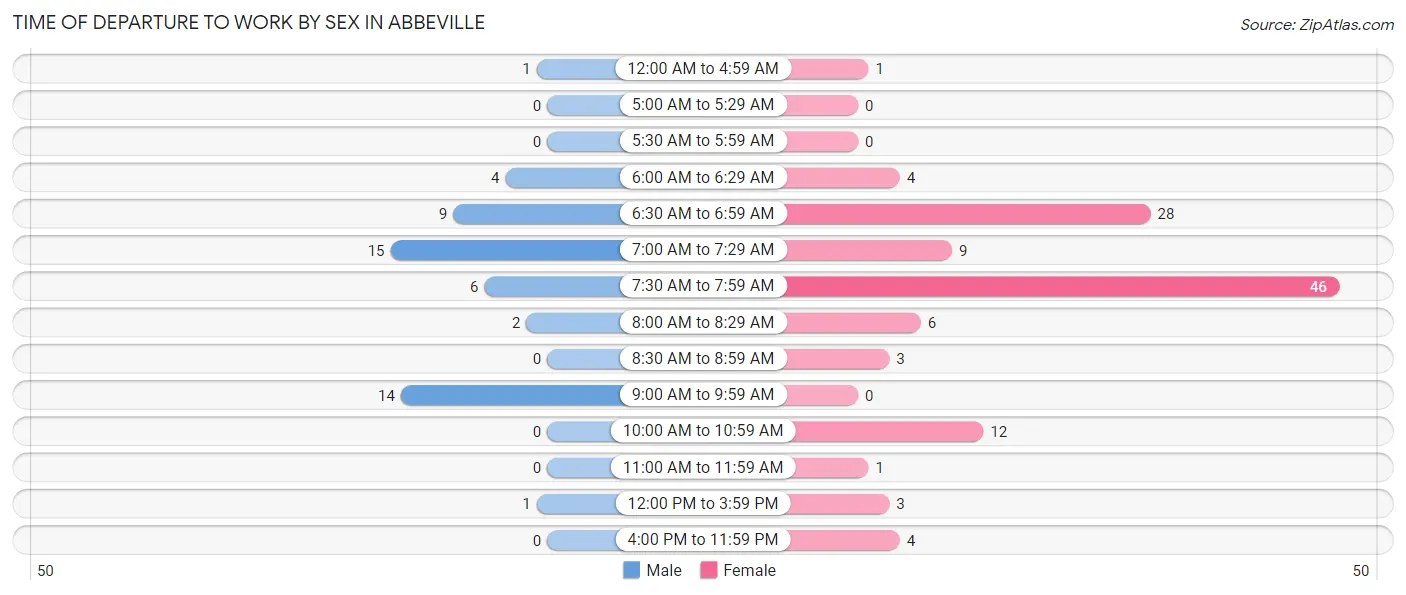
| Time of Departure | Male | Female |
| 12:00 AM to 4:59 AM | 1 (1.9%) | 1 (0.9%) |
| 5:00 AM to 5:29 AM | 0 (0.0%) | 0 (0.0%) |
| 5:30 AM to 5:59 AM | 0 (0.0%) | 0 (0.0%) |
| 6:00 AM to 6:29 AM | 4 (7.7%) | 4 (3.4%) |
| 6:30 AM to 6:59 AM | 9 (17.3%) | 28 (23.9%) |
| 7:00 AM to 7:29 AM | 15 (28.8%) | 9 (7.7%) |
| 7:30 AM to 7:59 AM | 6 (11.5%) | 46 (39.3%) |
| 8:00 AM to 8:29 AM | 2 (3.8%) | 6 (5.1%) |
| 8:30 AM to 8:59 AM | 0 (0.0%) | 3 (2.6%) |
| 9:00 AM to 9:59 AM | 14 (26.9%) | 0 (0.0%) |
| 10:00 AM to 10:59 AM | 0 (0.0%) | 12 (10.3%) |
| 11:00 AM to 11:59 AM | 0 (0.0%) | 1 (0.9%) |
| 12:00 PM to 3:59 PM | 1 (1.9%) | 3 (2.6%) |
| 4:00 PM to 11:59 PM | 0 (0.0%) | 4 (3.4%) |
| Total | 52 (100.0%) | 117 (100.0%) |
Housing Occupancy in Abbeville
Occupancy by Ownership in Abbeville
Of the total 116 dwellings in Abbeville, owner-occupied units account for 89 (76.7%), while renter-occupied units make up 27 (23.3%).
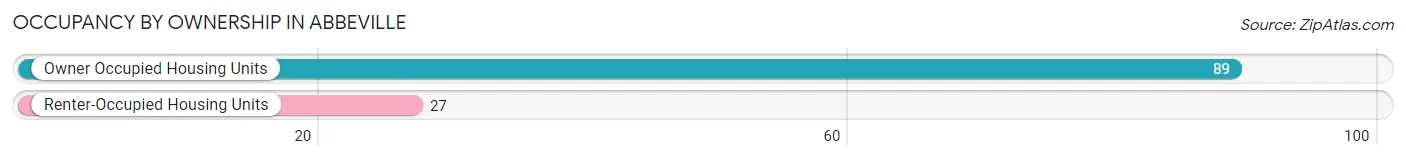
| Occupancy | # Housing Units | % Housing Units |
| Owner Occupied Housing Units | 89 | 76.7% |
| Renter-Occupied Housing Units | 27 | 23.3% |
| Total Occupied Housing Units | 116 | 100.0% |
Occupancy by Household Size in Abbeville
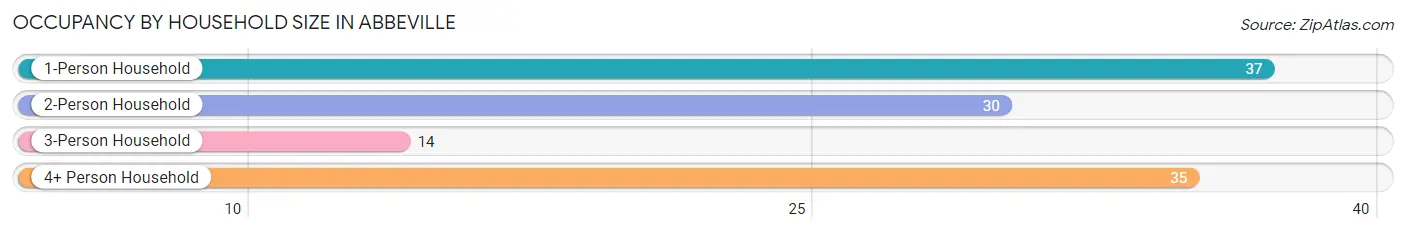
| Household Size | # Housing Units | % Housing Units |
| 1-Person Household | 37 | 31.9% |
| 2-Person Household | 30 | 25.9% |
| 3-Person Household | 14 | 12.1% |
| 4+ Person Household | 35 | 30.2% |
| Total Housing Units | 116 | 100.0% |
Occupancy by Ownership by Household Size in Abbeville
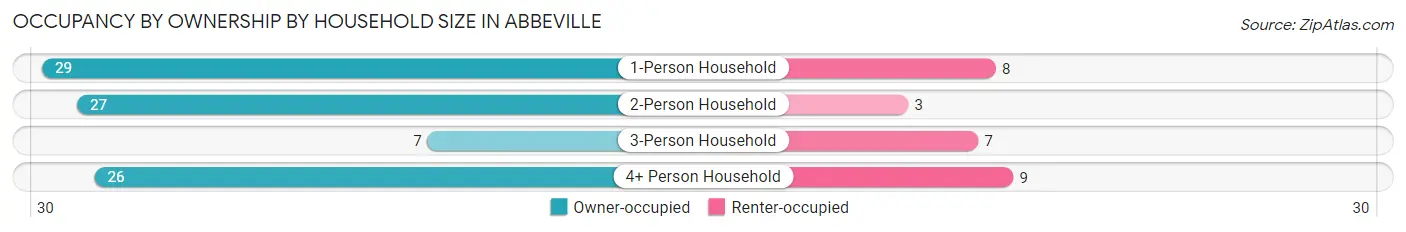
| Household Size | Owner-occupied | Renter-occupied |
| 1-Person Household | 29 (78.4%) | 8 (21.6%) |
| 2-Person Household | 27 (90.0%) | 3 (10.0%) |
| 3-Person Household | 7 (50.0%) | 7 (50.0%) |
| 4+ Person Household | 26 (74.3%) | 9 (25.7%) |
| Total Housing Units | 89 (76.7%) | 27 (23.3%) |
Occupancy by Educational Attainment in Abbeville
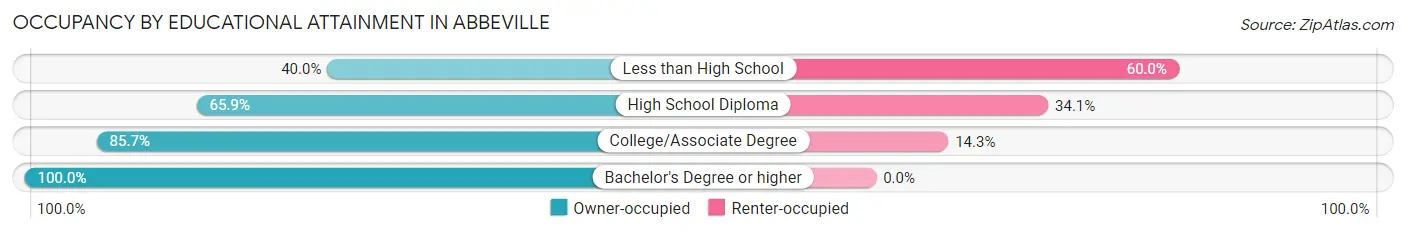
| Household Size | Owner-occupied | Renter-occupied |
| Less than High School | 4 (40.0%) | 6 (60.0%) |
| High School Diploma | 29 (65.9%) | 15 (34.1%) |
| College/Associate Degree | 36 (85.7%) | 6 (14.3%) |
| Bachelor's Degree or higher | 20 (100.0%) | 0 (0.0%) |
Occupancy by Age of Householder in Abbeville
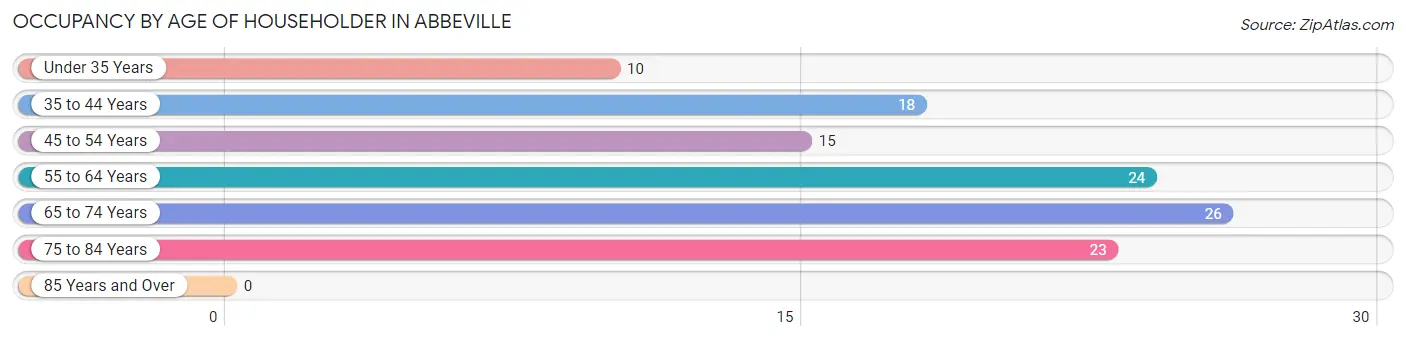
| Age Bracket | # Households | % Households |
| Under 35 Years | 10 | 8.6% |
| 35 to 44 Years | 18 | 15.5% |
| 45 to 54 Years | 15 | 12.9% |
| 55 to 64 Years | 24 | 20.7% |
| 65 to 74 Years | 26 | 22.4% |
| 75 to 84 Years | 23 | 19.8% |
| 85 Years and Over | 0 | 0.0% |
| Total | 116 | 100.0% |
Housing Finances in Abbeville
Median Income by Occupancy in Abbeville
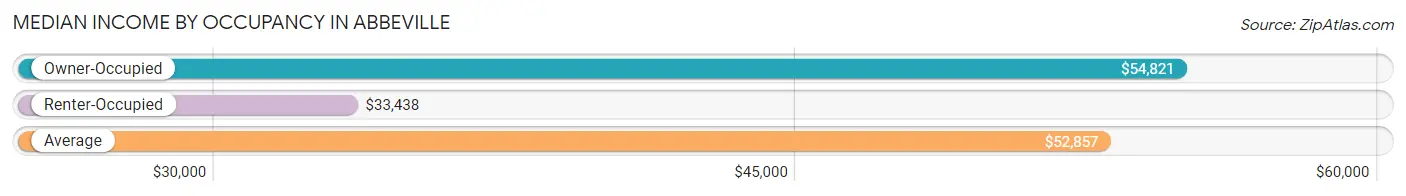
| Occupancy Type | # Households | Median Income |
| Owner-Occupied | 89 (76.7%) | $54,821 |
| Renter-Occupied | 27 (23.3%) | $33,438 |
| Average | 116 (100.0%) | $52,857 |
Occupancy by Householder Income Bracket in Abbeville
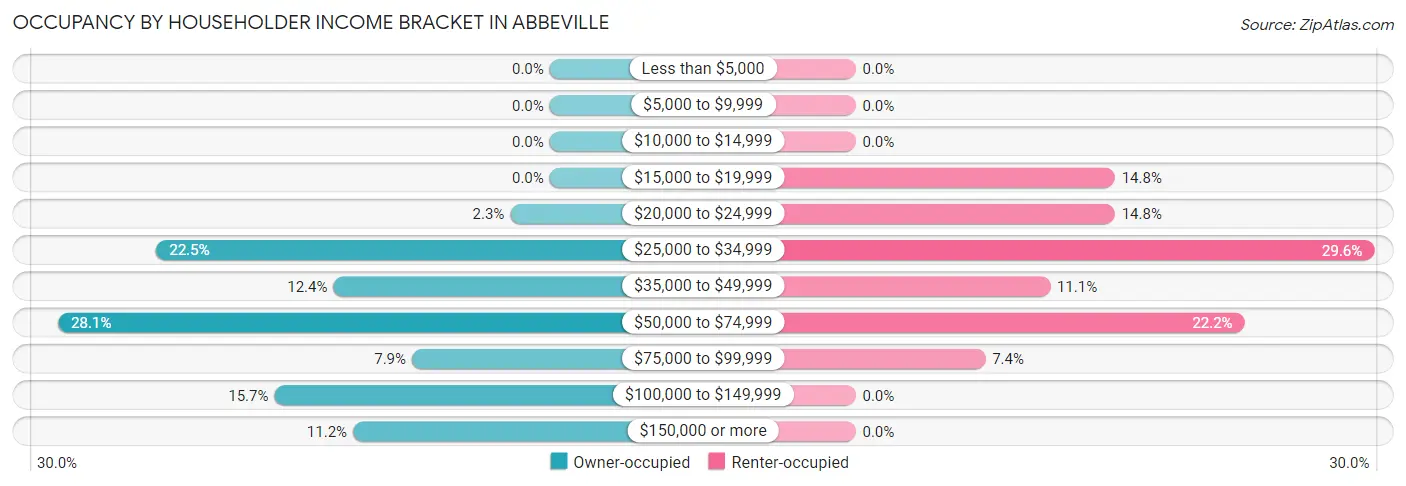
| Income Bracket | Owner-occupied | Renter-occupied |
| Less than $5,000 | 0 (0.0%) | 0 (0.0%) |
| $5,000 to $9,999 | 0 (0.0%) | 0 (0.0%) |
| $10,000 to $14,999 | 0 (0.0%) | 0 (0.0%) |
| $15,000 to $19,999 | 0 (0.0%) | 4 (14.8%) |
| $20,000 to $24,999 | 2 (2.2%) | 4 (14.8%) |
| $25,000 to $34,999 | 20 (22.5%) | 8 (29.6%) |
| $35,000 to $49,999 | 11 (12.4%) | 3 (11.1%) |
| $50,000 to $74,999 | 25 (28.1%) | 6 (22.2%) |
| $75,000 to $99,999 | 7 (7.9%) | 2 (7.4%) |
| $100,000 to $149,999 | 14 (15.7%) | 0 (0.0%) |
| $150,000 or more | 10 (11.2%) | 0 (0.0%) |
| Total | 89 (100.0%) | 27 (100.0%) |
Monthly Housing Cost Tiers in Abbeville
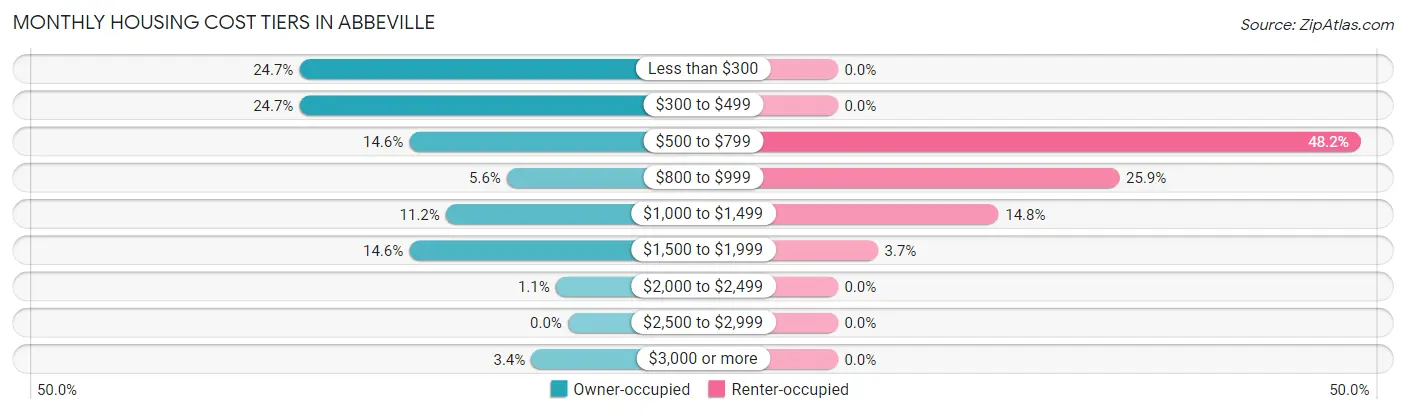
| Monthly Cost | Owner-occupied | Renter-occupied |
| Less than $300 | 22 (24.7%) | 0 (0.0%) |
| $300 to $499 | 22 (24.7%) | 0 (0.0%) |
| $500 to $799 | 13 (14.6%) | 13 (48.1%) |
| $800 to $999 | 5 (5.6%) | 7 (25.9%) |
| $1,000 to $1,499 | 10 (11.2%) | 4 (14.8%) |
| $1,500 to $1,999 | 13 (14.6%) | 1 (3.7%) |
| $2,000 to $2,499 | 1 (1.1%) | 0 (0.0%) |
| $2,500 to $2,999 | 0 (0.0%) | 0 (0.0%) |
| $3,000 or more | 3 (3.4%) | 0 (0.0%) |
| Total | 89 (100.0%) | 27 (100.0%) |
Physical Housing Characteristics in Abbeville
Housing Structures in Abbeville
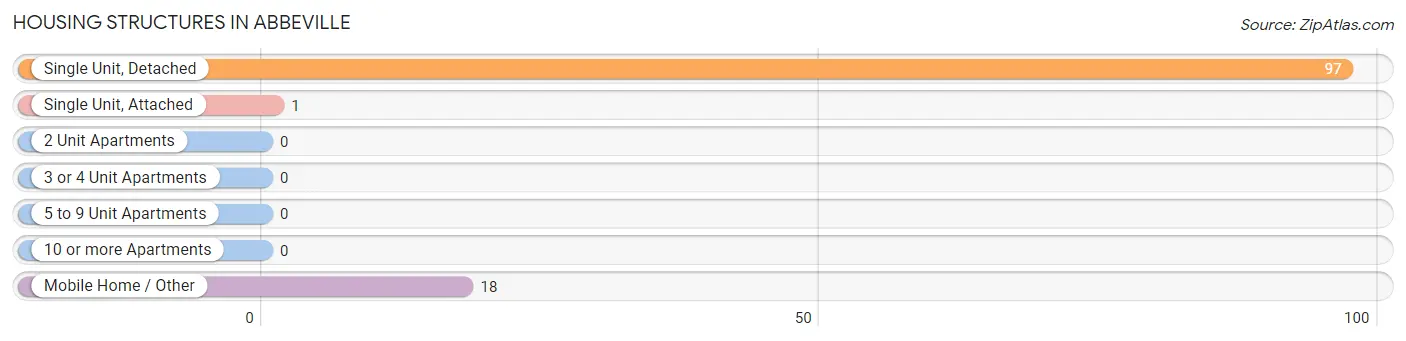
| Structure Type | # Housing Units | % Housing Units |
| Single Unit, Detached | 97 | 83.6% |
| Single Unit, Attached | 1 | 0.9% |
| 2 Unit Apartments | 0 | 0.0% |
| 3 or 4 Unit Apartments | 0 | 0.0% |
| 5 to 9 Unit Apartments | 0 | 0.0% |
| 10 or more Apartments | 0 | 0.0% |
| Mobile Home / Other | 18 | 15.5% |
| Total | 116 | 100.0% |
Housing Structures by Occupancy in Abbeville
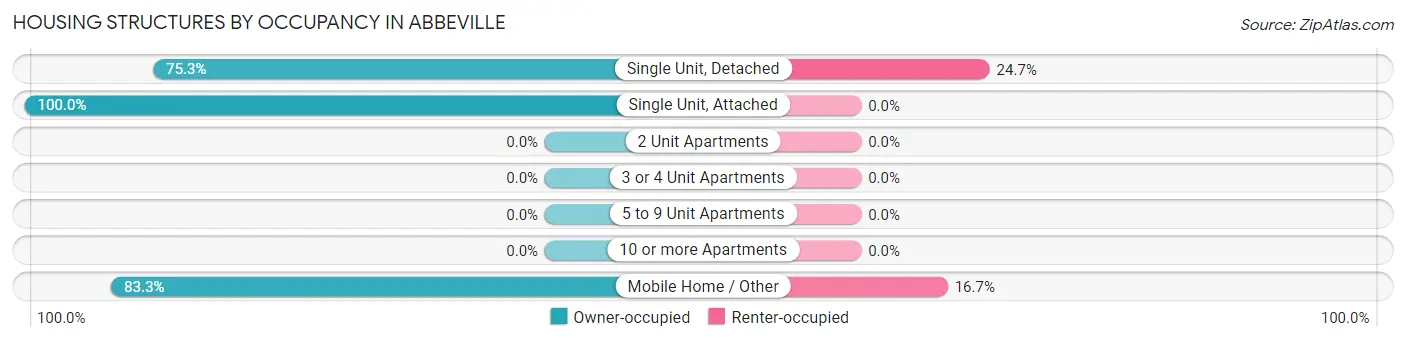
| Structure Type | Owner-occupied | Renter-occupied |
| Single Unit, Detached | 73 (75.3%) | 24 (24.7%) |
| Single Unit, Attached | 1 (100.0%) | 0 (0.0%) |
| 2 Unit Apartments | 0 (0.0%) | 0 (0.0%) |
| 3 or 4 Unit Apartments | 0 (0.0%) | 0 (0.0%) |
| 5 to 9 Unit Apartments | 0 (0.0%) | 0 (0.0%) |
| 10 or more Apartments | 0 (0.0%) | 0 (0.0%) |
| Mobile Home / Other | 15 (83.3%) | 3 (16.7%) |
| Total | 89 (76.7%) | 27 (23.3%) |
Housing Structures by Number of Rooms in Abbeville
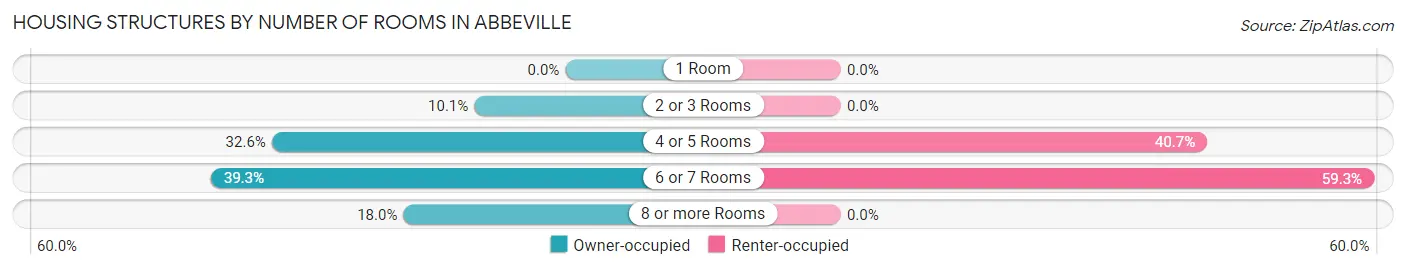
| Number of Rooms | Owner-occupied | Renter-occupied |
| 1 Room | 0 (0.0%) | 0 (0.0%) |
| 2 or 3 Rooms | 9 (10.1%) | 0 (0.0%) |
| 4 or 5 Rooms | 29 (32.6%) | 11 (40.7%) |
| 6 or 7 Rooms | 35 (39.3%) | 16 (59.3%) |
| 8 or more Rooms | 16 (18.0%) | 0 (0.0%) |
| Total | 89 (100.0%) | 27 (100.0%) |
Housing Structure by Heating Type in Abbeville
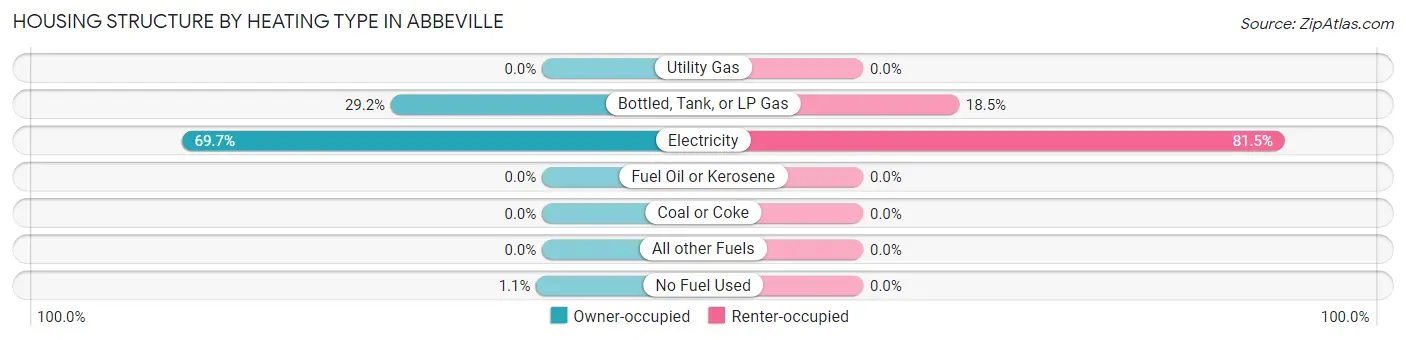
| Heating Type | Owner-occupied | Renter-occupied |
| Utility Gas | 0 (0.0%) | 0 (0.0%) |
| Bottled, Tank, or LP Gas | 26 (29.2%) | 5 (18.5%) |
| Electricity | 62 (69.7%) | 22 (81.5%) |
| Fuel Oil or Kerosene | 0 (0.0%) | 0 (0.0%) |
| Coal or Coke | 0 (0.0%) | 0 (0.0%) |
| All other Fuels | 0 (0.0%) | 0 (0.0%) |
| No Fuel Used | 1 (1.1%) | 0 (0.0%) |
| Total | 89 (100.0%) | 27 (100.0%) |
Household Vehicle Usage in Abbeville
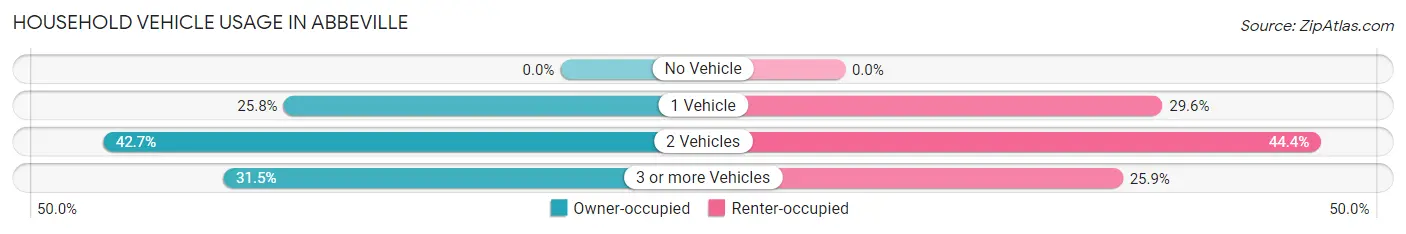
| Vehicles per Household | Owner-occupied | Renter-occupied |
| No Vehicle | 0 (0.0%) | 0 (0.0%) |
| 1 Vehicle | 23 (25.8%) | 8 (29.6%) |
| 2 Vehicles | 38 (42.7%) | 12 (44.4%) |
| 3 or more Vehicles | 28 (31.5%) | 7 (25.9%) |
| Total | 89 (100.0%) | 27 (100.0%) |
Real Estate & Mortgages in Abbeville
Real Estate and Mortgage Overview in Abbeville
| Characteristic | Without Mortgage | With Mortgage |
| Housing Units | 55 | 34 |
| Median Property Value | $134,400 | $185,700 |
| Median Household Income | $53,393 | $6 |
| Monthly Housing Costs | $367 | $3 |
| Real Estate Taxes | $680 | $4 |
Property Value by Mortgage Status in Abbeville
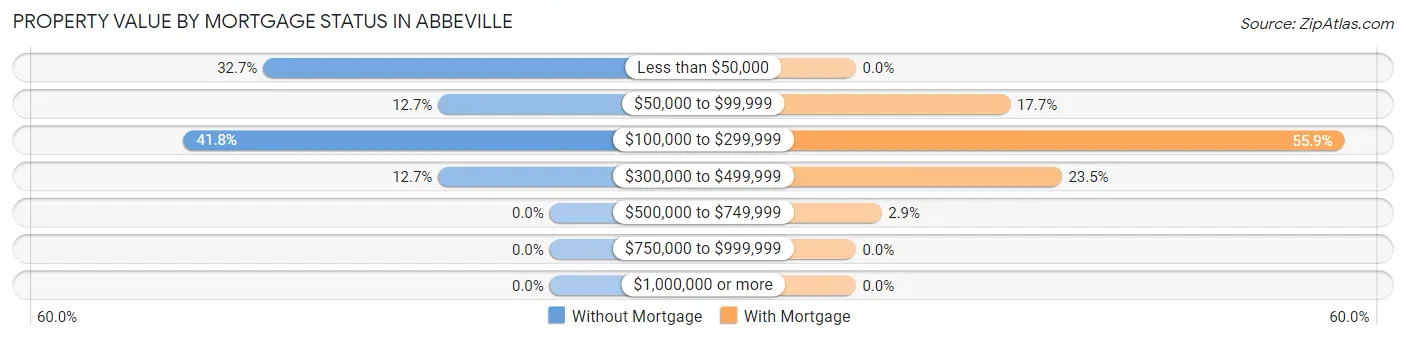
| Property Value | Without Mortgage | With Mortgage |
| Less than $50,000 | 18 (32.7%) | 0 (0.0%) |
| $50,000 to $99,999 | 7 (12.7%) | 6 (17.6%) |
| $100,000 to $299,999 | 23 (41.8%) | 19 (55.9%) |
| $300,000 to $499,999 | 7 (12.7%) | 8 (23.5%) |
| $500,000 to $749,999 | 0 (0.0%) | 1 (2.9%) |
| $750,000 to $999,999 | 0 (0.0%) | 0 (0.0%) |
| $1,000,000 or more | 0 (0.0%) | 0 (0.0%) |
| Total | 55 (100.0%) | 34 (100.0%) |
Household Income by Mortgage Status in Abbeville
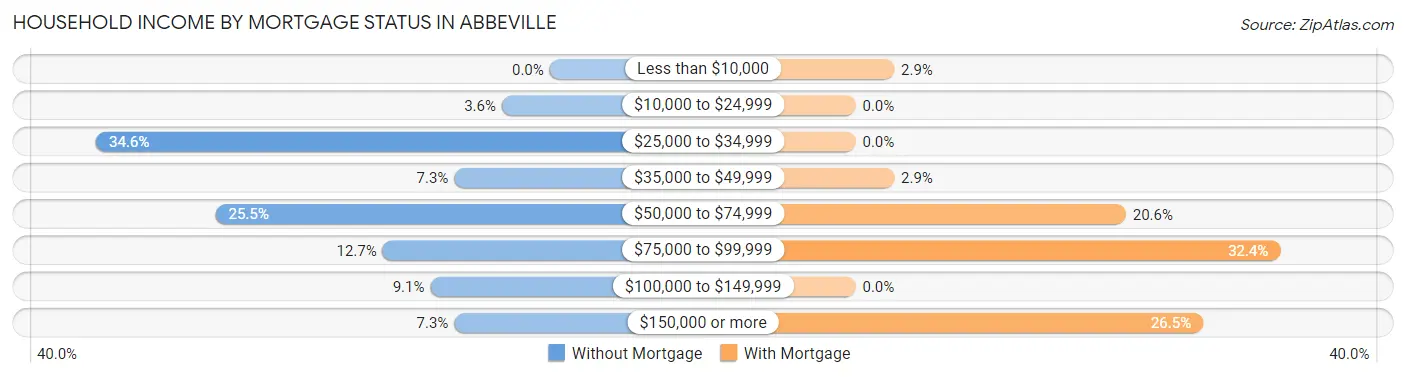
| Household Income | Without Mortgage | With Mortgage |
| Less than $10,000 | 0 (0.0%) | 1 (2.9%) |
| $10,000 to $24,999 | 2 (3.6%) | 0 (0.0%) |
| $25,000 to $34,999 | 19 (34.5%) | 0 (0.0%) |
| $35,000 to $49,999 | 4 (7.3%) | 1 (2.9%) |
| $50,000 to $74,999 | 14 (25.5%) | 7 (20.6%) |
| $75,000 to $99,999 | 7 (12.7%) | 11 (32.4%) |
| $100,000 to $149,999 | 5 (9.1%) | 0 (0.0%) |
| $150,000 or more | 4 (7.3%) | 9 (26.5%) |
| Total | 55 (100.0%) | 34 (100.0%) |
Property Value to Household Income Ratio in Abbeville
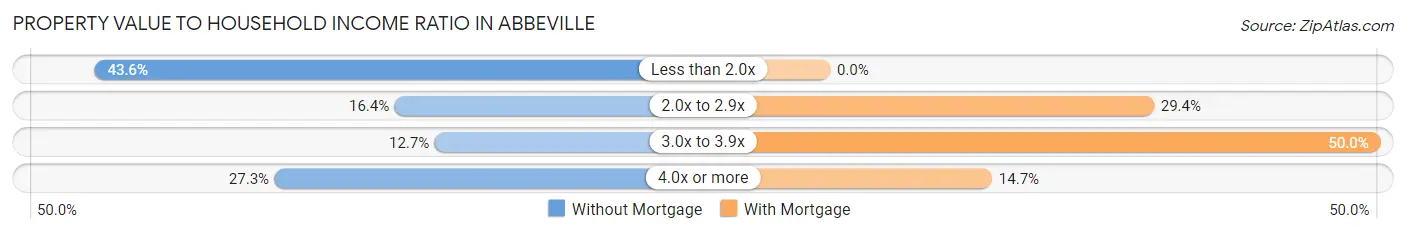
| Value-to-Income Ratio | Without Mortgage | With Mortgage |
| Less than 2.0x | 24 (43.6%) | 0 (0.0%) |
| 2.0x to 2.9x | 9 (16.4%) | 10 (29.4%) |
| 3.0x to 3.9x | 7 (12.7%) | 17 (50.0%) |
| 4.0x or more | 15 (27.3%) | 5 (14.7%) |
| Total | 55 (100.0%) | 34 (100.0%) |
Real Estate Taxes by Mortgage Status in Abbeville
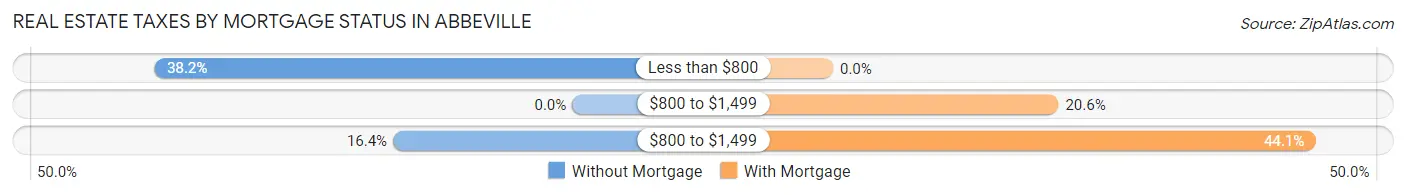
| Property Taxes | Without Mortgage | With Mortgage |
| Less than $800 | 21 (38.2%) | 0 (0.0%) |
| $800 to $1,499 | 0 (0.0%) | 7 (20.6%) |
| $800 to $1,499 | 9 (16.4%) | 15 (44.1%) |
| Total | 55 (100.0%) | 34 (100.0%) |
Health & Disability in Abbeville
Health Insurance Coverage by Age in Abbeville
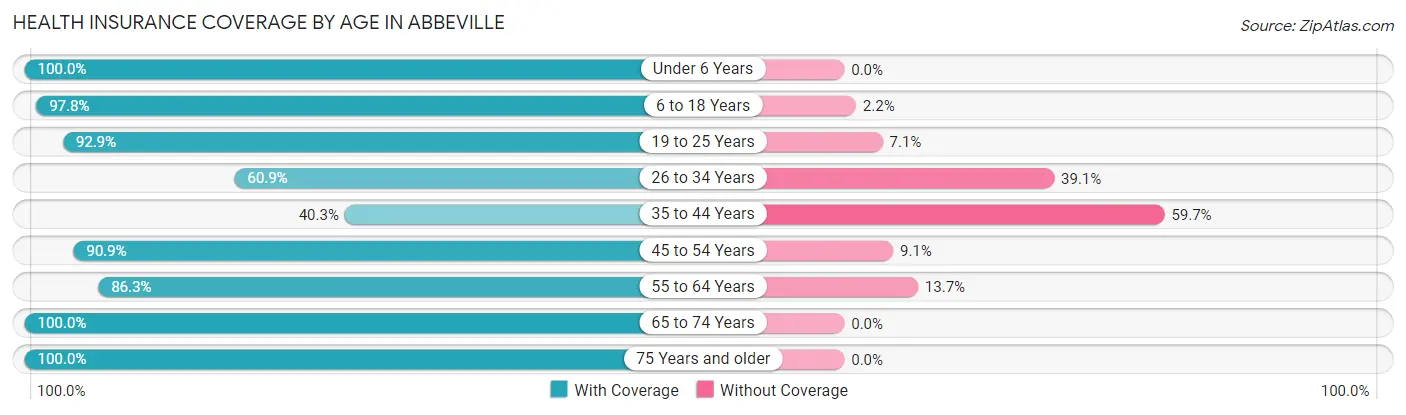
| Age Bracket | With Coverage | Without Coverage |
| Under 6 Years | 23 (100.0%) | 0 (0.0%) |
| 6 to 18 Years | 90 (97.8%) | 2 (2.2%) |
| 19 to 25 Years | 39 (92.9%) | 3 (7.1%) |
| 26 to 34 Years | 14 (60.9%) | 9 (39.1%) |
| 35 to 44 Years | 27 (40.3%) | 40 (59.7%) |
| 45 to 54 Years | 30 (90.9%) | 3 (9.1%) |
| 55 to 64 Years | 44 (86.3%) | 7 (13.7%) |
| 65 to 74 Years | 34 (100.0%) | 0 (0.0%) |
| 75 Years and older | 30 (100.0%) | 0 (0.0%) |
| Total | 331 (83.8%) | 64 (16.2%) |
Health Insurance Coverage by Citizenship Status in Abbeville
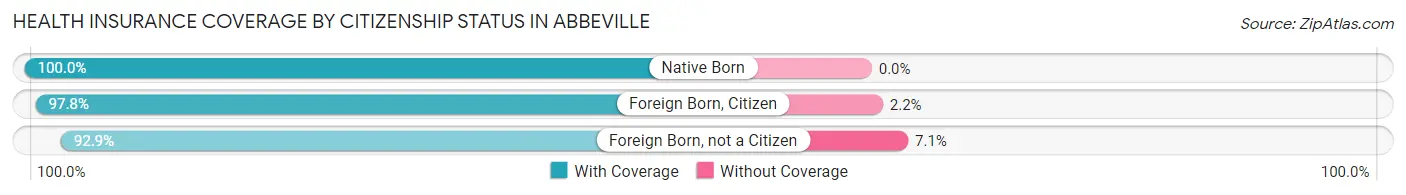
| Citizenship Status | With Coverage | Without Coverage |
| Native Born | 23 (100.0%) | 0 (0.0%) |
| Foreign Born, Citizen | 90 (97.8%) | 2 (2.2%) |
| Foreign Born, not a Citizen | 39 (92.9%) | 3 (7.1%) |
Health Insurance Coverage by Household Income in Abbeville
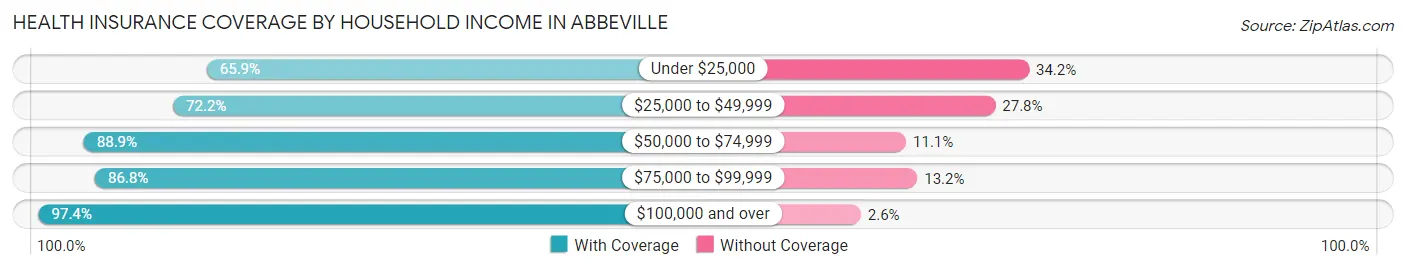
| Household Income | With Coverage | Without Coverage |
| Under $25,000 | 27 (65.8%) | 14 (34.2%) |
| $25,000 to $49,999 | 83 (72.2%) | 32 (27.8%) |
| $50,000 to $74,999 | 64 (88.9%) | 8 (11.1%) |
| $75,000 to $99,999 | 46 (86.8%) | 7 (13.2%) |
| $100,000 and over | 111 (97.4%) | 3 (2.6%) |
Public vs Private Health Insurance Coverage by Age in Abbeville
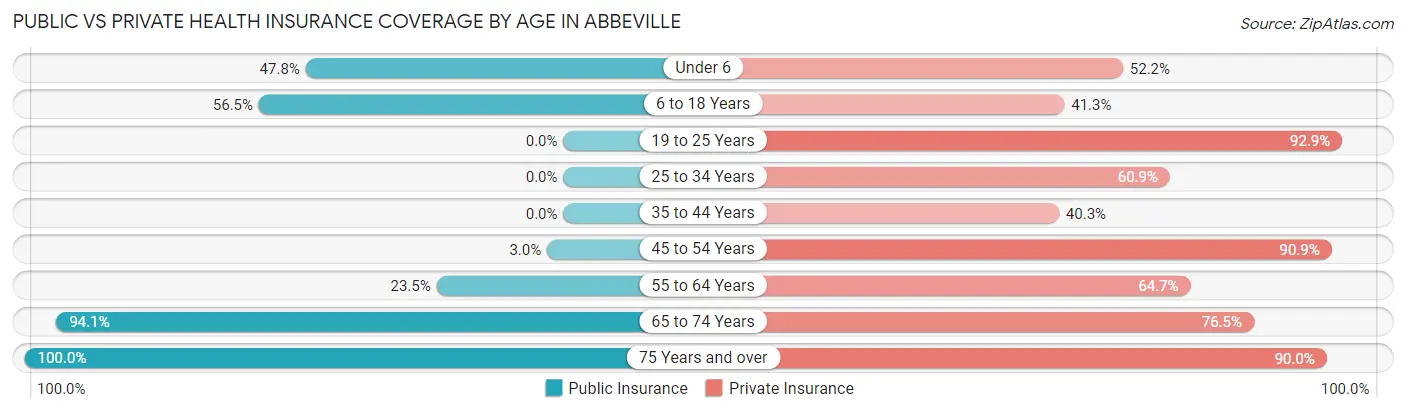
| Age Bracket | Public Insurance | Private Insurance |
| Under 6 | 11 (47.8%) | 12 (52.2%) |
| 6 to 18 Years | 52 (56.5%) | 38 (41.3%) |
| 19 to 25 Years | 0 (0.0%) | 39 (92.9%) |
| 25 to 34 Years | 0 (0.0%) | 14 (60.9%) |
| 35 to 44 Years | 0 (0.0%) | 27 (40.3%) |
| 45 to 54 Years | 1 (3.0%) | 30 (90.9%) |
| 55 to 64 Years | 12 (23.5%) | 33 (64.7%) |
| 65 to 74 Years | 32 (94.1%) | 26 (76.5%) |
| 75 Years and over | 30 (100.0%) | 27 (90.0%) |
| Total | 138 (34.9%) | 246 (62.3%) |
Disability Status by Sex by Age in Abbeville
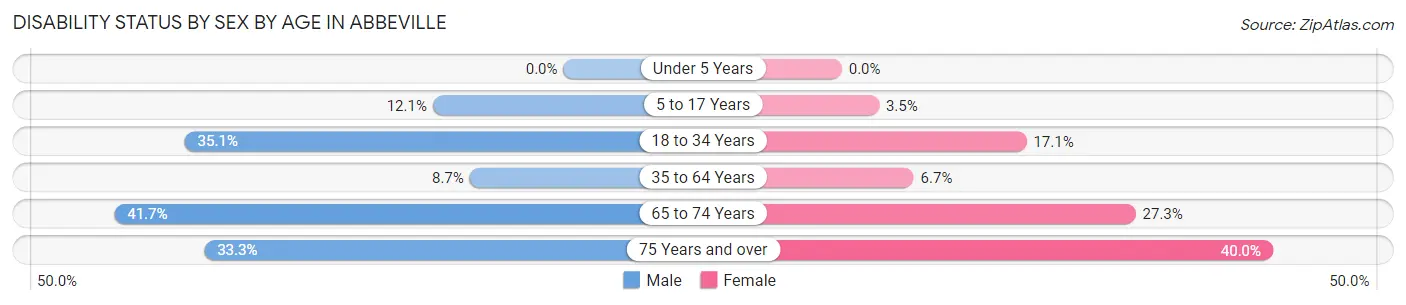
| Age Bracket | Male | Female |
| Under 5 Years | 0 (0.0%) | 0 (0.0%) |
| 5 to 17 Years | 4 (12.1%) | 2 (3.5%) |
| 18 to 34 Years | 13 (35.1%) | 6 (17.1%) |
| 35 to 64 Years | 4 (8.7%) | 7 (6.7%) |
| 65 to 74 Years | 5 (41.7%) | 6 (27.3%) |
| 75 Years and over | 5 (33.3%) | 6 (40.0%) |
Disability Class by Sex by Age in Abbeville
Disability Class: Hearing Difficulty
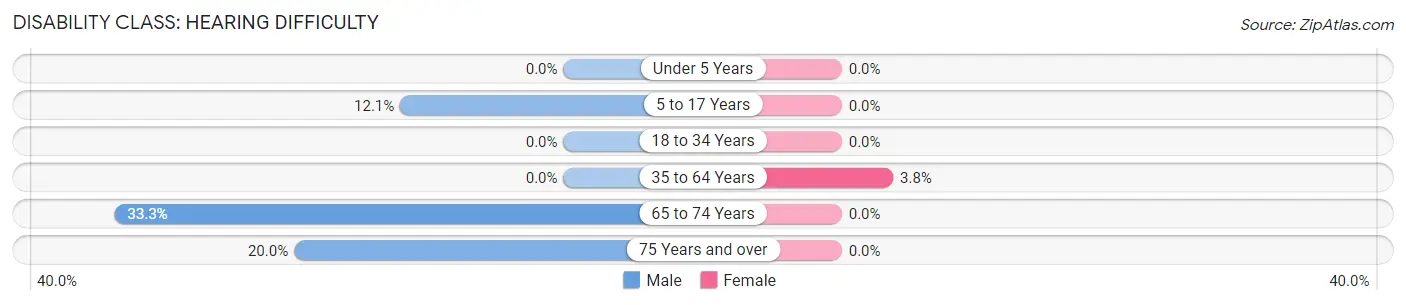
| Age Bracket | Male | Female |
| Under 5 Years | 0 (0.0%) | 0 (0.0%) |
| 5 to 17 Years | 4 (12.1%) | 0 (0.0%) |
| 18 to 34 Years | 0 (0.0%) | 0 (0.0%) |
| 35 to 64 Years | 0 (0.0%) | 4 (3.8%) |
| 65 to 74 Years | 4 (33.3%) | 0 (0.0%) |
| 75 Years and over | 3 (20.0%) | 0 (0.0%) |
Disability Class: Vision Difficulty
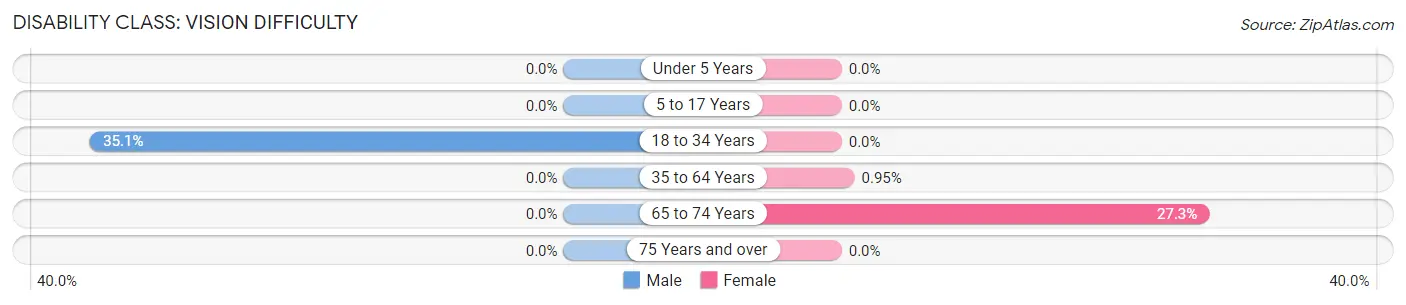
| Age Bracket | Male | Female |
| Under 5 Years | 0 (0.0%) | 0 (0.0%) |
| 5 to 17 Years | 0 (0.0%) | 0 (0.0%) |
| 18 to 34 Years | 13 (35.1%) | 0 (0.0%) |
| 35 to 64 Years | 0 (0.0%) | 1 (0.9%) |
| 65 to 74 Years | 0 (0.0%) | 6 (27.3%) |
| 75 Years and over | 0 (0.0%) | 0 (0.0%) |
Disability Class: Cognitive Difficulty
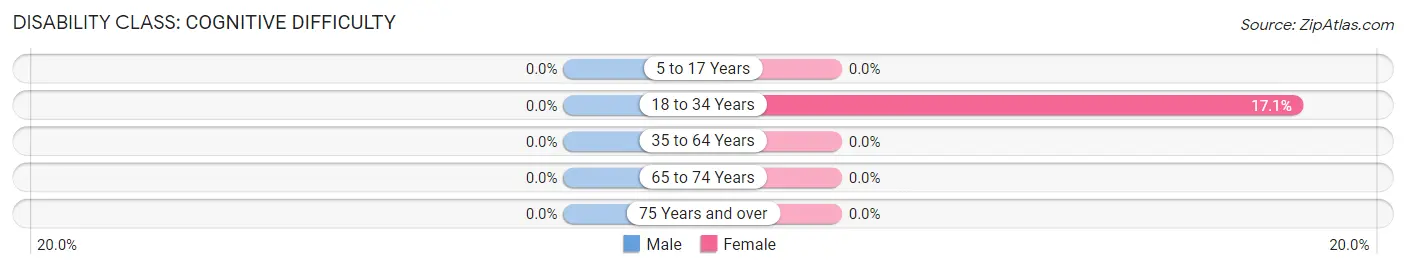
| Age Bracket | Male | Female |
| 5 to 17 Years | 0 (0.0%) | 0 (0.0%) |
| 18 to 34 Years | 0 (0.0%) | 6 (17.1%) |
| 35 to 64 Years | 0 (0.0%) | 0 (0.0%) |
| 65 to 74 Years | 0 (0.0%) | 0 (0.0%) |
| 75 Years and over | 0 (0.0%) | 0 (0.0%) |
Disability Class: Ambulatory Difficulty
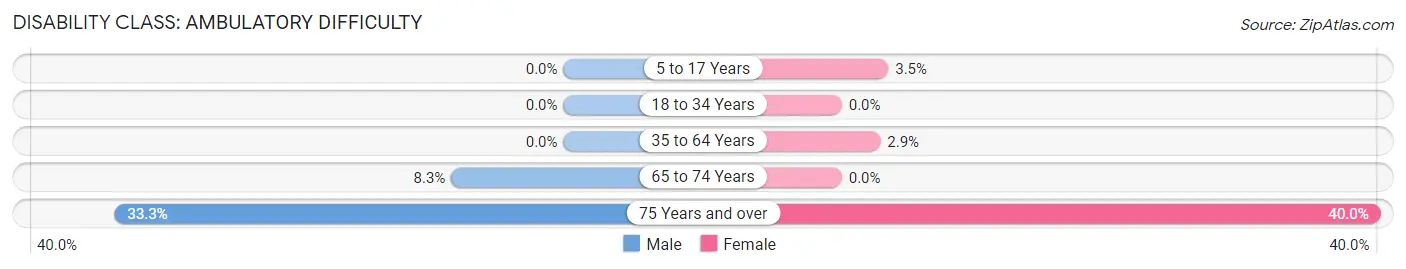
| Age Bracket | Male | Female |
| 5 to 17 Years | 0 (0.0%) | 2 (3.5%) |
| 18 to 34 Years | 0 (0.0%) | 0 (0.0%) |
| 35 to 64 Years | 0 (0.0%) | 3 (2.9%) |
| 65 to 74 Years | 1 (8.3%) | 0 (0.0%) |
| 75 Years and over | 5 (33.3%) | 6 (40.0%) |
Disability Class: Self-Care Difficulty
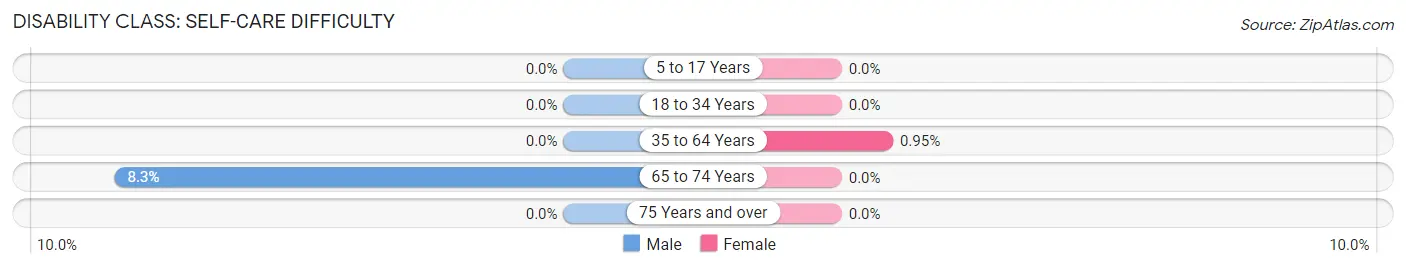
| Age Bracket | Male | Female |
| 5 to 17 Years | 0 (0.0%) | 0 (0.0%) |
| 18 to 34 Years | 0 (0.0%) | 0 (0.0%) |
| 35 to 64 Years | 0 (0.0%) | 1 (0.9%) |
| 65 to 74 Years | 1 (8.3%) | 0 (0.0%) |
| 75 Years and over | 0 (0.0%) | 0 (0.0%) |
Technology Access in Abbeville
Computing Device Access in Abbeville
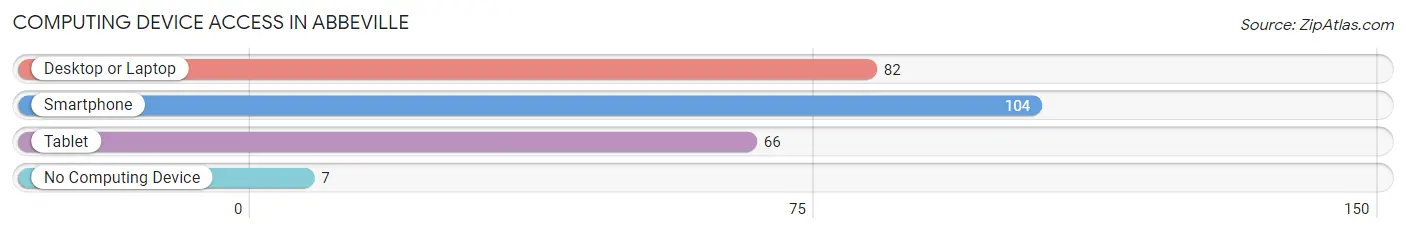
| Device Type | # Households | % Households |
| Desktop or Laptop | 82 | 70.7% |
| Smartphone | 104 | 89.7% |
| Tablet | 66 | 56.9% |
| No Computing Device | 7 | 6.0% |
| Total | 116 | 100.0% |
Internet Access in Abbeville
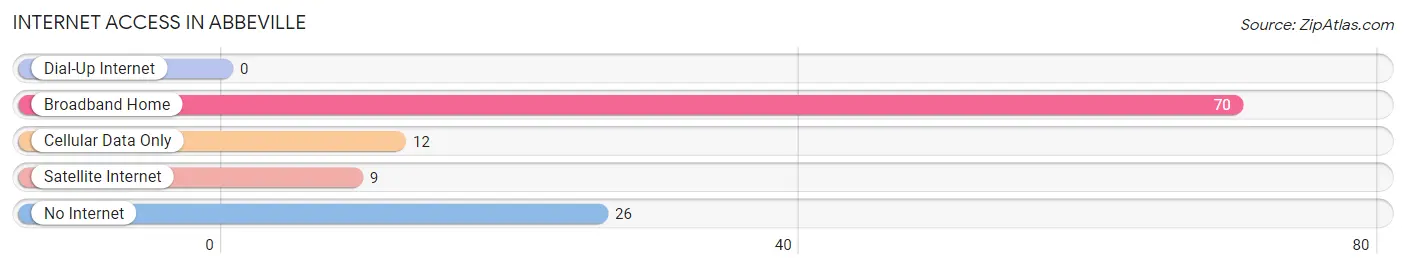
| Internet Type | # Households | % Households |
| Dial-Up Internet | 0 | 0.0% |
| Broadband Home | 70 | 60.3% |
| Cellular Data Only | 12 | 10.3% |
| Satellite Internet | 9 | 7.8% |
| No Internet | 26 | 22.4% |
| Total | 116 | 100.0% |
Abbeville Summary
Abbeville is a small town located in the state of Mississippi, in the United States. It is situated in the northern part of the state, in the county of Calhoun. The town has a population of approximately 1,000 people, and is located about 30 miles south of the state capital, Jackson.
History
Abbeville was founded in 1837 by a group of settlers from Georgia. The town was named after the French city of Abbeville, which was the birthplace of one of the settlers. The town was originally a farming community, and the main crops grown were cotton and corn. The town was also home to a number of small businesses, including a sawmill, a gristmill, and a blacksmith shop.
In the late 19th century, Abbeville began to experience a period of growth and prosperity. The town was connected to the railroad in 1887, and this allowed for the transportation of goods and people to and from the town. This period of growth was short-lived, however, as the Great Depression hit the town hard. Many of the businesses in the town closed, and the population began to decline.
Geography
Abbeville is located in the northern part of Mississippi, in the county of Calhoun. The town is situated on the banks of the Big Black River, and is surrounded by rolling hills and forests. The town is located about 30 miles south of the state capital, Jackson. The climate in Abbeville is humid subtropical, with hot summers and mild winters.
Economy
The economy of Abbeville is largely based on agriculture. The main crops grown in the area are cotton, corn, soybeans, and wheat. The town is also home to a number of small businesses, including a sawmill, a gristmill, and a blacksmith shop. In recent years, the town has seen an increase in tourism, as visitors come to explore the town’s history and natural beauty.
Demographics
As of the 2010 census, the population of Abbeville was 1,000. The racial makeup of the town was 95.2% White, 2.7% African American, 0.2% Native American, 0.2% Asian, and 1.7% from other races. The median household income in the town was $25,000, and the median age was 37. The town is served by the Calhoun County School District.
Common Questions
What is Per Capita Income in Abbeville?
Per Capita income in Abbeville is $26,548.
What is the Median Family Income in Abbeville?
Median Family Income in Abbeville is $65,625.
What is the Median Household income in Abbeville?
Median Household Income in Abbeville is $52,857.
What is Inequality or Gini Index in Abbeville?
Inequality or Gini Index in Abbeville is 0.39.
What is the Total Population of Abbeville?
Total Population of Abbeville is 395.
What is the Total Male Population of Abbeville?
Total Male Population of Abbeville is 144.
What is the Total Female Population of Abbeville?
Total Female Population of Abbeville is 251.
What is the Ratio of Males per 100 Females in Abbeville?
There are 57.37 Males per 100 Females in Abbeville.
What is the Ratio of Females per 100 Males in Abbeville?
There are 174.31 Females per 100 Males in Abbeville.
What is the Median Population Age in Abbeville?
Median Population Age in Abbeville is 39.5 Years.
What is the Average Family Size in Abbeville
Average Family Size in Abbeville is 4.4 People.
What is the Average Household Size in Abbeville
Average Household Size in Abbeville is 3.4 People.
How Large is the Labor Force in Abbeville?
There are 204 People in the Labor Forcein in Abbeville.
What is the Percentage of People in the Labor Force in Abbeville?
66.7% of People are in the Labor Force in Abbeville.
What is the Unemployment Rate in Abbeville?
Unemployment Rate in Abbeville is 9.3%.