Trinidadian and Tobagonian vs Immigrants from Hong Kong Wage/Income Gap
COMPARE
Trinidadian and Tobagonian
Immigrants from Hong Kong
Wage/Income Gap
Wage/Income Gap Comparison
Trinidadians and Tobagonians
Immigrants from Hong Kong
19.3%
WAGE/INCOME GAP
100.0/ 100
METRIC RATING
13th/ 347
METRIC RANK
25.5%
WAGE/INCOME GAP
64.0/ 100
METRIC RATING
165th/ 347
METRIC RANK
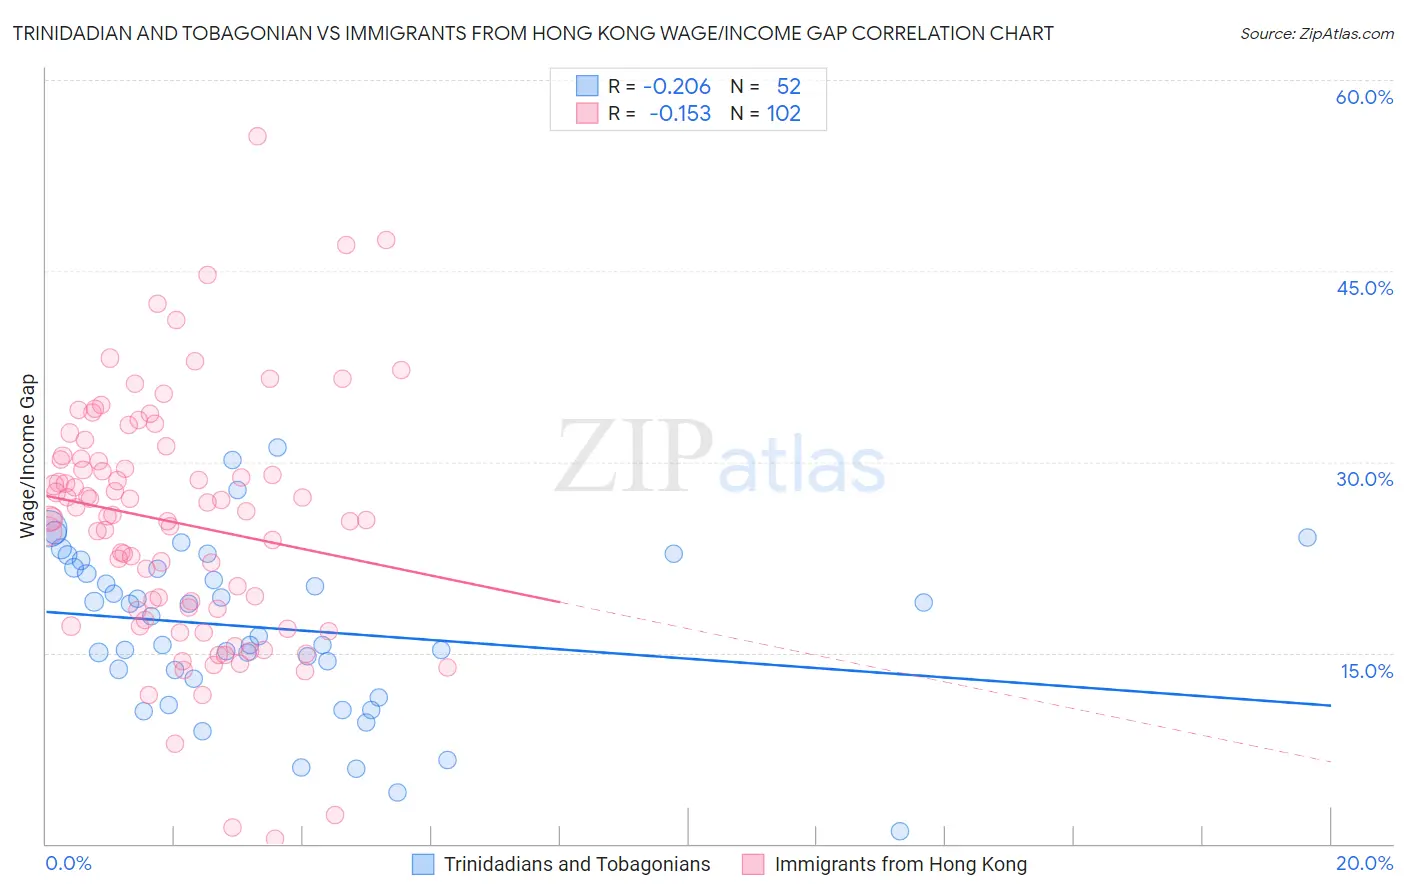
Trinidadian and Tobagonian vs Immigrants from Hong Kong Wage/Income Gap Correlation Chart
The statistical analysis conducted on geographies consisting of 219,803,176 people shows a weak negative correlation between the proportion of Trinidadians and Tobagonians and wage/income gap percentage in the United States with a correlation coefficient (R) of -0.206 and weighted average of 19.3%. Similarly, the statistical analysis conducted on geographies consisting of 253,936,651 people shows a poor negative correlation between the proportion of Immigrants from Hong Kong and wage/income gap percentage in the United States with a correlation coefficient (R) of -0.153 and weighted average of 25.5%, a difference of 32.1%.
Wage/Income Gap Correlation Summary
| Measurement | Trinidadian and Tobagonian | Immigrants from Hong Kong |
| Minimum | 1.0% | 0.36% |
| Maximum | 31.1% | 55.6% |
| Range | 30.1% | 55.2% |
| Mean | 16.9% | 25.2% |
| Median | 17.1% | 25.8% |
| Interquartile 25% (IQ1) | 13.3% | 18.3% |
| Interquartile 75% (IQ3) | 21.6% | 30.3% |
| Interquartile Range (IQR) | 8.3% | 11.9% |
| Standard Deviation (Sample) | 6.5% | 9.6% |
| Standard Deviation (Population) | 6.4% | 9.6% |
Similar Demographics by Wage/Income Gap
Demographics Similar to Trinidadians and Tobagonians by Wage/Income Gap
In terms of wage/income gap, the demographic groups most similar to Trinidadians and Tobagonians are Immigrants from Trinidad and Tobago (19.3%, a difference of 0.050%), Immigrants from West Indies (19.2%, a difference of 0.48%), Immigrants from Haiti (19.2%, a difference of 0.59%), West Indian (19.6%, a difference of 1.2%), and Jamaican (19.6%, a difference of 1.4%).
| Demographics | Rating | Rank | Wage/Income Gap |
| Immigrants | Guyana | 100.0 /100 | #6 | Exceptional 18.4% |
| Puerto Ricans | 100.0 /100 | #7 | Exceptional 18.7% |
| Immigrants | Jamaica | 100.0 /100 | #8 | Exceptional 18.8% |
| Barbadians | 100.0 /100 | #9 | Exceptional 19.0% |
| Crow | 100.0 /100 | #10 | Exceptional 19.1% |
| Immigrants | Haiti | 100.0 /100 | #11 | Exceptional 19.2% |
| Immigrants | West Indies | 100.0 /100 | #12 | Exceptional 19.2% |
| Trinidadians and Tobagonians | 100.0 /100 | #13 | Exceptional 19.3% |
| Immigrants | Trinidad and Tobago | 100.0 /100 | #14 | Exceptional 19.3% |
| West Indians | 100.0 /100 | #15 | Exceptional 19.6% |
| Jamaicans | 100.0 /100 | #16 | Exceptional 19.6% |
| Haitians | 100.0 /100 | #17 | Exceptional 19.7% |
| Hopi | 100.0 /100 | #18 | Exceptional 20.0% |
| Immigrants | Dominica | 100.0 /100 | #19 | Exceptional 20.0% |
| Bahamians | 100.0 /100 | #20 | Exceptional 20.2% |
Demographics Similar to Immigrants from Hong Kong by Wage/Income Gap
In terms of wage/income gap, the demographic groups most similar to Immigrants from Hong Kong are Immigrants from Ukraine (25.5%, a difference of 0.010%), Paiute (25.5%, a difference of 0.070%), Seminole (25.6%, a difference of 0.090%), Peruvian (25.6%, a difference of 0.27%), and Korean (25.4%, a difference of 0.34%).
| Demographics | Rating | Rank | Wage/Income Gap |
| Immigrants | Zimbabwe | 73.7 /100 | #158 | Good 25.3% |
| Puget Sound Salish | 73.0 /100 | #159 | Good 25.3% |
| French American Indians | 72.5 /100 | #160 | Good 25.4% |
| Albanians | 69.4 /100 | #161 | Good 25.4% |
| Shoshone | 69.0 /100 | #162 | Good 25.4% |
| Native Hawaiians | 69.0 /100 | #163 | Good 25.4% |
| Koreans | 68.6 /100 | #164 | Good 25.4% |
| Immigrants | Hong Kong | 64.0 /100 | #165 | Good 25.5% |
| Immigrants | Ukraine | 63.8 /100 | #166 | Good 25.5% |
| Paiute | 62.9 /100 | #167 | Good 25.5% |
| Seminole | 62.6 /100 | #168 | Good 25.6% |
| Peruvians | 60.1 /100 | #169 | Good 25.6% |
| Immigrants | Oceania | 57.5 /100 | #170 | Average 25.6% |
| Immigrants | Greece | 56.6 /100 | #171 | Average 25.7% |
| Immigrants | Chile | 53.2 /100 | #172 | Average 25.7% |