Trinidadian and Tobagonian Disability Age 5 to 17
COMPARE
Trinidadian and Tobagonian
Select to Compare
Disability Age 5 to 17
Trinidadian and Tobagonian Disability Age 5 to 17
5.7%
DISABILITY | AGE 5 TO 17
10.8/ 100
METRIC RATING
205th/ 347
METRIC RANK
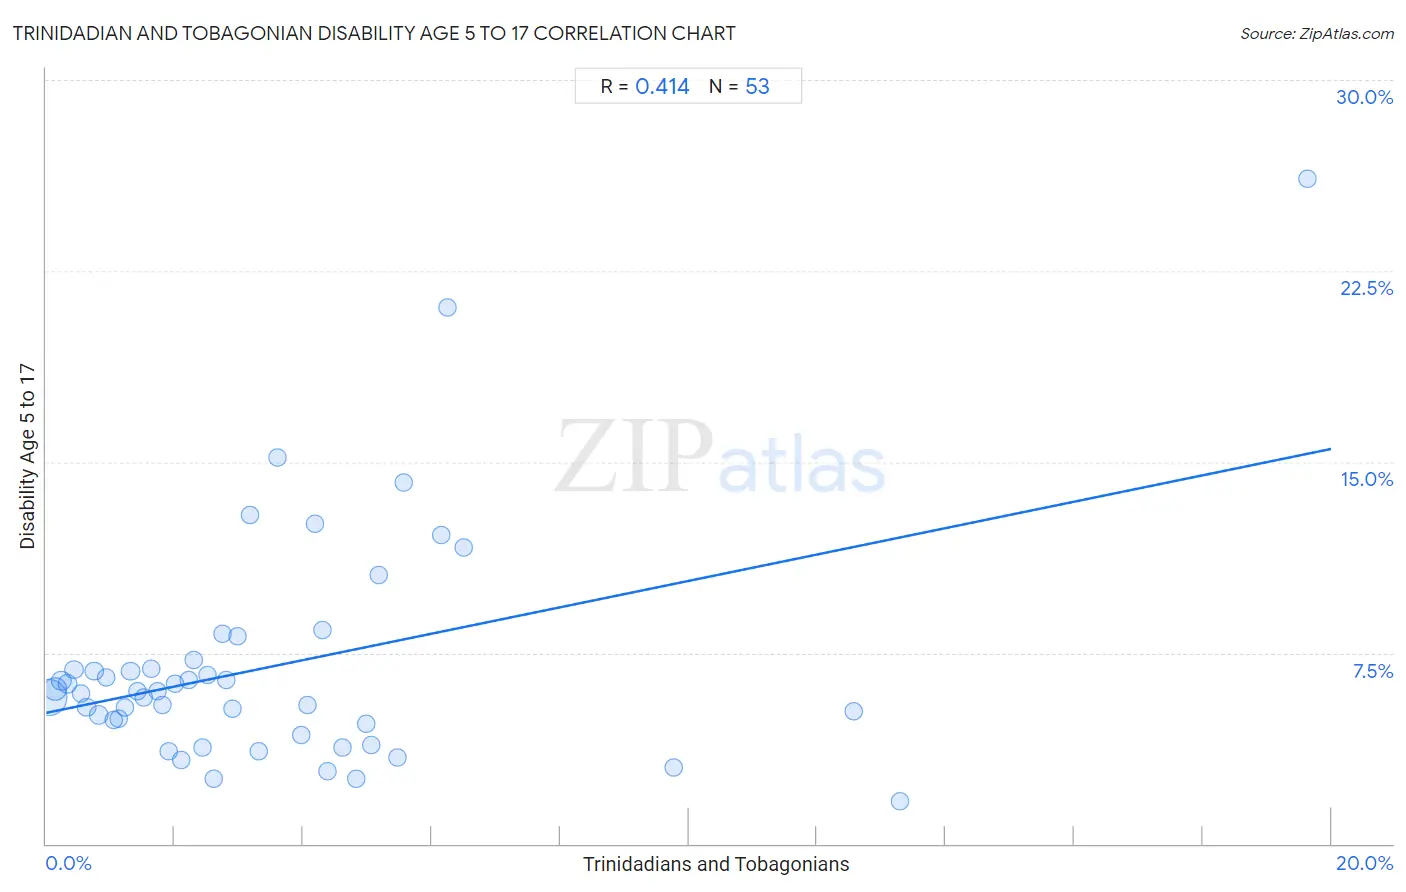
Trinidadian and Tobagonian Disability Age 5 to 17 Correlation Chart
The statistical analysis conducted on geographies consisting of 219,004,260 people shows a moderate positive correlation between the proportion of Trinidadians and Tobagonians and percentage of population with a disability between the ages 5 and 17 in the United States with a correlation coefficient (R) of 0.414 and weighted average of 5.7%. On average, for every 1% (one percent) increase in Trinidadians and Tobagonians within a typical geography, there is an increase of 0.52% in percentage of population with a disability between the ages 5 and 17.
It is essential to understand that the correlation between the percentage of Trinidadians and Tobagonians and percentage of population with a disability between the ages 5 and 17 does not imply a direct cause-and-effect relationship. It remains uncertain whether the presence of Trinidadians and Tobagonians influences an upward or downward trend in the level of percentage of population with a disability between the ages 5 and 17 within an area, or if Trinidadians and Tobagonians simply ended up residing in those areas with higher or lower levels of percentage of population with a disability between the ages 5 and 17 due to other factors.
Demographics Similar to Trinidadians and Tobagonians by Disability Age 5 to 17
In terms of disability age 5 to 17, the demographic groups most similar to Trinidadians and Tobagonians are Immigrants from Africa (5.7%, a difference of 0.0%), Paiute (5.7%, a difference of 0.050%), Moroccan (5.7%, a difference of 0.050%), Kenyan (5.8%, a difference of 0.10%), and Immigrants from Uganda (5.8%, a difference of 0.14%).
| Demographics | Rating | Rank | Disability Age 5 to 17 |
| Norwegians | 20.9 /100 | #198 | Fair 5.7% |
| Northern Europeans | 15.2 /100 | #199 | Poor 5.7% |
| Icelanders | 14.6 /100 | #200 | Poor 5.7% |
| Basques | 13.7 /100 | #201 | Poor 5.7% |
| Austrians | 13.2 /100 | #202 | Poor 5.7% |
| Spanish American Indians | 12.8 /100 | #203 | Poor 5.7% |
| Paiute | 11.2 /100 | #204 | Poor 5.7% |
| Trinidadians and Tobagonians | 10.8 /100 | #205 | Poor 5.7% |
| Immigrants from Africa | 10.8 /100 | #206 | Poor 5.7% |
| Moroccans | 10.4 /100 | #207 | Poor 5.7% |
| Kenyans | 10.0 /100 | #208 | Poor 5.8% |
| Immigrants from Uganda | 9.7 /100 | #209 | Tragic 5.8% |
| Immigrants from Haiti | 9.5 /100 | #210 | Tragic 5.8% |
| Yugoslavians | 9.1 /100 | #211 | Tragic 5.8% |
| Immigrants from Panama | 8.7 /100 | #212 | Tragic 5.8% |
Trinidadian and Tobagonian Disability Age 5 to 17 Correlation Summary
| Measurement | Trinidadian and Tobagonian Data | Disability Age 5 to 17 Data |
| Minimum | 0.036% | 1.7% |
| Maximum | 19.6% | 26.1% |
| Range | 19.6% | 24.4% |
| Mean | 3.5% | 7.0% |
| Median | 2.6% | 6.0% |
| Interquartile 25% (IQ1) | 1.3% | 4.5% |
| Interquartile 75% (IQ3) | 4.7% | 7.0% |
| Interquartile Range (IQR) | 3.5% | 2.5% |
| Standard Deviation (Sample) | 3.6% | 4.5% |
| Standard Deviation (Population) | 3.5% | 4.4% |
Correlation Details
| Trinidadian and Tobagonian Percentile | Sample Size | Disability Age 5 to 17 |
[ 0.0% - 0.5% ] 0.036% | 132,644,340 | 5.7% |
[ 0.0% - 0.5% ] 0.14% | 32,169,103 | 6.1% |
[ 0.0% - 0.5% ] 0.23% | 16,308,850 | 6.4% |
[ 0.0% - 0.5% ] 0.34% | 8,652,267 | 6.3% |
[ 0.0% - 0.5% ] 0.44% | 5,083,641 | 6.8% |
[ 0.5% - 1.0% ] 0.54% | 3,187,547 | 5.9% |
[ 0.5% - 1.0% ] 0.63% | 2,404,325 | 5.4% |
[ 0.5% - 1.0% ] 0.75% | 2,106,084 | 6.8% |
[ 0.5% - 1.0% ] 0.82% | 9,460,237 | 5.1% |
[ 0.5% - 1.0% ] 0.93% | 853,273 | 6.5% |
[ 1.0% - 1.5% ] 1.05% | 701,393 | 4.9% |
[ 1.0% - 1.5% ] 1.13% | 849,023 | 4.9% |
[ 1.0% - 1.5% ] 1.23% | 830,500 | 5.4% |
[ 1.0% - 1.5% ] 1.31% | 500,750 | 6.8% |
[ 1.0% - 1.5% ] 1.42% | 521,411 | 6.0% |
[ 1.5% - 2.0% ] 1.51% | 228,618 | 5.8% |
[ 1.5% - 2.0% ] 1.63% | 209,498 | 6.9% |
[ 1.5% - 2.0% ] 1.73% | 210,075 | 6.0% |
[ 1.5% - 2.0% ] 1.82% | 220,078 | 5.5% |
[ 1.5% - 2.0% ] 1.91% | 173,375 | 3.6% |
[ 2.0% - 2.5% ] 2.01% | 113,270 | 6.3% |
[ 2.0% - 2.5% ] 2.09% | 78,239 | 3.3% |
[ 2.0% - 2.5% ] 2.21% | 48,014 | 6.5% |
[ 2.0% - 2.5% ] 2.30% | 211,876 | 7.2% |
[ 2.0% - 2.5% ] 2.43% | 115,791 | 3.8% |
[ 2.5% - 3.0% ] 2.52% | 102,122 | 6.6% |
[ 2.5% - 3.0% ] 2.61% | 16,459 | 2.5% |
[ 2.5% - 3.0% ] 2.73% | 40,493 | 8.3% |
[ 2.5% - 3.0% ] 2.81% | 26,547 | 6.4% |
[ 2.5% - 3.0% ] 2.90% | 63,904 | 5.3% |
[ 2.5% - 3.0% ] 2.97% | 1,649 | 8.2% |
[ 3.0% - 3.5% ] 3.16% | 24,994 | 12.9% |
[ 3.0% - 3.5% ] 3.31% | 73,879 | 3.7% |
[ 3.5% - 4.0% ] 3.61% | 8,260 | 15.2% |
[ 3.5% - 4.0% ] 3.97% | 57,192 | 4.3% |
[ 4.0% - 4.5% ] 4.07% | 87,698 | 5.4% |
[ 4.0% - 4.5% ] 4.17% | 10,495 | 12.6% |
[ 4.0% - 4.5% ] 4.30% | 7,953 | 8.4% |
[ 4.0% - 4.5% ] 4.38% | 150,387 | 2.9% |
[ 4.5% - 5.0% ] 4.62% | 101,053 | 3.8% |
[ 4.5% - 5.0% ] 4.83% | 101,329 | 2.5% |
[ 4.5% - 5.0% ] 4.98% | 51,153 | 4.7% |
[ 5.0% - 5.5% ] 5.05% | 66,262 | 3.9% |
[ 5.0% - 5.5% ] 5.17% | 6,851 | 10.6% |
[ 5.0% - 5.5% ] 5.47% | 78,506 | 3.4% |
[ 5.5% - 6.0% ] 5.56% | 1,277 | 14.2% |
[ 6.0% - 6.5% ] 6.14% | 29,820 | 12.1% |
[ 6.0% - 6.5% ] 6.24% | 2,322 | 21.0% |
[ 6.0% - 6.5% ] 6.49% | 1,510 | 11.6% |
[ 9.5% - 10.0% ] 9.77% | 1,177 | 3.0% |
[ 12.5% - 13.0% ] 12.56% | 4,179 | 5.2% |
[ 13.0% - 13.5% ] 13.29% | 2,980 | 1.7% |
[ 19.5% - 20.0% ] 19.63% | 2,231 | 26.1% |