Trinidadian and Tobagonian vs Somali Wage/Income Gap
COMPARE
Trinidadian and Tobagonian
Somali
Wage/Income Gap
Wage/Income Gap Comparison
Trinidadians and Tobagonians
Somalis
19.3%
WAGE/INCOME GAP
100.0/ 100
METRIC RATING
13th/ 347
METRIC RANK
21.2%
WAGE/INCOME GAP
100.0/ 100
METRIC RATING
35th/ 347
METRIC RANK
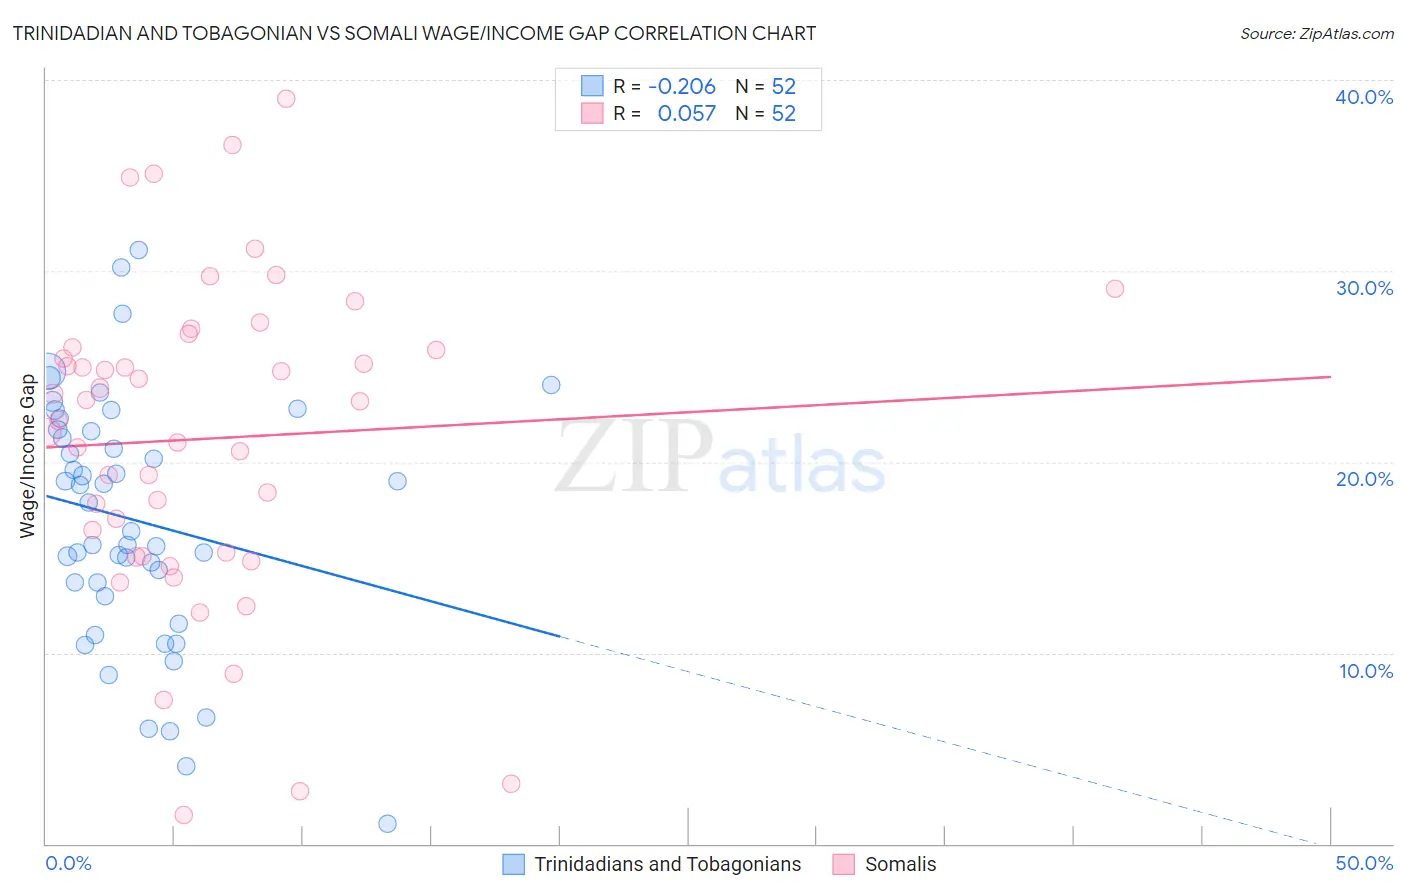
Trinidadian and Tobagonian vs Somali Wage/Income Gap Correlation Chart
The statistical analysis conducted on geographies consisting of 219,803,176 people shows a weak negative correlation between the proportion of Trinidadians and Tobagonians and wage/income gap percentage in the United States with a correlation coefficient (R) of -0.206 and weighted average of 19.3%. Similarly, the statistical analysis conducted on geographies consisting of 99,316,309 people shows a slight positive correlation between the proportion of Somalis and wage/income gap percentage in the United States with a correlation coefficient (R) of 0.057 and weighted average of 21.2%, a difference of 9.9%.
Wage/Income Gap Correlation Summary
| Measurement | Trinidadian and Tobagonian | Somali |
| Minimum | 1.0% | 1.5% |
| Maximum | 31.1% | 39.0% |
| Range | 30.1% | 37.5% |
| Mean | 16.9% | 21.2% |
| Median | 17.1% | 22.7% |
| Interquartile 25% (IQ1) | 13.3% | 15.2% |
| Interquartile 75% (IQ3) | 21.6% | 25.9% |
| Interquartile Range (IQR) | 8.3% | 10.8% |
| Standard Deviation (Sample) | 6.5% | 8.3% |
| Standard Deviation (Population) | 6.4% | 8.2% |
Similar Demographics by Wage/Income Gap
Demographics Similar to Trinidadians and Tobagonians by Wage/Income Gap
In terms of wage/income gap, the demographic groups most similar to Trinidadians and Tobagonians are Immigrants from Trinidad and Tobago (19.3%, a difference of 0.050%), Immigrants from West Indies (19.2%, a difference of 0.48%), Immigrants from Haiti (19.2%, a difference of 0.59%), West Indian (19.6%, a difference of 1.2%), and Jamaican (19.6%, a difference of 1.4%).
| Demographics | Rating | Rank | Wage/Income Gap |
| Immigrants | Guyana | 100.0 /100 | #6 | Exceptional 18.4% |
| Puerto Ricans | 100.0 /100 | #7 | Exceptional 18.7% |
| Immigrants | Jamaica | 100.0 /100 | #8 | Exceptional 18.8% |
| Barbadians | 100.0 /100 | #9 | Exceptional 19.0% |
| Crow | 100.0 /100 | #10 | Exceptional 19.1% |
| Immigrants | Haiti | 100.0 /100 | #11 | Exceptional 19.2% |
| Immigrants | West Indies | 100.0 /100 | #12 | Exceptional 19.2% |
| Trinidadians and Tobagonians | 100.0 /100 | #13 | Exceptional 19.3% |
| Immigrants | Trinidad and Tobago | 100.0 /100 | #14 | Exceptional 19.3% |
| West Indians | 100.0 /100 | #15 | Exceptional 19.6% |
| Jamaicans | 100.0 /100 | #16 | Exceptional 19.6% |
| Haitians | 100.0 /100 | #17 | Exceptional 19.7% |
| Hopi | 100.0 /100 | #18 | Exceptional 20.0% |
| Immigrants | Dominica | 100.0 /100 | #19 | Exceptional 20.0% |
| Bahamians | 100.0 /100 | #20 | Exceptional 20.2% |
Demographics Similar to Somalis by Wage/Income Gap
In terms of wage/income gap, the demographic groups most similar to Somalis are Belizean (21.2%, a difference of 0.020%), Immigrants from Somalia (21.2%, a difference of 0.090%), Immigrants from Belize (21.3%, a difference of 0.14%), Colville (21.3%, a difference of 0.25%), and Lumbee (21.3%, a difference of 0.45%).
| Demographics | Rating | Rank | Wage/Income Gap |
| Inupiat | 100.0 /100 | #28 | Exceptional 20.8% |
| Immigrants | Senegal | 100.0 /100 | #29 | Exceptional 20.9% |
| Immigrants | Bangladesh | 100.0 /100 | #30 | Exceptional 20.9% |
| Vietnamese | 100.0 /100 | #31 | Exceptional 21.0% |
| Immigrants | Yemen | 100.0 /100 | #32 | Exceptional 21.1% |
| Immigrants | Bahamas | 100.0 /100 | #33 | Exceptional 21.1% |
| Pima | 100.0 /100 | #34 | Exceptional 21.1% |
| Somalis | 100.0 /100 | #35 | Exceptional 21.2% |
| Belizeans | 100.0 /100 | #36 | Exceptional 21.2% |
| Immigrants | Somalia | 100.0 /100 | #37 | Exceptional 21.2% |
| Immigrants | Belize | 100.0 /100 | #38 | Exceptional 21.3% |
| Colville | 100.0 /100 | #39 | Exceptional 21.3% |
| Lumbee | 100.0 /100 | #40 | Exceptional 21.3% |
| Liberians | 100.0 /100 | #41 | Exceptional 21.4% |
| Immigrants | Sierra Leone | 100.0 /100 | #42 | Exceptional 21.4% |