Trinidadian and Tobagonian vs Hungarian Wage/Income Gap
COMPARE
Trinidadian and Tobagonian
Hungarian
Wage/Income Gap
Wage/Income Gap Comparison
Trinidadians and Tobagonians
Hungarians
19.3%
WAGE/INCOME GAP
100.0/ 100
METRIC RATING
13th/ 347
METRIC RANK
29.0%
WAGE/INCOME GAP
0.0/ 100
METRIC RATING
325th/ 347
METRIC RANK
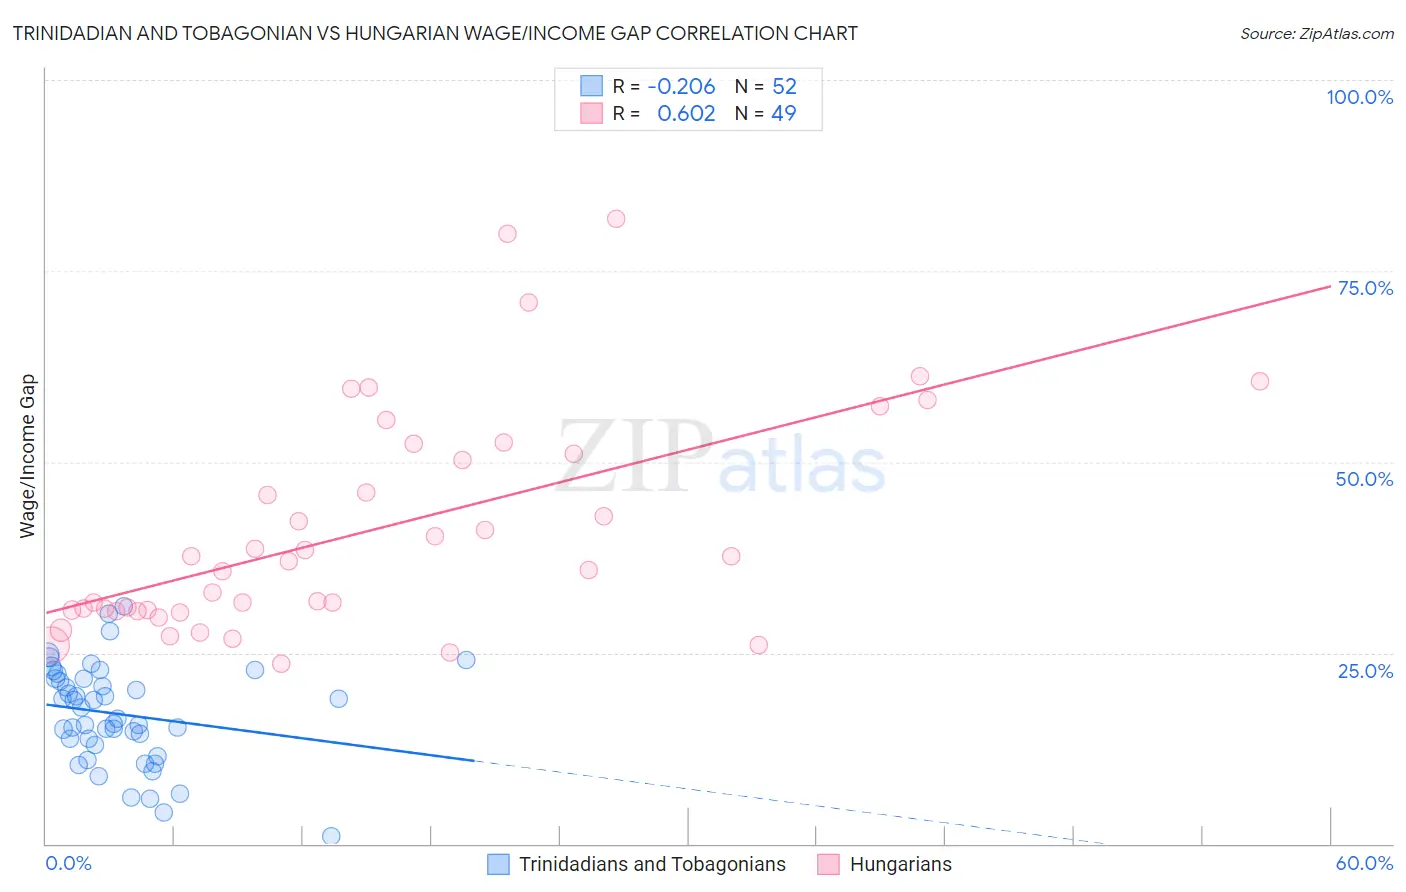
Trinidadian and Tobagonian vs Hungarian Wage/Income Gap Correlation Chart
The statistical analysis conducted on geographies consisting of 219,803,176 people shows a weak negative correlation between the proportion of Trinidadians and Tobagonians and wage/income gap percentage in the United States with a correlation coefficient (R) of -0.206 and weighted average of 19.3%. Similarly, the statistical analysis conducted on geographies consisting of 485,427,318 people shows a significant positive correlation between the proportion of Hungarians and wage/income gap percentage in the United States with a correlation coefficient (R) of 0.602 and weighted average of 29.0%, a difference of 50.2%.
Wage/Income Gap Correlation Summary
| Measurement | Trinidadian and Tobagonian | Hungarian |
| Minimum | 1.0% | 23.5% |
| Maximum | 31.1% | 81.8% |
| Range | 30.1% | 58.3% |
| Mean | 16.9% | 41.1% |
| Median | 17.1% | 37.0% |
| Interquartile 25% (IQ1) | 13.3% | 30.6% |
| Interquartile 75% (IQ3) | 21.6% | 51.8% |
| Interquartile Range (IQR) | 8.3% | 21.2% |
| Standard Deviation (Sample) | 6.5% | 14.5% |
| Standard Deviation (Population) | 6.4% | 14.3% |
Similar Demographics by Wage/Income Gap
Demographics Similar to Trinidadians and Tobagonians by Wage/Income Gap
In terms of wage/income gap, the demographic groups most similar to Trinidadians and Tobagonians are Immigrants from Trinidad and Tobago (19.3%, a difference of 0.050%), Immigrants from West Indies (19.2%, a difference of 0.48%), Immigrants from Haiti (19.2%, a difference of 0.59%), West Indian (19.6%, a difference of 1.2%), and Jamaican (19.6%, a difference of 1.4%).
| Demographics | Rating | Rank | Wage/Income Gap |
| Immigrants | Guyana | 100.0 /100 | #6 | Exceptional 18.4% |
| Puerto Ricans | 100.0 /100 | #7 | Exceptional 18.7% |
| Immigrants | Jamaica | 100.0 /100 | #8 | Exceptional 18.8% |
| Barbadians | 100.0 /100 | #9 | Exceptional 19.0% |
| Crow | 100.0 /100 | #10 | Exceptional 19.1% |
| Immigrants | Haiti | 100.0 /100 | #11 | Exceptional 19.2% |
| Immigrants | West Indies | 100.0 /100 | #12 | Exceptional 19.2% |
| Trinidadians and Tobagonians | 100.0 /100 | #13 | Exceptional 19.3% |
| Immigrants | Trinidad and Tobago | 100.0 /100 | #14 | Exceptional 19.3% |
| West Indians | 100.0 /100 | #15 | Exceptional 19.6% |
| Jamaicans | 100.0 /100 | #16 | Exceptional 19.6% |
| Haitians | 100.0 /100 | #17 | Exceptional 19.7% |
| Hopi | 100.0 /100 | #18 | Exceptional 20.0% |
| Immigrants | Dominica | 100.0 /100 | #19 | Exceptional 20.0% |
| Bahamians | 100.0 /100 | #20 | Exceptional 20.2% |
Demographics Similar to Hungarians by Wage/Income Gap
In terms of wage/income gap, the demographic groups most similar to Hungarians are Immigrants from Belgium (29.0%, a difference of 0.070%), Croatian (29.0%, a difference of 0.13%), Immigrants from Iran (29.1%, a difference of 0.18%), Scandinavian (29.1%, a difference of 0.24%), and Norwegian (29.0%, a difference of 0.25%).
| Demographics | Rating | Rank | Wage/Income Gap |
| Basques | 0.1 /100 | #318 | Tragic 28.8% |
| Slovaks | 0.1 /100 | #319 | Tragic 28.9% |
| British | 0.1 /100 | #320 | Tragic 28.9% |
| Welsh | 0.1 /100 | #321 | Tragic 28.9% |
| Immigrants | Singapore | 0.1 /100 | #322 | Tragic 28.9% |
| Norwegians | 0.1 /100 | #323 | Tragic 29.0% |
| Croatians | 0.0 /100 | #324 | Tragic 29.0% |
| Hungarians | 0.0 /100 | #325 | Tragic 29.0% |
| Immigrants | Belgium | 0.0 /100 | #326 | Tragic 29.0% |
| Immigrants | Iran | 0.0 /100 | #327 | Tragic 29.1% |
| Scandinavians | 0.0 /100 | #328 | Tragic 29.1% |
| Scottish | 0.0 /100 | #329 | Tragic 29.1% |
| Germans | 0.0 /100 | #330 | Tragic 29.2% |
| Czechs | 0.0 /100 | #331 | Tragic 29.2% |
| Immigrants | South Central Asia | 0.0 /100 | #332 | Tragic 29.3% |