Trinidadian and Tobagonian 2 or more Vehicles in Household
COMPARE
Trinidadian and Tobagonian
Select to Compare
2 or more Vehicles in Household
Trinidadian and Tobagonian 2 or more Vehicles in Household
40.9%
2+ VEHICLES AVAILABLE
0.0/ 100
METRIC RATING
332nd/ 347
METRIC RANK
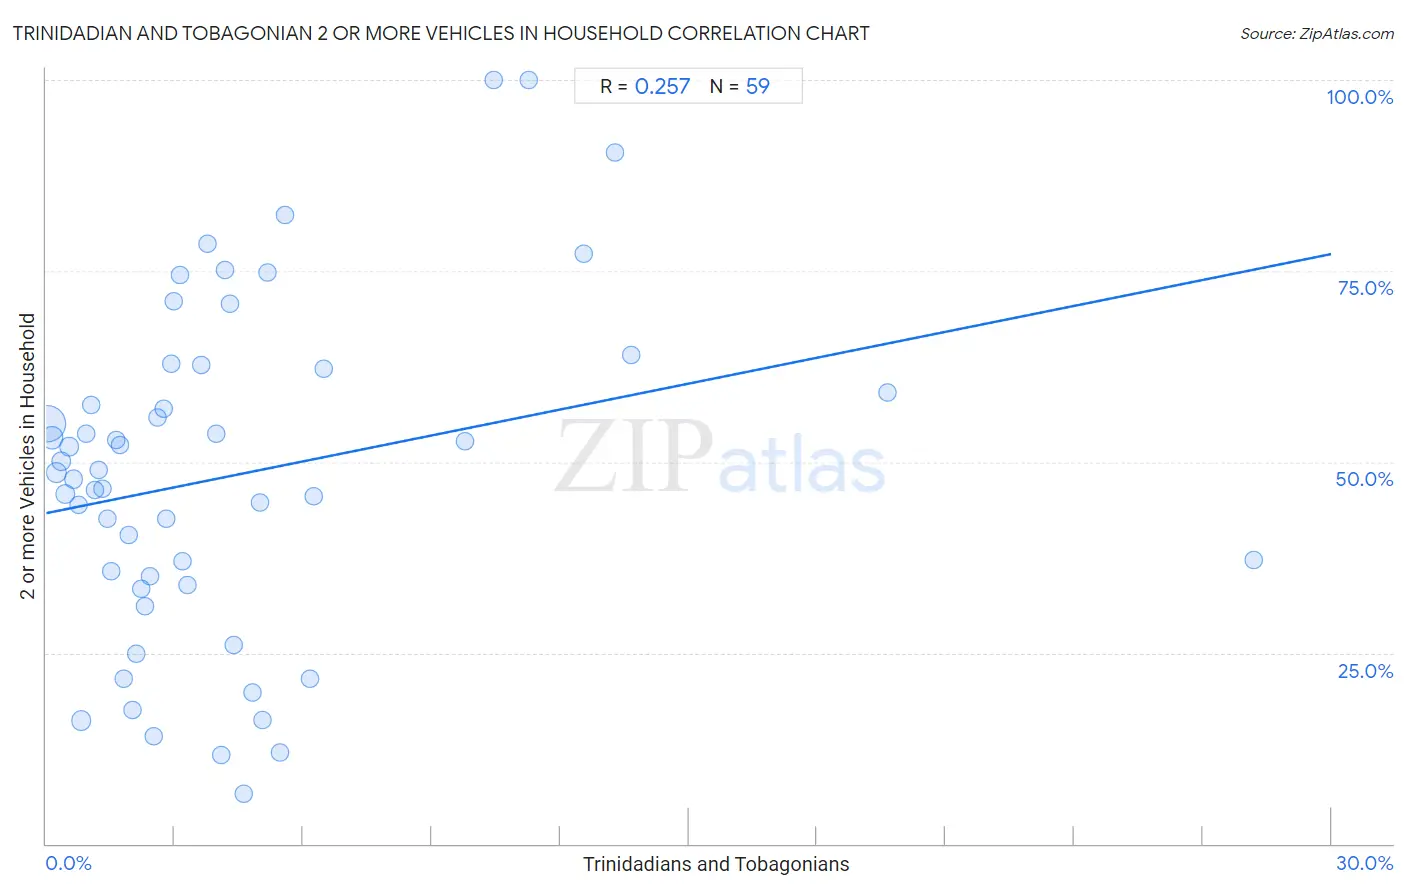
Trinidadian and Tobagonian 2 or more Vehicles in Household Correlation Chart
The statistical analysis conducted on geographies consisting of 219,730,048 people shows a weak positive correlation between the proportion of Trinidadians and Tobagonians and percentage of households with 2 or more vehicles available in the United States with a correlation coefficient (R) of 0.257 and weighted average of 40.9%. On average, for every 1% (one percent) increase in Trinidadians and Tobagonians within a typical geography, there is an increase of 1.1% in percentage of households with 2 or more vehicles available.
It is essential to understand that the correlation between the percentage of Trinidadians and Tobagonians and percentage of households with 2 or more vehicles available does not imply a direct cause-and-effect relationship. It remains uncertain whether the presence of Trinidadians and Tobagonians influences an upward or downward trend in the level of percentage of households with 2 or more vehicles available within an area, or if Trinidadians and Tobagonians simply ended up residing in those areas with higher or lower levels of percentage of households with 2 or more vehicles available due to other factors.
Demographics Similar to Trinidadians and Tobagonians by 2 or more Vehicles in Household
In terms of 2 or more vehicles in household, the demographic groups most similar to Trinidadians and Tobagonians are Immigrants from Ecuador (40.5%, a difference of 0.92%), West Indian (41.3%, a difference of 0.98%), Immigrants from Trinidad and Tobago (40.3%, a difference of 1.5%), Immigrants from Dominica (41.6%, a difference of 1.8%), and Ecuadorian (42.0%, a difference of 2.7%).
| Demographics | Rating | Rank | 2 or more Vehicles in Household |
| Immigrants from West Indies | 0.0 /100 | #325 | Tragic 43.1% |
| Immigrants from Senegal | 0.0 /100 | #326 | Tragic 43.0% |
| Immigrants from Yemen | 0.0 /100 | #327 | Tragic 42.8% |
| Inupiat | 0.0 /100 | #328 | Tragic 42.6% |
| Ecuadorians | 0.0 /100 | #329 | Tragic 42.0% |
| Immigrants from Dominica | 0.0 /100 | #330 | Tragic 41.6% |
| West Indians | 0.0 /100 | #331 | Tragic 41.3% |
| Trinidadians and Tobagonians | 0.0 /100 | #332 | Tragic 40.9% |
| Immigrants from Ecuador | 0.0 /100 | #333 | Tragic 40.5% |
| Immigrants from Trinidad and Tobago | 0.0 /100 | #334 | Tragic 40.3% |
| Immigrants from Bangladesh | 0.0 /100 | #335 | Tragic 38.8% |
| Vietnamese | 0.0 /100 | #336 | Tragic 38.5% |
| Barbadians | 0.0 /100 | #337 | Tragic 38.3% |
| Immigrants from Uzbekistan | 0.0 /100 | #338 | Tragic 37.9% |
| Immigrants from Barbados | 0.0 /100 | #339 | Tragic 35.8% |
Trinidadian and Tobagonian 2 or more Vehicles in Household Correlation Summary
| Measurement | Trinidadian and Tobagonian Data | 2 or more Vehicles in Household Data |
| Minimum | 0.036% | 6.5% |
| Maximum | 28.2% | 100.0% |
| Range | 28.2% | 93.5% |
| Mean | 4.4% | 48.2% |
| Median | 2.9% | 48.5% |
| Interquartile 25% (IQ1) | 1.4% | 33.8% |
| Interquartile 75% (IQ3) | 5.1% | 62.3% |
| Interquartile Range (IQR) | 3.6% | 28.4% |
| Standard Deviation (Sample) | 5.0% | 21.9% |
| Standard Deviation (Population) | 4.9% | 21.8% |
Correlation Details
| Trinidadian and Tobagonian Percentile | Sample Size | 2 or more Vehicles in Household |
[ 0.0% - 0.5% ] 0.036% | 132,810,007 | 55.1% |
[ 0.0% - 0.5% ] 0.14% | 32,294,155 | 53.2% |
[ 0.0% - 0.5% ] 0.23% | 16,434,231 | 48.5% |
[ 0.0% - 0.5% ] 0.34% | 8,726,152 | 50.0% |
[ 0.0% - 0.5% ] 0.44% | 5,115,679 | 45.8% |
[ 0.5% - 1.0% ] 0.54% | 3,237,768 | 52.0% |
[ 0.5% - 1.0% ] 0.63% | 2,415,071 | 47.7% |
[ 0.5% - 1.0% ] 0.75% | 2,129,719 | 44.4% |
[ 0.5% - 1.0% ] 0.82% | 9,470,020 | 16.1% |
[ 0.5% - 1.0% ] 0.93% | 864,867 | 53.7% |
[ 1.0% - 1.5% ] 1.05% | 706,165 | 57.5% |
[ 1.0% - 1.5% ] 1.13% | 879,812 | 46.3% |
[ 1.0% - 1.5% ] 1.23% | 844,412 | 48.9% |
[ 1.0% - 1.5% ] 1.31% | 505,216 | 46.4% |
[ 1.0% - 1.5% ] 1.43% | 531,637 | 42.6% |
[ 1.5% - 2.0% ] 1.51% | 229,907 | 35.6% |
[ 1.5% - 2.0% ] 1.63% | 210,325 | 52.9% |
[ 1.5% - 2.0% ] 1.73% | 214,264 | 52.2% |
[ 1.5% - 2.0% ] 1.82% | 221,400 | 21.5% |
[ 1.5% - 2.0% ] 1.91% | 176,402 | 40.4% |
[ 2.0% - 2.5% ] 2.01% | 113,270 | 17.5% |
[ 2.0% - 2.5% ] 2.09% | 78,239 | 24.9% |
[ 2.0% - 2.5% ] 2.21% | 48,654 | 33.4% |
[ 2.0% - 2.5% ] 2.30% | 213,898 | 31.1% |
[ 2.0% - 2.5% ] 2.43% | 119,105 | 35.1% |
[ 2.5% - 3.0% ] 2.52% | 105,641 | 14.1% |
[ 2.5% - 3.0% ] 2.61% | 18,755 | 55.8% |
[ 2.5% - 3.0% ] 2.73% | 41,983 | 57.0% |
[ 2.5% - 3.0% ] 2.81% | 26,547 | 42.6% |
[ 2.5% - 3.0% ] 2.90% | 63,904 | 62.9% |
[ 2.5% - 3.0% ] 2.97% | 1,649 | 71.1% |
[ 3.0% - 3.5% ] 3.12% | 1,058 | 74.4% |
[ 3.0% - 3.5% ] 3.17% | 28,606 | 36.9% |
[ 3.0% - 3.5% ] 3.31% | 74,741 | 33.8% |
[ 3.5% - 4.0% ] 3.61% | 8,399 | 62.7% |
[ 3.5% - 4.0% ] 3.76% | 719 | 78.6% |
[ 3.5% - 4.0% ] 3.97% | 57,192 | 53.6% |
[ 4.0% - 4.5% ] 4.07% | 87,698 | 11.7% |
[ 4.0% - 4.5% ] 4.17% | 10,495 | 75.2% |
[ 4.0% - 4.5% ] 4.30% | 7,953 | 70.8% |
[ 4.0% - 4.5% ] 4.38% | 150,569 | 26.0% |
[ 4.5% - 5.0% ] 4.62% | 101,053 | 6.5% |
[ 4.5% - 5.0% ] 4.83% | 101,329 | 19.8% |
[ 4.5% - 5.0% ] 4.98% | 51,153 | 44.7% |
[ 5.0% - 5.5% ] 5.05% | 66,262 | 16.1% |
[ 5.0% - 5.5% ] 5.17% | 7,277 | 74.7% |
[ 5.0% - 5.5% ] 5.47% | 78,506 | 12.0% |
[ 5.5% - 6.0% ] 5.57% | 2,332 | 82.4% |
[ 6.0% - 6.5% ] 6.14% | 29,820 | 21.6% |
[ 6.0% - 6.5% ] 6.24% | 2,322 | 45.4% |
[ 6.0% - 6.5% ] 6.49% | 1,510 | 62.3% |
[ 9.5% - 10.0% ] 9.77% | 1,177 | 52.7% |
[ 10.0% - 10.5% ] 10.45% | 134 | 100.0% |
[ 11.0% - 11.5% ] 11.27% | 630 | 100.0% |
[ 12.5% - 13.0% ] 12.56% | 4,179 | 77.3% |
[ 13.0% - 13.5% ] 13.29% | 2,980 | 90.5% |
[ 13.5% - 14.0% ] 13.66% | 681 | 64.0% |
[ 19.5% - 20.0% ] 19.63% | 2,231 | 59.1% |
[ 28.0% - 28.5% ] 28.19% | 188 | 37.2% |