Trinidadian and Tobagonian vs Mongolian Wage/Income Gap
COMPARE
Trinidadian and Tobagonian
Mongolian
Wage/Income Gap
Wage/Income Gap Comparison
Trinidadians and Tobagonians
Mongolians
19.3%
WAGE/INCOME GAP
100.0/ 100
METRIC RATING
13th/ 347
METRIC RANK
26.6%
WAGE/INCOME GAP
11.4/ 100
METRIC RATING
211th/ 347
METRIC RANK
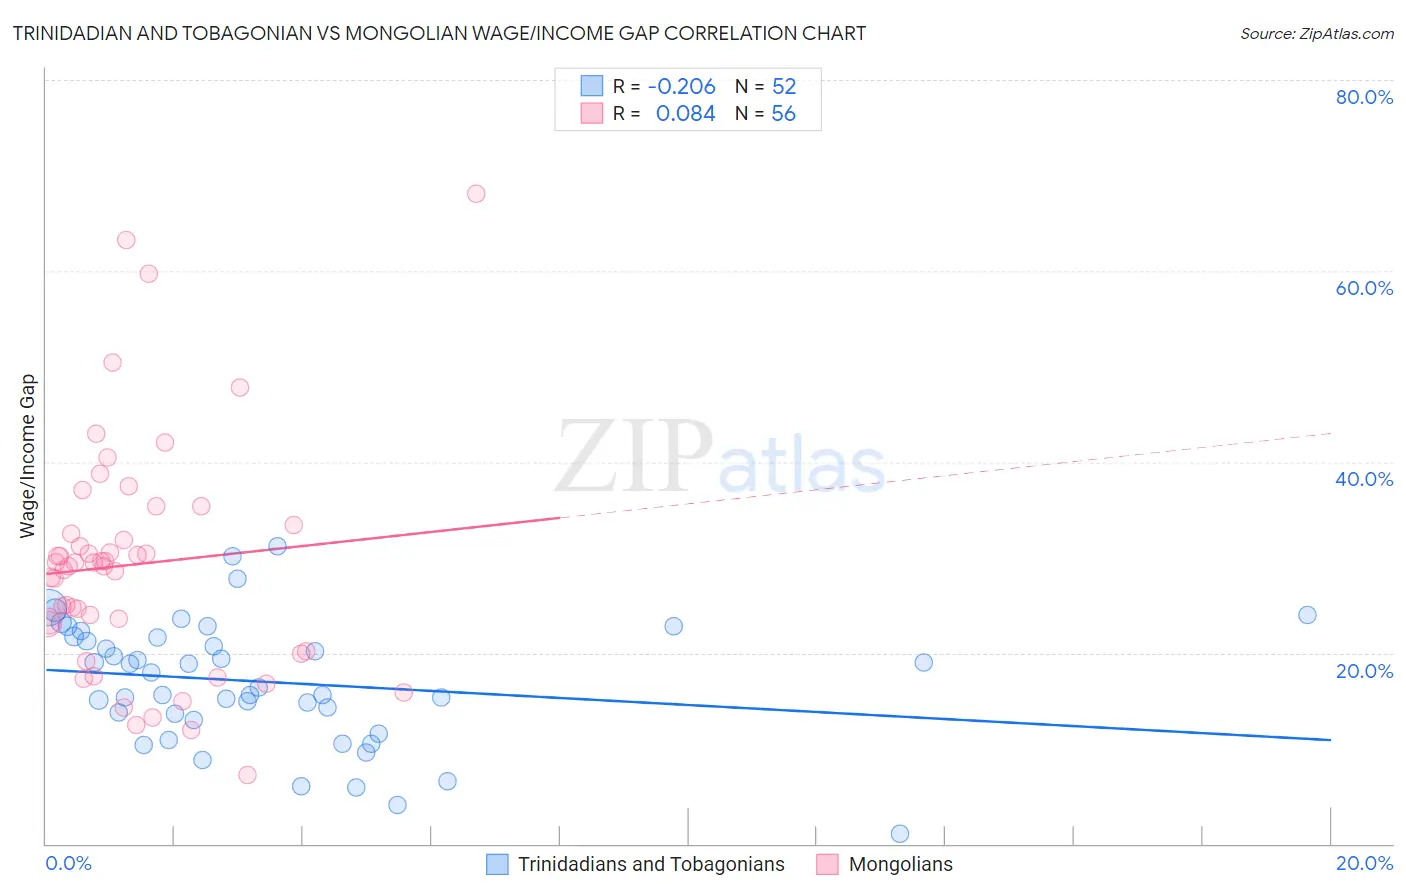
Trinidadian and Tobagonian vs Mongolian Wage/Income Gap Correlation Chart
The statistical analysis conducted on geographies consisting of 219,803,176 people shows a weak negative correlation between the proportion of Trinidadians and Tobagonians and wage/income gap percentage in the United States with a correlation coefficient (R) of -0.206 and weighted average of 19.3%. Similarly, the statistical analysis conducted on geographies consisting of 140,332,926 people shows a slight positive correlation between the proportion of Mongolians and wage/income gap percentage in the United States with a correlation coefficient (R) of 0.084 and weighted average of 26.6%, a difference of 37.8%.
Wage/Income Gap Correlation Summary
| Measurement | Trinidadian and Tobagonian | Mongolian |
| Minimum | 1.0% | 7.3% |
| Maximum | 31.1% | 68.0% |
| Range | 30.1% | 60.8% |
| Mean | 16.9% | 29.3% |
| Median | 17.1% | 29.2% |
| Interquartile 25% (IQ1) | 13.3% | 21.7% |
| Interquartile 75% (IQ3) | 21.6% | 32.9% |
| Interquartile Range (IQR) | 8.3% | 11.2% |
| Standard Deviation (Sample) | 6.5% | 12.2% |
| Standard Deviation (Population) | 6.4% | 12.1% |
Similar Demographics by Wage/Income Gap
Demographics Similar to Trinidadians and Tobagonians by Wage/Income Gap
In terms of wage/income gap, the demographic groups most similar to Trinidadians and Tobagonians are Immigrants from Trinidad and Tobago (19.3%, a difference of 0.050%), Immigrants from West Indies (19.2%, a difference of 0.48%), Immigrants from Haiti (19.2%, a difference of 0.59%), West Indian (19.6%, a difference of 1.2%), and Jamaican (19.6%, a difference of 1.4%).
| Demographics | Rating | Rank | Wage/Income Gap |
| Immigrants | Guyana | 100.0 /100 | #6 | Exceptional 18.4% |
| Puerto Ricans | 100.0 /100 | #7 | Exceptional 18.7% |
| Immigrants | Jamaica | 100.0 /100 | #8 | Exceptional 18.8% |
| Barbadians | 100.0 /100 | #9 | Exceptional 19.0% |
| Crow | 100.0 /100 | #10 | Exceptional 19.1% |
| Immigrants | Haiti | 100.0 /100 | #11 | Exceptional 19.2% |
| Immigrants | West Indies | 100.0 /100 | #12 | Exceptional 19.2% |
| Trinidadians and Tobagonians | 100.0 /100 | #13 | Exceptional 19.3% |
| Immigrants | Trinidad and Tobago | 100.0 /100 | #14 | Exceptional 19.3% |
| West Indians | 100.0 /100 | #15 | Exceptional 19.6% |
| Jamaicans | 100.0 /100 | #16 | Exceptional 19.6% |
| Haitians | 100.0 /100 | #17 | Exceptional 19.7% |
| Hopi | 100.0 /100 | #18 | Exceptional 20.0% |
| Immigrants | Dominica | 100.0 /100 | #19 | Exceptional 20.0% |
| Bahamians | 100.0 /100 | #20 | Exceptional 20.2% |
Demographics Similar to Mongolians by Wage/Income Gap
In terms of wage/income gap, the demographic groups most similar to Mongolians are Iraqi (26.6%, a difference of 0.030%), Arab (26.6%, a difference of 0.13%), Immigrants from Kuwait (26.6%, a difference of 0.17%), Immigrants from Iraq (26.7%, a difference of 0.18%), and Egyptian (26.6%, a difference of 0.19%).
| Demographics | Rating | Rank | Wage/Income Gap |
| Immigrants | Russia | 19.0 /100 | #204 | Poor 26.4% |
| Immigrants | Southern Europe | 17.3 /100 | #205 | Poor 26.4% |
| Indians (Asian) | 16.5 /100 | #206 | Poor 26.4% |
| Immigrants | Italy | 15.8 /100 | #207 | Poor 26.5% |
| Egyptians | 12.7 /100 | #208 | Poor 26.6% |
| Immigrants | Kuwait | 12.6 /100 | #209 | Poor 26.6% |
| Arabs | 12.3 /100 | #210 | Poor 26.6% |
| Mongolians | 11.4 /100 | #211 | Poor 26.6% |
| Iraqis | 11.2 /100 | #212 | Poor 26.6% |
| Immigrants | Iraq | 10.3 /100 | #213 | Poor 26.7% |
| Immigrants | China | 10.3 /100 | #214 | Poor 26.7% |
| Yugoslavians | 9.7 /100 | #215 | Tragic 26.7% |
| Immigrants | Portugal | 9.5 /100 | #216 | Tragic 26.7% |
| Brazilians | 9.2 /100 | #217 | Tragic 26.7% |
| Immigrants | Saudi Arabia | 9.1 /100 | #218 | Tragic 26.7% |