South American Indian Married-couple Households
COMPARE
South American Indian
Select to Compare
Married-couple Households
South American Indian Married-couple Households
46.0%
MARRIED-COUPLE HOUSEHOLDS
28.4/ 100
METRIC RATING
188th/ 347
METRIC RANK
South American Indian Married-couple Households Correlation Chart
The statistical analysis conducted on geographies consisting of 164,540,449 people shows no correlation between the proportion of South American Indians and percentage of married-couple family households in the United States with a correlation coefficient (R) of 0.004 and weighted average of 46.0%. On average, for every 1% (one percent) increase in South American Indians within a typical geography, there is an increase of 0.0083% in percentage of married-couple family households.
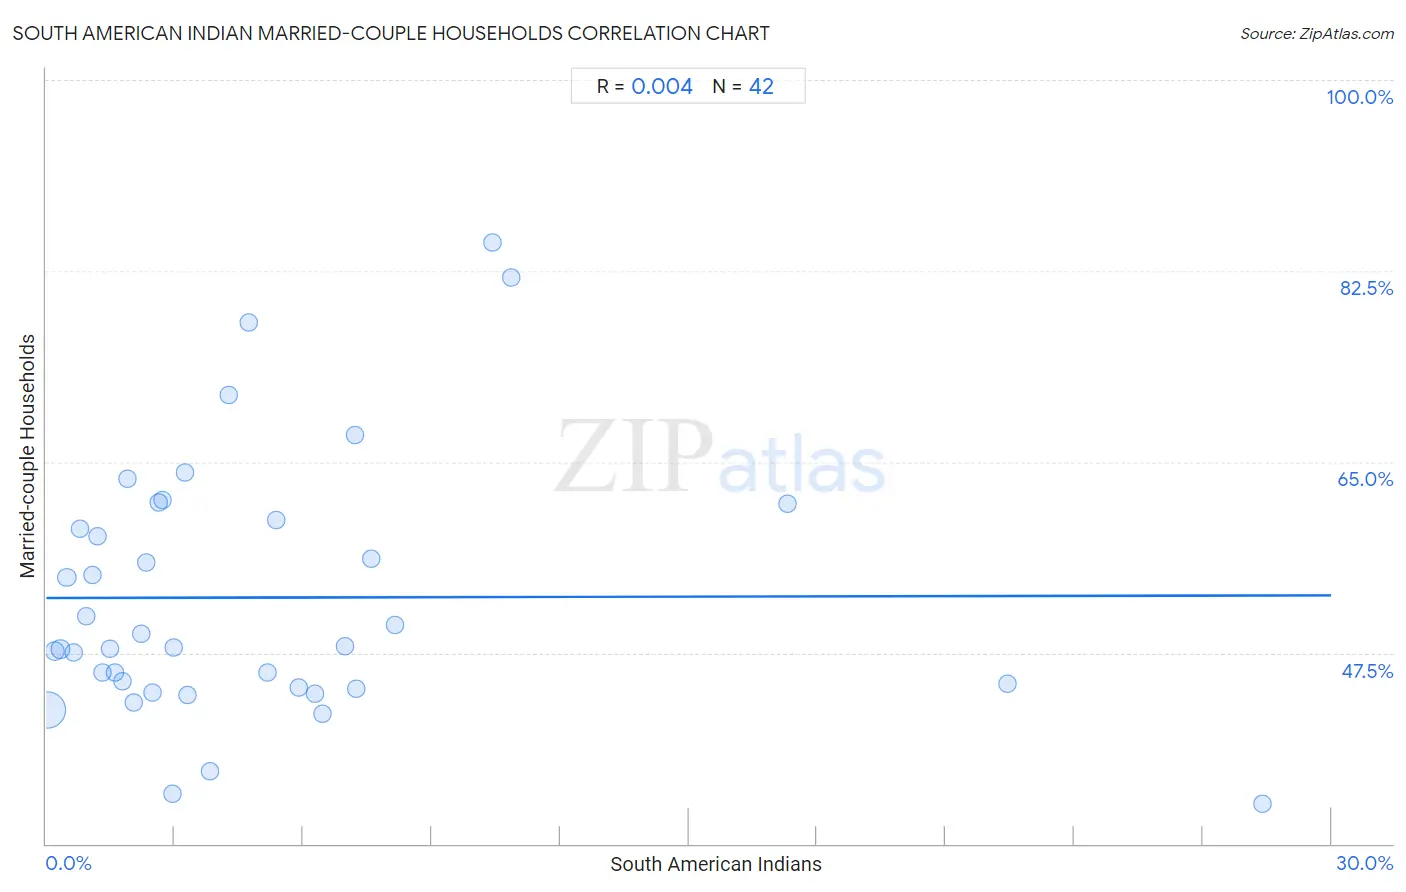
It is essential to understand that the correlation between the percentage of South American Indians and percentage of married-couple family households does not imply a direct cause-and-effect relationship. It remains uncertain whether the presence of South American Indians influences an upward or downward trend in the level of percentage of married-couple family households within an area, or if South American Indians simply ended up residing in those areas with higher or lower levels of percentage of married-couple family households due to other factors.
Demographics Similar to South American Indians by Married-couple Households
In terms of married-couple households, the demographic groups most similar to South American Indians are Fijian (46.1%, a difference of 0.040%), Immigrants from Latvia (46.0%, a difference of 0.070%), Albanian (46.1%, a difference of 0.13%), Immigrants from Kuwait (46.0%, a difference of 0.14%), and Choctaw (46.0%, a difference of 0.17%).
| Demographics | Rating | Rank | Married-couple Households |
| Malaysians | 41.8 /100 | #181 | Average 46.3% |
| Yugoslavians | 38.9 /100 | #182 | Fair 46.2% |
| Immigrants from Brazil | 38.3 /100 | #183 | Fair 46.2% |
| Immigrants from Switzerland | 36.9 /100 | #184 | Fair 46.2% |
| Brazilians | 35.9 /100 | #185 | Fair 46.2% |
| Albanians | 31.1 /100 | #186 | Fair 46.1% |
| Fijians | 29.2 /100 | #187 | Fair 46.1% |
| South American Indians | 28.4 /100 | #188 | Fair 46.0% |
| Immigrants from Latvia | 26.9 /100 | #189 | Fair 46.0% |
| Immigrants from Kuwait | 25.6 /100 | #190 | Fair 46.0% |
| Choctaw | 24.9 /100 | #191 | Fair 46.0% |
| Immigrants from Northern Africa | 24.6 /100 | #192 | Fair 46.0% |
| Taiwanese | 23.4 /100 | #193 | Fair 45.9% |
| Mexican American Indians | 23.3 /100 | #194 | Fair 45.9% |
| Chickasaw | 22.7 /100 | #195 | Fair 45.9% |
South American Indian Married-couple Households Correlation Summary
| Measurement | South American Indian Data | Married-couple Households Data |
| Minimum | 0.038% | 33.6% |
| Maximum | 28.4% | 85.1% |
| Range | 28.3% | 51.5% |
| Mean | 5.0% | 52.6% |
| Median | 3.0% | 48.0% |
| Interquartile 25% (IQ1) | 1.5% | 44.3% |
| Interquartile 75% (IQ3) | 6.4% | 59.6% |
| Interquartile Range (IQR) | 5.0% | 15.3% |
| Standard Deviation (Sample) | 5.8% | 11.9% |
| Standard Deviation (Population) | 5.8% | 11.7% |
Correlation Details
| South American Indian Percentile | Sample Size | Married-couple Households |
[ 0.0% - 0.5% ] 0.038% | 145,853,509 | 42.2% |
[ 0.0% - 0.5% ] 0.20% | 12,427,105 | 47.7% |
[ 0.0% - 0.5% ] 0.33% | 3,276,433 | 47.8% |
[ 0.0% - 0.5% ] 0.48% | 1,021,708 | 54.4% |
[ 0.5% - 1.0% ] 0.63% | 856,921 | 47.5% |
[ 0.5% - 1.0% ] 0.78% | 365,322 | 58.8% |
[ 0.5% - 1.0% ] 0.93% | 111,674 | 50.8% |
[ 1.0% - 1.5% ] 1.07% | 207,688 | 54.7% |
[ 1.0% - 1.5% ] 1.19% | 106,667 | 58.2% |
[ 1.0% - 1.5% ] 1.32% | 122,596 | 45.7% |
[ 1.0% - 1.5% ] 1.48% | 34,887 | 47.9% |
[ 1.5% - 2.0% ] 1.61% | 19,888 | 45.6% |
[ 1.5% - 2.0% ] 1.77% | 23,028 | 44.9% |
[ 1.5% - 2.0% ] 1.90% | 11,601 | 63.4% |
[ 2.0% - 2.5% ] 2.05% | 3,118 | 43.0% |
[ 2.0% - 2.5% ] 2.22% | 34,798 | 49.3% |
[ 2.0% - 2.5% ] 2.33% | 1,590 | 55.8% |
[ 2.0% - 2.5% ] 2.48% | 121 | 43.9% |
[ 2.5% - 3.0% ] 2.63% | 1,676 | 61.3% |
[ 2.5% - 3.0% ] 2.72% | 15,893 | 61.5% |
[ 2.5% - 3.0% ] 2.95% | 6,299 | 34.6% |
[ 2.5% - 3.0% ] 2.99% | 1,172 | 48.0% |
[ 3.0% - 3.5% ] 3.23% | 13,111 | 64.1% |
[ 3.0% - 3.5% ] 3.29% | 1,035 | 43.7% |
[ 3.5% - 4.0% ] 3.84% | 3,883 | 36.6% |
[ 4.0% - 4.5% ] 4.25% | 729 | 71.2% |
[ 4.5% - 5.0% ] 4.74% | 2,829 | 77.8% |
[ 5.0% - 5.5% ] 5.15% | 291 | 45.7% |
[ 5.0% - 5.5% ] 5.37% | 1,359 | 59.6% |
[ 5.5% - 6.0% ] 5.91% | 2,540 | 44.3% |
[ 6.0% - 6.5% ] 6.27% | 558 | 43.7% |
[ 6.0% - 6.5% ] 6.44% | 652 | 41.9% |
[ 6.5% - 7.0% ] 6.98% | 3,781 | 48.1% |
[ 7.0% - 7.5% ] 7.20% | 625 | 67.4% |
[ 7.0% - 7.5% ] 7.25% | 2,084 | 44.2% |
[ 7.5% - 8.0% ] 7.58% | 963 | 56.1% |
[ 8.0% - 8.5% ] 8.14% | 1,056 | 50.0% |
[ 10.0% - 10.5% ] 10.42% | 432 | 85.1% |
[ 10.5% - 11.0% ] 10.87% | 276 | 81.9% |
[ 17.0% - 17.5% ] 17.31% | 52 | 61.1% |
[ 22.0% - 22.5% ] 22.45% | 196 | 44.6% |
[ 28.0% - 28.5% ] 28.38% | 303 | 33.6% |