South American Indian 1 or more Vehicles in Household
COMPARE
South American Indian
Select to Compare
1 or more Vehicles in Household
South American Indian 1 or more Vehicles in Household
88.0%
1+ VEHICLES AVAILABLE
0.9/ 100
METRIC RATING
258th/ 347
METRIC RANK
South American Indian 1 or more Vehicles in Household Correlation Chart
The statistical analysis conducted on geographies consisting of 164,540,397 people shows a mild positive correlation between the proportion of South American Indians and percentage of households with 1 or more vehicles available in the United States with a correlation coefficient (R) of 0.367 and weighted average of 88.0%. On average, for every 1% (one percent) increase in South American Indians within a typical geography, there is an increase of 0.34% in percentage of households with 1 or more vehicles available.
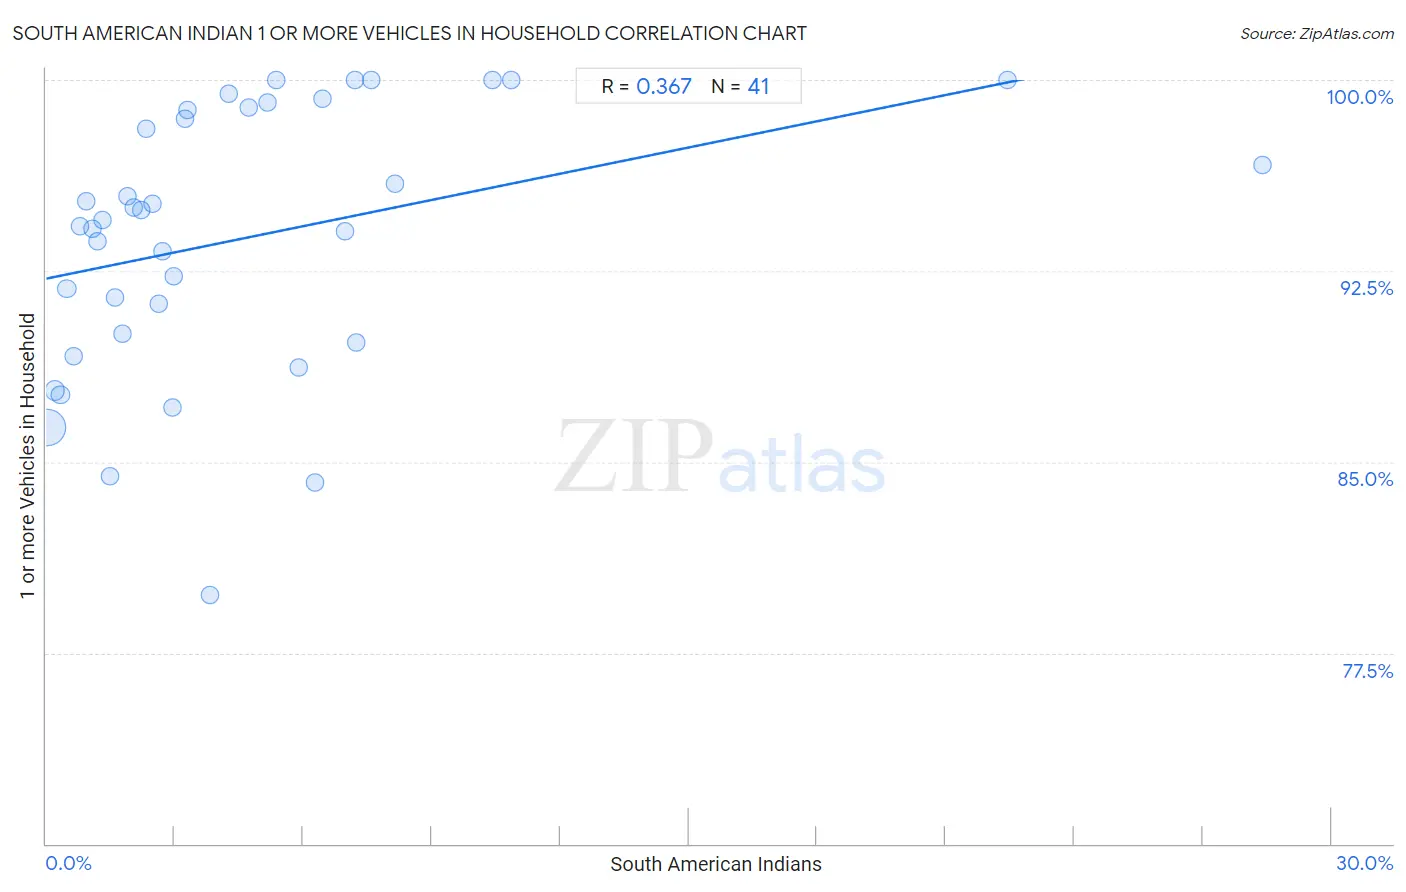
It is essential to understand that the correlation between the percentage of South American Indians and percentage of households with 1 or more vehicles available does not imply a direct cause-and-effect relationship. It remains uncertain whether the presence of South American Indians influences an upward or downward trend in the level of percentage of households with 1 or more vehicles available within an area, or if South American Indians simply ended up residing in those areas with higher or lower levels of percentage of households with 1 or more vehicles available due to other factors.
Demographics Similar to South American Indians by 1 or more Vehicles in Household
In terms of 1 or more vehicles in household, the demographic groups most similar to South American Indians are Liberian (88.0%, a difference of 0.0%), Immigrants from Latvia (88.1%, a difference of 0.010%), Colombian (88.0%, a difference of 0.010%), Nigerian (88.0%, a difference of 0.030%), and Honduran (88.1%, a difference of 0.040%).
| Demographics | Rating | Rank | 1 or more Vehicles in Household |
| Immigrants from Serbia | 1.2 /100 | #251 | Tragic 88.2% |
| Immigrants from Uruguay | 1.1 /100 | #252 | Tragic 88.1% |
| Hondurans | 1.0 /100 | #253 | Tragic 88.1% |
| Haitians | 0.9 /100 | #254 | Tragic 88.1% |
| Immigrants from Latvia | 0.9 /100 | #255 | Tragic 88.1% |
| Colombians | 0.9 /100 | #256 | Tragic 88.0% |
| Liberians | 0.9 /100 | #257 | Tragic 88.0% |
| South American Indians | 0.9 /100 | #258 | Tragic 88.0% |
| Nigerians | 0.8 /100 | #259 | Tragic 88.0% |
| Macedonians | 0.6 /100 | #260 | Tragic 87.9% |
| Immigrants from Switzerland | 0.6 /100 | #261 | Tragic 87.9% |
| Sub-Saharan Africans | 0.5 /100 | #262 | Tragic 87.9% |
| Immigrants from Egypt | 0.5 /100 | #263 | Tragic 87.8% |
| Immigrants from Liberia | 0.4 /100 | #264 | Tragic 87.8% |
| Africans | 0.4 /100 | #265 | Tragic 87.8% |
South American Indian 1 or more Vehicles in Household Correlation Summary
| Measurement | South American Indian Data | 1 or more Vehicles in Household Data |
| Minimum | 0.038% | 79.8% |
| Maximum | 28.4% | 100.0% |
| Range | 28.3% | 20.2% |
| Mean | 4.7% | 93.8% |
| Median | 3.0% | 94.5% |
| Interquartile 25% (IQ1) | 1.4% | 89.9% |
| Interquartile 75% (IQ3) | 6.4% | 98.9% |
| Interquartile Range (IQR) | 5.0% | 9.0% |
| Standard Deviation (Sample) | 5.6% | 5.2% |
| Standard Deviation (Population) | 5.5% | 5.1% |
Correlation Details
| South American Indian Percentile | Sample Size | 1 or more Vehicles in Household |
[ 0.0% - 0.5% ] 0.038% | 145,853,509 | 86.4% |
[ 0.0% - 0.5% ] 0.20% | 12,427,105 | 87.8% |
[ 0.0% - 0.5% ] 0.33% | 3,276,433 | 87.6% |
[ 0.0% - 0.5% ] 0.48% | 1,021,708 | 91.8% |
[ 0.5% - 1.0% ] 0.63% | 856,921 | 89.2% |
[ 0.5% - 1.0% ] 0.78% | 365,322 | 94.3% |
[ 0.5% - 1.0% ] 0.93% | 111,674 | 95.2% |
[ 1.0% - 1.5% ] 1.07% | 207,688 | 94.1% |
[ 1.0% - 1.5% ] 1.19% | 106,667 | 93.7% |
[ 1.0% - 1.5% ] 1.32% | 122,596 | 94.5% |
[ 1.0% - 1.5% ] 1.48% | 34,887 | 84.4% |
[ 1.5% - 2.0% ] 1.61% | 19,888 | 91.4% |
[ 1.5% - 2.0% ] 1.77% | 23,028 | 90.0% |
[ 1.5% - 2.0% ] 1.90% | 11,601 | 95.4% |
[ 2.0% - 2.5% ] 2.05% | 3,118 | 95.0% |
[ 2.0% - 2.5% ] 2.22% | 34,798 | 94.9% |
[ 2.0% - 2.5% ] 2.33% | 1,590 | 98.1% |
[ 2.0% - 2.5% ] 2.48% | 121 | 95.1% |
[ 2.5% - 3.0% ] 2.63% | 1,676 | 91.2% |
[ 2.5% - 3.0% ] 2.72% | 15,893 | 93.3% |
[ 2.5% - 3.0% ] 2.95% | 6,299 | 87.2% |
[ 2.5% - 3.0% ] 2.99% | 1,172 | 92.3% |
[ 3.0% - 3.5% ] 3.23% | 13,111 | 98.5% |
[ 3.0% - 3.5% ] 3.29% | 1,035 | 98.8% |
[ 3.5% - 4.0% ] 3.84% | 3,883 | 79.8% |
[ 4.0% - 4.5% ] 4.25% | 729 | 99.5% |
[ 4.5% - 5.0% ] 4.74% | 2,829 | 98.9% |
[ 5.0% - 5.5% ] 5.15% | 291 | 99.1% |
[ 5.0% - 5.5% ] 5.37% | 1,359 | 100.0% |
[ 5.5% - 6.0% ] 5.91% | 2,540 | 88.7% |
[ 6.0% - 6.5% ] 6.27% | 558 | 84.2% |
[ 6.0% - 6.5% ] 6.44% | 652 | 99.3% |
[ 6.5% - 7.0% ] 6.98% | 3,781 | 94.1% |
[ 7.0% - 7.5% ] 7.20% | 625 | 100.0% |
[ 7.0% - 7.5% ] 7.25% | 2,084 | 89.7% |
[ 7.5% - 8.0% ] 7.58% | 963 | 100.0% |
[ 8.0% - 8.5% ] 8.14% | 1,056 | 95.9% |
[ 10.0% - 10.5% ] 10.42% | 432 | 100.0% |
[ 10.5% - 11.0% ] 10.87% | 276 | 100.0% |
[ 22.0% - 22.5% ] 22.45% | 196 | 100.0% |
[ 28.0% - 28.5% ] 28.38% | 303 | 96.6% |