South American Indian Self-Care Disability
COMPARE
South American Indian
Select to Compare
Self-Care Disability
South American Indian Self-Care Disability
2.4%
SELF-CARE DISABILITY
87.2/ 100
METRIC RATING
136th/ 347
METRIC RANK
South American Indian Self-Care Disability Correlation Chart
The statistical analysis conducted on geographies consisting of 164,517,360 people shows no correlation between the proportion of South American Indians and percentage of population with self-care disability in the United States with a correlation coefficient (R) of 0.041 and weighted average of 2.4%. On average, for every 1% (one percent) increase in South American Indians within a typical geography, there is an increase of 0.022% in percentage of population with self-care disability.
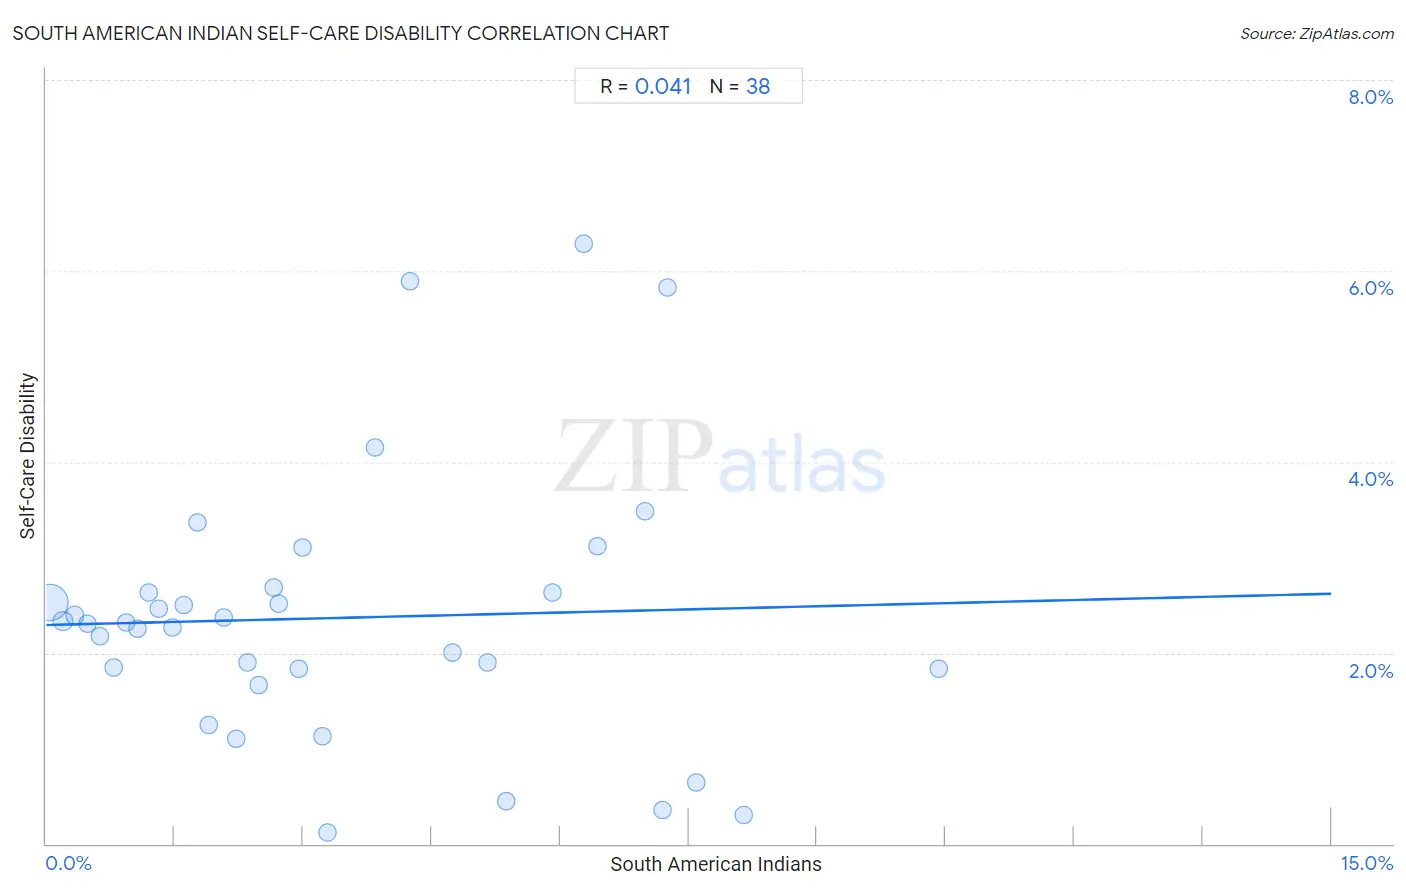
It is essential to understand that the correlation between the percentage of South American Indians and percentage of population with self-care disability does not imply a direct cause-and-effect relationship. It remains uncertain whether the presence of South American Indians influences an upward or downward trend in the level of percentage of population with self-care disability within an area, or if South American Indians simply ended up residing in those areas with higher or lower levels of percentage of population with self-care disability due to other factors.
Demographics Similar to South American Indians by Self-Care Disability
In terms of self-care disability, the demographic groups most similar to South American Indians are Austrian (2.4%, a difference of 0.020%), Laotian (2.4%, a difference of 0.070%), Immigrants from Croatia (2.4%, a difference of 0.070%), Sri Lankan (2.4%, a difference of 0.070%), and Russian (2.4%, a difference of 0.12%).
| Demographics | Rating | Rank | Self-Care Disability |
| Immigrants from Romania | 89.3 /100 | #129 | Excellent 2.4% |
| Immigrants from Austria | 89.0 /100 | #130 | Excellent 2.4% |
| Poles | 88.9 /100 | #131 | Excellent 2.4% |
| Immigrants from South America | 88.8 /100 | #132 | Excellent 2.4% |
| Immigrants from Colombia | 88.5 /100 | #133 | Excellent 2.4% |
| Russians | 88.2 /100 | #134 | Excellent 2.4% |
| Laotians | 87.8 /100 | #135 | Excellent 2.4% |
| South American Indians | 87.2 /100 | #136 | Excellent 2.4% |
| Austrians | 87.0 /100 | #137 | Excellent 2.4% |
| Immigrants from Croatia | 86.6 /100 | #138 | Excellent 2.4% |
| Sri Lankans | 86.6 /100 | #139 | Excellent 2.4% |
| Immigrants from Uruguay | 85.4 /100 | #140 | Excellent 2.4% |
| Alaska Natives | 84.5 /100 | #141 | Excellent 2.4% |
| Immigrants from Peru | 83.2 /100 | #142 | Excellent 2.4% |
| Afghans | 82.3 /100 | #143 | Excellent 2.4% |
South American Indian Self-Care Disability Correlation Summary
| Measurement | South American Indian Data | Self-Care Disability Data |
| Minimum | 0.038% | 0.11% |
| Maximum | 10.4% | 6.3% |
| Range | 10.4% | 6.2% |
| Mean | 3.4% | 2.4% |
| Median | 2.7% | 2.3% |
| Interquartile 25% (IQ1) | 1.3% | 1.8% |
| Interquartile 75% (IQ3) | 5.4% | 2.6% |
| Interquartile Range (IQR) | 4.1% | 0.81% |
| Standard Deviation (Sample) | 2.6% | 1.4% |
| Standard Deviation (Population) | 2.6% | 1.4% |
Correlation Details
| South American Indian Percentile | Sample Size | Self-Care Disability |
[ 0.0% - 0.5% ] 0.038% | 145,854,440 | 2.5% |
[ 0.0% - 0.5% ] 0.20% | 12,419,797 | 2.3% |
[ 0.0% - 0.5% ] 0.33% | 3,275,873 | 2.4% |
[ 0.0% - 0.5% ] 0.48% | 1,021,708 | 2.3% |
[ 0.5% - 1.0% ] 0.63% | 856,756 | 2.2% |
[ 0.5% - 1.0% ] 0.78% | 365,322 | 1.9% |
[ 0.5% - 1.0% ] 0.93% | 110,855 | 2.3% |
[ 1.0% - 1.5% ] 1.07% | 207,688 | 2.3% |
[ 1.0% - 1.5% ] 1.20% | 96,637 | 2.6% |
[ 1.0% - 1.5% ] 1.32% | 122,596 | 2.5% |
[ 1.0% - 1.5% ] 1.48% | 34,887 | 2.3% |
[ 1.5% - 2.0% ] 1.61% | 19,824 | 2.5% |
[ 1.5% - 2.0% ] 1.77% | 23,028 | 3.4% |
[ 1.5% - 2.0% ] 1.90% | 11,448 | 1.2% |
[ 2.0% - 2.5% ] 2.07% | 2,419 | 2.4% |
[ 2.0% - 2.5% ] 2.22% | 33,691 | 1.1% |
[ 2.0% - 2.5% ] 2.35% | 1,150 | 1.9% |
[ 2.0% - 2.5% ] 2.48% | 121 | 1.7% |
[ 2.5% - 3.0% ] 2.66% | 1,015 | 2.7% |
[ 2.5% - 3.0% ] 2.72% | 15,893 | 2.5% |
[ 2.5% - 3.0% ] 2.95% | 6,299 | 1.8% |
[ 2.5% - 3.0% ] 2.99% | 1,172 | 3.1% |
[ 3.0% - 3.5% ] 3.22% | 11,971 | 1.1% |
[ 3.0% - 3.5% ] 3.29% | 1,035 | 0.11% |
[ 3.5% - 4.0% ] 3.84% | 3,883 | 4.1% |
[ 4.0% - 4.5% ] 4.25% | 682 | 5.9% |
[ 4.5% - 5.0% ] 4.74% | 2,829 | 2.0% |
[ 5.0% - 5.5% ] 5.15% | 291 | 1.9% |
[ 5.0% - 5.5% ] 5.37% | 1,359 | 0.45% |
[ 5.5% - 6.0% ] 5.91% | 2,540 | 2.6% |
[ 6.0% - 6.5% ] 6.27% | 558 | 6.3% |
[ 6.0% - 6.5% ] 6.44% | 652 | 3.1% |
[ 6.5% - 7.0% ] 6.98% | 3,781 | 3.5% |
[ 7.0% - 7.5% ] 7.20% | 625 | 0.36% |
[ 7.0% - 7.5% ] 7.25% | 2,084 | 5.8% |
[ 7.5% - 8.0% ] 7.58% | 963 | 0.64% |
[ 8.0% - 8.5% ] 8.14% | 1,056 | 0.30% |
[ 10.0% - 10.5% ] 10.42% | 432 | 1.8% |