South American Indian GED/Equivalency

COMPARE

South American Indian
Race
Ancestry
AfghanAfricanAlaska NativeAlaskan AthabascanAlbanianAleutAlsatianAmericanApacheArabArapahoArgentineanArmenianAssyrian/Chaldean/SyriacAustralianAustrianBahamianBangladeshiBarbadianBasqueBelgianBelizeanBermudanBhutaneseBlackfeetBolivianBrazilianBritishBritish West IndianBulgarianBurmeseCajunCambodianCanadianCape VerdeanCarpatho RusynCelticCentral AmericanCentral American IndianCherokeeCheyenneChickasawChileanChineseChippewaChoctawColombianColvilleComancheCosta RicanCreeCreekCroatianCrowCubanCypriotCzechCzechoslovakianDanishDelawareDominicanDutchDutch West IndianEastern EuropeanEcuadorianEgyptianEnglishEstonianEthiopianEuropeanFijianFilipinoFinnishFrenchFrench American IndianFrench CanadianGermanGerman RussianGhanaianGreekGuamanian/ChamorroGuatemalanGuyaneseHaitianHmongHonduranHopiHoumaHungarianIcelanderIndian (Asian)IndonesianInupiatIranianIraqiIrishIroquoisIsraeliItalianJamaicanJapaneseJordanianKenyanKiowaKoreanLaotianLatvianLebaneseLiberianLithuanianLumbeeLuxembourgerMacedonianMalaysianMalteseMarshalleseMenomineeMexicanMexican American IndianMongolianMoroccanNative HawaiianNavajoNepaleseNew ZealanderNicaraguanNigerianNorthern EuropeanNorwegianOkinawanOsageOttawaPaiutePakistaniPalestinianPanamanianParaguayanPennsylvania GermanPeruvianPimaPolishPortuguesePotawatomiPuebloPuerto RicanPuget Sound SalishRomanianRussianSalvadoranSamoanScandinavianScotch-IrishScottishSeminoleSenegaleseSerbianShoshoneSierra LeoneanSiouxSlavicSlovakSloveneSomaliSouth AfricanSouth AmericanSouth American IndianSoviet UnionSpaniardSpanishSpanish AmericanSpanish American IndianSri LankanSubsaharan AfricanSudaneseSwedishSwissSyrianTaiwaneseThaiTlingit-HaidaTohono O'OdhamTonganTrinidadian and TobagonianTsimshianTurkishU.S. Virgin IslanderUgandanUkrainianUruguayanUteVenezuelanVietnameseWelshWest IndianYakamaYaquiYugoslavianYumanYup'ikZimbabwean
Immigration
NonimmigrantsImmigrantsAfghanistanAfricaAlbaniaArgentinaArmeniaAsiaAustraliaAustriaBahamasBangladeshBarbadosBelarusBelgiumBelizeBoliviaBosnia and HerzegovinaBrazilBulgariaBurma/MyanmarCabo VerdeCambodiaCameroonCanadaCaribbeanCentral AmericaChileChinaColombiaCongoCosta RicaCroatiaCubaCzechoslovakiaDenmarkDominicaDominican RepublicEastern AfricaEastern AsiaEastern EuropeEcuadorEgyptEl SalvadorEnglandEritreaEthiopiaEuropeFijiFranceGermanyGhanaGreeceGrenadaGuatemalaGuyanaHaitiHondurasHong KongHungaryIndiaIndonesiaIranIraqIrelandIsraelItalyJamaicaJapanJordanKazakhstanKenyaKoreaKuwaitLaosLatin AmericaLatviaLebanonLiberiaLithuaniaMalaysiaMexicoMicronesiaMiddle AfricaMoldovaMoroccoNepalNetherlandsNicaraguaNigeriaNorth AmericaNorth MacedoniaNorthern AfricaNorthern EuropeNorwayOceaniaPakistanPanamaPeruPhilippinesPolandPortugalRomaniaRussiaSaudi ArabiaScotlandSenegalSerbiaSierra LeoneSingaporeSomaliaSouth AfricaSouth AmericaSouth Central AsiaSouth Eastern AsiaSouthern EuropeSpainSri LankaSt. Vincent and the GrenadinesSudanSwedenSwitzerlandSyriaTaiwanThailandTrinidad and TobagoTurkeyUgandaUkraineUruguayUzbekistanVenezuelaVietnamWest IndiesWestern AfricaWestern AsiaWestern EuropeYemenZaireZimbabweAzores
Select to Compare
Race
Ancestry
AfghanAfricanAlaska NativeAlaskan AthabascanAlbanianAleutAlsatianAmericanApacheArabArapahoArgentineanArmenianAssyrian/Chaldean/SyriacAustralianAustrianBahamianBangladeshiBarbadianBasqueBelgianBelizeanBermudanBhutaneseBlackfeetBolivianBrazilianBritishBritish West IndianBulgarianBurmeseCajunCambodianCanadianCape VerdeanCarpatho RusynCelticCentral AmericanCentral American IndianCherokeeCheyenneChickasawChileanChineseChippewaChoctawColombianColvilleComancheCosta RicanCreeCreekCroatianCrowCubanCypriotCzechCzechoslovakianDanishDelawareDominicanDutchDutch West IndianEastern EuropeanEcuadorianEgyptianEnglishEstonianEthiopianEuropeanFijianFilipinoFinnishFrenchFrench American IndianFrench CanadianGermanGerman RussianGhanaianGreekGuamanian/ChamorroGuatemalanGuyaneseHaitianHmongHonduranHopiHoumaHungarianIcelanderIndian (Asian)IndonesianInupiatIranianIraqiIrishIroquoisIsraeliItalianJamaicanJapaneseJordanianKenyanKiowaKoreanLaotianLatvianLebaneseLiberianLithuanianLumbeeLuxembourgerMacedonianMalaysianMalteseMarshalleseMenomineeMexicanMexican American IndianMongolianMoroccanNative HawaiianNavajoNepaleseNew ZealanderNicaraguanNigerianNorthern EuropeanNorwegianOkinawanOsageOttawaPaiutePakistaniPalestinianPanamanianParaguayanPennsylvania GermanPeruvianPimaPolishPortuguesePotawatomiPuebloPuerto RicanPuget Sound SalishRomanianRussianSalvadoranSamoanScandinavianScotch-IrishScottishSeminoleSenegaleseSerbianShoshoneSierra LeoneanSiouxSlavicSlovakSloveneSomaliSouth AfricanSouth AmericanSoviet UnionSpaniardSpanishSpanish AmericanSpanish American IndianSri LankanSubsaharan AfricanSudaneseSwedishSwissSyrianTaiwaneseThaiTlingit-HaidaTohono O'OdhamTonganTrinidadian and TobagonianTsimshianTurkishU.S. Virgin IslanderUgandanUkrainianUruguayanUteVenezuelanVietnameseWelshWest IndianYakamaYaquiYugoslavianYumanYup'ikZimbabwean
Immigration
NonimmigrantsImmigrantsAfghanistanAfricaAlbaniaArgentinaArmeniaAsiaAustraliaAustriaBahamasBangladeshBarbadosBelarusBelgiumBelizeBoliviaBosnia and HerzegovinaBrazilBulgariaBurma/MyanmarCabo VerdeCambodiaCameroonCanadaCaribbeanCentral AmericaChileChinaColombiaCongoCosta RicaCroatiaCubaCzechoslovakiaDenmarkDominicaDominican RepublicEastern AfricaEastern AsiaEastern EuropeEcuadorEgyptEl SalvadorEnglandEritreaEthiopiaEuropeFijiFranceGermanyGhanaGreeceGrenadaGuatemalaGuyanaHaitiHondurasHong KongHungaryIndiaIndonesiaIranIraqIrelandIsraelItalyJamaicaJapanJordanKazakhstanKenyaKoreaKuwaitLaosLatin AmericaLatviaLebanonLiberiaLithuaniaMalaysiaMexicoMicronesiaMiddle AfricaMoldovaMoroccoNepalNetherlandsNicaraguaNigeriaNorth AmericaNorth MacedoniaNorthern AfricaNorthern EuropeNorwayOceaniaPakistanPanamaPeruPhilippinesPolandPortugalRomaniaRussiaSaudi ArabiaScotlandSenegalSerbiaSierra LeoneSingaporeSomaliaSouth AfricaSouth AmericaSouth Central AsiaSouth Eastern AsiaSouthern EuropeSpainSri LankaSt. Vincent and the GrenadinesSudanSwedenSwitzerlandSyriaTaiwanThailandTrinidad and TobagoTurkeyUgandaUkraineUruguayUzbekistanVenezuelaVietnamWest IndiesWestern AfricaWestern AsiaWestern EuropeYemenZaireZimbabweAzores
GED/Equivalency
Income
Poverty
Unemployment
Labor Participation
Family Structure
Vehicle Availability
Education Level
Disability

South American Indian GED/Equivalency
Fair

85.2%
GED/EQUIVALENCY
22.8/ 100
METRIC RATING
191st/ 347
METRIC RANK

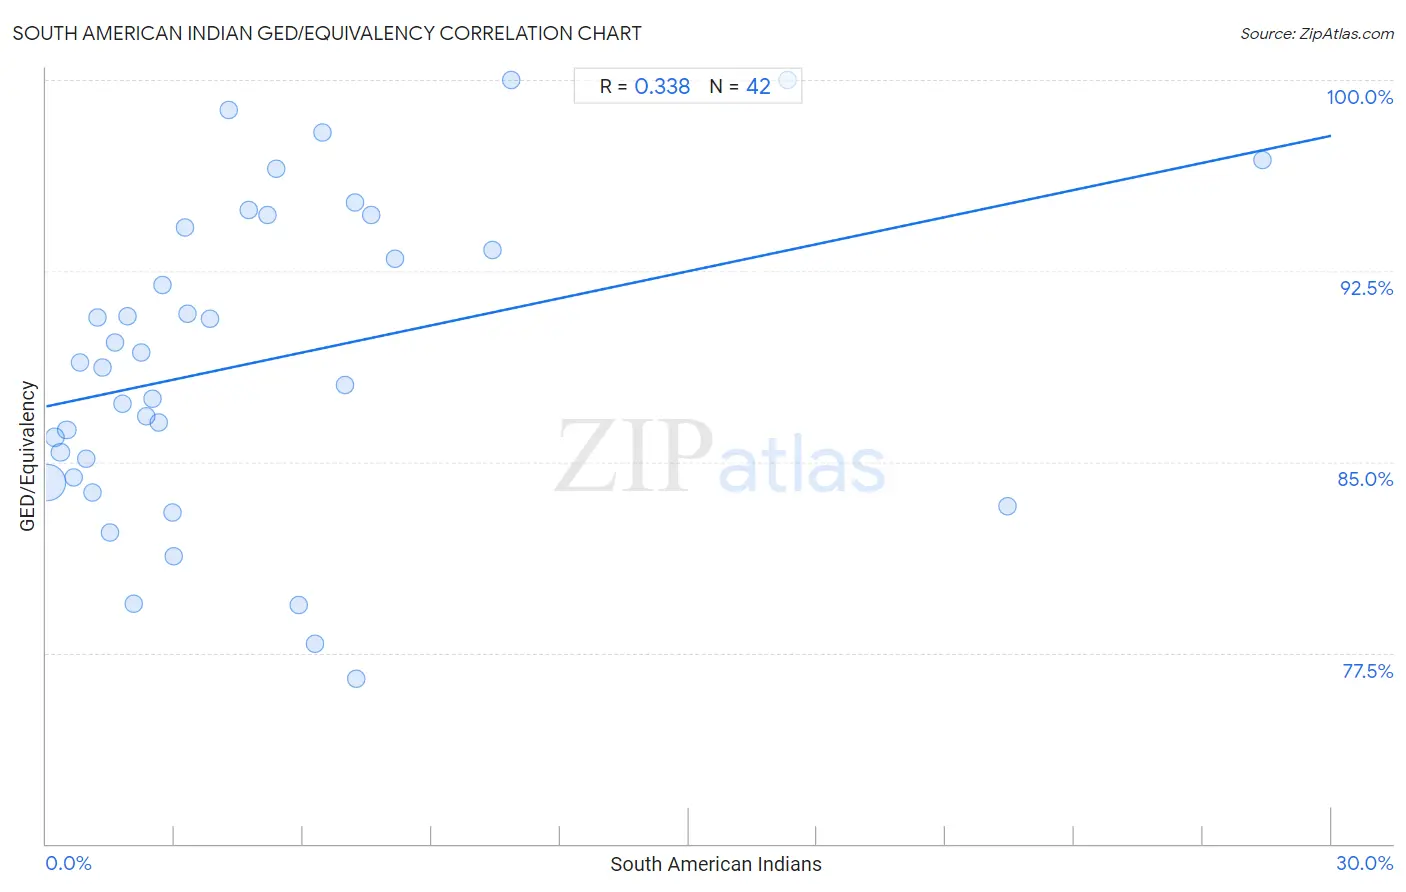
South American Indian GED/Equivalency Correlation Chart

The statistical analysis conducted on geographies consisting of 164,573,088 people shows a mild positive correlation between the proportion of South American Indians and percentage of population with at least ged/equivalency education in the United States with a correlation coefficient (R) of 0.338 and weighted average of 85.2%. On average, for every 1% (one percent) increase in South American Indians within a typical geography, there is an increase of 0.35% in percentage of population with at least ged/equivalency education.
South American Indian GED/Equivalency
It is essential to understand that the correlation between the percentage of South American Indians and percentage of population with at least ged/equivalency education does not imply a direct cause-and-effect relationship. It remains uncertain whether the presence of South American Indians influences an upward or downward trend in the level of percentage of population with at least ged/equivalency education within an area, or if South American Indians simply ended up residing in those areas with higher or lower levels of percentage of population with at least ged/equivalency education due to other factors.

Demographics Similar to South American Indians by GED/Equivalency

In terms of ged/equivalency, the demographic groups most similar to South American Indians are Nonimmigrants (85.2%, a difference of 0.0%), Delaware (85.2%, a difference of 0.020%), Puget Sound Salish (85.2%, a difference of 0.060%), Chippewa (85.2%, a difference of 0.060%), and Tongan (85.2%, a difference of 0.060%).
DemographicsRating | RankGED/Equivalency
Immigrants from Oceania
33.6
/100
|
#184
Fair
85.5%
Spanish
32.8
/100
|
#185
Fair
85.4%
Spaniards
31.9
/100
|
#186
Fair
85.4%
Immigrants from Afghanistan
29.8
/100
|
#187
Fair
85.4%
Immigrants from Sierra Leone
29.0
/100
|
#188
Fair
85.4%
Guamanians/Chamorros
28.4
/100
|
#189
Fair
85.3%
Alaskan Athabascans
27.5
/100
|
#190
Fair
85.3%
South American Indians
22.8
/100
|
#191
Fair
85.2%
Nonimmigrants
22.7
/100
|
#192
Fair
85.2%
Delaware
22.2
/100
|
#193
Fair
85.2%
Puget Sound Salish
20.8
/100
|
#194
Fair
85.2%
Chippewa
20.8
/100
|
#195
Fair
85.2%
Tongans
20.7
/100
|
#196
Fair
85.2%
Costa Ricans
20.4
/100
|
#197
Fair
85.2%
Immigrants from Africa
17.5
/100
|
#198
Poor
85.1%

South American Indian GED/Equivalency Correlation Summary

MeasurementSouth American Indian DataGED/Equivalency Data
Minimum0.038%76.5%
Maximum28.4%100.0%
Range28.3%23.5%
Mean5.0%88.9%
Median3.0%88.8%
Interquartile 25% (IQ1)1.5%84.4%
Interquartile 75% (IQ3)6.4%94.2%
Interquartile Range (IQR)5.0%9.8%
Standard Deviation (Sample)5.8%6.1%
Standard Deviation (Population)5.8%6.0%

Correlation Details

South American Indian PercentileSample SizeGED/Equivalency
[
0.0%
-
0.5%
]
0.038%
145,869,75184.2%
[
0.0%
-
0.5%
]
0.20%
12,434,69186.0%
[
0.0%
-
0.5%
]
0.33%
3,284,77785.4%
[
0.0%
-
0.5%
]
0.48%
1,021,70886.3%
[
0.5%
-
1.0%
]
0.63%
857,38884.4%
[
0.5%
-
1.0%
]
0.78%
365,32288.9%
[
0.5%
-
1.0%
]
0.93%
111,67485.1%
[
1.0%
-
1.5%
]
1.07%
207,68883.8%
[
1.0%
-
1.5%
]
1.19%
106,66790.7%
[
1.0%
-
1.5%
]
1.32%
122,59688.7%
[
1.0%
-
1.5%
]
1.48%
34,88782.2%
[
1.5%
-
2.0%
]
1.61%
19,88889.7%
[
1.5%
-
2.0%
]
1.77%
23,02887.3%
[
1.5%
-
2.0%
]
1.90%
11,60190.7%
[
2.0%
-
2.5%
]
2.05%
3,11879.4%
[
2.0%
-
2.5%
]
2.22%
34,79889.3%
[
2.0%
-
2.5%
]
2.33%
1,59086.8%
[
2.0%
-
2.5%
]
2.48%
12187.5%
[
2.5%
-
3.0%
]
2.63%
1,67686.5%
[
2.5%
-
3.0%
]
2.72%
15,89391.9%
[
2.5%
-
3.0%
]
2.95%
6,29983.0%
[
2.5%
-
3.0%
]
2.99%
1,17281.3%
[
3.0%
-
3.5%
]
3.23%
13,11194.2%
[
3.0%
-
3.5%
]
3.29%
1,03590.8%
[
3.5%
-
4.0%
]
3.84%
3,88390.6%
[
4.0%
-
4.5%
]
4.25%
72998.8%
[
4.5%
-
5.0%
]
4.74%
2,82994.9%
[
5.0%
-
5.5%
]
5.15%
29194.7%
[
5.0%
-
5.5%
]
5.37%
1,35996.5%
[
5.5%
-
6.0%
]
5.91%
2,54079.4%
[
6.0%
-
6.5%
]
6.27%
55877.9%
[
6.0%
-
6.5%
]
6.44%
65298.0%
[
6.5%
-
7.0%
]
6.98%
3,78188.0%
[
7.0%
-
7.5%
]
7.20%
62595.2%
[
7.0%
-
7.5%
]
7.25%
2,08476.5%
[
7.5%
-
8.0%
]
7.58%
96394.7%
[
8.0%
-
8.5%
]
8.14%
1,05693.0%
[
10.0%
-
10.5%
]
10.42%
43293.3%
[
10.5%
-
11.0%
]
10.87%
276100.0%
[
17.0%
-
17.5%
]
17.31%
52100.0%
[
22.0%
-
22.5%
]
22.45%
19683.2%
[
28.0%
-
28.5%
]
28.38%
30396.8%