South American Indian vs Peruvian Wage/Income Gap
COMPARE
South American Indian
Peruvian
Wage/Income Gap
Wage/Income Gap Comparison
South American Indians
Peruvians
24.7%
WAGE/INCOME GAP
92.0/ 100
METRIC RATING
135th/ 347
METRIC RANK
25.6%
WAGE/INCOME GAP
60.1/ 100
METRIC RATING
169th/ 347
METRIC RANK
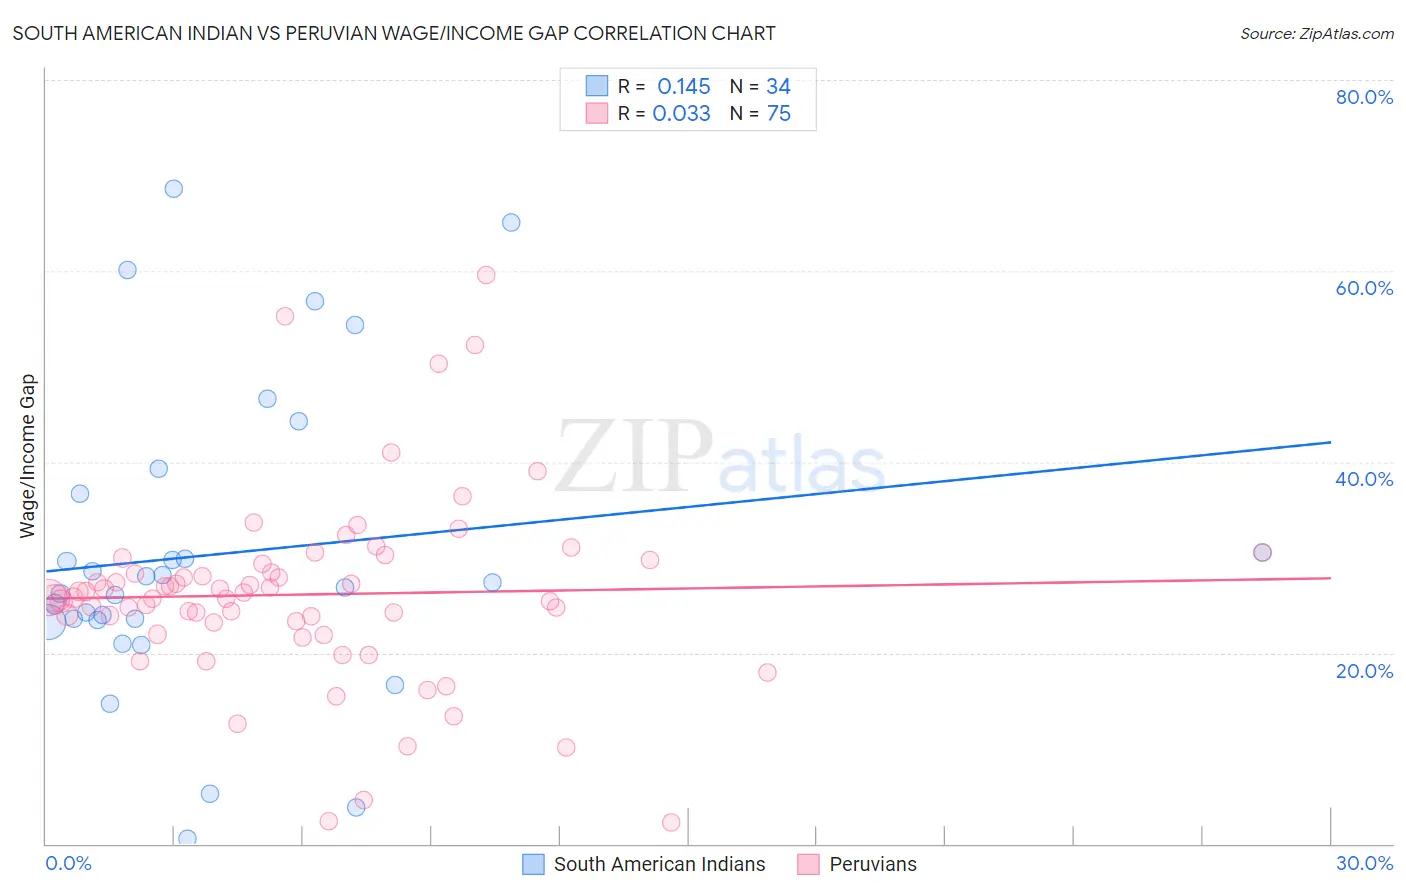
South American Indian vs Peruvian Wage/Income Gap Correlation Chart
The statistical analysis conducted on geographies consisting of 164,540,289 people shows a poor positive correlation between the proportion of South American Indians and wage/income gap percentage in the United States with a correlation coefficient (R) of 0.145 and weighted average of 24.7%. Similarly, the statistical analysis conducted on geographies consisting of 363,114,915 people shows no correlation between the proportion of Peruvians and wage/income gap percentage in the United States with a correlation coefficient (R) of 0.033 and weighted average of 25.6%, a difference of 3.5%.
Wage/Income Gap Correlation Summary
| Measurement | South American Indian | Peruvian |
| Minimum | 0.52% | 2.2% |
| Maximum | 68.7% | 59.6% |
| Range | 68.1% | 57.4% |
| Mean | 30.4% | 26.1% |
| Median | 27.1% | 25.9% |
| Interquartile 25% (IQ1) | 23.4% | 23.1% |
| Interquartile 75% (IQ3) | 36.7% | 29.3% |
| Interquartile Range (IQR) | 13.2% | 6.2% |
| Standard Deviation (Sample) | 16.2% | 9.9% |
| Standard Deviation (Population) | 15.9% | 9.8% |
Similar Demographics by Wage/Income Gap
Demographics Similar to South American Indians by Wage/Income Gap
In terms of wage/income gap, the demographic groups most similar to South American Indians are Mexican American Indian (24.7%, a difference of 0.060%), Colombian (24.7%, a difference of 0.090%), Immigrants from Costa Rica (24.7%, a difference of 0.10%), Armenian (24.8%, a difference of 0.14%), and Immigrants from South Eastern Asia (24.8%, a difference of 0.23%).
| Demographics | Rating | Rank | Wage/Income Gap |
| Immigrants | Central America | 93.5 /100 | #128 | Exceptional 24.6% |
| Yup'ik | 93.3 /100 | #129 | Exceptional 24.7% |
| Alsatians | 93.2 /100 | #130 | Exceptional 24.7% |
| Immigrants | Philippines | 93.0 /100 | #131 | Exceptional 24.7% |
| Immigrants | Costa Rica | 92.4 /100 | #132 | Exceptional 24.7% |
| Colombians | 92.4 /100 | #133 | Exceptional 24.7% |
| Mexican American Indians | 92.2 /100 | #134 | Exceptional 24.7% |
| South American Indians | 92.0 /100 | #135 | Exceptional 24.7% |
| Armenians | 91.3 /100 | #136 | Exceptional 24.8% |
| Immigrants | South Eastern Asia | 90.9 /100 | #137 | Exceptional 24.8% |
| Immigrants | Bosnia and Herzegovina | 90.1 /100 | #138 | Exceptional 24.8% |
| Hispanics or Latinos | 89.5 /100 | #139 | Excellent 24.9% |
| Immigrants | Nepal | 89.3 /100 | #140 | Excellent 24.9% |
| Hawaiians | 89.3 /100 | #141 | Excellent 24.9% |
| Afghans | 88.1 /100 | #142 | Excellent 24.9% |
Demographics Similar to Peruvians by Wage/Income Gap
In terms of wage/income gap, the demographic groups most similar to Peruvians are Immigrants from Oceania (25.6%, a difference of 0.17%), Seminole (25.6%, a difference of 0.18%), Paiute (25.5%, a difference of 0.20%), Immigrants from Greece (25.7%, a difference of 0.23%), and Immigrants from Ukraine (25.5%, a difference of 0.26%).
| Demographics | Rating | Rank | Wage/Income Gap |
| Shoshone | 69.0 /100 | #162 | Good 25.4% |
| Native Hawaiians | 69.0 /100 | #163 | Good 25.4% |
| Koreans | 68.6 /100 | #164 | Good 25.4% |
| Immigrants | Hong Kong | 64.0 /100 | #165 | Good 25.5% |
| Immigrants | Ukraine | 63.8 /100 | #166 | Good 25.5% |
| Paiute | 62.9 /100 | #167 | Good 25.5% |
| Seminole | 62.6 /100 | #168 | Good 25.6% |
| Peruvians | 60.1 /100 | #169 | Good 25.6% |
| Immigrants | Oceania | 57.5 /100 | #170 | Average 25.6% |
| Immigrants | Greece | 56.6 /100 | #171 | Average 25.7% |
| Immigrants | Chile | 53.2 /100 | #172 | Average 25.7% |
| Immigrants | Belarus | 52.9 /100 | #173 | Average 25.7% |
| Alaskan Athabascans | 50.0 /100 | #174 | Average 25.8% |
| Sri Lankans | 47.0 /100 | #175 | Average 25.8% |
| Paraguayans | 46.7 /100 | #176 | Average 25.8% |