Immigrants from Romania vs Cambodian Wage/Income Gap
COMPARE
Immigrants from Romania
Cambodian
Wage/Income Gap
Wage/Income Gap Comparison
Immigrants from Romania
Cambodians
27.0%
WAGE/INCOME GAP
4.8/ 100
METRIC RATING
236th/ 347
METRIC RANK
25.8%
WAGE/INCOME GAP
45.1/ 100
METRIC RATING
177th/ 347
METRIC RANK
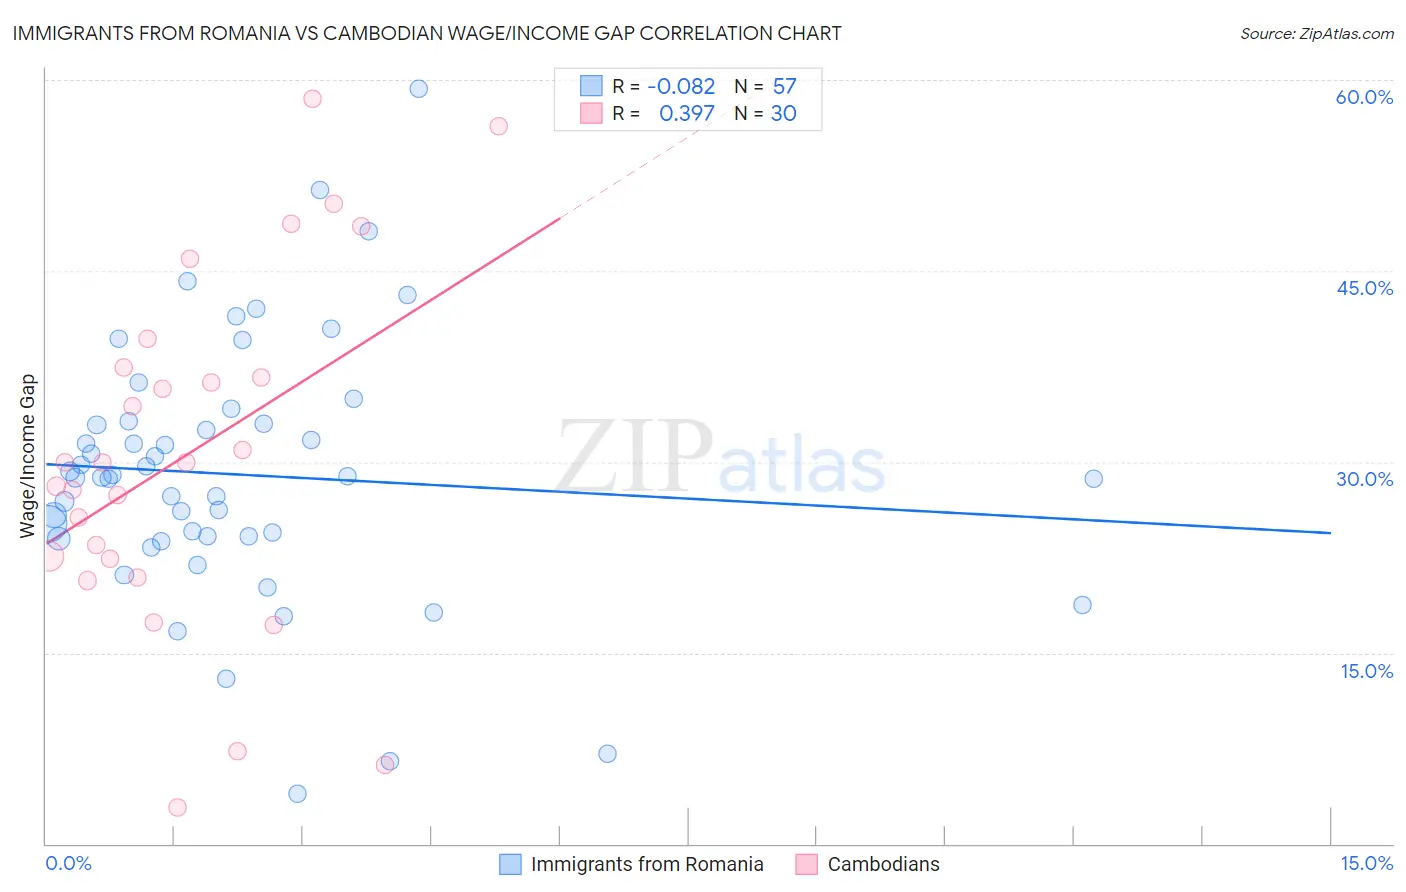
Immigrants from Romania vs Cambodian Wage/Income Gap Correlation Chart
The statistical analysis conducted on geographies consisting of 256,953,227 people shows a slight negative correlation between the proportion of Immigrants from Romania and wage/income gap percentage in the United States with a correlation coefficient (R) of -0.082 and weighted average of 27.0%. Similarly, the statistical analysis conducted on geographies consisting of 102,500,825 people shows a mild positive correlation between the proportion of Cambodians and wage/income gap percentage in the United States with a correlation coefficient (R) of 0.397 and weighted average of 25.8%, a difference of 4.5%.
Wage/Income Gap Correlation Summary
| Measurement | Immigrants from Romania | Cambodian |
| Minimum | 4.0% | 2.9% |
| Maximum | 59.4% | 58.5% |
| Range | 55.4% | 55.6% |
| Mean | 29.0% | 30.6% |
| Median | 28.8% | 29.9% |
| Interquartile 25% (IQ1) | 24.1% | 22.4% |
| Interquartile 75% (IQ3) | 33.1% | 37.4% |
| Interquartile Range (IQR) | 9.0% | 15.0% |
| Standard Deviation (Sample) | 10.3% | 13.9% |
| Standard Deviation (Population) | 10.2% | 13.7% |
Similar Demographics by Wage/Income Gap
Demographics Similar to Immigrants from Romania by Wage/Income Gap
In terms of wage/income gap, the demographic groups most similar to Immigrants from Romania are Immigrants from Hungary (27.0%, a difference of 0.020%), Immigrants from Pakistan (27.0%, a difference of 0.030%), Immigrants from Brazil (27.0%, a difference of 0.080%), Argentinean (27.0%, a difference of 0.14%), and Immigrants from Eastern Asia (27.1%, a difference of 0.15%).
| Demographics | Rating | Rank | Wage/Income Gap |
| Immigrants | Asia | 5.5 /100 | #229 | Tragic 27.0% |
| Ottawa | 5.3 /100 | #230 | Tragic 27.0% |
| Bhutanese | 5.3 /100 | #231 | Tragic 27.0% |
| Argentineans | 5.2 /100 | #232 | Tragic 27.0% |
| Immigrants | Brazil | 5.0 /100 | #233 | Tragic 27.0% |
| Immigrants | Pakistan | 4.9 /100 | #234 | Tragic 27.0% |
| Immigrants | Hungary | 4.8 /100 | #235 | Tragic 27.0% |
| Immigrants | Romania | 4.8 /100 | #236 | Tragic 27.0% |
| Immigrants | Eastern Asia | 4.4 /100 | #237 | Tragic 27.1% |
| Osage | 4.4 /100 | #238 | Tragic 27.1% |
| Estonians | 4.3 /100 | #239 | Tragic 27.1% |
| Immigrants | Europe | 3.8 /100 | #240 | Tragic 27.1% |
| Creek | 3.8 /100 | #241 | Tragic 27.1% |
| Immigrants | Sri Lanka | 3.7 /100 | #242 | Tragic 27.1% |
| Spanish | 3.6 /100 | #243 | Tragic 27.1% |
Demographics Similar to Cambodians by Wage/Income Gap
In terms of wage/income gap, the demographic groups most similar to Cambodians are Paraguayan (25.8%, a difference of 0.11%), Sri Lankan (25.8%, a difference of 0.12%), Chinese (25.9%, a difference of 0.21%), Alaskan Athabascan (25.8%, a difference of 0.32%), and Samoan (26.0%, a difference of 0.44%).
| Demographics | Rating | Rank | Wage/Income Gap |
| Immigrants | Oceania | 57.5 /100 | #170 | Average 25.6% |
| Immigrants | Greece | 56.6 /100 | #171 | Average 25.7% |
| Immigrants | Chile | 53.2 /100 | #172 | Average 25.7% |
| Immigrants | Belarus | 52.9 /100 | #173 | Average 25.7% |
| Alaskan Athabascans | 50.0 /100 | #174 | Average 25.8% |
| Sri Lankans | 47.0 /100 | #175 | Average 25.8% |
| Paraguayans | 46.7 /100 | #176 | Average 25.8% |
| Cambodians | 45.1 /100 | #177 | Average 25.8% |
| Chinese | 42.0 /100 | #178 | Average 25.9% |
| Samoans | 38.6 /100 | #179 | Fair 26.0% |
| Guamanians/Chamorros | 38.0 /100 | #180 | Fair 26.0% |
| Immigrants | Bolivia | 36.4 /100 | #181 | Fair 26.0% |
| Immigrants | Serbia | 35.4 /100 | #182 | Fair 26.0% |
| Immigrants | Kazakhstan | 35.2 /100 | #183 | Fair 26.0% |
| Mexicans | 34.4 /100 | #184 | Fair 26.0% |