Immigrants from Romania Married-couple Households
COMPARE
Immigrants from Romania
Select to Compare
Married-couple Households
Immigrants from Romania Married-couple Households
48.3%
MARRIED-COUPLE HOUSEHOLDS
98.6/ 100
METRIC RATING
74th/ 347
METRIC RANK
Immigrants from Romania Married-couple Households Correlation Chart
The statistical analysis conducted on geographies consisting of 256,957,866 people shows no correlation between the proportion of Immigrants from Romania and percentage of married-couple family households in the United States with a correlation coefficient (R) of 0.035 and weighted average of 48.3%. On average, for every 1% (one percent) increase in Immigrants from Romania within a typical geography, there is an increase of 0.12% in percentage of married-couple family households.
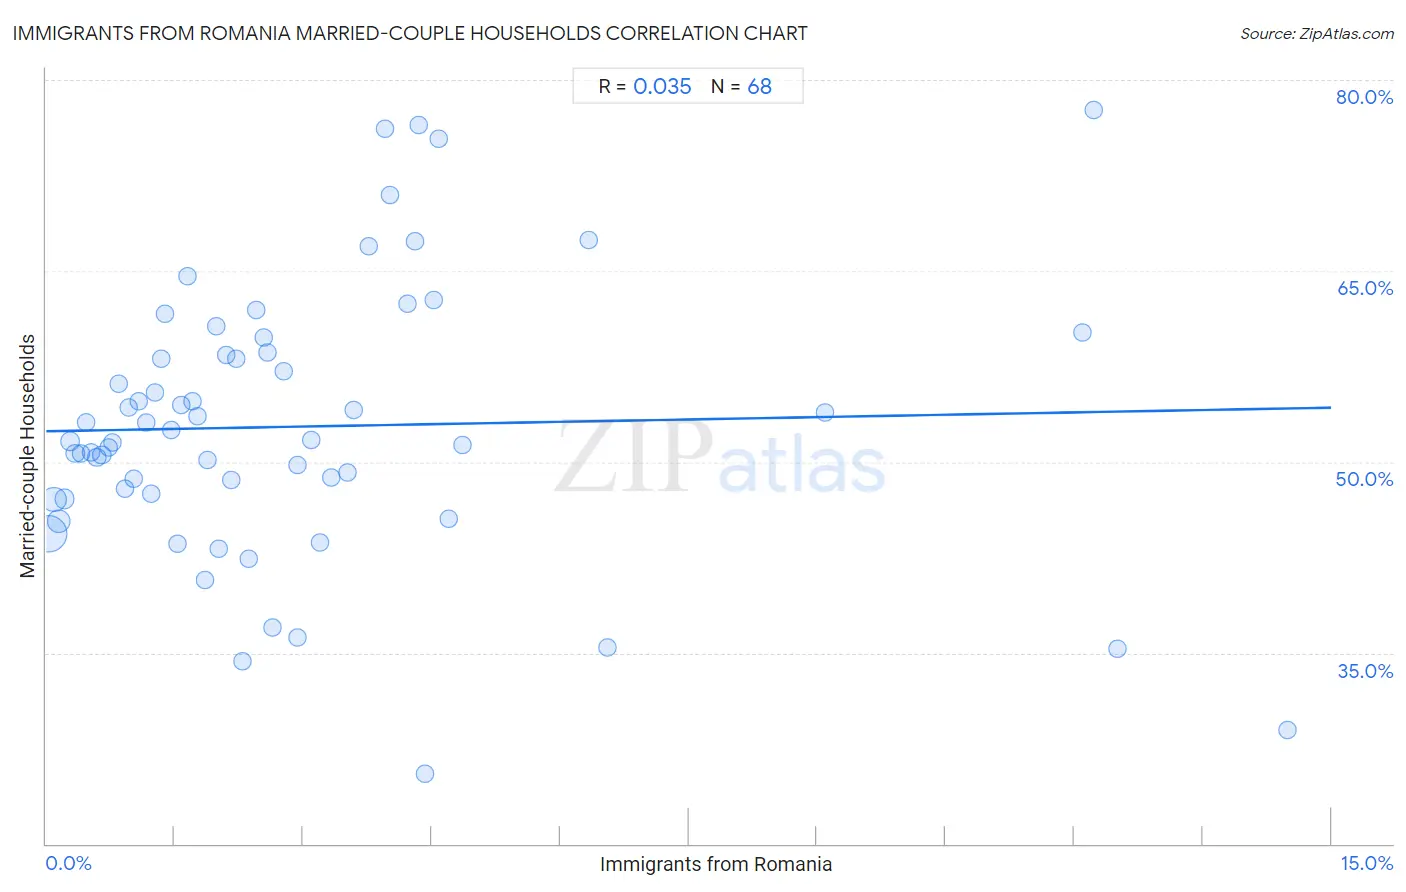
It is essential to understand that the correlation between the percentage of Immigrants from Romania and percentage of married-couple family households does not imply a direct cause-and-effect relationship. It remains uncertain whether the presence of Immigrants from Romania influences an upward or downward trend in the level of percentage of married-couple family households within an area, or if Immigrants from Romania simply ended up residing in those areas with higher or lower levels of percentage of married-couple family households due to other factors.
Demographics Similar to Immigrants from Romania by Married-couple Households
In terms of married-couple households, the demographic groups most similar to Immigrants from Romania are Immigrants from Singapore (48.3%, a difference of 0.010%), Scotch-Irish (48.3%, a difference of 0.040%), Immigrants from England (48.2%, a difference of 0.090%), Immigrants from Fiji (48.2%, a difference of 0.090%), and Canadian (48.2%, a difference of 0.19%).
| Demographics | Rating | Rank | Married-couple Households |
| Romanians | 98.9 /100 | #67 | Exceptional 48.4% |
| Immigrants from South Eastern Asia | 98.9 /100 | #68 | Exceptional 48.4% |
| Immigrants from China | 98.9 /100 | #69 | Exceptional 48.4% |
| Immigrants from North America | 98.9 /100 | #70 | Exceptional 48.4% |
| Laotians | 98.8 /100 | #71 | Exceptional 48.4% |
| Scotch-Irish | 98.6 /100 | #72 | Exceptional 48.3% |
| Immigrants from Singapore | 98.6 /100 | #73 | Exceptional 48.3% |
| Immigrants from Romania | 98.6 /100 | #74 | Exceptional 48.3% |
| Immigrants from England | 98.4 /100 | #75 | Exceptional 48.2% |
| Immigrants from Fiji | 98.4 /100 | #76 | Exceptional 48.2% |
| Canadians | 98.2 /100 | #77 | Exceptional 48.2% |
| Egyptians | 98.2 /100 | #78 | Exceptional 48.2% |
| Immigrants from Netherlands | 98.2 /100 | #79 | Exceptional 48.2% |
| Russians | 98.1 /100 | #80 | Exceptional 48.2% |
| Finns | 98.0 /100 | #81 | Exceptional 48.1% |
Immigrants from Romania Married-couple Households Correlation Summary
| Measurement | Immigrants from Romania Data | Married-couple Households Data |
| Minimum | 0.030% | 25.5% |
| Maximum | 14.5% | 77.6% |
| Range | 14.5% | 52.1% |
| Mean | 3.0% | 52.8% |
| Median | 2.1% | 51.7% |
| Interquartile 25% (IQ1) | 1.1% | 47.3% |
| Interquartile 75% (IQ3) | 3.9% | 58.5% |
| Interquartile Range (IQR) | 2.8% | 11.2% |
| Standard Deviation (Sample) | 3.0% | 10.7% |
| Standard Deviation (Population) | 3.0% | 10.7% |
Correlation Details
| Immigrants from Romania Percentile | Sample Size | Married-couple Households |
[ 0.0% - 0.5% ] 0.030% | 129,807,343 | 44.3% |
[ 0.0% - 0.5% ] 0.089% | 50,821,259 | 47.1% |
[ 0.0% - 0.5% ] 0.15% | 35,125,231 | 45.3% |
[ 0.0% - 0.5% ] 0.21% | 15,167,246 | 47.1% |
[ 0.0% - 0.5% ] 0.28% | 7,232,485 | 51.6% |
[ 0.0% - 0.5% ] 0.34% | 5,104,568 | 50.7% |
[ 0.0% - 0.5% ] 0.40% | 3,613,030 | 50.7% |
[ 0.0% - 0.5% ] 0.46% | 2,247,268 | 53.1% |
[ 0.5% - 1.0% ] 0.52% | 1,759,971 | 50.8% |
[ 0.5% - 1.0% ] 0.59% | 1,532,035 | 50.3% |
[ 0.5% - 1.0% ] 0.65% | 768,163 | 50.5% |
[ 0.5% - 1.0% ] 0.72% | 624,238 | 51.1% |
[ 0.5% - 1.0% ] 0.78% | 690,550 | 51.6% |
[ 0.5% - 1.0% ] 0.85% | 293,064 | 56.1% |
[ 0.5% - 1.0% ] 0.91% | 513,892 | 47.9% |
[ 0.5% - 1.0% ] 0.97% | 274,214 | 54.3% |
[ 1.0% - 1.5% ] 1.03% | 114,945 | 48.7% |
[ 1.0% - 1.5% ] 1.09% | 132,567 | 54.8% |
[ 1.0% - 1.5% ] 1.17% | 77,806 | 53.1% |
[ 1.0% - 1.5% ] 1.23% | 192,074 | 47.5% |
[ 1.0% - 1.5% ] 1.27% | 50,767 | 55.4% |
[ 1.0% - 1.5% ] 1.34% | 181,360 | 58.1% |
[ 1.0% - 1.5% ] 1.39% | 52,825 | 61.6% |
[ 1.0% - 1.5% ] 1.46% | 54,250 | 52.5% |
[ 1.5% - 2.0% ] 1.54% | 36,802 | 43.6% |
[ 1.5% - 2.0% ] 1.57% | 6,667 | 54.4% |
[ 1.5% - 2.0% ] 1.65% | 12,050 | 64.6% |
[ 1.5% - 2.0% ] 1.70% | 7,232 | 54.8% |
[ 1.5% - 2.0% ] 1.76% | 66,164 | 53.6% |
[ 1.5% - 2.0% ] 1.85% | 7,828 | 40.7% |
[ 1.5% - 2.0% ] 1.89% | 93,713 | 50.1% |
[ 1.5% - 2.0% ] 1.98% | 63,866 | 60.6% |
[ 2.0% - 2.5% ] 2.02% | 65,890 | 43.2% |
[ 2.0% - 2.5% ] 2.10% | 11,056 | 58.4% |
[ 2.0% - 2.5% ] 2.15% | 41,134 | 48.6% |
[ 2.0% - 2.5% ] 2.21% | 11,062 | 58.1% |
[ 2.0% - 2.5% ] 2.29% | 523 | 34.4% |
[ 2.0% - 2.5% ] 2.36% | 2,369 | 42.4% |
[ 2.0% - 2.5% ] 2.46% | 27,951 | 61.9% |
[ 2.5% - 3.0% ] 2.54% | 14,652 | 59.8% |
[ 2.5% - 3.0% ] 2.58% | 1,125 | 58.6% |
[ 2.5% - 3.0% ] 2.65% | 1,814 | 36.9% |
[ 2.5% - 3.0% ] 2.77% | 1,048 | 57.1% |
[ 2.5% - 3.0% ] 2.93% | 852 | 49.7% |
[ 2.5% - 3.0% ] 2.94% | 26,939 | 36.2% |
[ 3.0% - 3.5% ] 3.10% | 1,194 | 51.7% |
[ 3.0% - 3.5% ] 3.19% | 1,003 | 43.6% |
[ 3.0% - 3.5% ] 3.33% | 3,064 | 48.7% |
[ 3.5% - 4.0% ] 3.52% | 426 | 49.2% |
[ 3.5% - 4.0% ] 3.59% | 390 | 54.0% |
[ 3.5% - 4.0% ] 3.77% | 2,812 | 66.9% |
[ 3.5% - 4.0% ] 3.95% | 1,899 | 76.2% |
[ 4.0% - 4.5% ] 4.01% | 673 | 71.0% |
[ 4.0% - 4.5% ] 4.21% | 5,555 | 62.4% |
[ 4.0% - 4.5% ] 4.31% | 116 | 67.3% |
[ 4.0% - 4.5% ] 4.35% | 69 | 76.5% |
[ 4.0% - 4.5% ] 4.42% | 1,153 | 25.5% |
[ 4.5% - 5.0% ] 4.52% | 974 | 62.7% |
[ 4.5% - 5.0% ] 4.59% | 676 | 75.4% |
[ 4.5% - 5.0% ] 4.70% | 532 | 45.5% |
[ 4.5% - 5.0% ] 4.85% | 515 | 51.3% |
[ 6.0% - 6.5% ] 6.33% | 411 | 67.4% |
[ 6.5% - 7.0% ] 6.55% | 412 | 35.4% |
[ 9.0% - 9.5% ] 9.09% | 297 | 53.8% |
[ 12.0% - 12.5% ] 12.10% | 1,885 | 60.2% |
[ 12.0% - 12.5% ] 12.23% | 1,668 | 77.6% |
[ 12.0% - 12.5% ] 12.50% | 40 | 35.3% |
[ 14.0% - 14.5% ] 14.49% | 214 | 28.9% |