Immigrants from Romania Disability Age 5 to 17
COMPARE
Immigrants from Romania
Select to Compare
Disability Age 5 to 17
Immigrants from Romania Disability Age 5 to 17
5.2%
DISABILITY | AGE 5 TO 17
99.7/ 100
METRIC RATING
74th/ 347
METRIC RANK
Immigrants from Romania Disability Age 5 to 17 Correlation Chart
The statistical analysis conducted on geographies consisting of 255,693,351 people shows a weak positive correlation between the proportion of Immigrants from Romania and percentage of population with a disability between the ages 5 and 17 in the United States with a correlation coefficient (R) of 0.212 and weighted average of 5.2%. On average, for every 1% (one percent) increase in Immigrants from Romania within a typical geography, there is an increase of 0.84% in percentage of population with a disability between the ages 5 and 17.
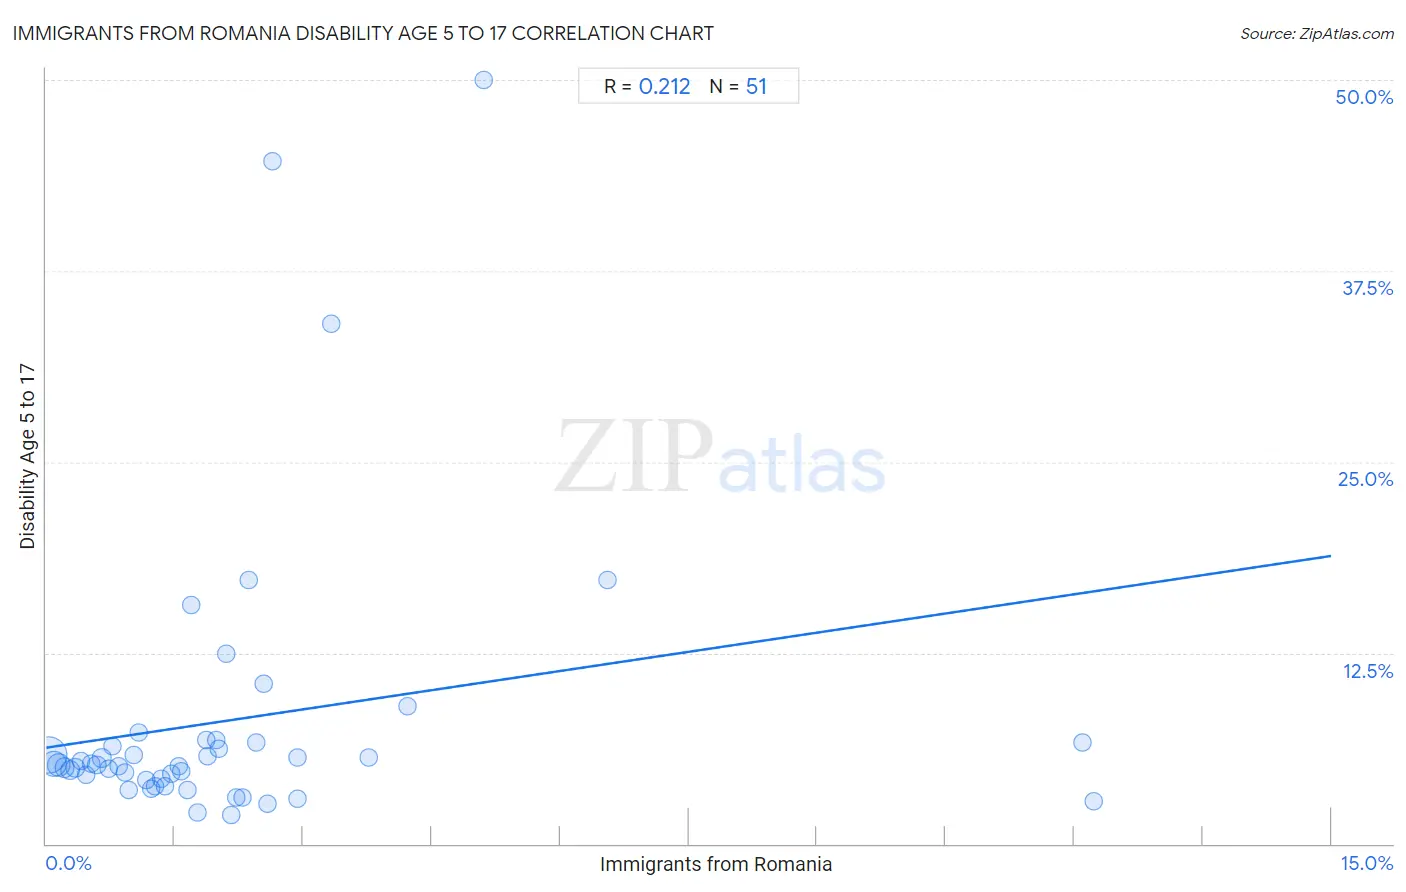
It is essential to understand that the correlation between the percentage of Immigrants from Romania and percentage of population with a disability between the ages 5 and 17 does not imply a direct cause-and-effect relationship. It remains uncertain whether the presence of Immigrants from Romania influences an upward or downward trend in the level of percentage of population with a disability between the ages 5 and 17 within an area, or if Immigrants from Romania simply ended up residing in those areas with higher or lower levels of percentage of population with a disability between the ages 5 and 17 due to other factors.
Demographics Similar to Immigrants from Romania by Disability Age 5 to 17
In terms of disability age 5 to 17, the demographic groups most similar to Immigrants from Romania are Immigrants from Czechoslovakia (5.2%, a difference of 0.070%), Immigrants from Vietnam (5.2%, a difference of 0.090%), Jordanian (5.2%, a difference of 0.12%), Immigrants from Belgium (5.2%, a difference of 0.16%), and Guyanese (5.2%, a difference of 0.20%).
| Demographics | Rating | Rank | Disability Age 5 to 17 |
| Macedonians | 99.8 /100 | #67 | Exceptional 5.2% |
| Immigrants from Syria | 99.7 /100 | #68 | Exceptional 5.2% |
| Guyanese | 99.7 /100 | #69 | Exceptional 5.2% |
| Immigrants from Belgium | 99.7 /100 | #70 | Exceptional 5.2% |
| Jordanians | 99.7 /100 | #71 | Exceptional 5.2% |
| Immigrants from Vietnam | 99.7 /100 | #72 | Exceptional 5.2% |
| Immigrants from Czechoslovakia | 99.7 /100 | #73 | Exceptional 5.2% |
| Immigrants from Romania | 99.7 /100 | #74 | Exceptional 5.2% |
| Immigrants from Moldova | 99.6 /100 | #75 | Exceptional 5.2% |
| Immigrants from Guyana | 99.6 /100 | #76 | Exceptional 5.2% |
| Immigrants from Kazakhstan | 99.6 /100 | #77 | Exceptional 5.2% |
| Immigrants from Cuba | 99.6 /100 | #78 | Exceptional 5.2% |
| Afghans | 99.6 /100 | #79 | Exceptional 5.2% |
| Sri Lankans | 99.6 /100 | #80 | Exceptional 5.2% |
| Native Hawaiians | 99.6 /100 | #81 | Exceptional 5.2% |
Immigrants from Romania Disability Age 5 to 17 Correlation Summary
| Measurement | Immigrants from Romania Data | Disability Age 5 to 17 Data |
| Minimum | 0.030% | 1.9% |
| Maximum | 12.2% | 50.0% |
| Range | 12.2% | 48.1% |
| Mean | 2.1% | 8.1% |
| Median | 1.6% | 5.2% |
| Interquartile 25% (IQ1) | 0.78% | 4.2% |
| Interquartile 75% (IQ3) | 2.5% | 6.7% |
| Interquartile Range (IQR) | 1.7% | 2.5% |
| Standard Deviation (Sample) | 2.4% | 9.5% |
| Standard Deviation (Population) | 2.4% | 9.5% |
Correlation Details
| Immigrants from Romania Percentile | Sample Size | Disability Age 5 to 17 |
[ 0.0% - 0.5% ] 0.030% | 129,537,530 | 5.8% |
[ 0.0% - 0.5% ] 0.089% | 50,617,607 | 5.2% |
[ 0.0% - 0.5% ] 0.15% | 34,938,167 | 5.2% |
[ 0.0% - 0.5% ] 0.21% | 15,043,735 | 5.0% |
[ 0.0% - 0.5% ] 0.28% | 7,134,446 | 4.8% |
[ 0.0% - 0.5% ] 0.34% | 5,034,026 | 5.0% |
[ 0.0% - 0.5% ] 0.40% | 3,597,335 | 5.4% |
[ 0.0% - 0.5% ] 0.46% | 2,184,211 | 4.5% |
[ 0.5% - 1.0% ] 0.52% | 1,733,110 | 5.2% |
[ 0.5% - 1.0% ] 0.59% | 1,510,266 | 5.2% |
[ 0.5% - 1.0% ] 0.65% | 744,931 | 5.6% |
[ 0.5% - 1.0% ] 0.72% | 597,108 | 4.9% |
[ 0.5% - 1.0% ] 0.78% | 668,544 | 6.4% |
[ 0.5% - 1.0% ] 0.85% | 287,828 | 5.1% |
[ 0.5% - 1.0% ] 0.91% | 506,799 | 4.7% |
[ 0.5% - 1.0% ] 0.97% | 251,557 | 3.5% |
[ 1.0% - 1.5% ] 1.03% | 108,089 | 5.8% |
[ 1.0% - 1.5% ] 1.09% | 119,034 | 7.3% |
[ 1.0% - 1.5% ] 1.17% | 76,571 | 4.2% |
[ 1.0% - 1.5% ] 1.23% | 189,441 | 3.6% |
[ 1.0% - 1.5% ] 1.27% | 50,067 | 3.7% |
[ 1.0% - 1.5% ] 1.34% | 170,001 | 4.2% |
[ 1.0% - 1.5% ] 1.39% | 51,412 | 3.8% |
[ 1.0% - 1.5% ] 1.46% | 51,252 | 4.6% |
[ 1.5% - 2.0% ] 1.54% | 30,320 | 5.1% |
[ 1.5% - 2.0% ] 1.57% | 5,287 | 4.8% |
[ 1.5% - 2.0% ] 1.65% | 11,390 | 3.5% |
[ 1.5% - 2.0% ] 1.69% | 2,957 | 15.6% |
[ 1.5% - 2.0% ] 1.76% | 65,334 | 2.0% |
[ 1.5% - 2.0% ] 1.87% | 4,392 | 6.8% |
[ 1.5% - 2.0% ] 1.89% | 93,713 | 5.7% |
[ 1.5% - 2.0% ] 1.98% | 60,781 | 6.8% |
[ 2.0% - 2.5% ] 2.02% | 62,466 | 6.2% |
[ 2.0% - 2.5% ] 2.10% | 11,056 | 12.4% |
[ 2.0% - 2.5% ] 2.15% | 41,134 | 1.9% |
[ 2.0% - 2.5% ] 2.21% | 11,062 | 3.1% |
[ 2.0% - 2.5% ] 2.29% | 523 | 3.0% |
[ 2.0% - 2.5% ] 2.37% | 2,027 | 17.3% |
[ 2.0% - 2.5% ] 2.46% | 27,378 | 6.6% |
[ 2.5% - 3.0% ] 2.54% | 14,652 | 10.5% |
[ 2.5% - 3.0% ] 2.58% | 1,125 | 2.7% |
[ 2.5% - 3.0% ] 2.64% | 1,402 | 44.7% |
[ 2.5% - 3.0% ] 2.93% | 852 | 5.7% |
[ 2.5% - 3.0% ] 2.94% | 26,939 | 3.0% |
[ 3.0% - 3.5% ] 3.33% | 3,064 | 34.1% |
[ 3.5% - 4.0% ] 3.77% | 2,812 | 5.6% |
[ 4.0% - 4.5% ] 4.21% | 5,555 | 9.0% |
[ 5.0% - 5.5% ] 5.10% | 98 | 50.0% |
[ 6.5% - 7.0% ] 6.55% | 412 | 17.2% |
[ 12.0% - 12.5% ] 12.10% | 1,885 | 6.7% |
[ 12.0% - 12.5% ] 12.23% | 1,668 | 2.8% |