Immigrants from Laos 1 or more Vehicles in Household
COMPARE
Immigrants from Laos
Select to Compare
1 or more Vehicles in Household
Immigrants from Laos 1 or more Vehicles in Household
91.8%
1+ VEHICLES AVAILABLE
99.8/ 100
METRIC RATING
65th/ 347
METRIC RANK
Immigrants from Laos 1 or more Vehicles in Household Correlation Chart
The statistical analysis conducted on geographies consisting of 201,467,889 people shows a moderate positive correlation between the proportion of Immigrants from Laos and percentage of households with 1 or more vehicles available in the United States with a correlation coefficient (R) of 0.435 and weighted average of 91.8%. On average, for every 1% (one percent) increase in Immigrants from Laos within a typical geography, there is an increase of 0.37% in percentage of households with 1 or more vehicles available.
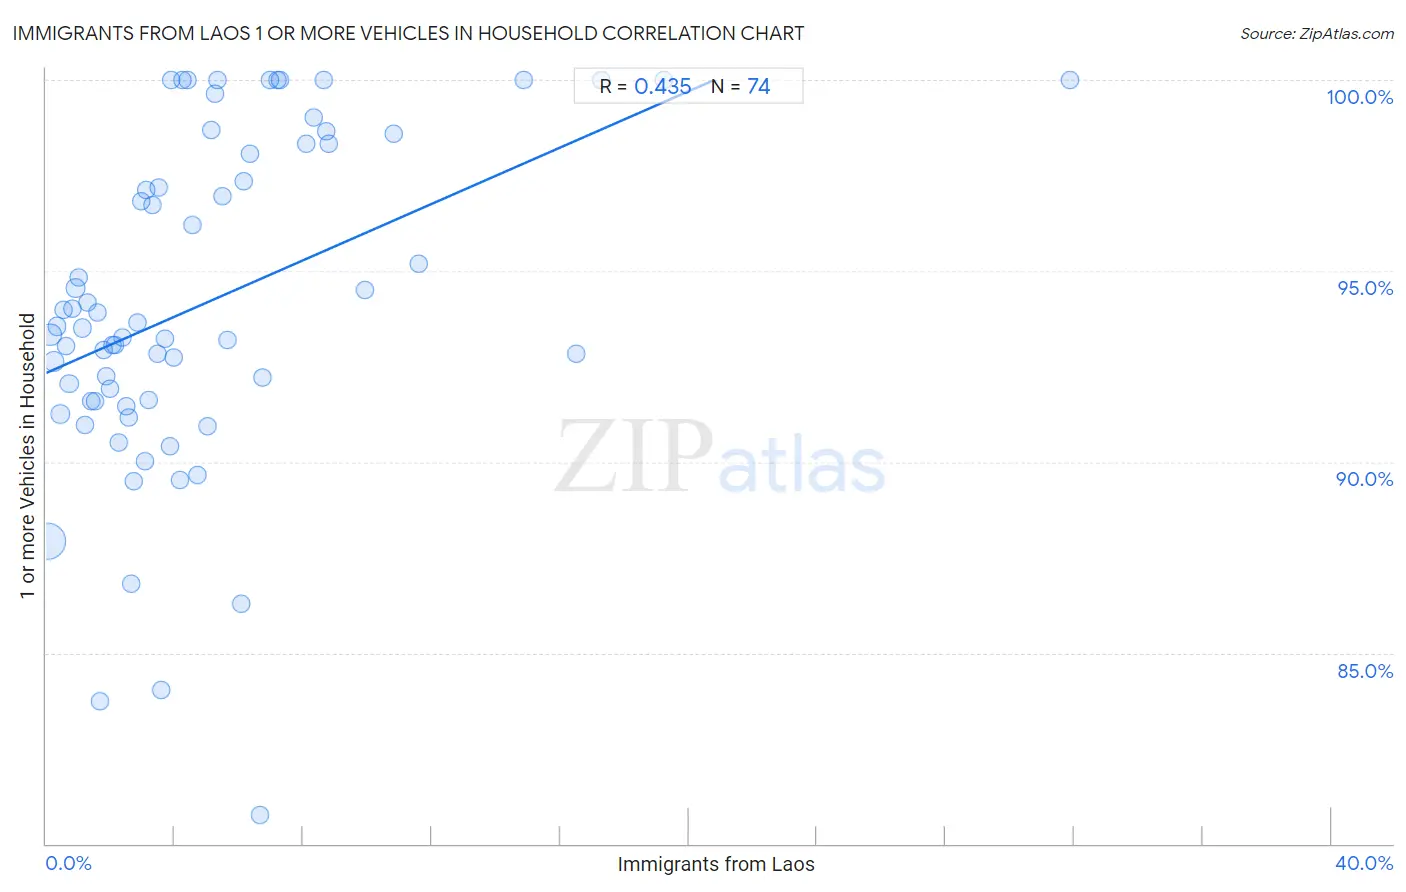
It is essential to understand that the correlation between the percentage of Immigrants from Laos and percentage of households with 1 or more vehicles available does not imply a direct cause-and-effect relationship. It remains uncertain whether the presence of Immigrants from Laos influences an upward or downward trend in the level of percentage of households with 1 or more vehicles available within an area, or if Immigrants from Laos simply ended up residing in those areas with higher or lower levels of percentage of households with 1 or more vehicles available due to other factors.
Demographics Similar to Immigrants from Laos by 1 or more Vehicles in Household
In terms of 1 or more vehicles in household, the demographic groups most similar to Immigrants from Laos are Canadian (91.8%, a difference of 0.020%), Chinese (91.9%, a difference of 0.030%), Croatian (91.9%, a difference of 0.030%), Spaniard (91.8%, a difference of 0.040%), and Immigrants from India (91.9%, a difference of 0.060%).
| Demographics | Rating | Rank | 1 or more Vehicles in Household |
| Immigrants from Mexico | 99.8 /100 | #58 | Exceptional 91.9% |
| Venezuelans | 99.8 /100 | #59 | Exceptional 91.9% |
| Slovaks | 99.8 /100 | #60 | Exceptional 91.9% |
| Immigrants from India | 99.8 /100 | #61 | Exceptional 91.9% |
| Thais | 99.8 /100 | #62 | Exceptional 91.9% |
| Chinese | 99.8 /100 | #63 | Exceptional 91.9% |
| Croatians | 99.8 /100 | #64 | Exceptional 91.9% |
| Immigrants from Laos | 99.8 /100 | #65 | Exceptional 91.8% |
| Canadians | 99.8 /100 | #66 | Exceptional 91.8% |
| Spaniards | 99.8 /100 | #67 | Exceptional 91.8% |
| Immigrants from Scotland | 99.7 /100 | #68 | Exceptional 91.8% |
| Palestinians | 99.7 /100 | #69 | Exceptional 91.7% |
| Lithuanians | 99.7 /100 | #70 | Exceptional 91.7% |
| Poles | 99.7 /100 | #71 | Exceptional 91.7% |
| Cajuns | 99.7 /100 | #72 | Exceptional 91.7% |
Immigrants from Laos 1 or more Vehicles in Household Correlation Summary
| Measurement | Immigrants from Laos Data | 1 or more Vehicles in Household Data |
| Minimum | 0.032% | 80.7% |
| Maximum | 31.9% | 100.0% |
| Range | 31.9% | 19.3% |
| Mean | 5.0% | 94.2% |
| Median | 3.5% | 93.5% |
| Interquartile 25% (IQ1) | 1.8% | 91.6% |
| Interquartile 75% (IQ3) | 6.4% | 98.3% |
| Interquartile Range (IQR) | 4.6% | 6.7% |
| Standard Deviation (Sample) | 5.1% | 4.4% |
| Standard Deviation (Population) | 5.1% | 4.3% |
Correlation Details
| Immigrants from Laos Percentile | Sample Size | 1 or more Vehicles in Household |
[ 0.0% - 0.5% ] 0.032% | 130,101,065 | 87.9% |
[ 0.0% - 0.5% ] 0.13% | 30,172,422 | 93.3% |
[ 0.0% - 0.5% ] 0.23% | 14,854,843 | 92.6% |
[ 0.0% - 0.5% ] 0.33% | 7,156,471 | 93.5% |
[ 0.0% - 0.5% ] 0.43% | 4,164,515 | 91.3% |
[ 0.5% - 1.0% ] 0.54% | 2,767,490 | 94.0% |
[ 0.5% - 1.0% ] 0.62% | 2,713,771 | 93.0% |
[ 0.5% - 1.0% ] 0.72% | 1,289,060 | 92.1% |
[ 0.5% - 1.0% ] 0.80% | 1,256,502 | 94.0% |
[ 0.5% - 1.0% ] 0.91% | 832,665 | 94.6% |
[ 1.0% - 1.5% ] 1.01% | 449,931 | 94.8% |
[ 1.0% - 1.5% ] 1.12% | 1,199,877 | 93.5% |
[ 1.0% - 1.5% ] 1.20% | 547,455 | 91.0% |
[ 1.0% - 1.5% ] 1.29% | 394,922 | 94.2% |
[ 1.0% - 1.5% ] 1.41% | 1,113,467 | 91.6% |
[ 1.5% - 2.0% ] 1.50% | 107,002 | 91.6% |
[ 1.5% - 2.0% ] 1.58% | 100,924 | 93.9% |
[ 1.5% - 2.0% ] 1.68% | 177,331 | 83.7% |
[ 1.5% - 2.0% ] 1.78% | 183,442 | 92.9% |
[ 1.5% - 2.0% ] 1.87% | 140,535 | 92.2% |
[ 1.5% - 2.0% ] 1.97% | 262,666 | 91.9% |
[ 2.0% - 2.5% ] 2.07% | 66,031 | 93.1% |
[ 2.0% - 2.5% ] 2.15% | 67,210 | 93.1% |
[ 2.0% - 2.5% ] 2.25% | 77,659 | 90.5% |
[ 2.0% - 2.5% ] 2.37% | 74,457 | 93.3% |
[ 2.0% - 2.5% ] 2.48% | 69,767 | 91.5% |
[ 2.5% - 3.0% ] 2.57% | 63,958 | 91.2% |
[ 2.5% - 3.0% ] 2.64% | 337,411 | 86.8% |
[ 2.5% - 3.0% ] 2.74% | 56,927 | 89.5% |
[ 2.5% - 3.0% ] 2.83% | 77,618 | 93.6% |
[ 2.5% - 3.0% ] 2.94% | 8,566 | 96.8% |
[ 3.0% - 3.5% ] 3.07% | 32,651 | 90.0% |
[ 3.0% - 3.5% ] 3.10% | 290 | 97.1% |
[ 3.0% - 3.5% ] 3.20% | 92,651 | 91.6% |
[ 3.0% - 3.5% ] 3.29% | 4,591 | 96.7% |
[ 3.0% - 3.5% ] 3.45% | 9,310 | 92.8% |
[ 3.0% - 3.5% ] 3.49% | 2,433 | 97.2% |
[ 3.5% - 4.0% ] 3.60% | 70,364 | 84.0% |
[ 3.5% - 4.0% ] 3.69% | 1,003 | 93.2% |
[ 3.5% - 4.0% ] 3.84% | 41,405 | 90.4% |
[ 3.5% - 4.0% ] 3.87% | 439 | 100.0% |
[ 3.5% - 4.0% ] 3.99% | 146,187 | 92.7% |
[ 4.0% - 4.5% ] 4.18% | 34,220 | 89.5% |
[ 4.0% - 4.5% ] 4.24% | 802 | 100.0% |
[ 4.0% - 4.5% ] 4.38% | 958 | 100.0% |
[ 4.5% - 5.0% ] 4.55% | 14,787 | 96.2% |
[ 4.5% - 5.0% ] 4.69% | 2,984 | 89.6% |
[ 5.0% - 5.5% ] 5.03% | 5,134 | 90.9% |
[ 5.0% - 5.5% ] 5.15% | 4,332 | 98.7% |
[ 5.0% - 5.5% ] 5.24% | 5,291 | 99.7% |
[ 5.0% - 5.5% ] 5.33% | 244 | 100.0% |
[ 5.0% - 5.5% ] 5.47% | 17,716 | 97.0% |
[ 5.5% - 6.0% ] 5.66% | 106 | 93.2% |
[ 6.0% - 6.5% ] 6.06% | 57,662 | 86.3% |
[ 6.0% - 6.5% ] 6.16% | 991 | 97.3% |
[ 6.0% - 6.5% ] 6.36% | 3,208 | 98.1% |
[ 6.5% - 7.0% ] 6.65% | 19,613 | 80.7% |
[ 6.5% - 7.0% ] 6.74% | 1,900 | 92.2% |
[ 6.5% - 7.0% ] 6.98% | 43 | 100.0% |
[ 7.0% - 7.5% ] 7.19% | 153 | 100.0% |
[ 7.0% - 7.5% ] 7.27% | 55 | 100.0% |
[ 8.0% - 8.5% ] 8.11% | 2,207 | 98.3% |
[ 8.0% - 8.5% ] 8.33% | 216 | 99.0% |
[ 8.5% - 9.0% ] 8.65% | 1,052 | 100.0% |
[ 8.5% - 9.0% ] 8.70% | 1,172 | 98.7% |
[ 8.5% - 9.0% ] 8.80% | 1,693 | 98.3% |
[ 9.5% - 10.0% ] 9.93% | 1,218 | 94.5% |
[ 10.5% - 11.0% ] 10.82% | 564 | 98.6% |
[ 11.5% - 12.0% ] 11.58% | 570 | 95.2% |
[ 14.5% - 15.0% ] 14.86% | 619 | 100.0% |
[ 16.0% - 16.5% ] 16.49% | 734 | 92.8% |
[ 17.0% - 17.5% ] 17.26% | 197 | 100.0% |
[ 19.0% - 19.5% ] 19.23% | 26 | 100.0% |
[ 31.5% - 32.0% ] 31.88% | 138 | 100.0% |