Immigrants from Laos vs Immigrants from France Wage/Income Gap
COMPARE
Immigrants from Laos
Immigrants from France
Wage/Income Gap
Wage/Income Gap Comparison
Immigrants from Laos
Immigrants from France
23.8%
WAGE/INCOME GAP
99.0/ 100
METRIC RATING
102nd/ 347
METRIC RANK
27.4%
WAGE/INCOME GAP
2.1/ 100
METRIC RATING
255th/ 347
METRIC RANK
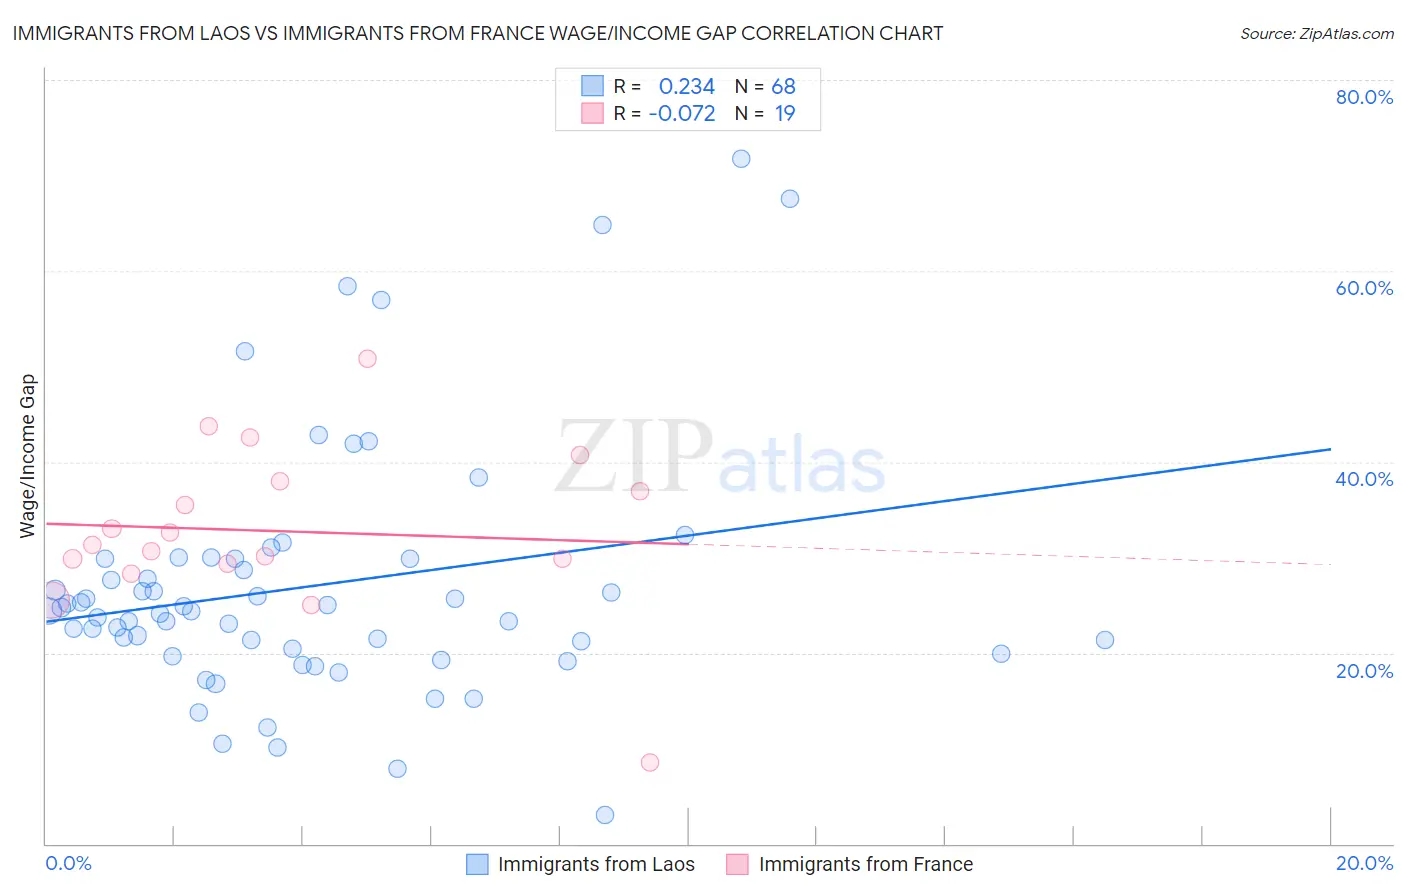
Immigrants from Laos vs Immigrants from France Wage/Income Gap Correlation Chart
The statistical analysis conducted on geographies consisting of 201,434,388 people shows a weak positive correlation between the proportion of Immigrants from Laos and wage/income gap percentage in the United States with a correlation coefficient (R) of 0.234 and weighted average of 23.8%. Similarly, the statistical analysis conducted on geographies consisting of 287,766,444 people shows a slight negative correlation between the proportion of Immigrants from France and wage/income gap percentage in the United States with a correlation coefficient (R) of -0.072 and weighted average of 27.4%, a difference of 15.0%.
Wage/Income Gap Correlation Summary
| Measurement | Immigrants from Laos | Immigrants from France |
| Minimum | 3.0% | 8.5% |
| Maximum | 71.7% | 50.8% |
| Range | 68.7% | 42.2% |
| Mean | 27.0% | 32.7% |
| Median | 24.4% | 31.3% |
| Interquartile 25% (IQ1) | 20.2% | 29.3% |
| Interquartile 75% (IQ3) | 29.8% | 37.9% |
| Interquartile Range (IQR) | 9.7% | 8.6% |
| Standard Deviation (Sample) | 13.2% | 8.9% |
| Standard Deviation (Population) | 13.1% | 8.6% |
Similar Demographics by Wage/Income Gap
Demographics Similar to Immigrants from Laos by Wage/Income Gap
In terms of wage/income gap, the demographic groups most similar to Immigrants from Laos are Japanese (23.8%, a difference of 0.14%), Tsimshian (23.9%, a difference of 0.23%), Yakama (23.7%, a difference of 0.30%), Aleut (23.7%, a difference of 0.32%), and Immigrants from Latin America (23.7%, a difference of 0.39%).
| Demographics | Rating | Rank | Wage/Income Gap |
| Cape Verdeans | 99.4 /100 | #95 | Exceptional 23.6% |
| Kiowa | 99.4 /100 | #96 | Exceptional 23.6% |
| Immigrants | Sudan | 99.4 /100 | #97 | Exceptional 23.6% |
| Immigrants | Latin America | 99.2 /100 | #98 | Exceptional 23.7% |
| Aleuts | 99.2 /100 | #99 | Exceptional 23.7% |
| Yakama | 99.2 /100 | #100 | Exceptional 23.7% |
| Japanese | 99.1 /100 | #101 | Exceptional 23.8% |
| Immigrants | Laos | 99.0 /100 | #102 | Exceptional 23.8% |
| Tsimshian | 98.9 /100 | #103 | Exceptional 23.9% |
| Tlingit-Haida | 98.7 /100 | #104 | Exceptional 24.0% |
| Moroccans | 98.6 /100 | #105 | Exceptional 24.0% |
| Sudanese | 98.6 /100 | #106 | Exceptional 24.0% |
| Yaqui | 98.4 /100 | #107 | Exceptional 24.0% |
| Immigrants | Albania | 98.4 /100 | #108 | Exceptional 24.0% |
| Ugandans | 98.3 /100 | #109 | Exceptional 24.1% |
Demographics Similar to Immigrants from France by Wage/Income Gap
In terms of wage/income gap, the demographic groups most similar to Immigrants from France are Israeli (27.4%, a difference of 0.010%), Portuguese (27.4%, a difference of 0.090%), Cherokee (27.4%, a difference of 0.10%), Luxembourger (27.4%, a difference of 0.15%), and Slavic (27.4%, a difference of 0.19%).
| Demographics | Rating | Rank | Wage/Income Gap |
| Cypriots | 2.8 /100 | #248 | Tragic 27.3% |
| Carpatho Rusyns | 2.7 /100 | #249 | Tragic 27.3% |
| Immigrants | Czechoslovakia | 2.7 /100 | #250 | Tragic 27.3% |
| Immigrants | Norway | 2.5 /100 | #251 | Tragic 27.3% |
| Ukrainians | 2.4 /100 | #252 | Tragic 27.3% |
| Portuguese | 2.2 /100 | #253 | Tragic 27.4% |
| Israelis | 2.1 /100 | #254 | Tragic 27.4% |
| Immigrants | France | 2.1 /100 | #255 | Tragic 27.4% |
| Cherokee | 1.9 /100 | #256 | Tragic 27.4% |
| Luxembourgers | 1.9 /100 | #257 | Tragic 27.4% |
| Slavs | 1.8 /100 | #258 | Tragic 27.4% |
| Icelanders | 1.8 /100 | #259 | Tragic 27.5% |
| Tongans | 1.7 /100 | #260 | Tragic 27.5% |
| Immigrants | Germany | 1.5 /100 | #261 | Tragic 27.5% |
| Immigrants | Lebanon | 1.5 /100 | #262 | Tragic 27.5% |