Immigrants from Laos vs Immigrants from Peru Wage/Income Gap
COMPARE
Immigrants from Laos
Immigrants from Peru
Wage/Income Gap
Wage/Income Gap Comparison
Immigrants from Laos
Immigrants from Peru
23.8%
WAGE/INCOME GAP
99.0/ 100
METRIC RATING
102nd/ 347
METRIC RANK
25.1%
WAGE/INCOME GAP
82.6/ 100
METRIC RATING
149th/ 347
METRIC RANK
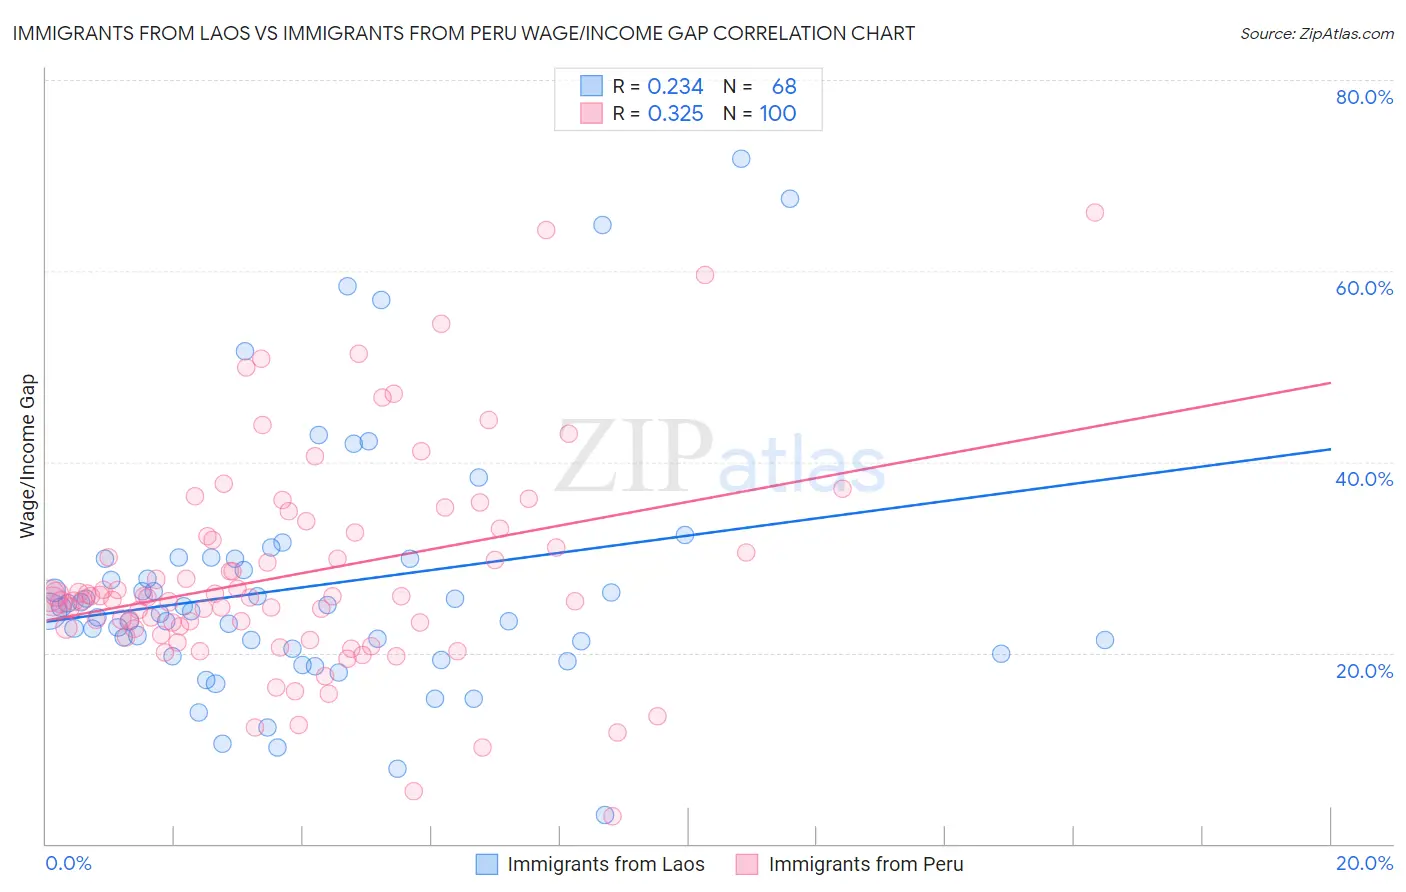
Immigrants from Laos vs Immigrants from Peru Wage/Income Gap Correlation Chart
The statistical analysis conducted on geographies consisting of 201,434,388 people shows a weak positive correlation between the proportion of Immigrants from Laos and wage/income gap percentage in the United States with a correlation coefficient (R) of 0.234 and weighted average of 23.8%. Similarly, the statistical analysis conducted on geographies consisting of 328,741,739 people shows a mild positive correlation between the proportion of Immigrants from Peru and wage/income gap percentage in the United States with a correlation coefficient (R) of 0.325 and weighted average of 25.1%, a difference of 5.4%.
Wage/Income Gap Correlation Summary
| Measurement | Immigrants from Laos | Immigrants from Peru |
| Minimum | 3.0% | 2.9% |
| Maximum | 71.7% | 66.2% |
| Range | 68.7% | 63.3% |
| Mean | 27.0% | 28.2% |
| Median | 24.4% | 25.8% |
| Interquartile 25% (IQ1) | 20.2% | 22.6% |
| Interquartile 75% (IQ3) | 29.8% | 32.4% |
| Interquartile Range (IQR) | 9.7% | 9.8% |
| Standard Deviation (Sample) | 13.2% | 11.3% |
| Standard Deviation (Population) | 13.1% | 11.2% |
Similar Demographics by Wage/Income Gap
Demographics Similar to Immigrants from Laos by Wage/Income Gap
In terms of wage/income gap, the demographic groups most similar to Immigrants from Laos are Japanese (23.8%, a difference of 0.14%), Tsimshian (23.9%, a difference of 0.23%), Yakama (23.7%, a difference of 0.30%), Aleut (23.7%, a difference of 0.32%), and Immigrants from Latin America (23.7%, a difference of 0.39%).
| Demographics | Rating | Rank | Wage/Income Gap |
| Cape Verdeans | 99.4 /100 | #95 | Exceptional 23.6% |
| Kiowa | 99.4 /100 | #96 | Exceptional 23.6% |
| Immigrants | Sudan | 99.4 /100 | #97 | Exceptional 23.6% |
| Immigrants | Latin America | 99.2 /100 | #98 | Exceptional 23.7% |
| Aleuts | 99.2 /100 | #99 | Exceptional 23.7% |
| Yakama | 99.2 /100 | #100 | Exceptional 23.7% |
| Japanese | 99.1 /100 | #101 | Exceptional 23.8% |
| Immigrants | Laos | 99.0 /100 | #102 | Exceptional 23.8% |
| Tsimshian | 98.9 /100 | #103 | Exceptional 23.9% |
| Tlingit-Haida | 98.7 /100 | #104 | Exceptional 24.0% |
| Moroccans | 98.6 /100 | #105 | Exceptional 24.0% |
| Sudanese | 98.6 /100 | #106 | Exceptional 24.0% |
| Yaqui | 98.4 /100 | #107 | Exceptional 24.0% |
| Immigrants | Albania | 98.4 /100 | #108 | Exceptional 24.0% |
| Ugandans | 98.3 /100 | #109 | Exceptional 24.1% |
Demographics Similar to Immigrants from Peru by Wage/Income Gap
In terms of wage/income gap, the demographic groups most similar to Immigrants from Peru are Immigrants (25.1%, a difference of 0.040%), Taiwanese (25.1%, a difference of 0.12%), Iroquois (25.1%, a difference of 0.15%), Uruguayan (25.2%, a difference of 0.16%), and Malaysian (25.0%, a difference of 0.28%).
| Demographics | Rating | Rank | Wage/Income Gap |
| Afghans | 88.1 /100 | #142 | Excellent 24.9% |
| Immigrants | Uganda | 88.0 /100 | #143 | Excellent 24.9% |
| Chippewa | 86.9 /100 | #144 | Excellent 25.0% |
| Comanche | 85.2 /100 | #145 | Excellent 25.0% |
| South Americans | 85.2 /100 | #146 | Excellent 25.0% |
| Malaysians | 84.9 /100 | #147 | Excellent 25.0% |
| Iroquois | 83.9 /100 | #148 | Excellent 25.1% |
| Immigrants | Peru | 82.6 /100 | #149 | Excellent 25.1% |
| Immigrants | Immigrants | 82.3 /100 | #150 | Excellent 25.1% |
| Taiwanese | 81.6 /100 | #151 | Excellent 25.1% |
| Uruguayans | 81.3 /100 | #152 | Excellent 25.2% |
| Blackfeet | 78.1 /100 | #153 | Good 25.2% |
| Immigrants | Northern Africa | 78.1 /100 | #154 | Good 25.2% |
| Immigrants | Vietnam | 77.7 /100 | #155 | Good 25.2% |
| Immigrants | Mexico | 76.4 /100 | #156 | Good 25.3% |