Immigrants from Honduras Disability Age 5 to 17
COMPARE
Immigrants from Honduras
Select to Compare
Disability Age 5 to 17
Immigrants from Honduras Disability Age 5 to 17
5.9%
DISABILITY | AGE 5 TO 17
1.8/ 100
METRIC RATING
247th/ 347
METRIC RANK
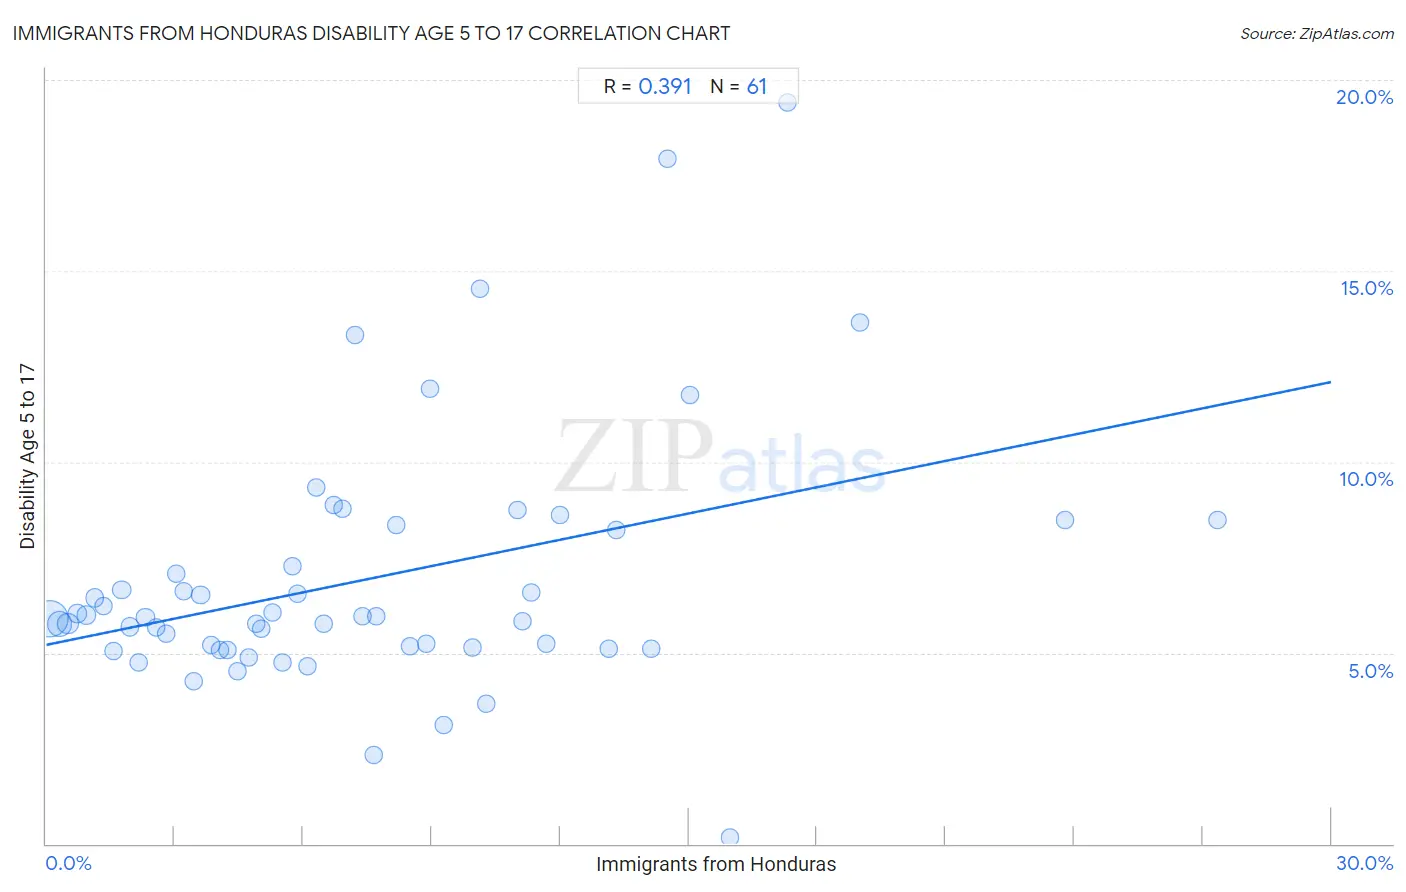
Immigrants from Honduras Disability Age 5 to 17 Correlation Chart
The statistical analysis conducted on geographies consisting of 321,075,572 people shows a mild positive correlation between the proportion of Immigrants from Honduras and percentage of population with a disability between the ages 5 and 17 in the United States with a correlation coefficient (R) of 0.391 and weighted average of 5.9%. On average, for every 1% (one percent) increase in Immigrants from Honduras within a typical geography, there is an increase of 0.23% in percentage of population with a disability between the ages 5 and 17.
It is essential to understand that the correlation between the percentage of Immigrants from Honduras and percentage of population with a disability between the ages 5 and 17 does not imply a direct cause-and-effect relationship. It remains uncertain whether the presence of Immigrants from Honduras influences an upward or downward trend in the level of percentage of population with a disability between the ages 5 and 17 within an area, or if Immigrants from Honduras simply ended up residing in those areas with higher or lower levels of percentage of population with a disability between the ages 5 and 17 due to other factors.
Demographics Similar to Immigrants from Honduras by Disability Age 5 to 17
In terms of disability age 5 to 17, the demographic groups most similar to Immigrants from Honduras are Immigrants from Germany (5.9%, a difference of 0.030%), Immigrants from Micronesia (5.9%, a difference of 0.030%), Tlingit-Haida (5.9%, a difference of 0.030%), British (5.9%, a difference of 0.070%), and Indonesian (5.9%, a difference of 0.090%).
| Demographics | Rating | Rank | Disability Age 5 to 17 |
| West Indians | 2.4 /100 | #240 | Tragic 5.9% |
| Immigrants from Caribbean | 2.1 /100 | #241 | Tragic 5.9% |
| Spaniards | 2.0 /100 | #242 | Tragic 5.9% |
| Indonesians | 2.0 /100 | #243 | Tragic 5.9% |
| Immigrants from Germany | 1.9 /100 | #244 | Tragic 5.9% |
| Immigrants from Micronesia | 1.9 /100 | #245 | Tragic 5.9% |
| Tlingit-Haida | 1.9 /100 | #246 | Tragic 5.9% |
| Immigrants from Honduras | 1.8 /100 | #247 | Tragic 5.9% |
| British | 1.7 /100 | #248 | Tragic 5.9% |
| Immigrants from Ghana | 1.7 /100 | #249 | Tragic 5.9% |
| Poles | 1.5 /100 | #250 | Tragic 5.9% |
| Immigrants from Cambodia | 1.5 /100 | #251 | Tragic 5.9% |
| Hondurans | 1.5 /100 | #252 | Tragic 5.9% |
| Scandinavians | 1.4 /100 | #253 | Tragic 5.9% |
| Barbadians | 1.3 /100 | #254 | Tragic 5.9% |
Immigrants from Honduras Disability Age 5 to 17 Correlation Summary
| Measurement | Immigrants from Honduras Data | Disability Age 5 to 17 Data |
| Minimum | 0.086% | 0.17% |
| Maximum | 27.3% | 19.4% |
| Range | 27.3% | 19.3% |
| Mean | 7.4% | 6.9% |
| Median | 6.3% | 5.9% |
| Interquartile 25% (IQ1) | 3.1% | 5.1% |
| Interquartile 75% (IQ3) | 10.6% | 8.3% |
| Interquartile Range (IQR) | 7.5% | 3.2% |
| Standard Deviation (Sample) | 5.7% | 3.4% |
| Standard Deviation (Population) | 5.7% | 3.3% |
Correlation Details
| Immigrants from Honduras Percentile | Sample Size | Disability Age 5 to 17 |
[ 0.0% - 0.5% ] 0.086% | 174,485,949 | 5.9% |
[ 0.0% - 0.5% ] 0.31% | 65,678,474 | 5.8% |
[ 0.5% - 1.0% ] 0.50% | 26,914,791 | 5.8% |
[ 0.5% - 1.0% ] 0.72% | 15,389,181 | 6.0% |
[ 0.5% - 1.0% ] 0.94% | 9,488,916 | 6.0% |
[ 1.0% - 1.5% ] 1.13% | 4,877,458 | 6.4% |
[ 1.0% - 1.5% ] 1.34% | 4,132,030 | 6.2% |
[ 1.5% - 2.0% ] 1.57% | 3,886,832 | 5.0% |
[ 1.5% - 2.0% ] 1.76% | 2,963,969 | 6.7% |
[ 1.5% - 2.0% ] 1.96% | 1,697,254 | 5.7% |
[ 2.0% - 2.5% ] 2.17% | 1,298,530 | 4.7% |
[ 2.0% - 2.5% ] 2.32% | 3,444,691 | 5.9% |
[ 2.5% - 3.0% ] 2.57% | 1,113,481 | 5.7% |
[ 2.5% - 3.0% ] 2.79% | 1,256,763 | 5.5% |
[ 3.0% - 3.5% ] 3.02% | 411,315 | 7.1% |
[ 3.0% - 3.5% ] 3.22% | 309,949 | 6.6% |
[ 3.0% - 3.5% ] 3.45% | 189,547 | 4.3% |
[ 3.5% - 4.0% ] 3.60% | 462,275 | 6.5% |
[ 3.5% - 4.0% ] 3.87% | 222,403 | 5.2% |
[ 4.0% - 4.5% ] 4.04% | 267,160 | 5.1% |
[ 4.0% - 4.5% ] 4.24% | 349,393 | 5.1% |
[ 4.0% - 4.5% ] 4.45% | 237,052 | 4.5% |
[ 4.5% - 5.0% ] 4.72% | 57,862 | 4.9% |
[ 4.5% - 5.0% ] 4.90% | 113,099 | 5.8% |
[ 5.0% - 5.5% ] 5.02% | 550,699 | 5.6% |
[ 5.0% - 5.5% ] 5.29% | 59,817 | 6.1% |
[ 5.5% - 6.0% ] 5.53% | 135,016 | 4.7% |
[ 5.5% - 6.0% ] 5.76% | 196,162 | 7.3% |
[ 5.5% - 6.0% ] 5.86% | 132,426 | 6.6% |
[ 6.0% - 6.5% ] 6.11% | 38,581 | 4.7% |
[ 6.0% - 6.5% ] 6.30% | 50,822 | 9.3% |
[ 6.0% - 6.5% ] 6.48% | 76,752 | 5.8% |
[ 6.5% - 7.0% ] 6.71% | 13,007 | 8.9% |
[ 6.5% - 7.0% ] 6.93% | 1,761 | 8.8% |
[ 7.0% - 7.5% ] 7.21% | 31,296 | 13.3% |
[ 7.0% - 7.5% ] 7.37% | 41,449 | 5.9% |
[ 7.5% - 8.0% ] 7.63% | 2,410 | 2.3% |
[ 7.5% - 8.0% ] 7.71% | 32,946 | 6.0% |
[ 8.0% - 8.5% ] 8.16% | 44,138 | 8.4% |
[ 8.0% - 8.5% ] 8.48% | 35,833 | 5.2% |
[ 8.5% - 9.0% ] 8.87% | 46,203 | 5.2% |
[ 8.5% - 9.0% ] 8.95% | 20,266 | 11.9% |
[ 9.0% - 9.5% ] 9.27% | 52,360 | 3.1% |
[ 9.5% - 10.0% ] 9.95% | 46,418 | 5.1% |
[ 10.0% - 10.5% ] 10.11% | 1,938 | 14.5% |
[ 10.0% - 10.5% ] 10.28% | 8,071 | 3.7% |
[ 11.0% - 11.5% ] 11.01% | 8,750 | 8.7% |
[ 11.0% - 11.5% ] 11.13% | 66,326 | 5.8% |
[ 11.0% - 11.5% ] 11.32% | 59,121 | 6.6% |
[ 11.5% - 12.0% ] 11.66% | 16,743 | 5.2% |
[ 12.0% - 12.5% ] 12.01% | 26,105 | 8.6% |
[ 13.0% - 13.5% ] 13.13% | 7,385 | 5.1% |
[ 13.0% - 13.5% ] 13.32% | 856 | 8.2% |
[ 14.0% - 14.5% ] 14.14% | 6,947 | 5.1% |
[ 14.5% - 15.0% ] 14.51% | 944 | 17.9% |
[ 15.0% - 15.5% ] 15.03% | 3,559 | 11.7% |
[ 15.5% - 16.0% ] 15.95% | 8,989 | 0.17% |
[ 17.0% - 17.5% ] 17.32% | 976 | 19.4% |
[ 18.5% - 19.0% ] 19.00% | 679 | 13.6% |
[ 23.5% - 24.0% ] 23.77% | 774 | 8.5% |
[ 27.0% - 27.5% ] 27.34% | 673 | 8.5% |