Immigrants from Honduras GED/Equivalency
COMPARE
Immigrants from Honduras
Select to Compare
GED/Equivalency
Immigrants from Honduras GED/Equivalency
78.7%
GED/EQUIVALENCY
0.0/ 100
METRIC RATING
331st/ 347
METRIC RANK
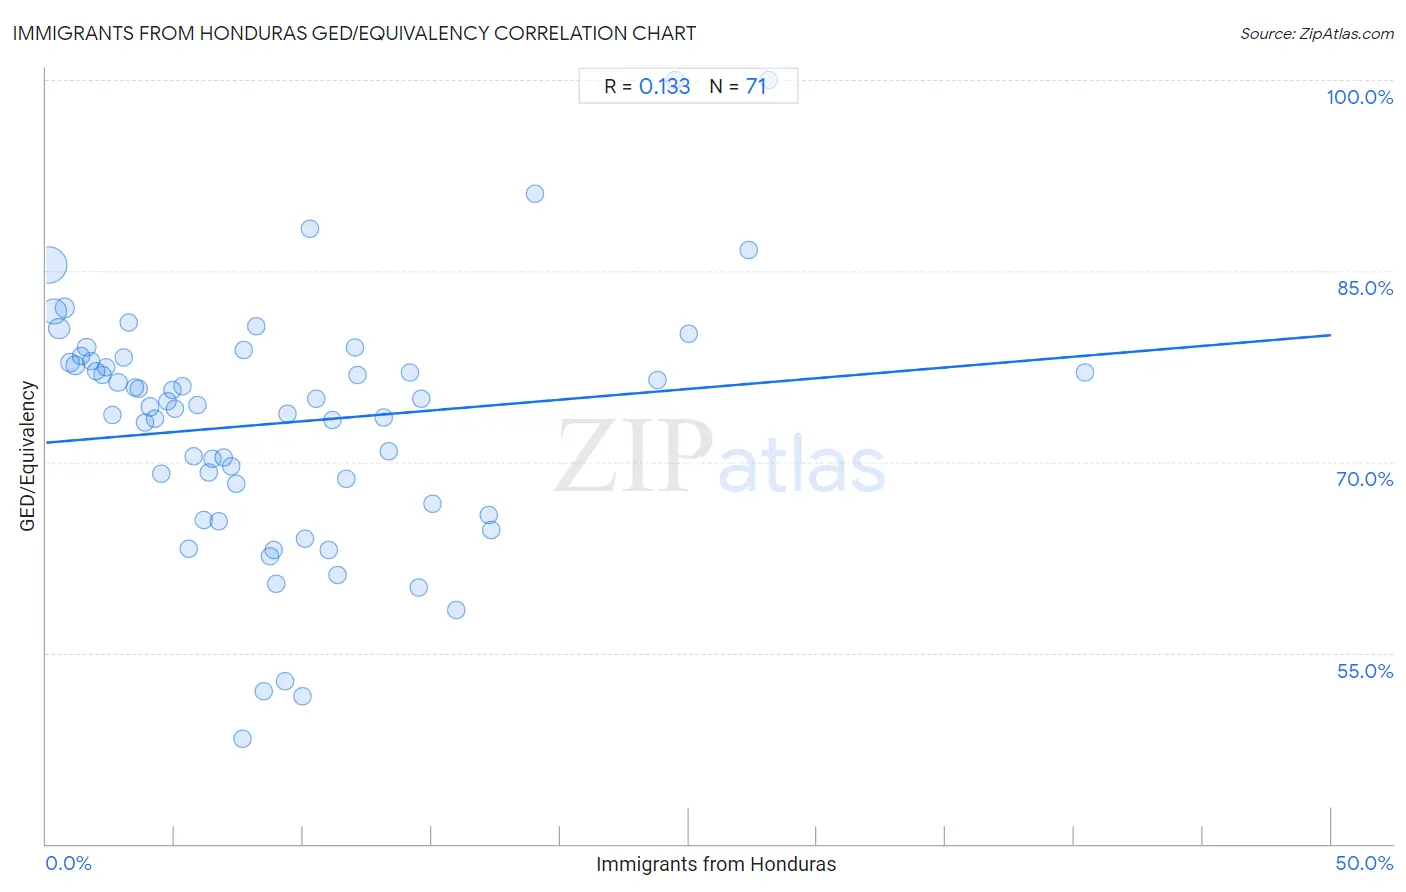
Immigrants from Honduras GED/Equivalency Correlation Chart
The statistical analysis conducted on geographies consisting of 322,637,196 people shows a poor positive correlation between the proportion of Immigrants from Honduras and percentage of population with at least ged/equivalency education in the United States with a correlation coefficient (R) of 0.133 and weighted average of 78.7%. On average, for every 1% (one percent) increase in Immigrants from Honduras within a typical geography, there is an increase of 0.17% in percentage of population with at least ged/equivalency education.
It is essential to understand that the correlation between the percentage of Immigrants from Honduras and percentage of population with at least ged/equivalency education does not imply a direct cause-and-effect relationship. It remains uncertain whether the presence of Immigrants from Honduras influences an upward or downward trend in the level of percentage of population with at least ged/equivalency education within an area, or if Immigrants from Honduras simply ended up residing in those areas with higher or lower levels of percentage of population with at least ged/equivalency education due to other factors.
Demographics Similar to Immigrants from Honduras by GED/Equivalency
In terms of ged/equivalency, the demographic groups most similar to Immigrants from Honduras are Immigrants from the Azores (78.7%, a difference of 0.11%), Salvadoran (78.6%, a difference of 0.22%), Immigrants from Cabo Verde (78.9%, a difference of 0.24%), Guatemalan (78.5%, a difference of 0.31%), and Immigrants from Latin America (78.5%, a difference of 0.33%).
| Demographics | Rating | Rank | GED/Equivalency |
| Mexican American Indians | 0.0 /100 | #324 | Tragic 79.4% |
| Hondurans | 0.0 /100 | #325 | Tragic 79.3% |
| Yuman | 0.0 /100 | #326 | Tragic 79.2% |
| Central Americans | 0.0 /100 | #327 | Tragic 79.2% |
| Hispanics or Latinos | 0.0 /100 | #328 | Tragic 79.1% |
| Dominicans | 0.0 /100 | #329 | Tragic 79.1% |
| Immigrants from Cabo Verde | 0.0 /100 | #330 | Tragic 78.9% |
| Immigrants from Honduras | 0.0 /100 | #331 | Tragic 78.7% |
| Immigrants from the Azores | 0.0 /100 | #332 | Tragic 78.7% |
| Salvadorans | 0.0 /100 | #333 | Tragic 78.6% |
| Guatemalans | 0.0 /100 | #334 | Tragic 78.5% |
| Immigrants from Latin America | 0.0 /100 | #335 | Tragic 78.5% |
| Immigrants from Dominican Republic | 0.0 /100 | #336 | Tragic 78.0% |
| Immigrants from Yemen | 0.0 /100 | #337 | Tragic 77.9% |
| Immigrants from Guatemala | 0.0 /100 | #338 | Tragic 77.9% |
Immigrants from Honduras GED/Equivalency Correlation Summary
| Measurement | Immigrants from Honduras Data | GED/Equivalency Data |
| Minimum | 0.086% | 48.2% |
| Maximum | 40.4% | 100.0% |
| Range | 40.3% | 51.8% |
| Mean | 9.1% | 73.0% |
| Median | 7.4% | 74.5% |
| Interquartile 25% (IQ1) | 3.6% | 66.7% |
| Interquartile 75% (IQ3) | 12.0% | 78.0% |
| Interquartile Range (IQR) | 8.4% | 11.2% |
| Standard Deviation (Sample) | 7.6% | 9.7% |
| Standard Deviation (Population) | 7.6% | 9.7% |
Correlation Details
| Immigrants from Honduras Percentile | Sample Size | GED/Equivalency |
[ 0.0% - 0.5% ] 0.086% | 175,027,645 | 85.4% |
[ 0.0% - 0.5% ] 0.31% | 65,992,412 | 81.8% |
[ 0.5% - 1.0% ] 0.50% | 27,134,693 | 80.5% |
[ 0.5% - 1.0% ] 0.72% | 15,565,873 | 82.1% |
[ 0.5% - 1.0% ] 0.94% | 9,518,646 | 77.8% |
[ 1.0% - 1.5% ] 1.13% | 4,940,819 | 77.6% |
[ 1.0% - 1.5% ] 1.34% | 4,183,956 | 78.3% |
[ 1.5% - 2.0% ] 1.57% | 3,910,016 | 79.0% |
[ 1.5% - 2.0% ] 1.76% | 2,992,597 | 78.0% |
[ 1.5% - 2.0% ] 1.96% | 1,717,295 | 77.1% |
[ 2.0% - 2.5% ] 2.17% | 1,311,760 | 76.8% |
[ 2.0% - 2.5% ] 2.32% | 3,454,845 | 77.4% |
[ 2.5% - 3.0% ] 2.57% | 1,122,288 | 73.7% |
[ 2.5% - 3.0% ] 2.79% | 1,265,471 | 76.2% |
[ 3.0% - 3.5% ] 3.02% | 412,525 | 78.2% |
[ 3.0% - 3.5% ] 3.22% | 310,136 | 81.0% |
[ 3.0% - 3.5% ] 3.45% | 189,947 | 75.8% |
[ 3.5% - 4.0% ] 3.60% | 463,701 | 75.7% |
[ 3.5% - 4.0% ] 3.87% | 224,141 | 73.1% |
[ 4.0% - 4.5% ] 4.04% | 269,160 | 74.3% |
[ 4.0% - 4.5% ] 4.24% | 350,968 | 73.4% |
[ 4.0% - 4.5% ] 4.45% | 237,632 | 69.1% |
[ 4.5% - 5.0% ] 4.72% | 58,406 | 74.7% |
[ 4.5% - 5.0% ] 4.89% | 124,604 | 75.7% |
[ 5.0% - 5.5% ] 5.02% | 553,716 | 74.2% |
[ 5.0% - 5.5% ] 5.29% | 61,702 | 75.9% |
[ 5.5% - 6.0% ] 5.52% | 136,073 | 63.2% |
[ 5.5% - 6.0% ] 5.76% | 197,284 | 70.4% |
[ 5.5% - 6.0% ] 5.86% | 133,304 | 74.5% |
[ 6.0% - 6.5% ] 6.11% | 38,581 | 65.4% |
[ 6.0% - 6.5% ] 6.30% | 54,266 | 69.2% |
[ 6.0% - 6.5% ] 6.48% | 76,752 | 70.2% |
[ 6.5% - 7.0% ] 6.71% | 13,022 | 65.4% |
[ 6.5% - 7.0% ] 6.93% | 2,453 | 70.3% |
[ 7.0% - 7.5% ] 7.20% | 32,233 | 69.6% |
[ 7.0% - 7.5% ] 7.38% | 46,418 | 68.3% |
[ 7.5% - 8.0% ] 7.63% | 2,410 | 48.2% |
[ 7.5% - 8.0% ] 7.71% | 33,614 | 78.8% |
[ 8.0% - 8.5% ] 8.17% | 45,475 | 80.7% |
[ 8.0% - 8.5% ] 8.48% | 38,342 | 52.0% |
[ 8.5% - 9.0% ] 8.70% | 161 | 62.6% |
[ 8.5% - 9.0% ] 8.87% | 46,203 | 63.1% |
[ 8.5% - 9.0% ] 8.95% | 20,288 | 60.5% |
[ 9.0% - 9.5% ] 9.27% | 52,511 | 52.8% |
[ 9.0% - 9.5% ] 9.37% | 896 | 73.8% |
[ 9.5% - 10.0% ] 9.95% | 46,418 | 51.6% |
[ 10.0% - 10.5% ] 10.09% | 2,547 | 63.9% |
[ 10.0% - 10.5% ] 10.28% | 8,071 | 88.3% |
[ 10.5% - 11.0% ] 10.53% | 304 | 75.0% |
[ 11.0% - 11.5% ] 11.01% | 8,750 | 63.0% |
[ 11.0% - 11.5% ] 11.13% | 66,326 | 73.3% |
[ 11.0% - 11.5% ] 11.32% | 59,121 | 61.1% |
[ 11.5% - 12.0% ] 11.66% | 16,971 | 68.7% |
[ 12.0% - 12.5% ] 12.01% | 26,105 | 78.9% |
[ 12.0% - 12.5% ] 12.10% | 1,405 | 76.8% |
[ 13.0% - 13.5% ] 13.13% | 7,385 | 73.5% |
[ 13.0% - 13.5% ] 13.32% | 856 | 70.8% |
[ 14.0% - 14.5% ] 14.14% | 6,947 | 77.0% |
[ 14.5% - 15.0% ] 14.50% | 1,303 | 60.1% |
[ 14.5% - 15.0% ] 14.58% | 48 | 75.0% |
[ 15.0% - 15.5% ] 15.03% | 3,559 | 66.7% |
[ 15.5% - 16.0% ] 15.95% | 8,989 | 58.4% |
[ 17.0% - 17.5% ] 17.21% | 1,714 | 65.8% |
[ 17.0% - 17.5% ] 17.32% | 976 | 64.7% |
[ 18.5% - 19.0% ] 19.00% | 679 | 91.1% |
[ 23.5% - 24.0% ] 23.77% | 774 | 76.5% |
[ 24.0% - 24.5% ] 24.44% | 180 | 100.0% |
[ 25.0% - 25.5% ] 25.00% | 1,556 | 80.1% |
[ 27.0% - 27.5% ] 27.34% | 673 | 86.7% |
[ 28.0% - 28.5% ] 28.12% | 64 | 100.0% |
[ 40.0% - 40.5% ] 40.43% | 235 | 77.1% |