Immigrants from Honduras Self-Care Disability
COMPARE
Immigrants from Honduras
Select to Compare
Self-Care Disability
Immigrants from Honduras Self-Care Disability
2.6%
SELF-CARE DISABILITY
4.7/ 100
METRIC RATING
214th/ 347
METRIC RANK
Immigrants from Honduras Self-Care Disability Correlation Chart
The statistical analysis conducted on geographies consisting of 322,379,490 people shows a slight negative correlation between the proportion of Immigrants from Honduras and percentage of population with self-care disability in the United States with a correlation coefficient (R) of -0.066 and weighted average of 2.6%. On average, for every 1% (one percent) increase in Immigrants from Honduras within a typical geography, there is a decrease of 0.0089% in percentage of population with self-care disability.
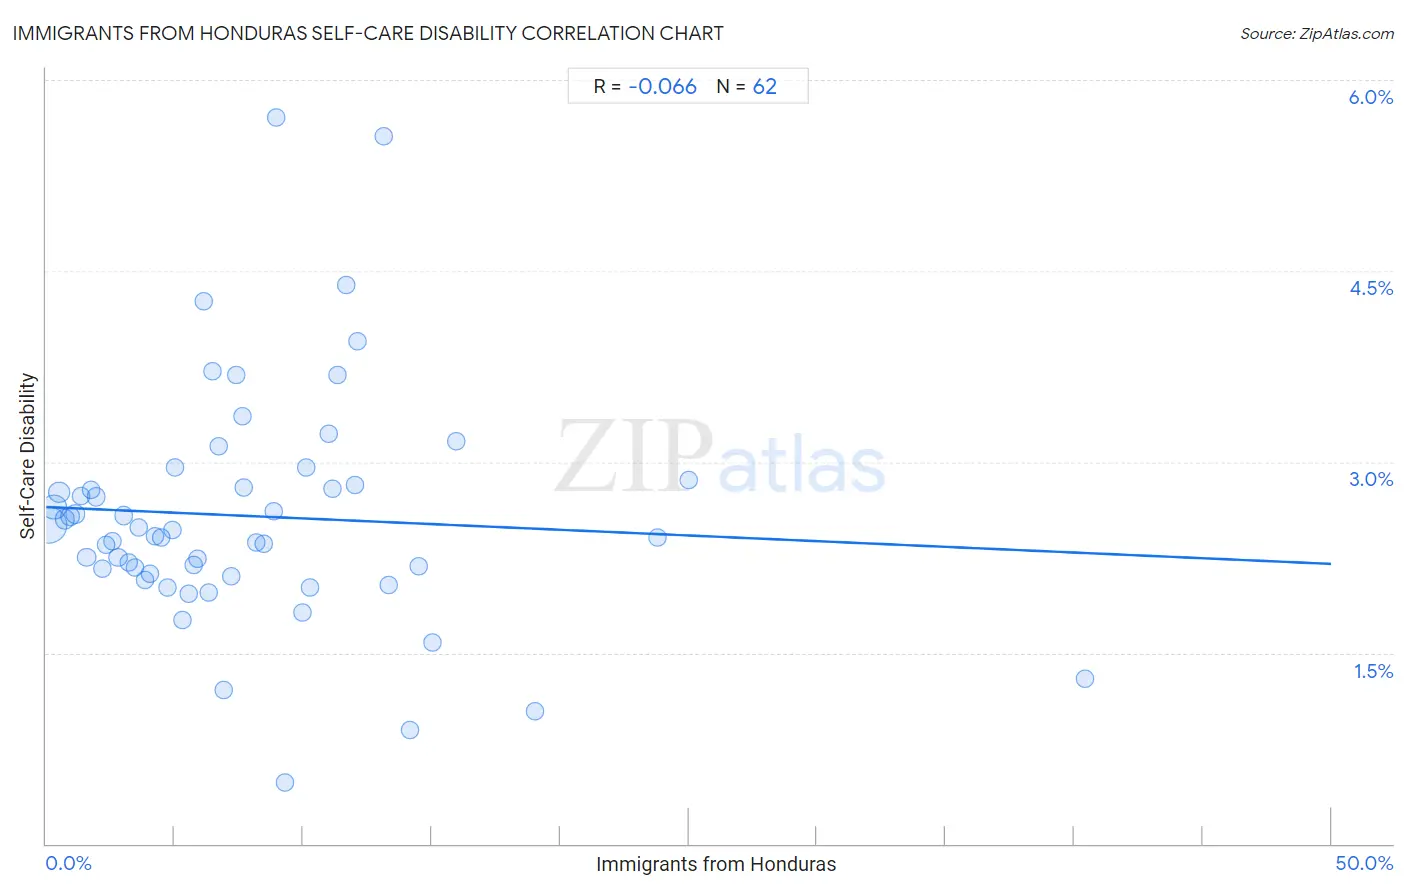
It is essential to understand that the correlation between the percentage of Immigrants from Honduras and percentage of population with self-care disability does not imply a direct cause-and-effect relationship. It remains uncertain whether the presence of Immigrants from Honduras influences an upward or downward trend in the level of percentage of population with self-care disability within an area, or if Immigrants from Honduras simply ended up residing in those areas with higher or lower levels of percentage of population with self-care disability due to other factors.
Demographics Similar to Immigrants from Honduras by Self-Care Disability
In terms of self-care disability, the demographic groups most similar to Immigrants from Honduras are Ecuadorian (2.6%, a difference of 0.0%), Immigrants from Thailand (2.6%, a difference of 0.040%), White/Caucasian (2.6%, a difference of 0.070%), Celtic (2.6%, a difference of 0.090%), and Samoan (2.6%, a difference of 0.10%).
| Demographics | Rating | Rank | Self-Care Disability |
| French | 9.9 /100 | #207 | Tragic 2.5% |
| Central Americans | 8.7 /100 | #208 | Tragic 2.5% |
| Malaysians | 7.7 /100 | #209 | Tragic 2.5% |
| Panamanians | 6.4 /100 | #210 | Tragic 2.5% |
| Native Hawaiians | 5.1 /100 | #211 | Tragic 2.6% |
| Samoans | 5.1 /100 | #212 | Tragic 2.6% |
| Ecuadorians | 4.7 /100 | #213 | Tragic 2.6% |
| Immigrants from Honduras | 4.7 /100 | #214 | Tragic 2.6% |
| Immigrants from Thailand | 4.5 /100 | #215 | Tragic 2.6% |
| Whites/Caucasians | 4.4 /100 | #216 | Tragic 2.6% |
| Celtics | 4.4 /100 | #217 | Tragic 2.6% |
| Scotch-Irish | 4.1 /100 | #218 | Tragic 2.6% |
| Immigrants from Moldova | 4.0 /100 | #219 | Tragic 2.6% |
| Sub-Saharan Africans | 4.0 /100 | #220 | Tragic 2.6% |
| Hondurans | 3.8 /100 | #221 | Tragic 2.6% |
Immigrants from Honduras Self-Care Disability Correlation Summary
| Measurement | Immigrants from Honduras Data | Self-Care Disability Data |
| Minimum | 0.086% | 0.48% |
| Maximum | 40.4% | 5.7% |
| Range | 40.3% | 5.2% |
| Mean | 7.9% | 2.6% |
| Median | 6.4% | 2.4% |
| Interquartile 25% (IQ1) | 3.2% | 2.1% |
| Interquartile 75% (IQ3) | 11.0% | 2.8% |
| Interquartile Range (IQR) | 7.8% | 0.70% |
| Standard Deviation (Sample) | 6.9% | 0.92% |
| Standard Deviation (Population) | 6.8% | 0.91% |
Correlation Details
| Immigrants from Honduras Percentile | Sample Size | Self-Care Disability |
[ 0.0% - 0.5% ] 0.086% | 174,904,634 | 2.5% |
[ 0.0% - 0.5% ] 0.31% | 65,961,489 | 2.6% |
[ 0.5% - 1.0% ] 0.50% | 27,109,018 | 2.8% |
[ 0.5% - 1.0% ] 0.72% | 15,535,143 | 2.5% |
[ 0.5% - 1.0% ] 0.94% | 9,515,187 | 2.6% |
[ 1.0% - 1.5% ] 1.13% | 4,932,877 | 2.6% |
[ 1.0% - 1.5% ] 1.34% | 4,173,151 | 2.7% |
[ 1.5% - 2.0% ] 1.57% | 3,906,969 | 2.3% |
[ 1.5% - 2.0% ] 1.76% | 2,988,982 | 2.8% |
[ 1.5% - 2.0% ] 1.96% | 1,717,295 | 2.7% |
[ 2.0% - 2.5% ] 2.17% | 1,311,760 | 2.2% |
[ 2.0% - 2.5% ] 2.32% | 3,451,957 | 2.3% |
[ 2.5% - 3.0% ] 2.57% | 1,121,637 | 2.4% |
[ 2.5% - 3.0% ] 2.79% | 1,265,156 | 2.2% |
[ 3.0% - 3.5% ] 3.02% | 412,195 | 2.6% |
[ 3.0% - 3.5% ] 3.22% | 310,136 | 2.2% |
[ 3.0% - 3.5% ] 3.45% | 189,257 | 2.2% |
[ 3.5% - 4.0% ] 3.60% | 463,143 | 2.5% |
[ 3.5% - 4.0% ] 3.87% | 223,279 | 2.1% |
[ 4.0% - 4.5% ] 4.04% | 267,410 | 2.1% |
[ 4.0% - 4.5% ] 4.24% | 350,421 | 2.4% |
[ 4.0% - 4.5% ] 4.45% | 237,346 | 2.4% |
[ 4.5% - 5.0% ] 4.72% | 57,555 | 2.0% |
[ 4.5% - 5.0% ] 4.89% | 124,604 | 2.5% |
[ 5.0% - 5.5% ] 5.02% | 553,716 | 3.0% |
[ 5.0% - 5.5% ] 5.29% | 61,588 | 1.8% |
[ 5.5% - 6.0% ] 5.53% | 135,016 | 2.0% |
[ 5.5% - 6.0% ] 5.76% | 197,284 | 2.2% |
[ 5.5% - 6.0% ] 5.86% | 133,304 | 2.2% |
[ 6.0% - 6.5% ] 6.11% | 38,581 | 4.3% |
[ 6.0% - 6.5% ] 6.30% | 54,266 | 2.0% |
[ 6.0% - 6.5% ] 6.48% | 76,752 | 3.7% |
[ 6.5% - 7.0% ] 6.71% | 13,007 | 3.1% |
[ 6.5% - 7.0% ] 6.93% | 2,453 | 1.2% |
[ 7.0% - 7.5% ] 7.20% | 32,011 | 2.1% |
[ 7.0% - 7.5% ] 7.38% | 46,418 | 3.7% |
[ 7.5% - 8.0% ] 7.63% | 2,410 | 3.4% |
[ 7.5% - 8.0% ] 7.71% | 33,614 | 2.8% |
[ 8.0% - 8.5% ] 8.16% | 44,138 | 2.4% |
[ 8.0% - 8.5% ] 8.48% | 38,342 | 2.4% |
[ 8.5% - 9.0% ] 8.87% | 46,203 | 2.6% |
[ 8.5% - 9.0% ] 8.95% | 20,266 | 5.7% |
[ 9.0% - 9.5% ] 9.27% | 52,360 | 0.48% |
[ 9.5% - 10.0% ] 9.95% | 46,418 | 1.8% |
[ 10.0% - 10.5% ] 10.11% | 1,938 | 3.0% |
[ 10.0% - 10.5% ] 10.28% | 8,071 | 2.0% |
[ 11.0% - 11.5% ] 11.01% | 8,750 | 3.2% |
[ 11.0% - 11.5% ] 11.13% | 66,326 | 2.8% |
[ 11.0% - 11.5% ] 11.32% | 59,121 | 3.7% |
[ 11.5% - 12.0% ] 11.66% | 16,743 | 4.4% |
[ 12.0% - 12.5% ] 12.01% | 26,105 | 2.8% |
[ 12.0% - 12.5% ] 12.10% | 1,405 | 3.9% |
[ 13.0% - 13.5% ] 13.13% | 7,385 | 5.6% |
[ 13.0% - 13.5% ] 13.32% | 856 | 2.0% |
[ 14.0% - 14.5% ] 14.14% | 6,947 | 0.89% |
[ 14.5% - 15.0% ] 14.50% | 1,303 | 2.2% |
[ 15.0% - 15.5% ] 15.03% | 3,559 | 1.6% |
[ 15.5% - 16.0% ] 15.95% | 8,989 | 3.2% |
[ 18.5% - 19.0% ] 19.00% | 679 | 1.0% |
[ 23.5% - 24.0% ] 23.77% | 774 | 2.4% |
[ 25.0% - 25.5% ] 25.00% | 1,556 | 2.9% |
[ 40.0% - 40.5% ] 40.43% | 235 | 1.3% |