Immigrants from Honduras Disability Age Under 5

COMPARE

Immigrants from Honduras
Race
Ancestry
AfghanAfricanAlaska NativeAlaskan AthabascanAlbanianAleutAlsatianAmericanApacheArabArapahoArgentineanArmenianAssyrian/Chaldean/SyriacAustralianAustrianBahamianBangladeshiBarbadianBasqueBelgianBelizeanBermudanBhutaneseBlackfeetBolivianBrazilianBritishBritish West IndianBulgarianBurmeseCajunCambodianCanadianCape VerdeanCarpatho RusynCelticCentral AmericanCentral American IndianCherokeeCheyenneChickasawChileanChineseChippewaChoctawColombianColvilleComancheCosta RicanCreeCreekCroatianCrowCubanCypriotCzechCzechoslovakianDanishDelawareDominicanDutchDutch West IndianEastern EuropeanEcuadorianEgyptianEnglishEstonianEthiopianEuropeanFijianFilipinoFinnishFrenchFrench American IndianFrench CanadianGermanGerman RussianGhanaianGreekGuamanian/ChamorroGuatemalanGuyaneseHaitianHmongHonduranHopiHoumaHungarianIcelanderIndian (Asian)IndonesianInupiatIranianIraqiIrishIroquoisIsraeliItalianJamaicanJapaneseJordanianKenyanKiowaKoreanLaotianLatvianLebaneseLiberianLithuanianLumbeeLuxembourgerMacedonianMalaysianMalteseMarshalleseMenomineeMexicanMexican American IndianMongolianMoroccanNative HawaiianNavajoNepaleseNew ZealanderNicaraguanNigerianNorthern EuropeanNorwegianOkinawanOsageOttawaPaiutePakistaniPalestinianPanamanianParaguayanPennsylvania GermanPeruvianPimaPolishPortuguesePotawatomiPuebloPuerto RicanPuget Sound SalishRomanianRussianSalvadoranSamoanScandinavianScotch-IrishScottishSeminoleSenegaleseSerbianShoshoneSierra LeoneanSiouxSlavicSlovakSloveneSomaliSouth AfricanSouth AmericanSouth American IndianSoviet UnionSpaniardSpanishSpanish AmericanSpanish American IndianSri LankanSubsaharan AfricanSudaneseSwedishSwissSyrianTaiwaneseThaiTlingit-HaidaTohono O'OdhamTonganTrinidadian and TobagonianTsimshianTurkishU.S. Virgin IslanderUgandanUkrainianUruguayanUteVenezuelanVietnameseWelshWest IndianYakamaYaquiYugoslavianYumanYup'ikZimbabwean
Immigration
NonimmigrantsImmigrantsAfghanistanAfricaAlbaniaArgentinaArmeniaAsiaAustraliaAustriaBahamasBangladeshBarbadosBelarusBelgiumBelizeBoliviaBosnia and HerzegovinaBrazilBulgariaBurma/MyanmarCabo VerdeCambodiaCameroonCanadaCaribbeanCentral AmericaChileChinaColombiaCongoCosta RicaCroatiaCubaCzechoslovakiaDenmarkDominicaDominican RepublicEastern AfricaEastern AsiaEastern EuropeEcuadorEgyptEl SalvadorEnglandEritreaEthiopiaEuropeFijiFranceGermanyGhanaGreeceGrenadaGuatemalaGuyanaHaitiHondurasHong KongHungaryIndiaIndonesiaIranIraqIrelandIsraelItalyJamaicaJapanJordanKazakhstanKenyaKoreaKuwaitLaosLatin AmericaLatviaLebanonLiberiaLithuaniaMalaysiaMexicoMicronesiaMiddle AfricaMoldovaMoroccoNepalNetherlandsNicaraguaNigeriaNorth AmericaNorth MacedoniaNorthern AfricaNorthern EuropeNorwayOceaniaPakistanPanamaPeruPhilippinesPolandPortugalRomaniaRussiaSaudi ArabiaScotlandSenegalSerbiaSierra LeoneSingaporeSomaliaSouth AfricaSouth AmericaSouth Central AsiaSouth Eastern AsiaSouthern EuropeSpainSri LankaSt. Vincent and the GrenadinesSudanSwedenSwitzerlandSyriaTaiwanThailandTrinidad and TobagoTurkeyUgandaUkraineUruguayUzbekistanVenezuelaVietnamWest IndiesWestern AfricaWestern AsiaWestern EuropeYemenZaireZimbabweAzores
Select to Compare
Race
Ancestry
AfghanAfricanAlaska NativeAlaskan AthabascanAlbanianAleutAlsatianAmericanApacheArabArapahoArgentineanArmenianAssyrian/Chaldean/SyriacAustralianAustrianBahamianBangladeshiBarbadianBasqueBelgianBelizeanBermudanBhutaneseBlackfeetBolivianBrazilianBritishBritish West IndianBulgarianBurmeseCajunCambodianCanadianCape VerdeanCarpatho RusynCelticCentral AmericanCentral American IndianCherokeeCheyenneChickasawChileanChineseChippewaChoctawColombianColvilleComancheCosta RicanCreeCreekCroatianCrowCubanCypriotCzechCzechoslovakianDanishDelawareDominicanDutchDutch West IndianEastern EuropeanEcuadorianEgyptianEnglishEstonianEthiopianEuropeanFijianFilipinoFinnishFrenchFrench American IndianFrench CanadianGermanGerman RussianGhanaianGreekGuamanian/ChamorroGuatemalanGuyaneseHaitianHmongHonduranHopiHoumaHungarianIcelanderIndian (Asian)IndonesianInupiatIranianIraqiIrishIroquoisIsraeliItalianJamaicanJapaneseJordanianKenyanKiowaKoreanLaotianLatvianLebaneseLiberianLithuanianLumbeeLuxembourgerMacedonianMalaysianMalteseMarshalleseMenomineeMexicanMexican American IndianMongolianMoroccanNative HawaiianNavajoNepaleseNew ZealanderNicaraguanNigerianNorthern EuropeanNorwegianOkinawanOsageOttawaPaiutePakistaniPalestinianPanamanianParaguayanPennsylvania GermanPeruvianPimaPolishPortuguesePotawatomiPuebloPuerto RicanPuget Sound SalishRomanianRussianSalvadoranSamoanScandinavianScotch-IrishScottishSeminoleSenegaleseSerbianShoshoneSierra LeoneanSiouxSlavicSlovakSloveneSomaliSouth AfricanSouth AmericanSouth American IndianSoviet UnionSpaniardSpanishSpanish AmericanSpanish American IndianSri LankanSubsaharan AfricanSudaneseSwedishSwissSyrianTaiwaneseThaiTlingit-HaidaTohono O'OdhamTonganTrinidadian and TobagonianTsimshianTurkishU.S. Virgin IslanderUgandanUkrainianUruguayanUteVenezuelanVietnameseWelshWest IndianYakamaYaquiYugoslavianYumanYup'ikZimbabwean
Immigration
NonimmigrantsImmigrantsAfghanistanAfricaAlbaniaArgentinaArmeniaAsiaAustraliaAustriaBahamasBangladeshBarbadosBelarusBelgiumBelizeBoliviaBosnia and HerzegovinaBrazilBulgariaBurma/MyanmarCabo VerdeCambodiaCameroonCanadaCaribbeanCentral AmericaChileChinaColombiaCongoCosta RicaCroatiaCubaCzechoslovakiaDenmarkDominicaDominican RepublicEastern AfricaEastern AsiaEastern EuropeEcuadorEgyptEl SalvadorEnglandEritreaEthiopiaEuropeFijiFranceGermanyGhanaGreeceGrenadaGuatemalaGuyanaHaitiHong KongHungaryIndiaIndonesiaIranIraqIrelandIsraelItalyJamaicaJapanJordanKazakhstanKenyaKoreaKuwaitLaosLatin AmericaLatviaLebanonLiberiaLithuaniaMalaysiaMexicoMicronesiaMiddle AfricaMoldovaMoroccoNepalNetherlandsNicaraguaNigeriaNorth AmericaNorth MacedoniaNorthern AfricaNorthern EuropeNorwayOceaniaPakistanPanamaPeruPhilippinesPolandPortugalRomaniaRussiaSaudi ArabiaScotlandSenegalSerbiaSierra LeoneSingaporeSomaliaSouth AfricaSouth AmericaSouth Central AsiaSouth Eastern AsiaSouthern EuropeSpainSri LankaSt. Vincent and the GrenadinesSudanSwedenSwitzerlandSyriaTaiwanThailandTrinidad and TobagoTurkeyUgandaUkraineUruguayUzbekistanVenezuelaVietnamWest IndiesWestern AfricaWestern AsiaWestern EuropeYemenZaireZimbabweAzores
Disability Age Under 5
Income
Poverty
Unemployment
Labor Participation
Family Structure
Vehicle Availability
Education Level
Disability

Immigrants from Honduras Disability Age Under 5
Excellent

1.2%
DISABILITY | AGE UNDER 5
80.4/ 100
METRIC RATING
141st/ 347
METRIC RANK

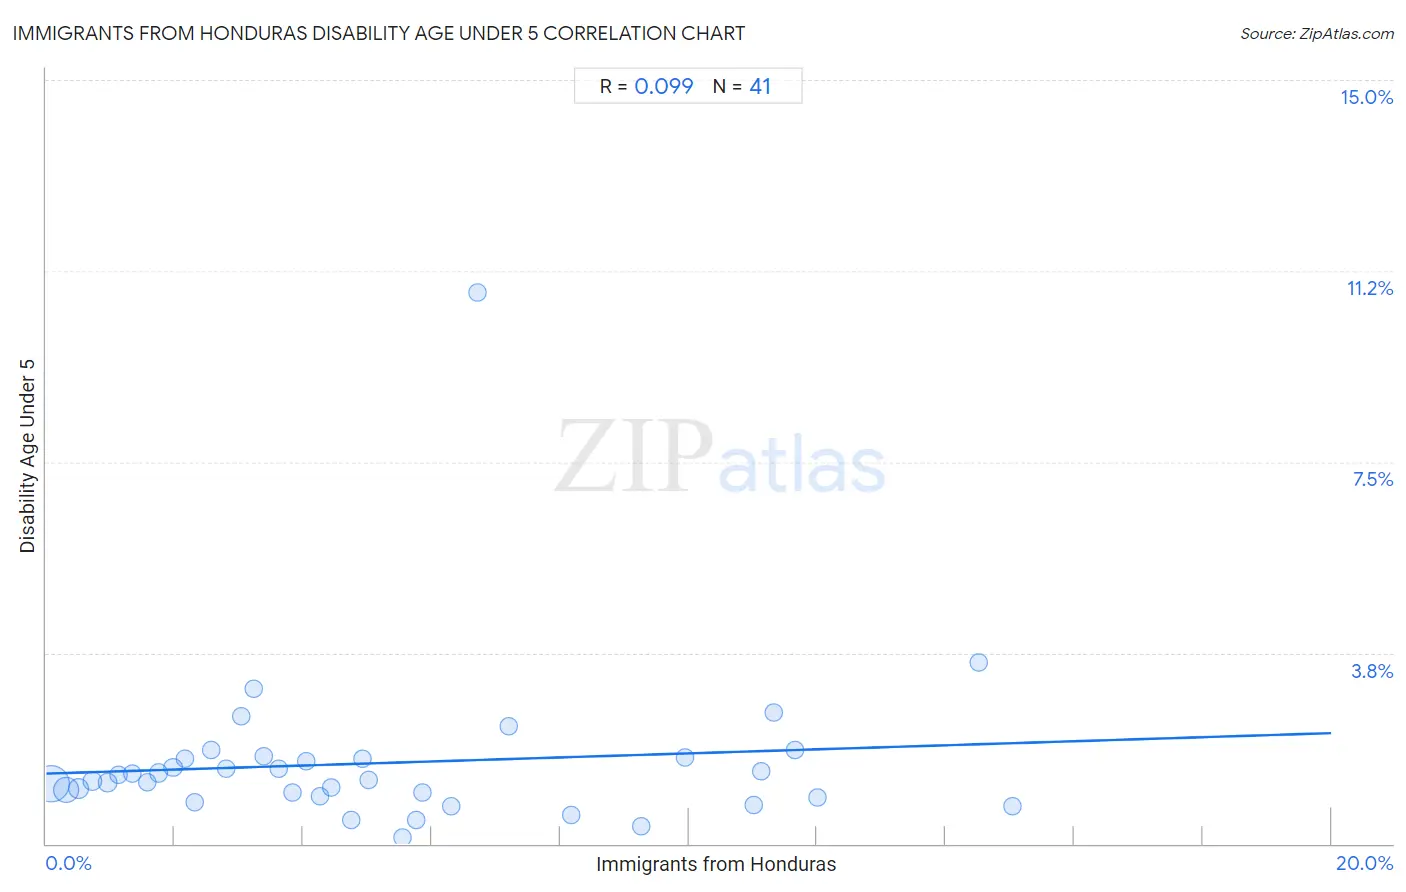
Immigrants from Honduras Disability Age Under 5 Correlation Chart

The statistical analysis conducted on geographies consisting of 190,855,678 people shows a slight positive correlation between the proportion of Immigrants from Honduras and percentage of population with a disability under the age of 5 in the United States with a correlation coefficient (R) of 0.099 and weighted average of 1.2%. On average, for every 1% (one percent) increase in Immigrants from Honduras within a typical geography, there is an increase of 0.040% in percentage of population with a disability under the age of 5.
Immigrants from Honduras Disability Age Under 5
It is essential to understand that the correlation between the percentage of Immigrants from Honduras and percentage of population with a disability under the age of 5 does not imply a direct cause-and-effect relationship. It remains uncertain whether the presence of Immigrants from Honduras influences an upward or downward trend in the level of percentage of population with a disability under the age of 5 within an area, or if Immigrants from Honduras simply ended up residing in those areas with higher or lower levels of percentage of population with a disability under the age of 5 due to other factors.

Demographics Similar to Immigrants from Honduras by Disability Age Under 5

In terms of disability age under 5, the demographic groups most similar to Immigrants from Honduras are Somali (1.2%, a difference of 0.060%), New Zealander (1.2%, a difference of 0.15%), Immigrants from Colombia (1.2%, a difference of 0.15%), Alsatian (1.2%, a difference of 0.16%), and Immigrants from Middle Africa (1.2%, a difference of 0.16%).
DemographicsRating | RankDisability Age Under 5
Argentineans
85.7
/100
|
#134
Excellent
1.2%
Fijians
84.7
/100
|
#135
Excellent
1.2%
Moroccans
83.6
/100
|
#136
Excellent
1.2%
Immigrants from Eastern Africa
83.1
/100
|
#137
Excellent
1.2%
Immigrants from Czechoslovakia
82.8
/100
|
#138
Excellent
1.2%
New Zealanders
81.4
/100
|
#139
Excellent
1.2%
Somalis
80.8
/100
|
#140
Excellent
1.2%
Immigrants from Honduras
80.4
/100
|
#141
Excellent
1.2%
Immigrants from Colombia
79.3
/100
|
#142
Good
1.2%
Alsatians
79.3
/100
|
#143
Good
1.2%
Immigrants from Middle Africa
79.3
/100
|
#144
Good
1.2%
Immigrants from Zimbabwe
77.9
/100
|
#145
Good
1.2%
Samoans
77.7
/100
|
#146
Good
1.2%
Icelanders
76.3
/100
|
#147
Good
1.2%
Ghanaians
76.3
/100
|
#148
Good
1.2%

Immigrants from Honduras Disability Age Under 5 Correlation Summary

MeasurementImmigrants from Honduras DataDisability Age Under 5 Data
Minimum0.084%0.13%
Maximum15.0%10.8%
Range14.9%10.7%
Mean5.3%1.6%
Median4.3%1.3%
Interquartile 25% (IQ1)2.1%0.93%
Interquartile 75% (IQ3)7.7%1.7%
Interquartile Range (IQR)5.6%0.76%
Standard Deviation (Sample)4.1%1.6%
Standard Deviation (Population)4.0%1.6%

Correlation Details

Immigrants from Honduras PercentileSample SizeDisability Age Under 5
[
0.0%
-
0.5%
]
0.084%
102,891,6071.2%
[
0.0%
-
0.5%
]
0.31%
42,257,1621.0%
[
0.5%
-
1.0%
]
0.50%
15,728,8991.1%
[
0.5%
-
1.0%
]
0.72%
8,495,2661.2%
[
0.5%
-
1.0%
]
0.95%
5,645,4901.2%
[
1.0%
-
1.5%
]
1.13%
2,393,1401.4%
[
1.0%
-
1.5%
]
1.34%
1,970,1681.4%
[
1.5%
-
2.0%
]
1.57%
2,446,6921.2%
[
1.5%
-
2.0%
]
1.75%
1,652,2181.4%
[
1.5%
-
2.0%
]
1.97%
565,0151.5%
[
2.0%
-
2.5%
]
2.15%
662,3581.7%
[
2.0%
-
2.5%
]
2.31%
2,801,5830.81%
[
2.5%
-
3.0%
]
2.56%
420,7401.9%
[
2.5%
-
3.0%
]
2.80%
668,5891.5%
[
3.0%
-
3.5%
]
3.04%
201,0462.5%
[
3.0%
-
3.5%
]
3.22%
64,2363.1%
[
3.0%
-
3.5%
]
3.38%
28,2411.7%
[
3.5%
-
4.0%
]
3.62%
249,7641.5%
[
3.5%
-
4.0%
]
3.84%
73,0861.0%
[
4.0%
-
4.5%
]
4.05%
101,2761.6%
[
4.0%
-
4.5%
]
4.26%
109,0800.94%
[
4.0%
-
4.5%
]
4.43%
123,7191.1%
[
4.5%
-
5.0%
]
4.74%
43,3620.45%
[
4.5%
-
5.0%
]
4.92%
40,1341.7%
[
5.0%
-
5.5%
]
5.01%
469,5451.3%
[
5.5%
-
6.0%
]
5.54%
98,8260.13%
[
5.5%
-
6.0%
]
5.76%
172,3840.47%
[
5.5%
-
6.0%
]
5.86%
81,1641.0%
[
6.0%
-
6.5%
]
6.30%
34,2990.74%
[
6.5%
-
7.0%
]
6.71%
12,49210.8%
[
7.0%
-
7.5%
]
7.21%
31,2962.3%
[
8.0%
-
8.5%
]
8.16%
42,6270.57%
[
9.0%
-
9.5%
]
9.27%
52,3600.34%
[
9.5%
-
10.0%
]
9.95%
46,2661.7%
[
11.0%
-
11.5%
]
11.01%
8,7500.77%
[
11.0%
-
11.5%
]
11.13%
66,3261.4%
[
11.0%
-
11.5%
]
11.32%
59,1212.6%
[
11.5%
-
12.0%
]
11.66%
16,7431.8%
[
12.0%
-
12.5%
]
12.01%
26,1050.91%
[
14.5%
-
15.0%
]
14.51%
9443.6%
[
15.0%
-
15.5%
]
15.03%
3,5590.74%