Immigrants from Honduras Married-couple Households
COMPARE
Immigrants from Honduras
Select to Compare
Married-couple Households
Immigrants from Honduras Married-couple Households
41.6%
MARRIED-COUPLE HOUSEHOLDS
0.0/ 100
METRIC RATING
302nd/ 347
METRIC RANK
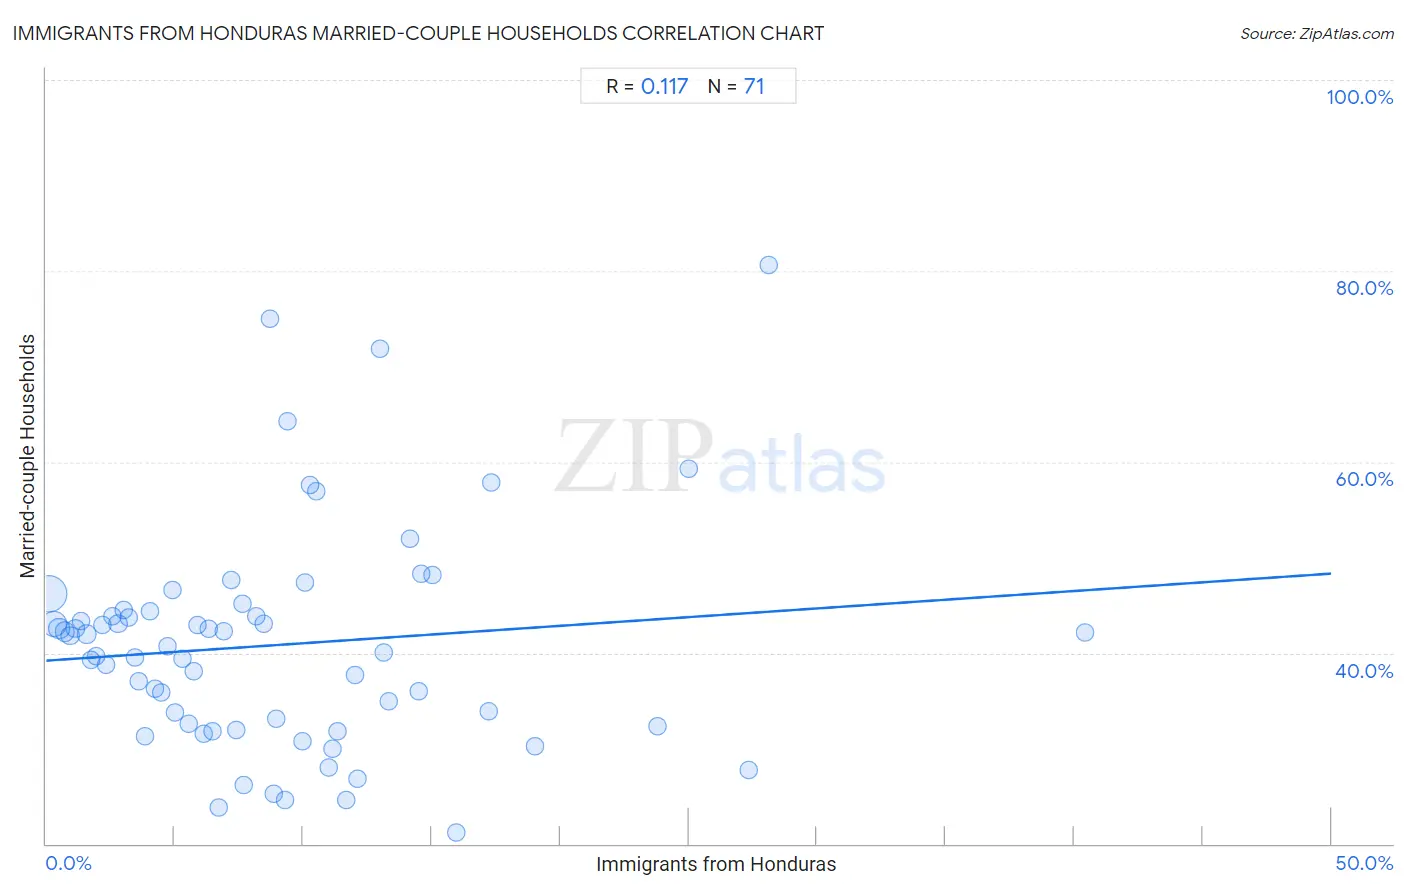
Immigrants from Honduras Married-couple Households Correlation Chart
The statistical analysis conducted on geographies consisting of 322,465,433 people shows a poor positive correlation between the proportion of Immigrants from Honduras and percentage of married-couple family households in the United States with a correlation coefficient (R) of 0.117 and weighted average of 41.6%. On average, for every 1% (one percent) increase in Immigrants from Honduras within a typical geography, there is an increase of 0.18% in percentage of married-couple family households.
It is essential to understand that the correlation between the percentage of Immigrants from Honduras and percentage of married-couple family households does not imply a direct cause-and-effect relationship. It remains uncertain whether the presence of Immigrants from Honduras influences an upward or downward trend in the level of percentage of married-couple family households within an area, or if Immigrants from Honduras simply ended up residing in those areas with higher or lower levels of percentage of married-couple family households due to other factors.
Demographics Similar to Immigrants from Honduras by Married-couple Households
In terms of married-couple households, the demographic groups most similar to Immigrants from Honduras are Subsaharan African (41.6%, a difference of 0.0%), Immigrants from Guyana (41.6%, a difference of 0.12%), Immigrants from Bahamas (41.7%, a difference of 0.17%), Sioux (41.5%, a difference of 0.23%), and Immigrants from Belize (41.8%, a difference of 0.38%).
| Demographics | Rating | Rank | Married-couple Households |
| Kiowa | 0.0 /100 | #295 | Tragic 42.0% |
| Immigrants from Sudan | 0.0 /100 | #296 | Tragic 41.9% |
| Arapaho | 0.0 /100 | #297 | Tragic 41.8% |
| Immigrants from Middle Africa | 0.0 /100 | #298 | Tragic 41.8% |
| Immigrants from Ghana | 0.0 /100 | #299 | Tragic 41.8% |
| Immigrants from Belize | 0.0 /100 | #300 | Tragic 41.8% |
| Immigrants from Bahamas | 0.0 /100 | #301 | Tragic 41.7% |
| Immigrants from Honduras | 0.0 /100 | #302 | Tragic 41.6% |
| Sub-Saharan Africans | 0.0 /100 | #303 | Tragic 41.6% |
| Immigrants from Guyana | 0.0 /100 | #304 | Tragic 41.6% |
| Sioux | 0.0 /100 | #305 | Tragic 41.5% |
| Guyanese | 0.0 /100 | #306 | Tragic 41.4% |
| Immigrants from Western Africa | 0.0 /100 | #307 | Tragic 41.4% |
| Crow | 0.0 /100 | #308 | Tragic 41.4% |
| Immigrants from Trinidad and Tobago | 0.0 /100 | #309 | Tragic 41.2% |
Immigrants from Honduras Married-couple Households Correlation Summary
| Measurement | Immigrants from Honduras Data | Married-couple Households Data |
| Minimum | 0.086% | 21.2% |
| Maximum | 40.4% | 80.6% |
| Range | 40.3% | 59.5% |
| Mean | 8.9% | 40.8% |
| Median | 7.4% | 40.7% |
| Interquartile 25% (IQ1) | 3.6% | 32.3% |
| Interquartile 75% (IQ3) | 12.0% | 44.4% |
| Interquartile Range (IQR) | 8.4% | 12.1% |
| Standard Deviation (Sample) | 7.4% | 11.5% |
| Standard Deviation (Population) | 7.4% | 11.5% |
Correlation Details
| Immigrants from Honduras Percentile | Sample Size | Married-couple Households |
[ 0.0% - 0.5% ] 0.086% | 174,926,546 | 46.2% |
[ 0.0% - 0.5% ] 0.31% | 65,971,016 | 43.0% |
[ 0.5% - 1.0% ] 0.50% | 27,116,489 | 42.5% |
[ 0.5% - 1.0% ] 0.72% | 15,547,781 | 42.2% |
[ 0.5% - 1.0% ] 0.94% | 9,518,646 | 41.8% |
[ 1.0% - 1.5% ] 1.13% | 4,934,009 | 42.5% |
[ 1.0% - 1.5% ] 1.34% | 4,183,096 | 43.4% |
[ 1.5% - 2.0% ] 1.57% | 3,910,016 | 42.0% |
[ 1.5% - 2.0% ] 1.76% | 2,988,982 | 39.3% |
[ 1.5% - 2.0% ] 1.96% | 1,717,295 | 39.6% |
[ 2.0% - 2.5% ] 2.17% | 1,311,760 | 42.9% |
[ 2.0% - 2.5% ] 2.32% | 3,453,831 | 38.7% |
[ 2.5% - 3.0% ] 2.57% | 1,122,288 | 43.9% |
[ 2.5% - 3.0% ] 2.79% | 1,265,643 | 43.1% |
[ 3.0% - 3.5% ] 3.02% | 412,261 | 44.4% |
[ 3.0% - 3.5% ] 3.22% | 310,136 | 43.7% |
[ 3.0% - 3.5% ] 3.45% | 189,947 | 39.5% |
[ 3.5% - 4.0% ] 3.60% | 463,143 | 37.0% |
[ 3.5% - 4.0% ] 3.87% | 224,141 | 31.3% |
[ 4.0% - 4.5% ] 4.04% | 269,160 | 44.4% |
[ 4.0% - 4.5% ] 4.24% | 350,968 | 36.3% |
[ 4.0% - 4.5% ] 4.45% | 237,632 | 35.9% |
[ 4.5% - 5.0% ] 4.72% | 58,406 | 40.7% |
[ 4.5% - 5.0% ] 4.89% | 124,604 | 46.6% |
[ 5.0% - 5.5% ] 5.02% | 553,716 | 33.7% |
[ 5.0% - 5.5% ] 5.29% | 61,588 | 39.4% |
[ 5.5% - 6.0% ] 5.52% | 136,073 | 32.6% |
[ 5.5% - 6.0% ] 5.76% | 197,284 | 38.0% |
[ 5.5% - 6.0% ] 5.86% | 133,304 | 43.0% |
[ 6.0% - 6.5% ] 6.11% | 38,581 | 31.5% |
[ 6.0% - 6.5% ] 6.30% | 54,266 | 42.6% |
[ 6.0% - 6.5% ] 6.48% | 76,752 | 31.8% |
[ 6.5% - 7.0% ] 6.71% | 13,007 | 23.8% |
[ 6.5% - 7.0% ] 6.93% | 2,453 | 42.3% |
[ 7.0% - 7.5% ] 7.20% | 32,233 | 47.7% |
[ 7.0% - 7.5% ] 7.38% | 46,418 | 31.9% |
[ 7.5% - 8.0% ] 7.63% | 2,410 | 45.2% |
[ 7.5% - 8.0% ] 7.71% | 33,614 | 26.2% |
[ 8.0% - 8.5% ] 8.17% | 45,475 | 43.9% |
[ 8.0% - 8.5% ] 8.48% | 38,342 | 43.0% |
[ 8.5% - 9.0% ] 8.70% | 161 | 75.0% |
[ 8.5% - 9.0% ] 8.87% | 46,203 | 25.2% |
[ 8.5% - 9.0% ] 8.95% | 20,266 | 33.2% |
[ 9.0% - 9.5% ] 9.27% | 52,511 | 24.5% |
[ 9.0% - 9.5% ] 9.37% | 896 | 64.3% |
[ 9.5% - 10.0% ] 9.95% | 46,418 | 30.7% |
[ 10.0% - 10.5% ] 10.09% | 2,547 | 47.4% |
[ 10.0% - 10.5% ] 10.28% | 8,071 | 57.6% |
[ 10.5% - 11.0% ] 10.53% | 304 | 57.0% |
[ 11.0% - 11.5% ] 11.01% | 8,750 | 28.0% |
[ 11.0% - 11.5% ] 11.13% | 66,326 | 29.9% |
[ 11.0% - 11.5% ] 11.32% | 59,121 | 31.8% |
[ 11.5% - 12.0% ] 11.66% | 16,971 | 24.6% |
[ 12.0% - 12.5% ] 12.01% | 26,105 | 37.6% |
[ 12.0% - 12.5% ] 12.10% | 1,405 | 26.9% |
[ 12.5% - 13.0% ] 12.99% | 308 | 71.8% |
[ 13.0% - 13.5% ] 13.13% | 7,385 | 40.0% |
[ 13.0% - 13.5% ] 13.32% | 856 | 35.0% |
[ 14.0% - 14.5% ] 14.14% | 6,947 | 51.9% |
[ 14.5% - 15.0% ] 14.50% | 1,303 | 36.0% |
[ 14.5% - 15.0% ] 14.58% | 48 | 48.3% |
[ 15.0% - 15.5% ] 15.03% | 3,559 | 48.1% |
[ 15.5% - 16.0% ] 15.95% | 8,989 | 21.2% |
[ 17.0% - 17.5% ] 17.21% | 1,714 | 33.9% |
[ 17.0% - 17.5% ] 17.32% | 976 | 57.9% |
[ 18.5% - 19.0% ] 19.00% | 679 | 30.2% |
[ 23.5% - 24.0% ] 23.77% | 774 | 32.3% |
[ 25.0% - 25.5% ] 25.00% | 1,556 | 59.3% |
[ 27.0% - 27.5% ] 27.34% | 673 | 27.7% |
[ 28.0% - 28.5% ] 28.12% | 64 | 80.6% |
[ 40.0% - 40.5% ] 40.43% | 235 | 42.1% |