Ecuadorian vs Immigrants from Iraq Wage/Income Gap
COMPARE
Ecuadorian
Immigrants from Iraq
Wage/Income Gap
Wage/Income Gap Comparison
Ecuadorians
Immigrants from Iraq
22.9%
WAGE/INCOME GAP
99.9/ 100
METRIC RATING
76th/ 347
METRIC RANK
26.7%
WAGE/INCOME GAP
10.3/ 100
METRIC RATING
213th/ 347
METRIC RANK
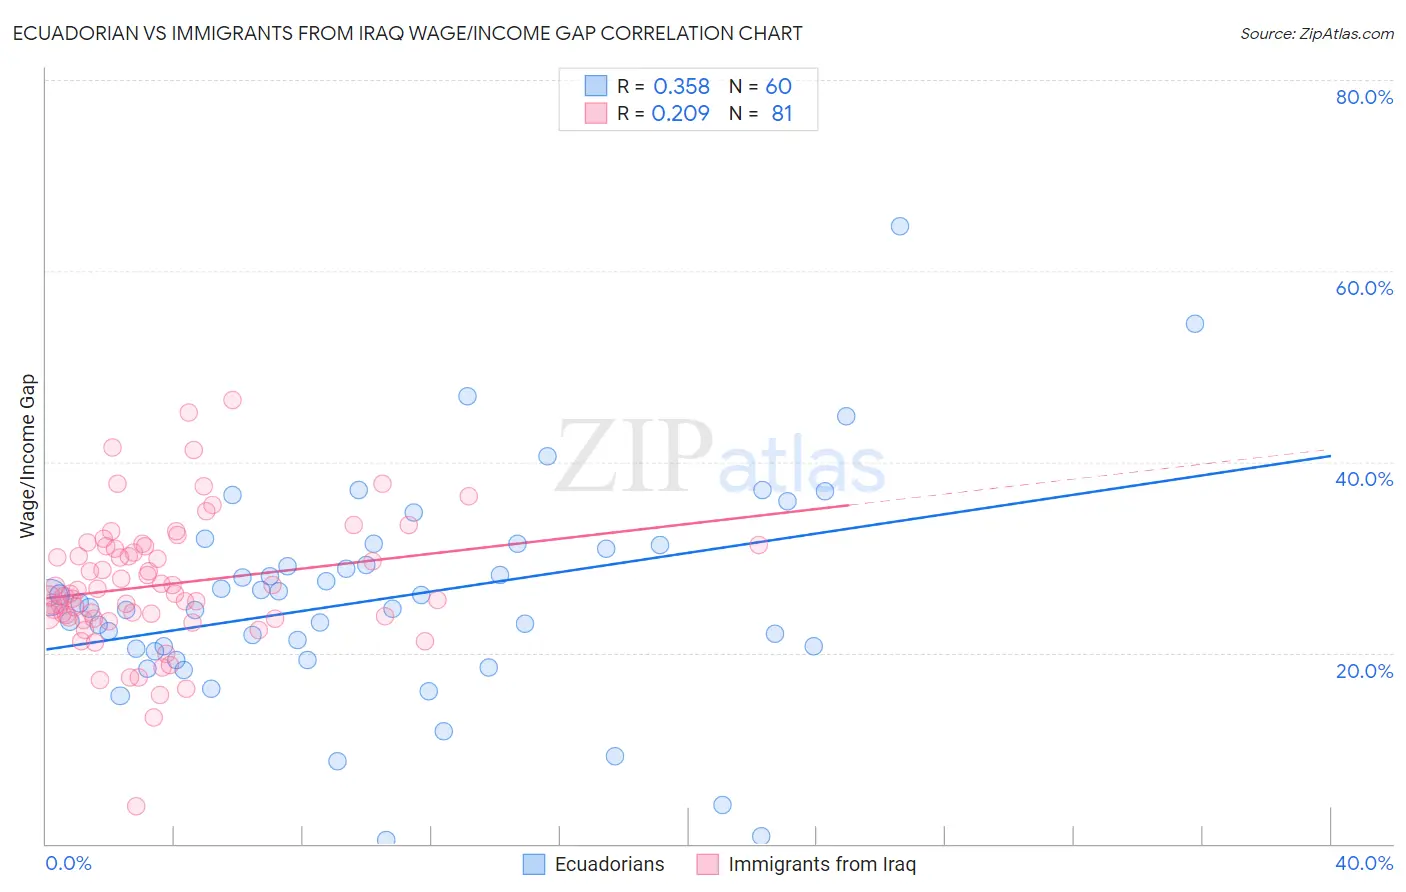
Ecuadorian vs Immigrants from Iraq Wage/Income Gap Correlation Chart
The statistical analysis conducted on geographies consisting of 317,709,562 people shows a mild positive correlation between the proportion of Ecuadorians and wage/income gap percentage in the United States with a correlation coefficient (R) of 0.358 and weighted average of 22.9%. Similarly, the statistical analysis conducted on geographies consisting of 194,737,327 people shows a weak positive correlation between the proportion of Immigrants from Iraq and wage/income gap percentage in the United States with a correlation coefficient (R) of 0.209 and weighted average of 26.7%, a difference of 16.4%.
Wage/Income Gap Correlation Summary
| Measurement | Ecuadorian | Immigrants from Iraq |
| Minimum | 0.44% | 3.9% |
| Maximum | 64.7% | 46.5% |
| Range | 64.2% | 42.6% |
| Mean | 25.7% | 27.1% |
| Median | 25.0% | 26.2% |
| Interquartile 25% (IQ1) | 20.3% | 23.7% |
| Interquartile 75% (IQ3) | 31.1% | 31.2% |
| Interquartile Range (IQR) | 10.8% | 7.5% |
| Standard Deviation (Sample) | 11.3% | 6.9% |
| Standard Deviation (Population) | 11.2% | 6.9% |
Similar Demographics by Wage/Income Gap
Demographics Similar to Ecuadorians by Wage/Income Gap
In terms of wage/income gap, the demographic groups most similar to Ecuadorians are Fijian (22.9%, a difference of 0.010%), African (22.9%, a difference of 0.13%), Nigerian (23.0%, a difference of 0.24%), Immigrants from Burma/Myanmar (22.8%, a difference of 0.30%), and Immigrants from Nicaragua (23.0%, a difference of 0.33%).
| Demographics | Rating | Rank | Wage/Income Gap |
| Indonesians | 99.9 /100 | #69 | Exceptional 22.7% |
| Immigrants | Uzbekistan | 99.9 /100 | #70 | Exceptional 22.7% |
| Immigrants | El Salvador | 99.9 /100 | #71 | Exceptional 22.8% |
| Sub-Saharan Africans | 99.9 /100 | #72 | Exceptional 22.8% |
| Immigrants | Eastern Africa | 99.9 /100 | #73 | Exceptional 22.8% |
| Immigrants | Burma/Myanmar | 99.9 /100 | #74 | Exceptional 22.8% |
| Fijians | 99.9 /100 | #75 | Exceptional 22.9% |
| Ecuadorians | 99.9 /100 | #76 | Exceptional 22.9% |
| Africans | 99.9 /100 | #77 | Exceptional 22.9% |
| Nigerians | 99.9 /100 | #78 | Exceptional 23.0% |
| Immigrants | Nicaragua | 99.9 /100 | #79 | Exceptional 23.0% |
| Salvadorans | 99.9 /100 | #80 | Exceptional 23.0% |
| Bermudans | 99.8 /100 | #81 | Exceptional 23.1% |
| Central Americans | 99.8 /100 | #82 | Exceptional 23.1% |
| Immigrants | Africa | 99.8 /100 | #83 | Exceptional 23.2% |
Demographics Similar to Immigrants from Iraq by Wage/Income Gap
In terms of wage/income gap, the demographic groups most similar to Immigrants from Iraq are Immigrants from China (26.7%, a difference of 0.010%), Yugoslavian (26.7%, a difference of 0.10%), Iraqi (26.6%, a difference of 0.15%), Immigrants from Portugal (26.7%, a difference of 0.15%), and Mongolian (26.6%, a difference of 0.18%).
| Demographics | Rating | Rank | Wage/Income Gap |
| Indians (Asian) | 16.5 /100 | #206 | Poor 26.4% |
| Immigrants | Italy | 15.8 /100 | #207 | Poor 26.5% |
| Egyptians | 12.7 /100 | #208 | Poor 26.6% |
| Immigrants | Kuwait | 12.6 /100 | #209 | Poor 26.6% |
| Arabs | 12.3 /100 | #210 | Poor 26.6% |
| Mongolians | 11.4 /100 | #211 | Poor 26.6% |
| Iraqis | 11.2 /100 | #212 | Poor 26.6% |
| Immigrants | Iraq | 10.3 /100 | #213 | Poor 26.7% |
| Immigrants | China | 10.3 /100 | #214 | Poor 26.7% |
| Yugoslavians | 9.7 /100 | #215 | Tragic 26.7% |
| Immigrants | Portugal | 9.5 /100 | #216 | Tragic 26.7% |
| Brazilians | 9.2 /100 | #217 | Tragic 26.7% |
| Immigrants | Saudi Arabia | 9.1 /100 | #218 | Tragic 26.7% |
| Immigrants | Poland | 8.9 /100 | #219 | Tragic 26.7% |
| Immigrants | Latvia | 8.9 /100 | #220 | Tragic 26.7% |