Ecuadorian Disability Age Under 5
COMPARE
Ecuadorian
Select to Compare
Disability Age Under 5
Ecuadorian Disability Age Under 5
1.1%
DISABILITY | AGE UNDER 5
99.5/ 100
METRIC RATING
56th/ 347
METRIC RANK
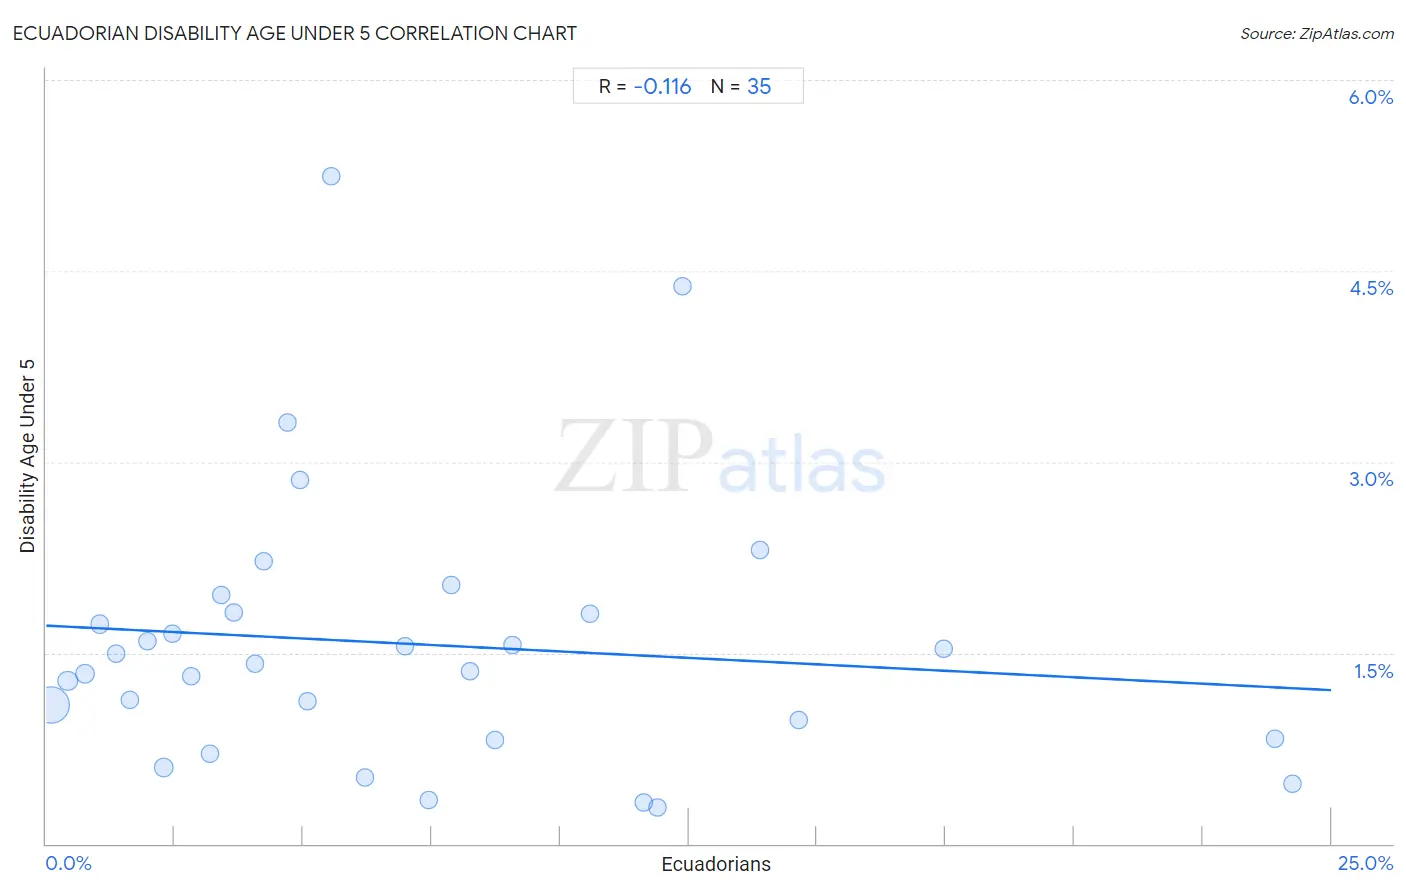
Ecuadorian Disability Age Under 5 Correlation Chart
The statistical analysis conducted on geographies consisting of 186,376,762 people shows a poor negative correlation between the proportion of Ecuadorians and percentage of population with a disability under the age of 5 in the United States with a correlation coefficient (R) of -0.116 and weighted average of 1.1%. On average, for every 1% (one percent) increase in Ecuadorians within a typical geography, there is a decrease of 0.020% in percentage of population with a disability under the age of 5.
It is essential to understand that the correlation between the percentage of Ecuadorians and percentage of population with a disability under the age of 5 does not imply a direct cause-and-effect relationship. It remains uncertain whether the presence of Ecuadorians influences an upward or downward trend in the level of percentage of population with a disability under the age of 5 within an area, or if Ecuadorians simply ended up residing in those areas with higher or lower levels of percentage of population with a disability under the age of 5 due to other factors.
Demographics Similar to Ecuadorians by Disability Age Under 5
In terms of disability age under 5, the demographic groups most similar to Ecuadorians are Assyrian/Chaldean/Syriac (1.1%, a difference of 0.030%), Immigrants from Egypt (1.1%, a difference of 0.22%), Immigrants from Malaysia (1.1%, a difference of 0.33%), Salvadoran (1.1%, a difference of 0.39%), and Immigrants from El Salvador (1.1%, a difference of 0.49%).
| Demographics | Rating | Rank | Disability Age Under 5 |
| Immigrants from Russia | 99.7 /100 | #49 | Exceptional 1.1% |
| Immigrants from Japan | 99.7 /100 | #50 | Exceptional 1.1% |
| Immigrants from Kazakhstan | 99.7 /100 | #51 | Exceptional 1.1% |
| Immigrants from Bolivia | 99.6 /100 | #52 | Exceptional 1.1% |
| Asians | 99.6 /100 | #53 | Exceptional 1.1% |
| Immigrants from El Salvador | 99.6 /100 | #54 | Exceptional 1.1% |
| Salvadorans | 99.5 /100 | #55 | Exceptional 1.1% |
| Ecuadorians | 99.5 /100 | #56 | Exceptional 1.1% |
| Assyrians/Chaldeans/Syriacs | 99.5 /100 | #57 | Exceptional 1.1% |
| Immigrants from Egypt | 99.4 /100 | #58 | Exceptional 1.1% |
| Immigrants from Malaysia | 99.4 /100 | #59 | Exceptional 1.1% |
| Immigrants from Western Asia | 99.2 /100 | #60 | Exceptional 1.1% |
| Immigrants from Ethiopia | 99.2 /100 | #61 | Exceptional 1.1% |
| Immigrants from Switzerland | 99.2 /100 | #62 | Exceptional 1.1% |
| Immigrants from Vietnam | 99.1 /100 | #63 | Exceptional 1.1% |
Ecuadorian Disability Age Under 5 Correlation Summary
| Measurement | Ecuadorian Data | Disability Age Under 5 Data |
| Minimum | 0.095% | 0.28% |
| Maximum | 24.2% | 5.2% |
| Range | 24.1% | 5.0% |
| Mean | 7.1% | 1.6% |
| Median | 5.1% | 1.4% |
| Interquartile 25% (IQ1) | 2.5% | 0.82% |
| Interquartile 75% (IQ3) | 10.6% | 1.8% |
| Interquartile Range (IQR) | 8.1% | 1.00% |
| Standard Deviation (Sample) | 6.1% | 1.1% |
| Standard Deviation (Population) | 6.0% | 1.1% |
Correlation Details
| Ecuadorian Percentile | Sample Size | Disability Age Under 5 |
[ 0.0% - 0.5% ] 0.095% | 141,732,537 | 1.1% |
[ 0.0% - 0.5% ] 0.42% | 15,181,861 | 1.3% |
[ 0.5% - 1.0% ] 0.75% | 9,377,332 | 1.3% |
[ 1.0% - 1.5% ] 1.04% | 3,084,094 | 1.7% |
[ 1.0% - 1.5% ] 1.36% | 1,505,189 | 1.5% |
[ 1.5% - 2.0% ] 1.62% | 1,831,053 | 1.1% |
[ 1.5% - 2.0% ] 1.98% | 520,332 | 1.6% |
[ 2.0% - 2.5% ] 2.30% | 9,522,625 | 0.60% |
[ 2.0% - 2.5% ] 2.46% | 837,461 | 1.6% |
[ 2.5% - 3.0% ] 2.81% | 468,566 | 1.3% |
[ 3.0% - 3.5% ] 3.18% | 407,724 | 0.71% |
[ 3.0% - 3.5% ] 3.41% | 210,961 | 2.0% |
[ 3.5% - 4.0% ] 3.65% | 85,084 | 1.8% |
[ 4.0% - 4.5% ] 4.05% | 116,024 | 1.4% |
[ 4.0% - 4.5% ] 4.24% | 73,238 | 2.2% |
[ 4.5% - 5.0% ] 4.69% | 78,906 | 3.3% |
[ 4.5% - 5.0% ] 4.94% | 13,506 | 2.9% |
[ 5.0% - 5.5% ] 5.08% | 105,450 | 1.1% |
[ 5.5% - 6.0% ] 5.56% | 2,682 | 5.2% |
[ 6.0% - 6.5% ] 6.19% | 70,863 | 0.52% |
[ 6.5% - 7.0% ] 6.98% | 26,322 | 1.5% |
[ 7.0% - 7.5% ] 7.45% | 64,203 | 0.35% |
[ 7.5% - 8.0% ] 7.88% | 41,090 | 2.0% |
[ 8.0% - 8.5% ] 8.25% | 11,765 | 1.4% |
[ 8.5% - 9.0% ] 8.72% | 307,355 | 0.82% |
[ 9.0% - 9.5% ] 9.08% | 27,794 | 1.6% |
[ 10.5% - 11.0% ] 10.58% | 91,516 | 1.8% |
[ 11.5% - 12.0% ] 11.62% | 102,618 | 0.33% |
[ 11.5% - 12.0% ] 11.89% | 105,521 | 0.28% |
[ 12.0% - 12.5% ] 12.37% | 100,539 | 4.4% |
[ 13.5% - 14.0% ] 13.89% | 50,802 | 2.3% |
[ 14.5% - 15.0% ] 14.65% | 41,907 | 0.97% |
[ 17.0% - 17.5% ] 17.45% | 10,396 | 1.5% |
[ 23.5% - 24.0% ] 23.90% | 112,750 | 0.82% |
[ 24.0% - 24.5% ] 24.24% | 56,696 | 0.48% |