African vs Dutch West Indian Wage/Income Gap
COMPARE
African
Dutch West Indian
Wage/Income Gap
Wage/Income Gap Comparison
Africans
Dutch West Indians
22.9%
WAGE/INCOME GAP
99.9/ 100
METRIC RATING
77th/ 347
METRIC RANK
26.3%
WAGE/INCOME GAP
21.0/ 100
METRIC RATING
199th/ 347
METRIC RANK
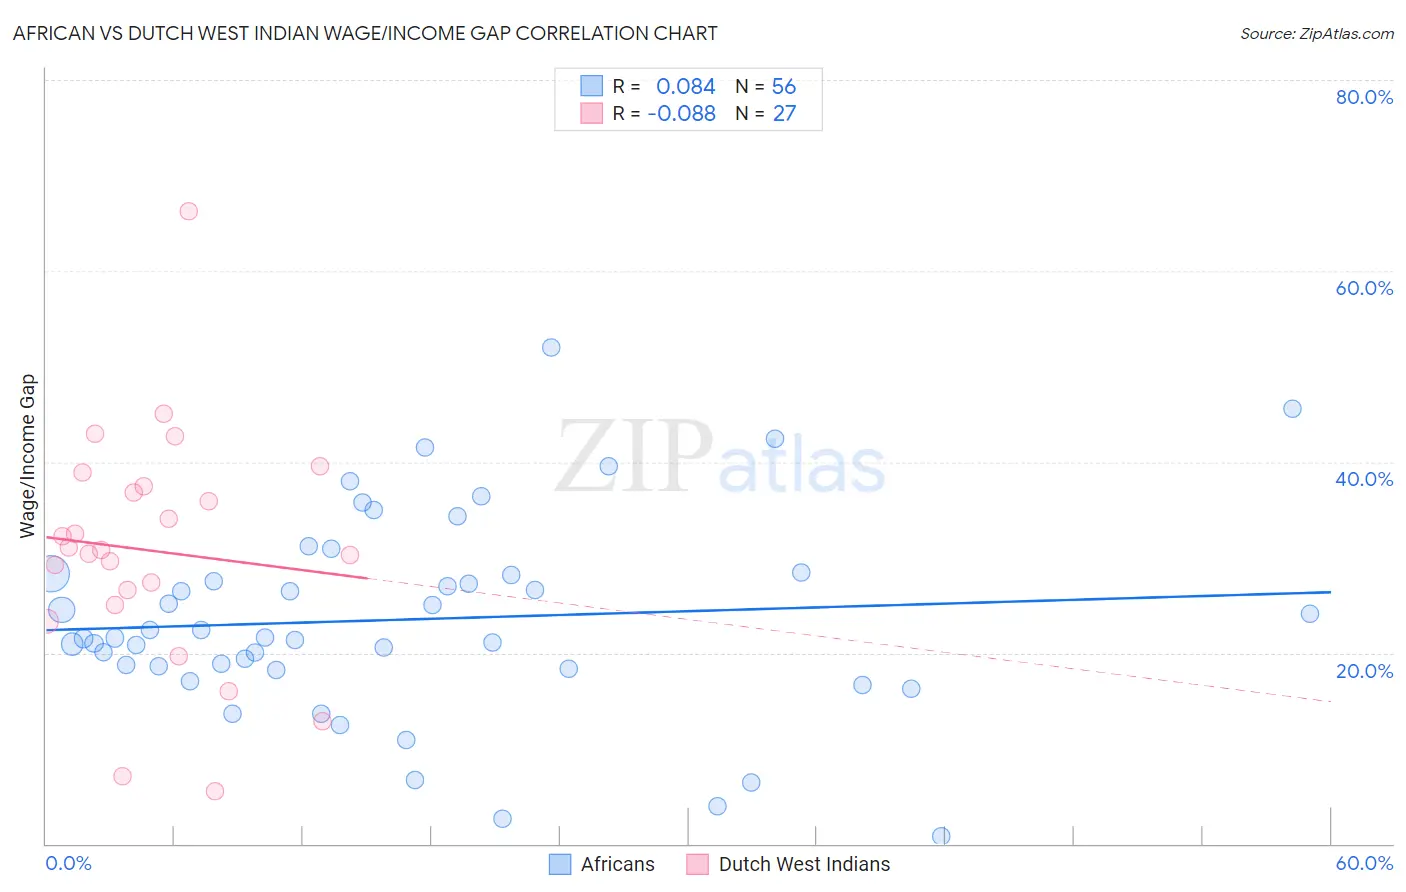
African vs Dutch West Indian Wage/Income Gap Correlation Chart
The statistical analysis conducted on geographies consisting of 469,416,254 people shows a slight positive correlation between the proportion of Africans and wage/income gap percentage in the United States with a correlation coefficient (R) of 0.084 and weighted average of 22.9%. Similarly, the statistical analysis conducted on geographies consisting of 85,715,273 people shows a slight negative correlation between the proportion of Dutch West Indians and wage/income gap percentage in the United States with a correlation coefficient (R) of -0.088 and weighted average of 26.3%, a difference of 14.7%.
Wage/Income Gap Correlation Summary
| Measurement | African | Dutch West Indian |
| Minimum | 0.79% | 5.5% |
| Maximum | 51.9% | 66.2% |
| Range | 51.2% | 60.8% |
| Mean | 23.5% | 30.7% |
| Median | 21.6% | 30.7% |
| Interquartile 25% (IQ1) | 18.4% | 25.1% |
| Interquartile 75% (IQ3) | 28.2% | 37.4% |
| Interquartile Range (IQR) | 9.7% | 12.3% |
| Standard Deviation (Sample) | 10.5% | 12.4% |
| Standard Deviation (Population) | 10.4% | 12.2% |
Similar Demographics by Wage/Income Gap
Demographics Similar to Africans by Wage/Income Gap
In terms of wage/income gap, the demographic groups most similar to Africans are Nigerian (23.0%, a difference of 0.11%), Ecuadorian (22.9%, a difference of 0.13%), Fijian (22.9%, a difference of 0.15%), Immigrants from Nicaragua (23.0%, a difference of 0.19%), and Salvadoran (23.0%, a difference of 0.26%).
| Demographics | Rating | Rank | Wage/Income Gap |
| Immigrants | Uzbekistan | 99.9 /100 | #70 | Exceptional 22.7% |
| Immigrants | El Salvador | 99.9 /100 | #71 | Exceptional 22.8% |
| Sub-Saharan Africans | 99.9 /100 | #72 | Exceptional 22.8% |
| Immigrants | Eastern Africa | 99.9 /100 | #73 | Exceptional 22.8% |
| Immigrants | Burma/Myanmar | 99.9 /100 | #74 | Exceptional 22.8% |
| Fijians | 99.9 /100 | #75 | Exceptional 22.9% |
| Ecuadorians | 99.9 /100 | #76 | Exceptional 22.9% |
| Africans | 99.9 /100 | #77 | Exceptional 22.9% |
| Nigerians | 99.9 /100 | #78 | Exceptional 23.0% |
| Immigrants | Nicaragua | 99.9 /100 | #79 | Exceptional 23.0% |
| Salvadorans | 99.9 /100 | #80 | Exceptional 23.0% |
| Bermudans | 99.8 /100 | #81 | Exceptional 23.1% |
| Central Americans | 99.8 /100 | #82 | Exceptional 23.1% |
| Immigrants | Africa | 99.8 /100 | #83 | Exceptional 23.2% |
| Cubans | 99.7 /100 | #84 | Exceptional 23.3% |
Demographics Similar to Dutch West Indians by Wage/Income Gap
In terms of wage/income gap, the demographic groups most similar to Dutch West Indians are Delaware (26.3%, a difference of 0.010%), Venezuelan (26.3%, a difference of 0.050%), Zimbabwean (26.3%, a difference of 0.060%), Immigrants from Western Asia (26.3%, a difference of 0.070%), and Immigrants from Malaysia (26.3%, a difference of 0.12%).
| Demographics | Rating | Rank | Wage/Income Gap |
| Immigrants | Bulgaria | 22.5 /100 | #192 | Fair 26.3% |
| Immigrants | Jordan | 22.4 /100 | #193 | Fair 26.3% |
| Chileans | 22.3 /100 | #194 | Fair 26.3% |
| Immigrants | Malaysia | 22.2 /100 | #195 | Fair 26.3% |
| Immigrants | Western Asia | 21.7 /100 | #196 | Fair 26.3% |
| Zimbabweans | 21.6 /100 | #197 | Fair 26.3% |
| Venezuelans | 21.5 /100 | #198 | Fair 26.3% |
| Dutch West Indians | 21.0 /100 | #199 | Fair 26.3% |
| Delaware | 20.9 /100 | #200 | Fair 26.3% |
| Immigrants | Syria | 19.3 /100 | #201 | Poor 26.4% |
| Laotians | 19.2 /100 | #202 | Poor 26.4% |
| Immigrants | Eastern Europe | 19.2 /100 | #203 | Poor 26.4% |
| Immigrants | Russia | 19.0 /100 | #204 | Poor 26.4% |
| Immigrants | Southern Europe | 17.3 /100 | #205 | Poor 26.4% |
| Indians (Asian) | 16.5 /100 | #206 | Poor 26.4% |