African vs Senegalese Wage/Income Gap
COMPARE
African
Senegalese
Wage/Income Gap
Wage/Income Gap Comparison
Africans
Senegalese
22.9%
WAGE/INCOME GAP
99.9/ 100
METRIC RATING
77th/ 347
METRIC RANK
20.7%
WAGE/INCOME GAP
100.0/ 100
METRIC RATING
25th/ 347
METRIC RANK
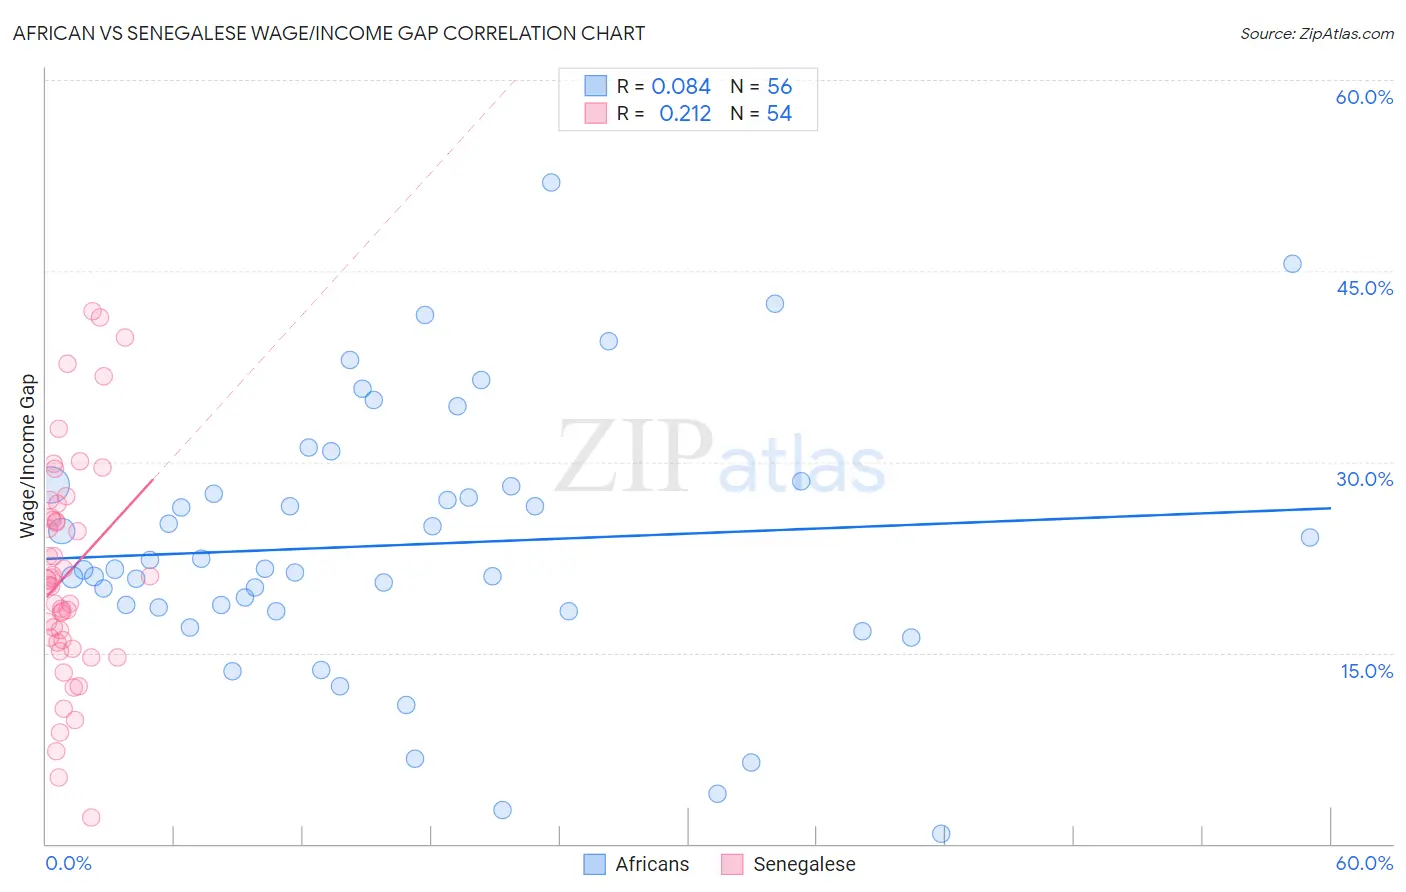
African vs Senegalese Wage/Income Gap Correlation Chart
The statistical analysis conducted on geographies consisting of 469,416,254 people shows a slight positive correlation between the proportion of Africans and wage/income gap percentage in the United States with a correlation coefficient (R) of 0.084 and weighted average of 22.9%. Similarly, the statistical analysis conducted on geographies consisting of 78,133,613 people shows a weak positive correlation between the proportion of Senegalese and wage/income gap percentage in the United States with a correlation coefficient (R) of 0.212 and weighted average of 20.7%, a difference of 11.1%.
Wage/Income Gap Correlation Summary
| Measurement | African | Senegalese |
| Minimum | 0.79% | 2.0% |
| Maximum | 51.9% | 41.8% |
| Range | 51.2% | 39.7% |
| Mean | 23.5% | 21.2% |
| Median | 21.6% | 20.5% |
| Interquartile 25% (IQ1) | 18.4% | 15.8% |
| Interquartile 75% (IQ3) | 28.2% | 25.6% |
| Interquartile Range (IQR) | 9.7% | 9.8% |
| Standard Deviation (Sample) | 10.5% | 8.8% |
| Standard Deviation (Population) | 10.4% | 8.7% |
Similar Demographics by Wage/Income Gap
Demographics Similar to Africans by Wage/Income Gap
In terms of wage/income gap, the demographic groups most similar to Africans are Nigerian (23.0%, a difference of 0.11%), Ecuadorian (22.9%, a difference of 0.13%), Fijian (22.9%, a difference of 0.15%), Immigrants from Nicaragua (23.0%, a difference of 0.19%), and Salvadoran (23.0%, a difference of 0.26%).
| Demographics | Rating | Rank | Wage/Income Gap |
| Immigrants | Uzbekistan | 99.9 /100 | #70 | Exceptional 22.7% |
| Immigrants | El Salvador | 99.9 /100 | #71 | Exceptional 22.8% |
| Sub-Saharan Africans | 99.9 /100 | #72 | Exceptional 22.8% |
| Immigrants | Eastern Africa | 99.9 /100 | #73 | Exceptional 22.8% |
| Immigrants | Burma/Myanmar | 99.9 /100 | #74 | Exceptional 22.8% |
| Fijians | 99.9 /100 | #75 | Exceptional 22.9% |
| Ecuadorians | 99.9 /100 | #76 | Exceptional 22.9% |
| Africans | 99.9 /100 | #77 | Exceptional 22.9% |
| Nigerians | 99.9 /100 | #78 | Exceptional 23.0% |
| Immigrants | Nicaragua | 99.9 /100 | #79 | Exceptional 23.0% |
| Salvadorans | 99.9 /100 | #80 | Exceptional 23.0% |
| Bermudans | 99.8 /100 | #81 | Exceptional 23.1% |
| Central Americans | 99.8 /100 | #82 | Exceptional 23.1% |
| Immigrants | Africa | 99.8 /100 | #83 | Exceptional 23.2% |
| Cubans | 99.7 /100 | #84 | Exceptional 23.3% |
Demographics Similar to Senegalese by Wage/Income Gap
In terms of wage/income gap, the demographic groups most similar to Senegalese are Pueblo (20.7%, a difference of 0.11%), Dominican (20.6%, a difference of 0.30%), Immigrants from Armenia (20.7%, a difference of 0.31%), Immigrants from Dominican Republic (20.6%, a difference of 0.47%), and Immigrants from Liberia (20.6%, a difference of 0.49%).
| Demographics | Rating | Rank | Wage/Income Gap |
| Hopi | 100.0 /100 | #18 | Exceptional 20.0% |
| Immigrants | Dominica | 100.0 /100 | #19 | Exceptional 20.0% |
| Bahamians | 100.0 /100 | #20 | Exceptional 20.2% |
| Immigrants | Caribbean | 100.0 /100 | #21 | Exceptional 20.4% |
| Immigrants | Liberia | 100.0 /100 | #22 | Exceptional 20.6% |
| Immigrants | Dominican Republic | 100.0 /100 | #23 | Exceptional 20.6% |
| Dominicans | 100.0 /100 | #24 | Exceptional 20.6% |
| Senegalese | 100.0 /100 | #25 | Exceptional 20.7% |
| Pueblo | 100.0 /100 | #26 | Exceptional 20.7% |
| Immigrants | Armenia | 100.0 /100 | #27 | Exceptional 20.7% |
| Inupiat | 100.0 /100 | #28 | Exceptional 20.8% |
| Immigrants | Senegal | 100.0 /100 | #29 | Exceptional 20.9% |
| Immigrants | Bangladesh | 100.0 /100 | #30 | Exceptional 20.9% |
| Vietnamese | 100.0 /100 | #31 | Exceptional 21.0% |
| Immigrants | Yemen | 100.0 /100 | #32 | Exceptional 21.1% |