Jackson Lake, CO Map & Demographics
Jackson Lake Map
Jackson Lake Overview
$31,487
PER CAPITA INCOME
$81,875
AVG FAMILY INCOME
$75,625
AVG HOUSEHOLD INCOME
35.0%
WAGE / INCOME GAP [ % ]
65.0¢/ $1
WAGE / INCOME GAP [ $ ]
0.43
INEQUALITY / GINI INDEX
165
TOTAL POPULATION
96
MALE POPULATION
69
FEMALE POPULATION
139.13
MALES / 100 FEMALES
71.88
FEMALES / 100 MALES
48.5
MEDIAN AGE
2.9
AVG FAMILY SIZE
2.3
AVG HOUSEHOLD SIZE
66
LABOR FORCE [ PEOPLE ]
45.8%
PERCENT IN LABOR FORCE
7.6%
UNEMPLOYMENT RATE
Income in Jackson Lake
Income Overview in Jackson Lake
Per Capita Income in Jackson Lake is $31,487, while median incomes of families and households are $81,875 and $75,625 respectively.
| Characteristic | Number | Measure |
| Per Capita Income | 165 | $31,487 |
| Median Family Income | 45 | $81,875 |
| Mean Family Income | 45 | $91,180 |
| Median Household Income | 71 | $75,625 |
| Mean Household Income | 71 | $75,431 |
| Income Deficit | 45 | $0 |
| Wage / Income Gap (%) | 165 | 34.96% |
| Wage / Income Gap ($) | 165 | 65.04¢ per $1 |
| Gini / Inequality Index | 165 | 0.43 |
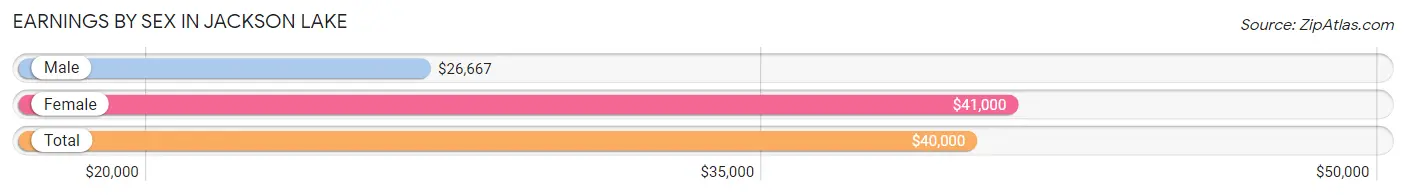
Earnings by Sex in Jackson Lake
Average Earnings in Jackson Lake are $40,000, $26,667 for men and $41,000 for women, a difference of 35.0%.
| Sex | Number | Average Earnings |
| Male | 40 (60.6%) | $26,667 |
| Female | 26 (39.4%) | $41,000 |
| Total | 66 (100.0%) | $40,000 |
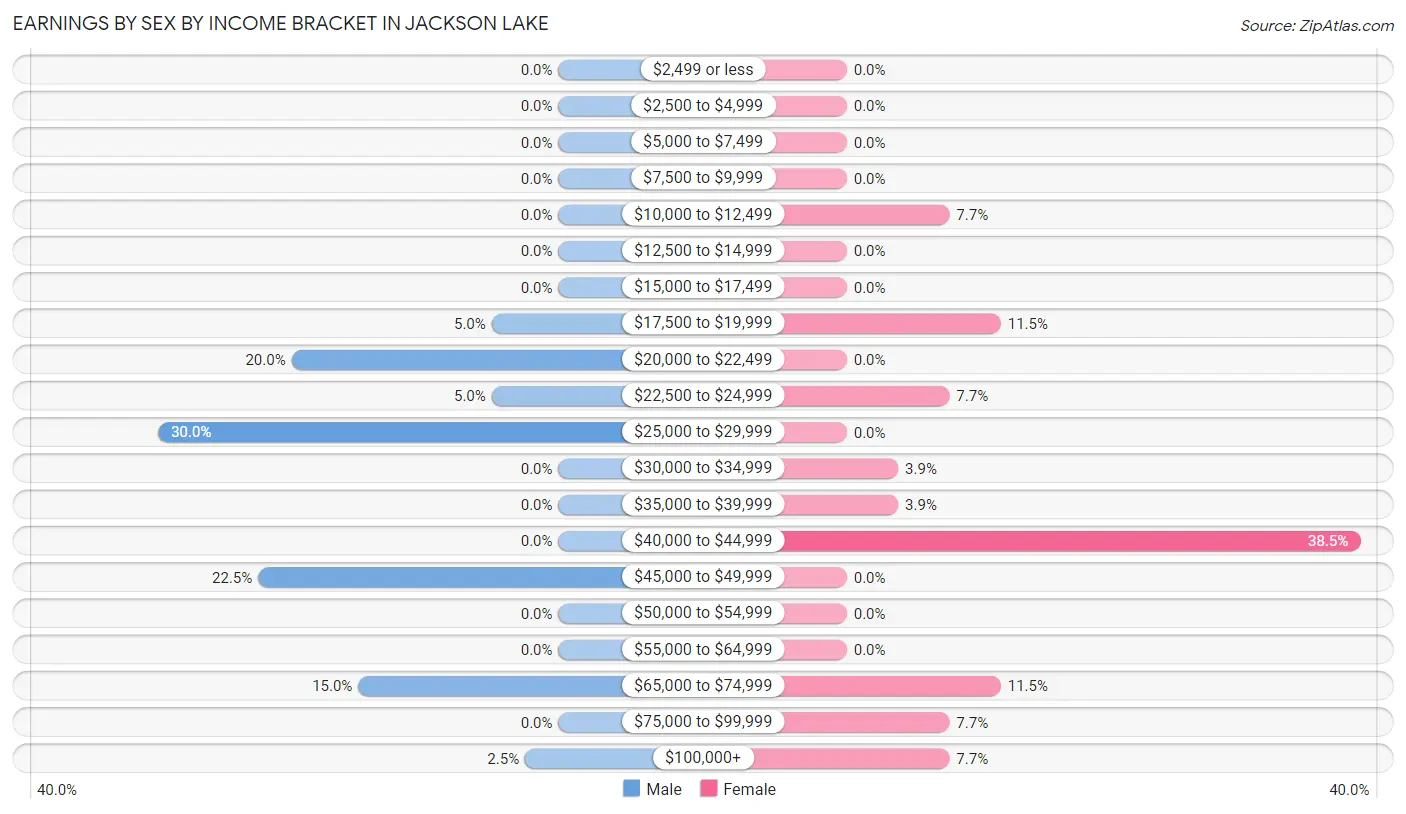
Earnings by Sex by Income Bracket in Jackson Lake
The most common earnings brackets in Jackson Lake are $25,000 to $29,999 for men (12 | 30.0%) and $40,000 to $44,999 for women (10 | 38.5%).
| Income | Male | Female |
| $2,499 or less | 0 (0.0%) | 0 (0.0%) |
| $2,500 to $4,999 | 0 (0.0%) | 0 (0.0%) |
| $5,000 to $7,499 | 0 (0.0%) | 0 (0.0%) |
| $7,500 to $9,999 | 0 (0.0%) | 0 (0.0%) |
| $10,000 to $12,499 | 0 (0.0%) | 2 (7.7%) |
| $12,500 to $14,999 | 0 (0.0%) | 0 (0.0%) |
| $15,000 to $17,499 | 0 (0.0%) | 0 (0.0%) |
| $17,500 to $19,999 | 2 (5.0%) | 3 (11.5%) |
| $20,000 to $22,499 | 8 (20.0%) | 0 (0.0%) |
| $22,500 to $24,999 | 2 (5.0%) | 2 (7.7%) |
| $25,000 to $29,999 | 12 (30.0%) | 0 (0.0%) |
| $30,000 to $34,999 | 0 (0.0%) | 1 (3.8%) |
| $35,000 to $39,999 | 0 (0.0%) | 1 (3.8%) |
| $40,000 to $44,999 | 0 (0.0%) | 10 (38.5%) |
| $45,000 to $49,999 | 9 (22.5%) | 0 (0.0%) |
| $50,000 to $54,999 | 0 (0.0%) | 0 (0.0%) |
| $55,000 to $64,999 | 0 (0.0%) | 0 (0.0%) |
| $65,000 to $74,999 | 6 (15.0%) | 3 (11.5%) |
| $75,000 to $99,999 | 0 (0.0%) | 2 (7.7%) |
| $100,000+ | 1 (2.5%) | 2 (7.7%) |
| Total | 40 (100.0%) | 26 (100.0%) |
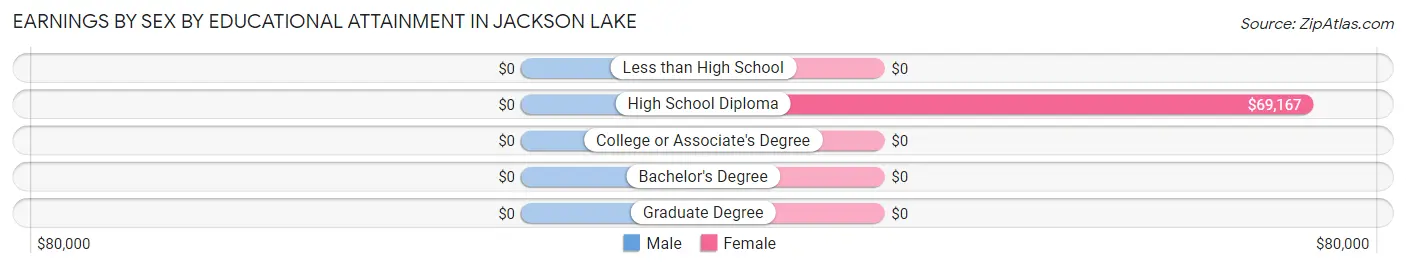
Earnings by Sex by Educational Attainment in Jackson Lake
| Educational Attainment | Male Income | Female Income |
| Less than High School | - | - |
| High School Diploma | - | - |
| College or Associate's Degree | - | - |
| Bachelor's Degree | - | - |
| Graduate Degree | - | - |
| Total | - | - |
Family Income in Jackson Lake
Family Income Brackets in Jackson Lake
According to the Jackson Lake family income data, there are 20 families falling into the $75,000 to $99,999 income range, which is the most common income bracket and makes up 44.4% of all families.
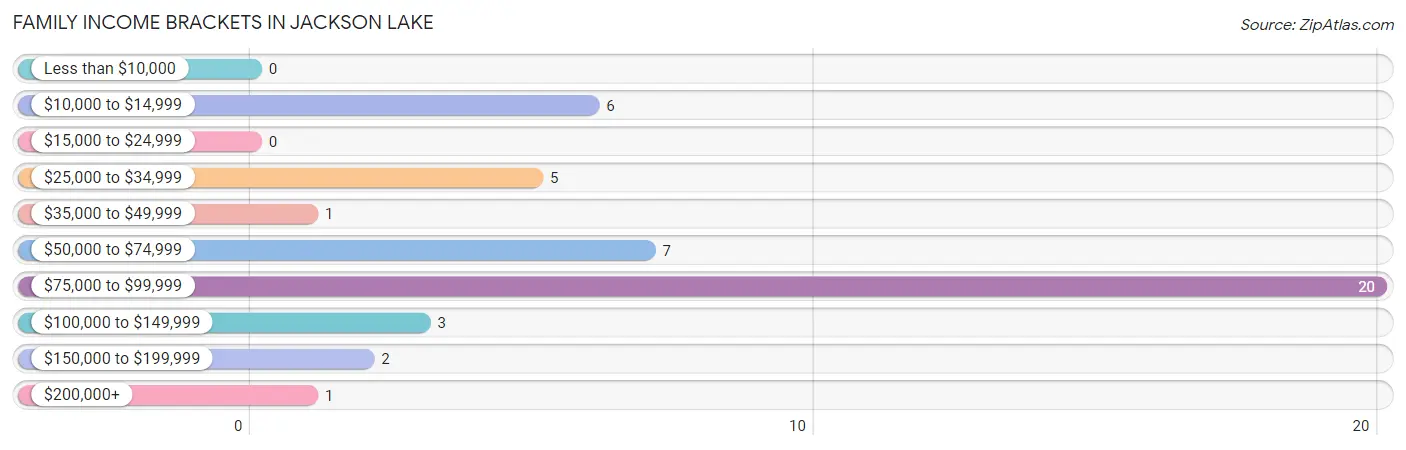
| Income Bracket | # Families | % Families |
| Less than $10,000 | 0 | 0.0% |
| $10,000 to $14,999 | 6 | 13.3% |
| $15,000 to $24,999 | 0 | 0.0% |
| $25,000 to $34,999 | 5 | 11.1% |
| $35,000 to $49,999 | 1 | 2.2% |
| $50,000 to $74,999 | 7 | 15.6% |
| $75,000 to $99,999 | 20 | 44.4% |
| $100,000 to $149,999 | 3 | 6.7% |
| $150,000 to $199,999 | 2 | 4.4% |
| $200,000+ | 1 | 2.2% |
Family Income by Famaliy Size in Jackson Lake
2-person families (29 | 64.4%) account for the highest median family income in Jackson Lake with $66,250 per family, while 2-person families (29 | 64.4%) have the highest median income of $33,125 per family member.
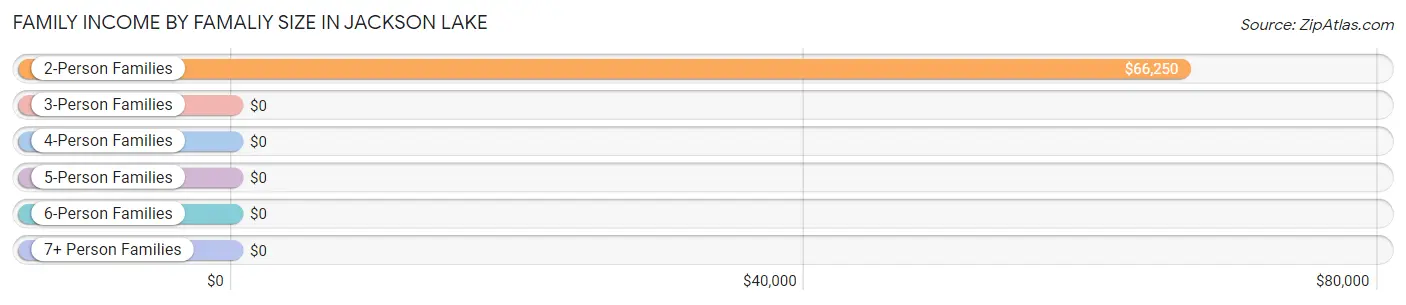
| Income Bracket | # Families | Median Income |
| 2-Person Families | 29 (64.4%) | $66,250 |
| 3-Person Families | 2 (4.4%) | $0 |
| 4-Person Families | 2 (4.4%) | $0 |
| 5-Person Families | 0 (0.0%) | $0 |
| 6-Person Families | 12 (26.7%) | $0 |
| 7+ Person Families | 0 (0.0%) | $0 |
| Total | 45 (100.0%) | $81,875 |
Family Income by Number of Earners in Jackson Lake
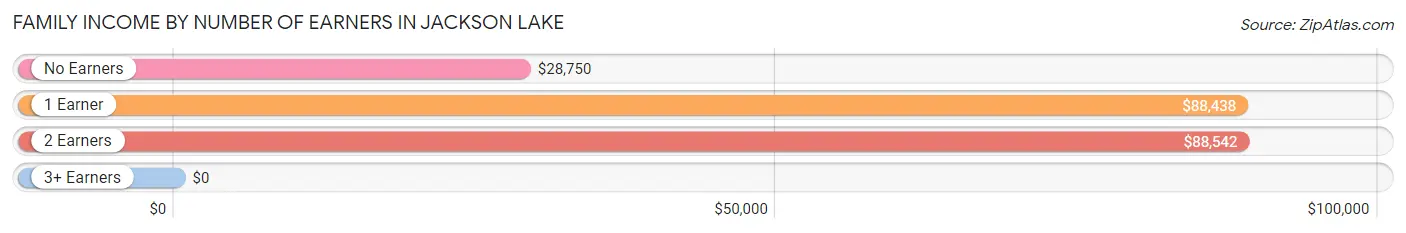
| Number of Earners | # Families | Median Income |
| No Earners | 16 (35.6%) | $28,750 |
| 1 Earner | 11 (24.4%) | $88,438 |
| 2 Earners | 18 (40.0%) | $88,542 |
| 3+ Earners | 0 (0.0%) | $0 |
| Total | 45 (100.0%) | $81,875 |
Household Income in Jackson Lake
Household Income Brackets in Jackson Lake
With 29 households falling in the category, the $75,000 to $99,999 income range is the most frequent in Jackson Lake, accounting for 40.8% of all households.
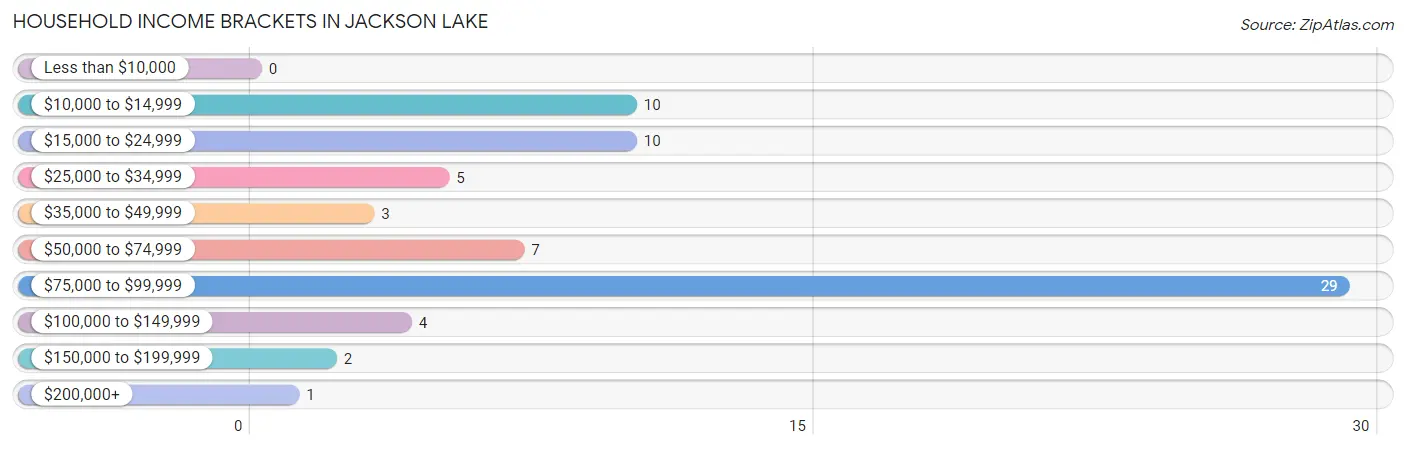
| Income Bracket | # Households | % Households |
| Less than $10,000 | 0 | 0.0% |
| $10,000 to $14,999 | 10 | 14.1% |
| $15,000 to $24,999 | 10 | 14.1% |
| $25,000 to $34,999 | 5 | 7.0% |
| $35,000 to $49,999 | 3 | 4.2% |
| $50,000 to $74,999 | 7 | 9.9% |
| $75,000 to $99,999 | 29 | 40.8% |
| $100,000 to $149,999 | 4 | 5.6% |
| $150,000 to $199,999 | 2 | 2.8% |
| $200,000+ | 1 | 1.4% |
Household Income by Householder Age in Jackson Lake
The median household income in Jackson Lake is $75,625, with the highest median household income of $88,359 found in the 45 to 64 years age bracket for the primary householder. A total of 27 households (38.0%) fall into this category. Meanwhile, the 15 to 24 years age bracket for the primary householder has the lowest median household income of $0, with 8 households (11.3%) in this group.
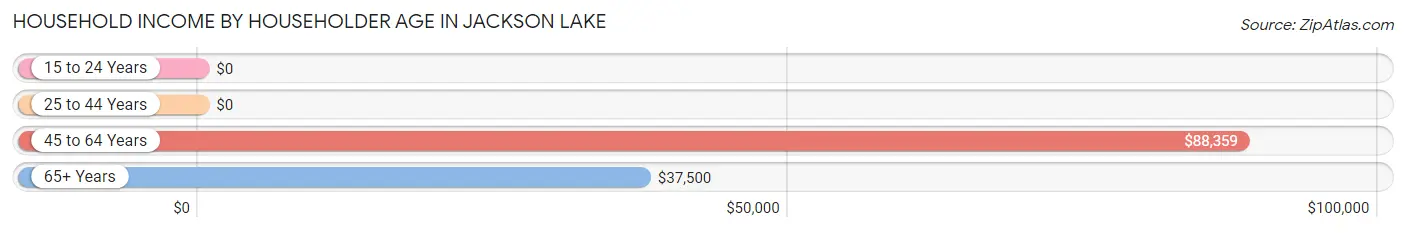
| Income Bracket | # Households | Median Income |
| 15 to 24 Years | 8 (11.3%) | $0 |
| 25 to 44 Years | 8 (11.3%) | $0 |
| 45 to 64 Years | 27 (38.0%) | $88,359 |
| 65+ Years | 28 (39.4%) | $37,500 |
| Total | 71 (100.0%) | $75,625 |
Poverty in Jackson Lake
Income Below Poverty by Sex and Age in Jackson Lake
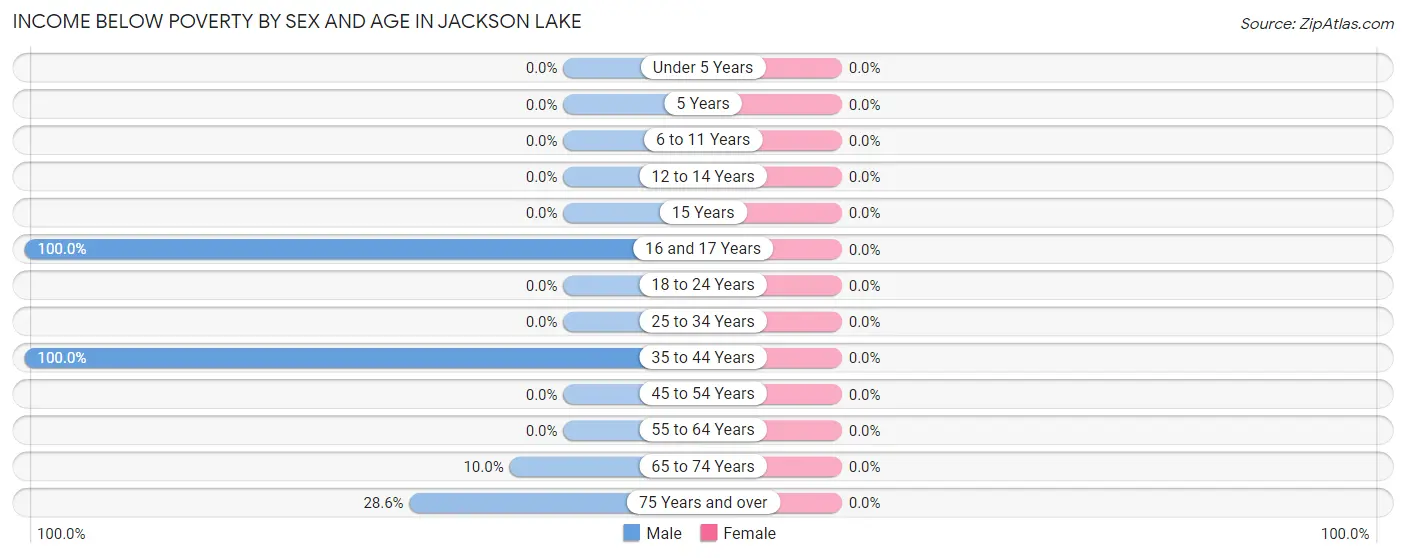
| Age Bracket | Male | Female |
| Under 5 Years | 0 (0.0%) | 0 (0.0%) |
| 5 Years | 0 (0.0%) | 0 (0.0%) |
| 6 to 11 Years | 0 (0.0%) | 0 (0.0%) |
| 12 to 14 Years | 0 (0.0%) | 0 (0.0%) |
| 15 Years | 0 (0.0%) | 0 (0.0%) |
| 16 and 17 Years | 11 (100.0%) | 0 (0.0%) |
| 18 to 24 Years | 0 (0.0%) | 0 (0.0%) |
| 25 to 34 Years | 0 (0.0%) | 0 (0.0%) |
| 35 to 44 Years | 6 (100.0%) | 0 (0.0%) |
| 45 to 54 Years | 0 (0.0%) | 0 (0.0%) |
| 55 to 64 Years | 0 (0.0%) | 0 (0.0%) |
| 65 to 74 Years | 2 (10.0%) | 0 (0.0%) |
| 75 Years and over | 2 (28.6%) | 0 (0.0%) |
| Total | 21 (21.9%) | 0 (0.0%) |
Income Above Poverty by Sex and Age in Jackson Lake
According to the poverty statistics in Jackson Lake, males aged 6 to 11 years and females aged 12 to 14 years are the age groups that are most secure financially, with 100.0% of males and 100.0% of females in these age groups living above the poverty line.
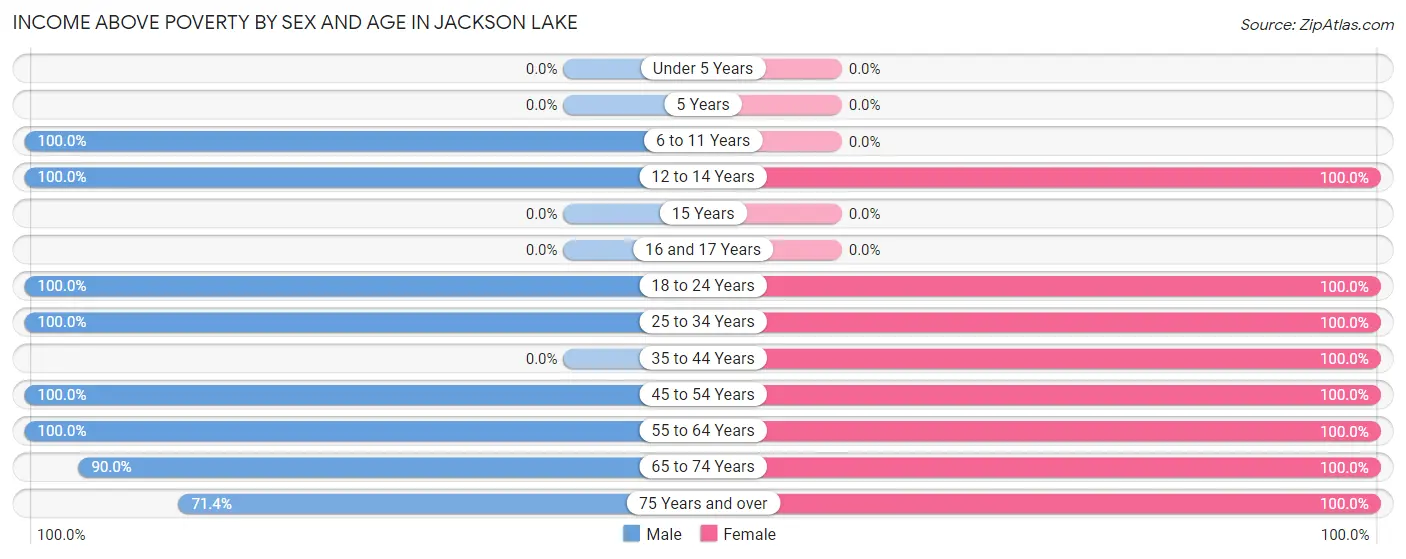
| Age Bracket | Male | Female |
| Under 5 Years | 0 (0.0%) | 0 (0.0%) |
| 5 Years | 0 (0.0%) | 0 (0.0%) |
| 6 to 11 Years | 3 (100.0%) | 0 (0.0%) |
| 12 to 14 Years | 7 (100.0%) | 11 (100.0%) |
| 15 Years | 0 (0.0%) | 0 (0.0%) |
| 16 and 17 Years | 0 (0.0%) | 0 (0.0%) |
| 18 to 24 Years | 17 (100.0%) | 15 (100.0%) |
| 25 to 34 Years | 2 (100.0%) | 2 (100.0%) |
| 35 to 44 Years | 0 (0.0%) | 2 (100.0%) |
| 45 to 54 Years | 16 (100.0%) | 13 (100.0%) |
| 55 to 64 Years | 7 (100.0%) | 14 (100.0%) |
| 65 to 74 Years | 18 (90.0%) | 6 (100.0%) |
| 75 Years and over | 5 (71.4%) | 6 (100.0%) |
| Total | 75 (78.1%) | 69 (100.0%) |
Income Below Poverty Among Married-Couple Families in Jackson Lake
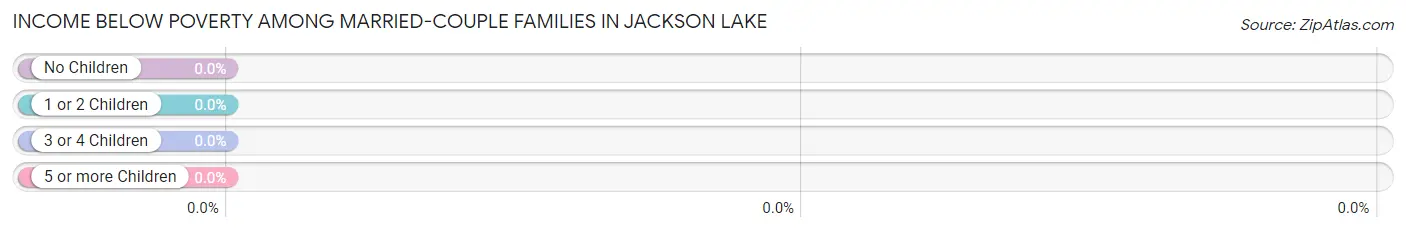
| Children | Above Poverty | Below Poverty |
| No Children | 23 (100.0%) | 0 (0.0%) |
| 1 or 2 Children | 14 (100.0%) | 0 (0.0%) |
| 3 or 4 Children | 0 (0.0%) | 0 (0.0%) |
| 5 or more Children | 0 (0.0%) | 0 (0.0%) |
| Total | 37 (100.0%) | 0 (0.0%) |
Income Below Poverty Among Single-Parent Households in Jackson Lake
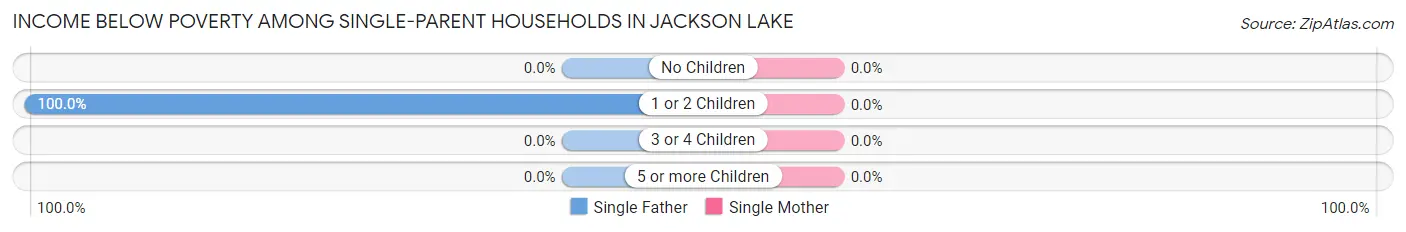
| Children | Single Father | Single Mother |
| No Children | 0 (0.0%) | 0 (0.0%) |
| 1 or 2 Children | 6 (100.0%) | 0 (0.0%) |
| 3 or 4 Children | 0 (0.0%) | 0 (0.0%) |
| 5 or more Children | 0 (0.0%) | 0 (0.0%) |
| Total | 6 (100.0%) | 0 (0.0%) |
Income Below Poverty Among Married-Couple vs Single-Parent Households in Jackson Lake
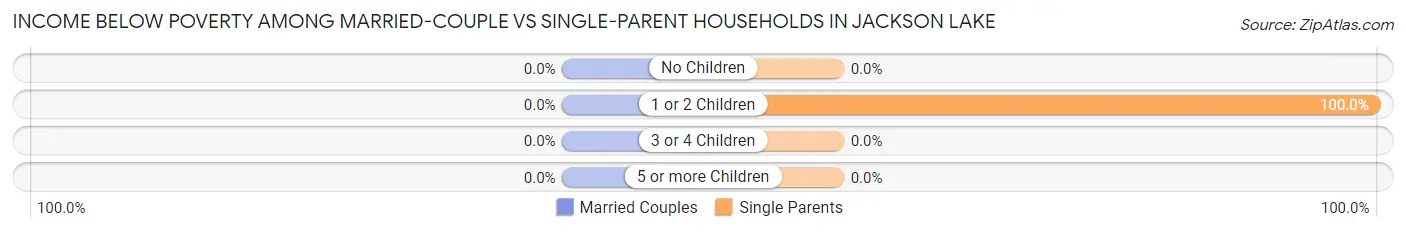
| Children | Married-Couple Families | Single-Parent Households |
| No Children | 0 (0.0%) | 0 (0.0%) |
| 1 or 2 Children | 0 (0.0%) | 6 (100.0%) |
| 3 or 4 Children | 0 (0.0%) | 0 (0.0%) |
| 5 or more Children | 0 (0.0%) | 0 (0.0%) |
| Total | 0 (0.0%) | 6 (75.0%) |
Race in Jackson Lake
The most populous races in Jackson Lake are White / Caucasian (156 | 94.6%), Two or more Races (9 | 5.4%), and Hispanic or Latino (3 | 1.8%).
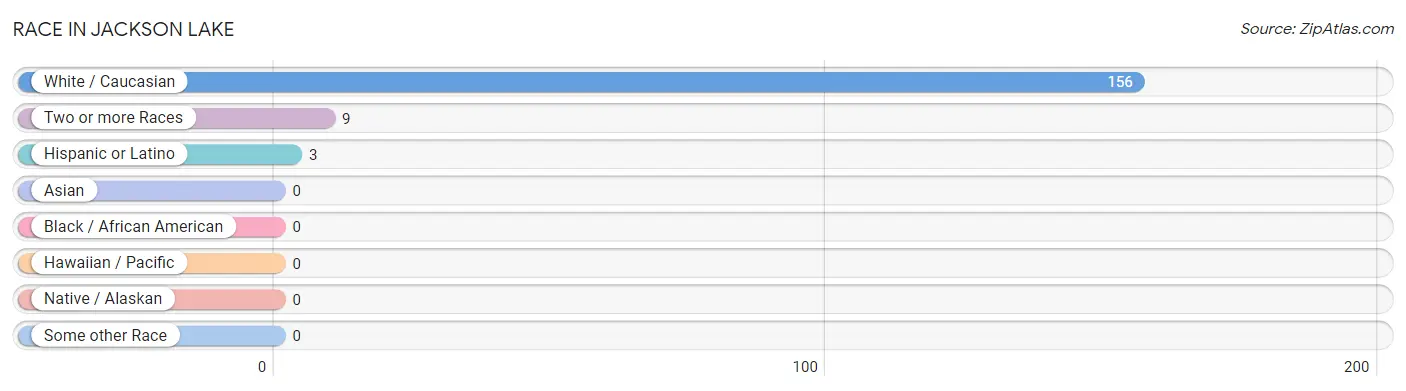
| Race | # Population | % Population |
| Asian | 0 | 0.0% |
| Black / African American | 0 | 0.0% |
| Hawaiian / Pacific | 0 | 0.0% |
| Hispanic or Latino | 3 | 1.8% |
| Native / Alaskan | 0 | 0.0% |
| White / Caucasian | 156 | 94.6% |
| Two or more Races | 9 | 5.4% |
| Some other Race | 0 | 0.0% |
| Total | 165 | 100.0% |
Ancestry in Jackson Lake
The most populous ancestries reported in Jackson Lake are German (38 | 23.0%), French (28 | 17.0%), Italian (14 | 8.5%), American (11 | 6.7%), and Dutch (9 | 5.4%), together accounting for 60.6% of all Jackson Lake residents.
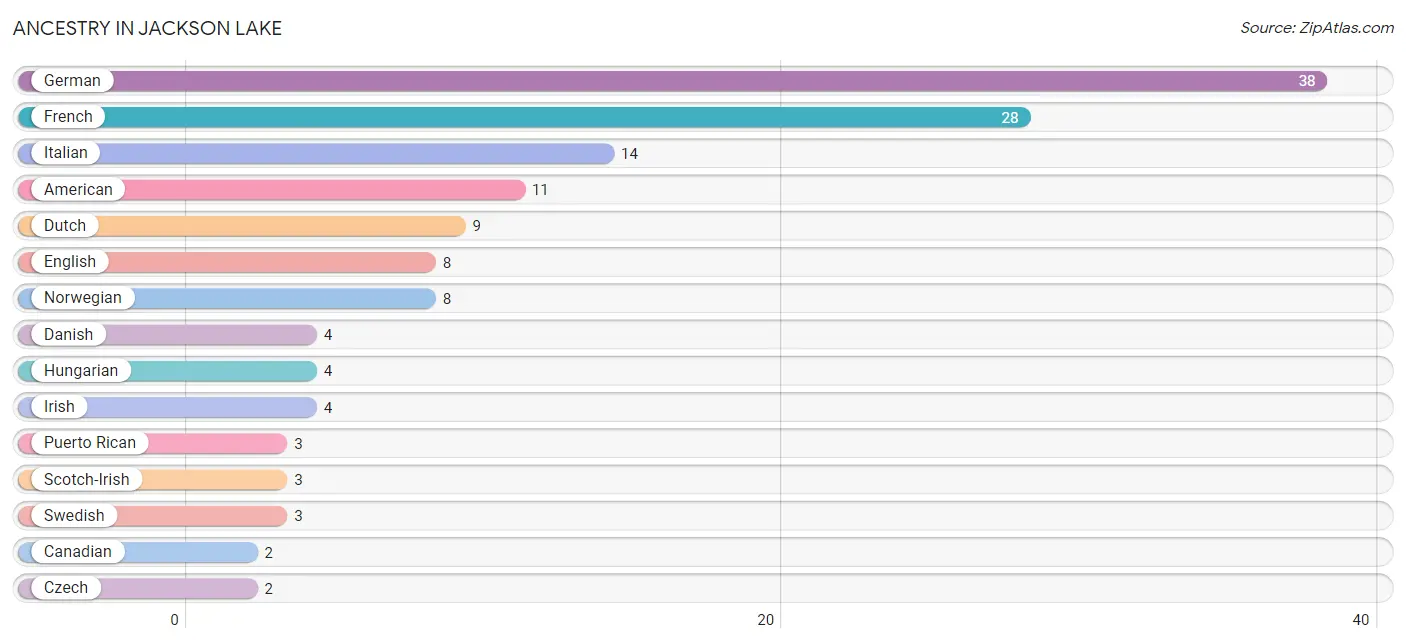
| Ancestry | # Population | % Population |
| American | 11 | 6.7% |
| Canadian | 2 | 1.2% |
| Czech | 2 | 1.2% |
| Danish | 4 | 2.4% |
| Dutch | 9 | 5.4% |
| English | 8 | 4.9% |
| French | 28 | 17.0% |
| German | 38 | 23.0% |
| Hungarian | 4 | 2.4% |
| Irish | 4 | 2.4% |
| Italian | 14 | 8.5% |
| Norwegian | 8 | 4.9% |
| Polish | 1 | 0.6% |
| Puerto Rican | 3 | 1.8% |
| Scotch-Irish | 3 | 1.8% |
| Slovak | 1 | 0.6% |
| Swedish | 3 | 1.8% |
| Welsh | 1 | 0.6% | View All 18 Rows |
Immigrants in Jackson Lake
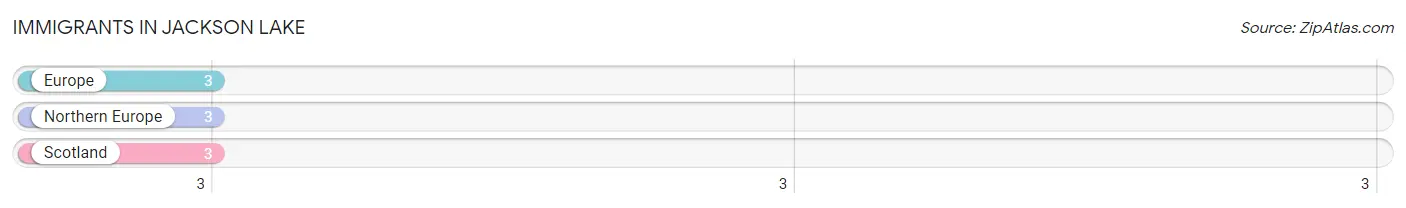
The most numerous immigrant groups reported in Jackson Lake came from Europe (3 | 1.8%), Northern Europe (3 | 1.8%), and Scotland (3 | 1.8%), together accounting for 5.5% of all Jackson Lake residents.
| Immigration Origin | # Population | % Population |
| Europe | 3 | 1.8% |
| Northern Europe | 3 | 1.8% |
| Scotland | 3 | 1.8% | View All 3 Rows |
Sex and Age in Jackson Lake
Sex and Age in Jackson Lake
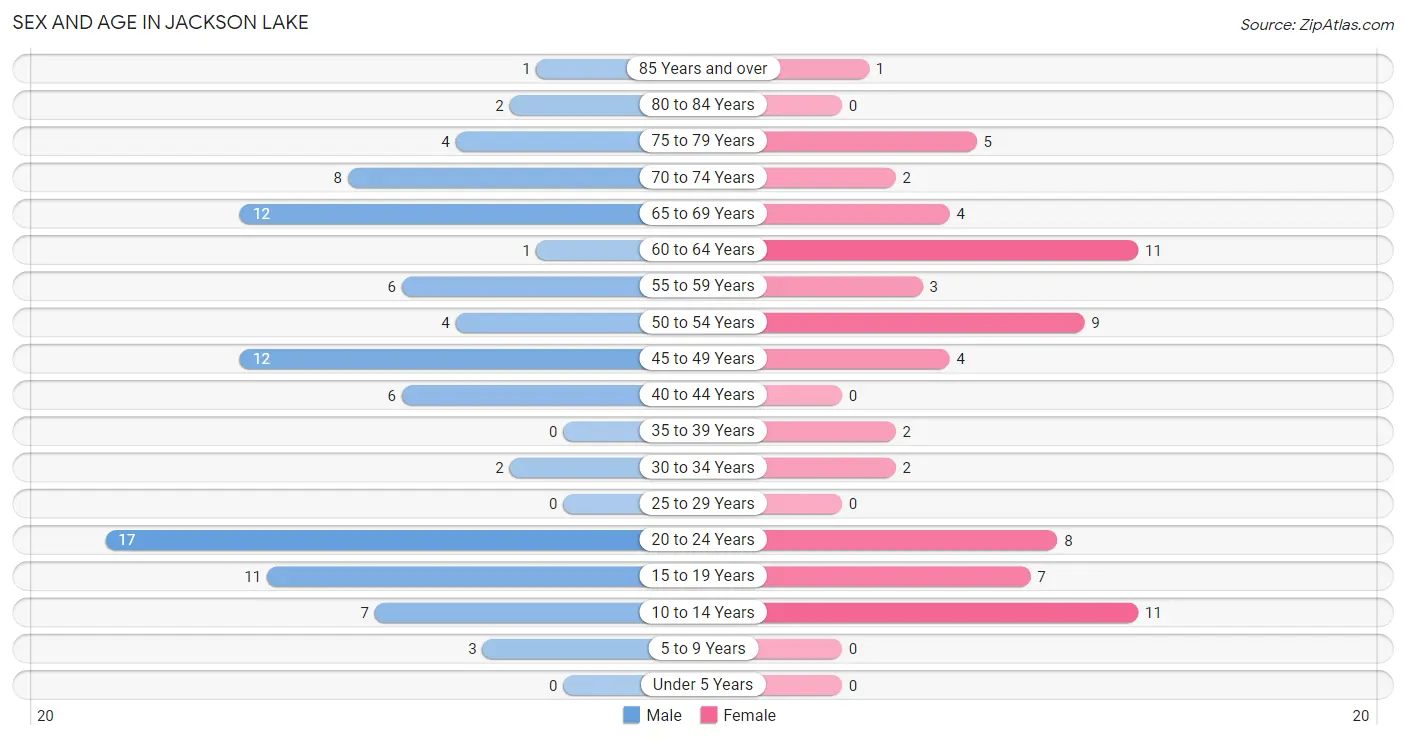
The most populous age groups in Jackson Lake are 20 to 24 Years (17 | 17.7%) for men and 10 to 14 Years (11 | 15.9%) for women.
| Age Bracket | Male | Female |
| Under 5 Years | 0 (0.0%) | 0 (0.0%) |
| 5 to 9 Years | 3 (3.1%) | 0 (0.0%) |
| 10 to 14 Years | 7 (7.3%) | 11 (15.9%) |
| 15 to 19 Years | 11 (11.5%) | 7 (10.1%) |
| 20 to 24 Years | 17 (17.7%) | 8 (11.6%) |
| 25 to 29 Years | 0 (0.0%) | 0 (0.0%) |
| 30 to 34 Years | 2 (2.1%) | 2 (2.9%) |
| 35 to 39 Years | 0 (0.0%) | 2 (2.9%) |
| 40 to 44 Years | 6 (6.2%) | 0 (0.0%) |
| 45 to 49 Years | 12 (12.5%) | 4 (5.8%) |
| 50 to 54 Years | 4 (4.2%) | 9 (13.0%) |
| 55 to 59 Years | 6 (6.2%) | 3 (4.3%) |
| 60 to 64 Years | 1 (1.0%) | 11 (15.9%) |
| 65 to 69 Years | 12 (12.5%) | 4 (5.8%) |
| 70 to 74 Years | 8 (8.3%) | 2 (2.9%) |
| 75 to 79 Years | 4 (4.2%) | 5 (7.2%) |
| 80 to 84 Years | 2 (2.1%) | 0 (0.0%) |
| 85 Years and over | 1 (1.0%) | 1 (1.5%) |
| Total | 96 (100.0%) | 69 (100.0%) |
Families and Households in Jackson Lake
Median Family Size in Jackson Lake
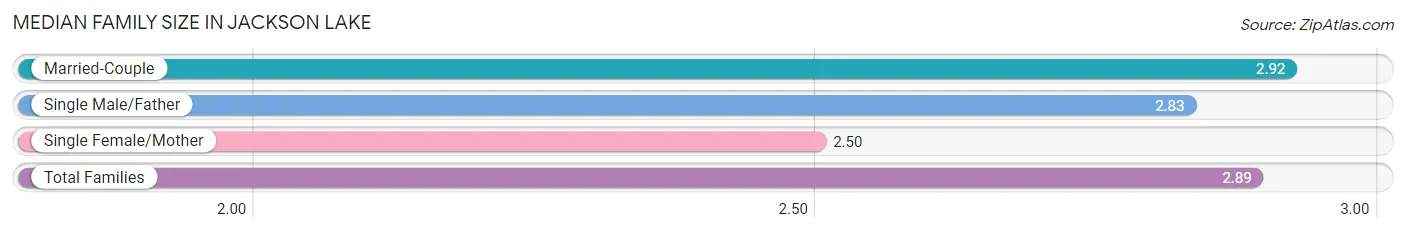
The median family size in Jackson Lake is 2.89 persons per family, with married-couple families (37 | 82.2%) accounting for the largest median family size of 2.92 persons per family. On the other hand, single female/mother families (2 | 4.4%) represent the smallest median family size with 2.50 persons per family.
| Family Type | # Families | Family Size |
| Married-Couple | 37 (82.2%) | 2.92 |
| Single Male/Father | 6 (13.3%) | 2.83 |
| Single Female/Mother | 2 (4.4%) | 2.50 |
| Total Families | 45 (100.0%) | 2.89 |
Median Household Size in Jackson Lake
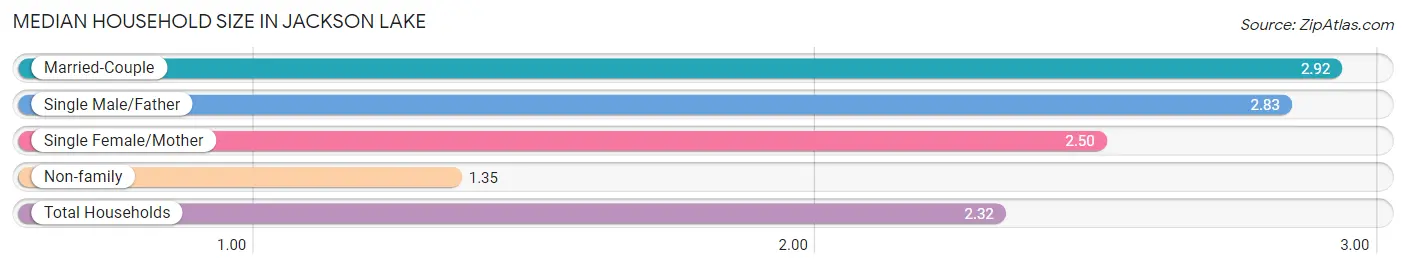
The median household size in Jackson Lake is 2.32 persons per household, with married-couple households (37 | 52.1%) accounting for the largest median household size of 2.92 persons per household. non-family households (26 | 36.6%) represent the smallest median household size with 1.35 persons per household.
| Household Type | # Households | Household Size |
| Married-Couple | 37 (52.1%) | 2.92 |
| Single Male/Father | 6 (8.5%) | 2.83 |
| Single Female/Mother | 2 (2.8%) | 2.50 |
| Non-family | 26 (36.6%) | 1.35 |
| Total Households | 71 (100.0%) | 2.32 |
Household Size by Marriage Status in Jackson Lake
Out of a total of 71 households in Jackson Lake, 45 (63.4%) are family households, while 26 (36.6%) are nonfamily households. The most numerous type of family households are 2-person households, comprising 29, and the most common type of nonfamily households are 1-person households, comprising 18.
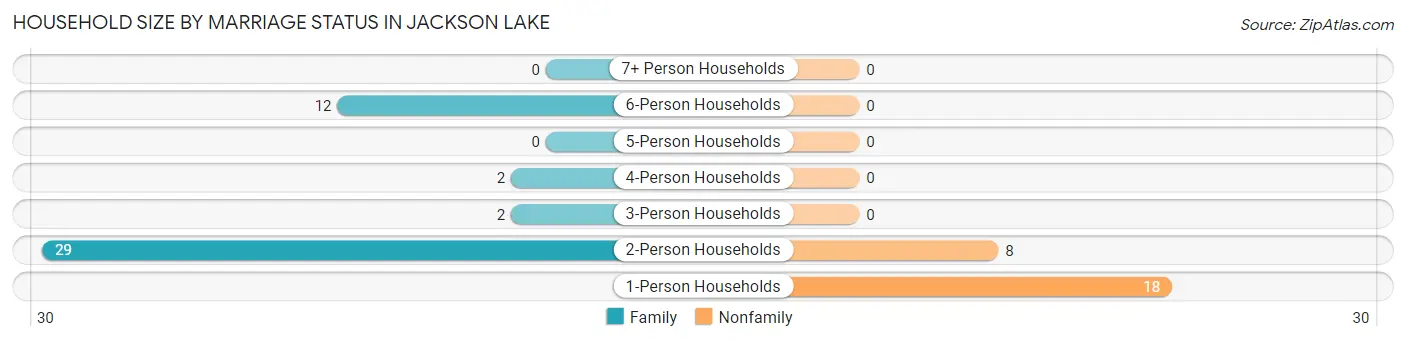
| Household Size | Family Households | Nonfamily Households |
| 1-Person Households | - | 18 (25.4%) |
| 2-Person Households | 29 (40.8%) | 8 (11.3%) |
| 3-Person Households | 2 (2.8%) | 0 (0.0%) |
| 4-Person Households | 2 (2.8%) | 0 (0.0%) |
| 5-Person Households | 0 (0.0%) | 0 (0.0%) |
| 6-Person Households | 12 (16.9%) | 0 (0.0%) |
| 7+ Person Households | 0 (0.0%) | 0 (0.0%) |
| Total | 45 (63.4%) | 26 (36.6%) |
Female Fertility in Jackson Lake
Fertility by Age in Jackson Lake
| Age Bracket | Women with Births | Births / 1,000 Women |
| 15 to 19 years | 0 (0.0%) | 0.0 |
| 20 to 34 years | 0 (0.0%) | 0.0 |
| 35 to 50 years | 0 (0.0%) | 0.0 |
| Total | 0 (0.0%) | 0.0 |
Fertility by Age by Marriage Status in Jackson Lake
| Age Bracket | Married | Unmarried |
| 15 to 19 years | 0 (0.0%) | 0 (0.0%) |
| 20 to 34 years | 0 (0.0%) | 0 (0.0%) |
| 35 to 50 years | 0 (0.0%) | 0 (0.0%) |
| Total | 0 (0.0%) | 0 (0.0%) |
Fertility by Education in Jackson Lake
| Educational Attainment | Women with Births | Births / 1,000 Women |
| Less than High School | 0 (0.0%) | 0.0 |
| High School Diploma | 0 (0.0%) | 0.0 |
| College or Associate's Degree | 0 (0.0%) | 0.0 |
| Bachelor's Degree | 0 (0.0%) | 0.0 |
| Graduate Degree | 0 (0.0%) | 0.0 |
| Total | 0 (0.0%) | 0.0 |
Fertility by Education by Marriage Status in Jackson Lake
| Educational Attainment | Married | Unmarried |
| Less than High School | 0 (0.0%) | 0 (0.0%) |
| High School Diploma | 0 (0.0%) | 0 (0.0%) |
| College or Associate's Degree | 0 (0.0%) | 0 (0.0%) |
| Bachelor's Degree | 0 (0.0%) | 0 (0.0%) |
| Graduate Degree | 0 (0.0%) | 0 (0.0%) |
| Total | 0 (0.0%) | 0 (0.0%) |
Employment Characteristics in Jackson Lake
Employment by Class of Employer in Jackson Lake
Among the 61 employed individuals in Jackson Lake, private company employees (33 | 54.1%), local government employees (14 | 23.0%), and self-employed (not incorporated) (10 | 16.4%) make up the most common classes of employment.
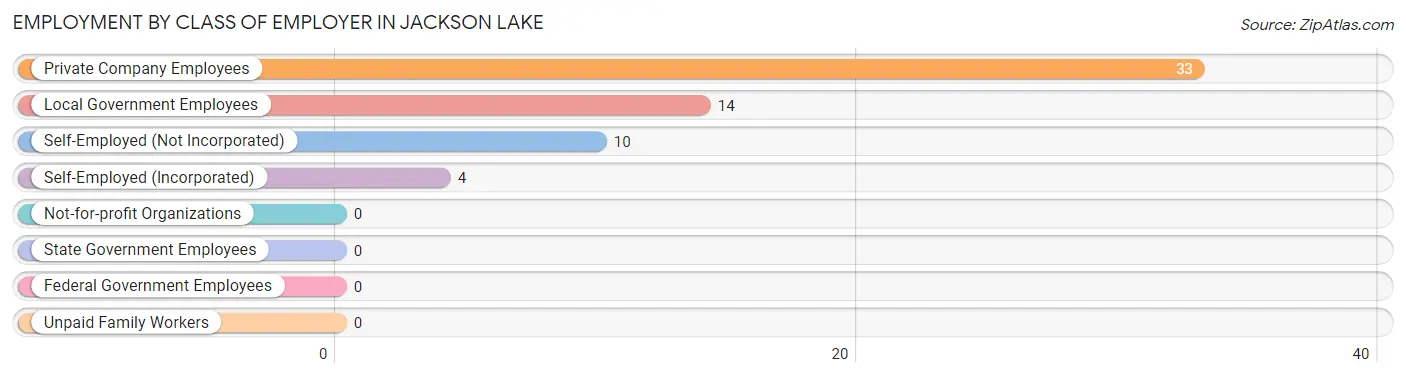
| Employer Class | # Employees | % Employees |
| Private Company Employees | 33 | 54.1% |
| Self-Employed (Incorporated) | 4 | 6.6% |
| Self-Employed (Not Incorporated) | 10 | 16.4% |
| Not-for-profit Organizations | 0 | 0.0% |
| Local Government Employees | 14 | 23.0% |
| State Government Employees | 0 | 0.0% |
| Federal Government Employees | 0 | 0.0% |
| Unpaid Family Workers | 0 | 0.0% |
| Total | 61 | 100.0% |
Employment Status by Age in Jackson Lake
According to the labor force statistics for Jackson Lake, out of the total population over 16 years of age (144), 45.8% or 66 individuals are in the labor force, with 7.6% or 5 of them unemployed. The age group with the highest labor force participation rate is 20 to 24 years, with 100.0% or 25 individuals in the labor force. Within the labor force, the 60 to 64 years age range has the highest percentage of unemployed individuals, with 37.5% or 3 of them being unemployed.
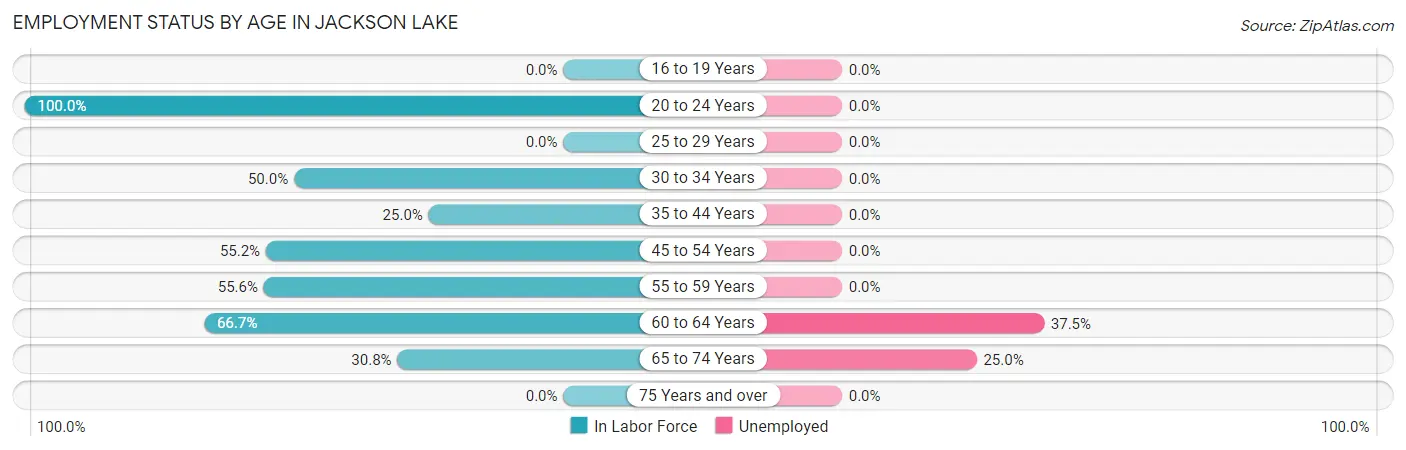
| Age Bracket | In Labor Force | Unemployed |
| 16 to 19 Years | 0 (0.0%) | 0 (0.0%) |
| 20 to 24 Years | 25 (100.0%) | 0 (0.0%) |
| 25 to 29 Years | 0 (0.0%) | 0 (0.0%) |
| 30 to 34 Years | 2 (50.0%) | 0 (0.0%) |
| 35 to 44 Years | 2 (25.0%) | 0 (0.0%) |
| 45 to 54 Years | 16 (55.2%) | 0 (0.0%) |
| 55 to 59 Years | 5 (55.6%) | 0 (0.0%) |
| 60 to 64 Years | 8 (66.7%) | 3 (37.5%) |
| 65 to 74 Years | 8 (30.8%) | 2 (25.0%) |
| 75 Years and over | 0 (0.0%) | 0 (0.0%) |
| Total | 66 (45.8%) | 5 (7.6%) |
Employment Status by Educational Attainment in Jackson Lake
According to labor force statistics for Jackson Lake, 53.2% of individuals (33) out of the total population between 25 and 64 years of age (62) are in the labor force, with 9.1% or 3 of them being unemployed. The group with the highest labor force participation rate are those with the educational attainment of less than high school, with 100.0% or 14 individuals in the labor force. Within the labor force, individuals with bachelor's degree or higher education have the highest percentage of unemployment, with 60.0% or 3 of them being unemployed.
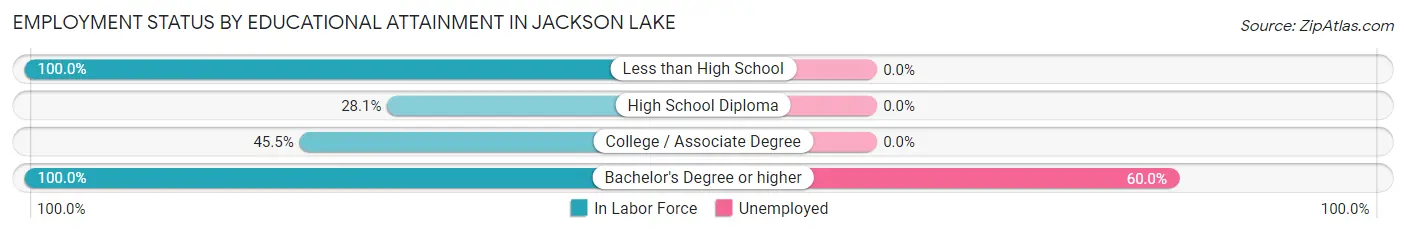
| Educational Attainment | In Labor Force | Unemployed |
| Less than High School | 14 (100.0%) | 0 (0.0%) |
| High School Diploma | 9 (28.1%) | 0 (0.0%) |
| College / Associate Degree | 5 (45.5%) | 0 (0.0%) |
| Bachelor's Degree or higher | 5 (100.0%) | 3 (60.0%) |
| Total | 33 (53.2%) | 6 (9.1%) |
Employment Occupations by Sex in Jackson Lake
Management, Business, Science and Arts Occupations
The most common Management, Business, Science and Arts occupations in Jackson Lake are Business & Financial (4 | 6.6%), and Management (3 | 4.9%).
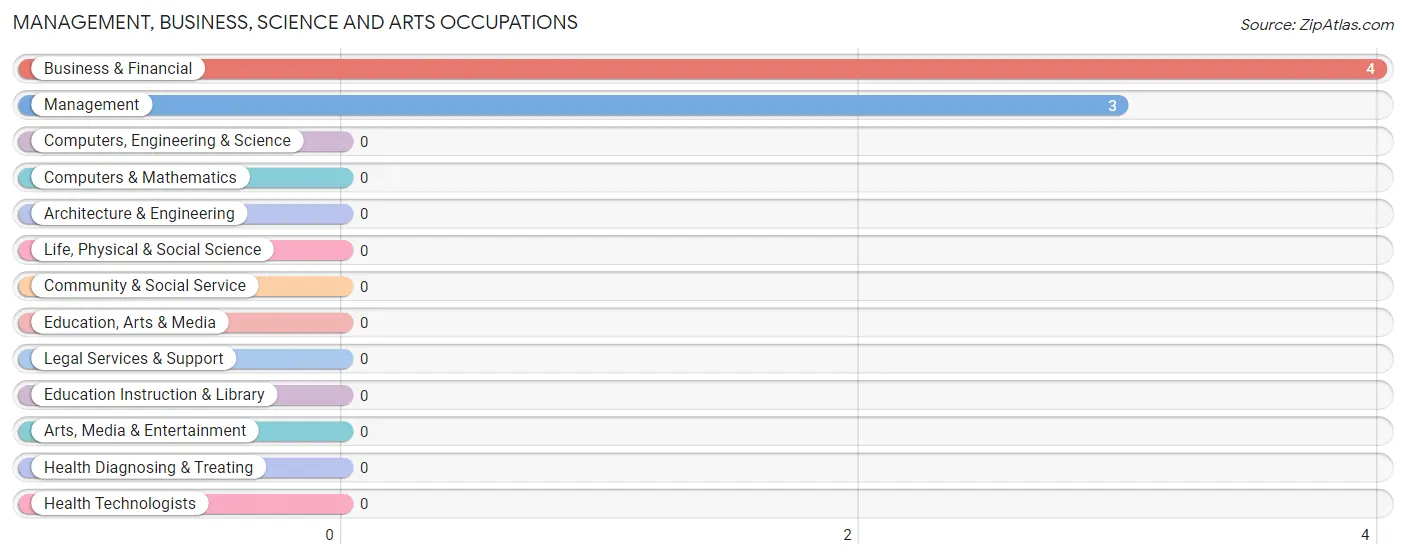
Management, Business, Science and Arts Occupations by Sex
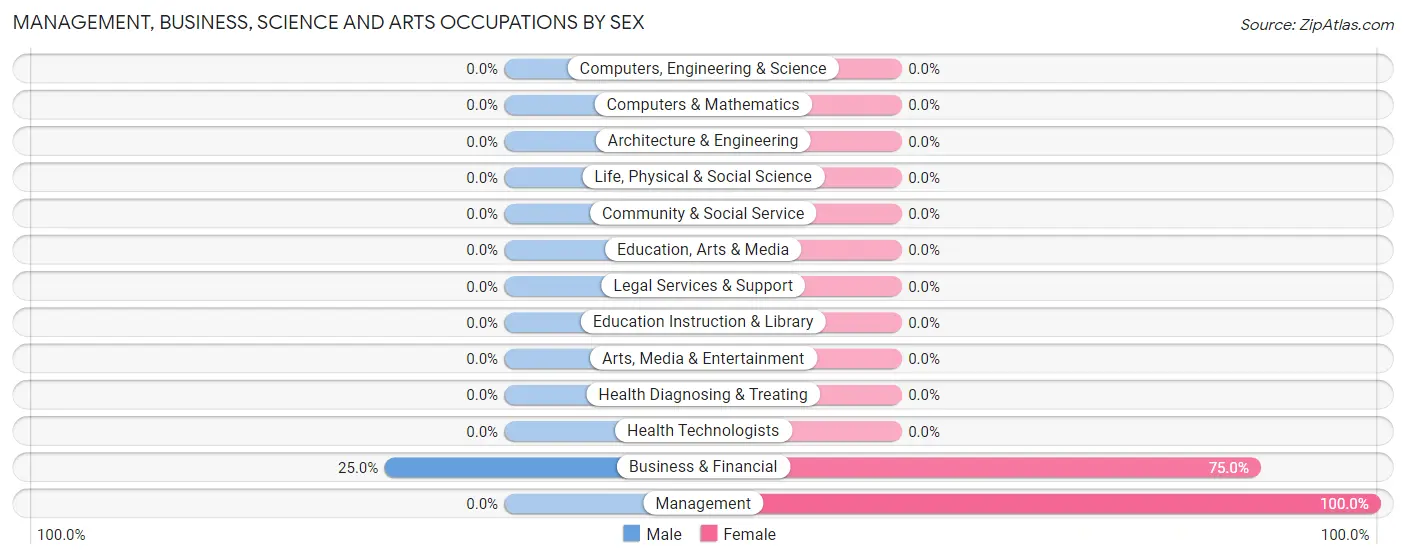
| Occupation | Male | Female |
| Management | 0 (0.0%) | 3 (100.0%) |
| Business & Financial | 1 (25.0%) | 3 (75.0%) |
| Computers, Engineering & Science | 0 (0.0%) | 0 (0.0%) |
| Computers & Mathematics | 0 (0.0%) | 0 (0.0%) |
| Architecture & Engineering | 0 (0.0%) | 0 (0.0%) |
| Life, Physical & Social Science | 0 (0.0%) | 0 (0.0%) |
| Community & Social Service | 0 (0.0%) | 0 (0.0%) |
| Education, Arts & Media | 0 (0.0%) | 0 (0.0%) |
| Legal Services & Support | 0 (0.0%) | 0 (0.0%) |
| Education Instruction & Library | 0 (0.0%) | 0 (0.0%) |
| Arts, Media & Entertainment | 0 (0.0%) | 0 (0.0%) |
| Health Diagnosing & Treating | 0 (0.0%) | 0 (0.0%) |
| Health Technologists | 0 (0.0%) | 0 (0.0%) |
| Total (Category) | 1 (14.3%) | 6 (85.7%) |
| Total (Overall) | 40 (65.6%) | 21 (34.4%) |
Services Occupations
The most common Services occupations in Jackson Lake are Cleaning & Maintenance (12 | 19.7%), and Food Preparation & Serving (1 | 1.6%).
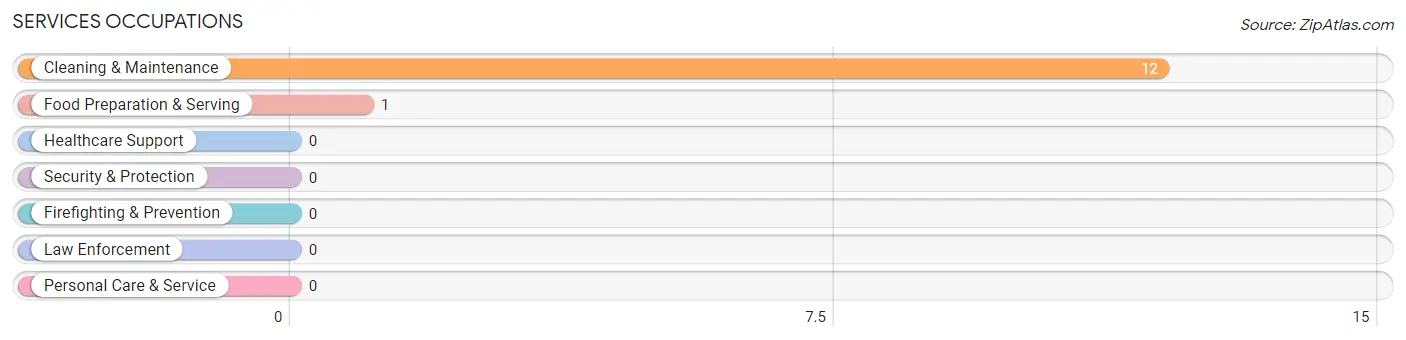
Services Occupations by Sex
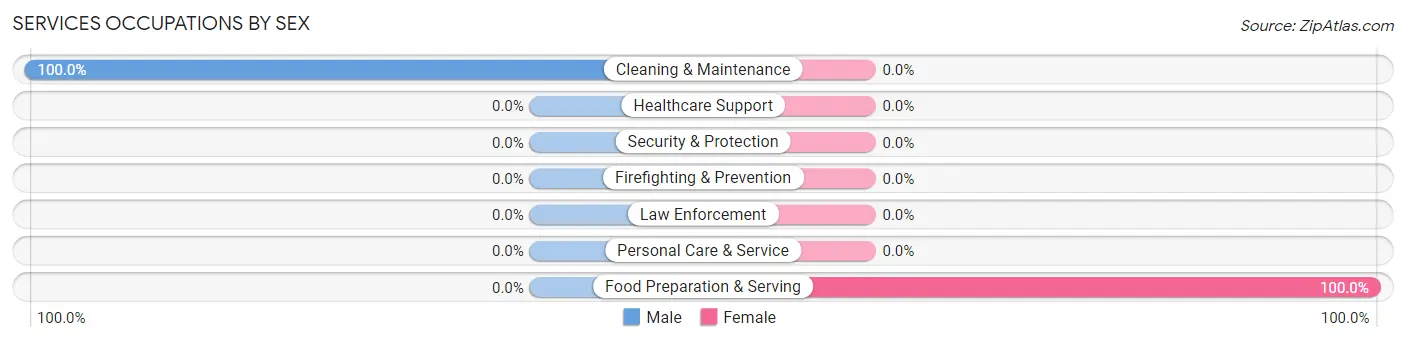
| Occupation | Male | Female |
| Healthcare Support | 0 (0.0%) | 0 (0.0%) |
| Security & Protection | 0 (0.0%) | 0 (0.0%) |
| Firefighting & Prevention | 0 (0.0%) | 0 (0.0%) |
| Law Enforcement | 0 (0.0%) | 0 (0.0%) |
| Food Preparation & Serving | 0 (0.0%) | 1 (100.0%) |
| Cleaning & Maintenance | 12 (100.0%) | 0 (0.0%) |
| Personal Care & Service | 0 (0.0%) | 0 (0.0%) |
| Total (Category) | 12 (92.3%) | 1 (7.7%) |
| Total (Overall) | 40 (65.6%) | 21 (34.4%) |
Sales and Office Occupations
The most common Sales and Office occupations in Jackson Lake are Office & Administration (10 | 16.4%), and Sales & Related (6 | 9.8%).
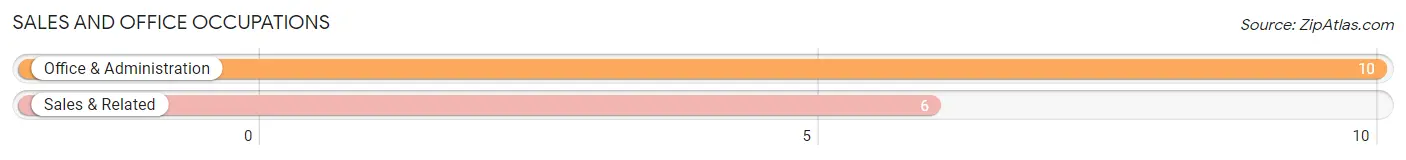
Sales and Office Occupations by Sex
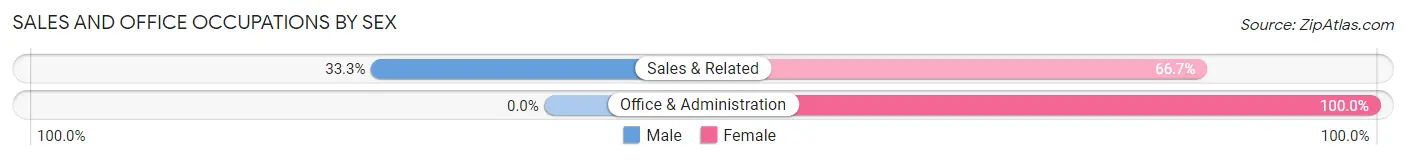
| Occupation | Male | Female |
| Sales & Related | 2 (33.3%) | 4 (66.7%) |
| Office & Administration | 0 (0.0%) | 10 (100.0%) |
| Total (Category) | 2 (12.5%) | 14 (87.5%) |
| Total (Overall) | 40 (65.6%) | 21 (34.4%) |
Natural Resources, Construction and Maintenance Occupations
The most common Natural Resources, Construction and Maintenance occupations in Jackson Lake are Installation, Maintenance & Repair (13 | 21.3%), and Construction & Extraction (8 | 13.1%).
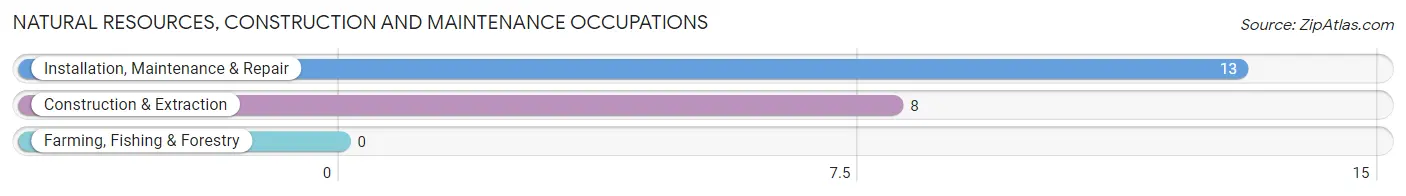
Natural Resources, Construction and Maintenance Occupations by Sex
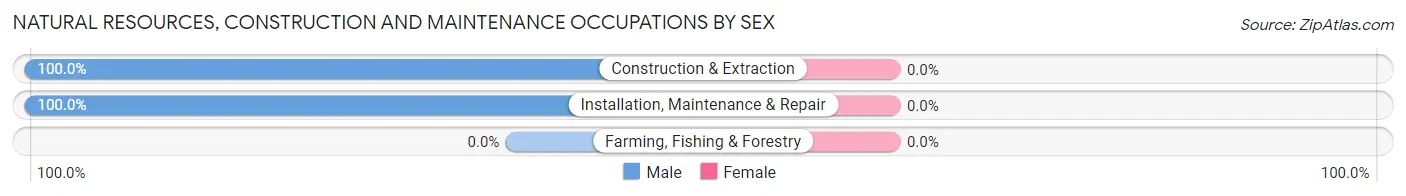
| Occupation | Male | Female |
| Farming, Fishing & Forestry | 0 (0.0%) | 0 (0.0%) |
| Construction & Extraction | 8 (100.0%) | 0 (0.0%) |
| Installation, Maintenance & Repair | 13 (100.0%) | 0 (0.0%) |
| Total (Category) | 21 (100.0%) | 0 (0.0%) |
| Total (Overall) | 40 (65.6%) | 21 (34.4%) |
Production, Transportation and Moving Occupations
The most common Production, Transportation and Moving occupations in Jackson Lake are , and Transportation (4 | 6.6%).
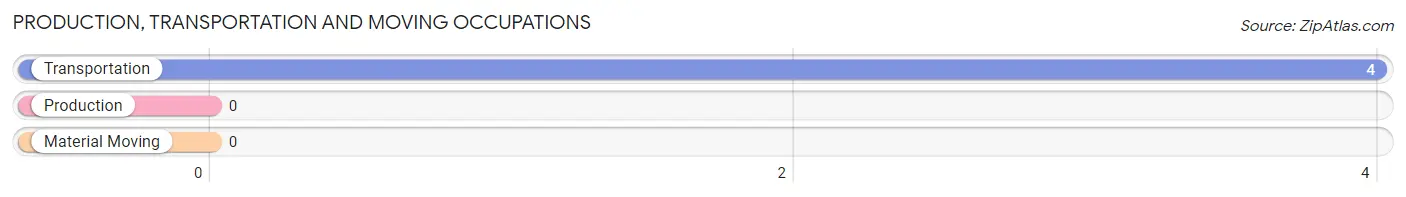
Production, Transportation and Moving Occupations by Sex
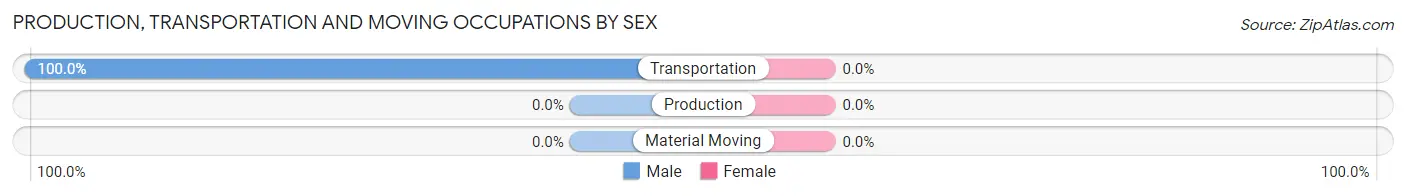
| Occupation | Male | Female |
| Production | 0 (0.0%) | 0 (0.0%) |
| Transportation | 4 (100.0%) | 0 (0.0%) |
| Material Moving | 0 (0.0%) | 0 (0.0%) |
| Total (Category) | 4 (100.0%) | 0 (0.0%) |
| Total (Overall) | 40 (65.6%) | 21 (34.4%) |
Employment Industries by Sex in Jackson Lake
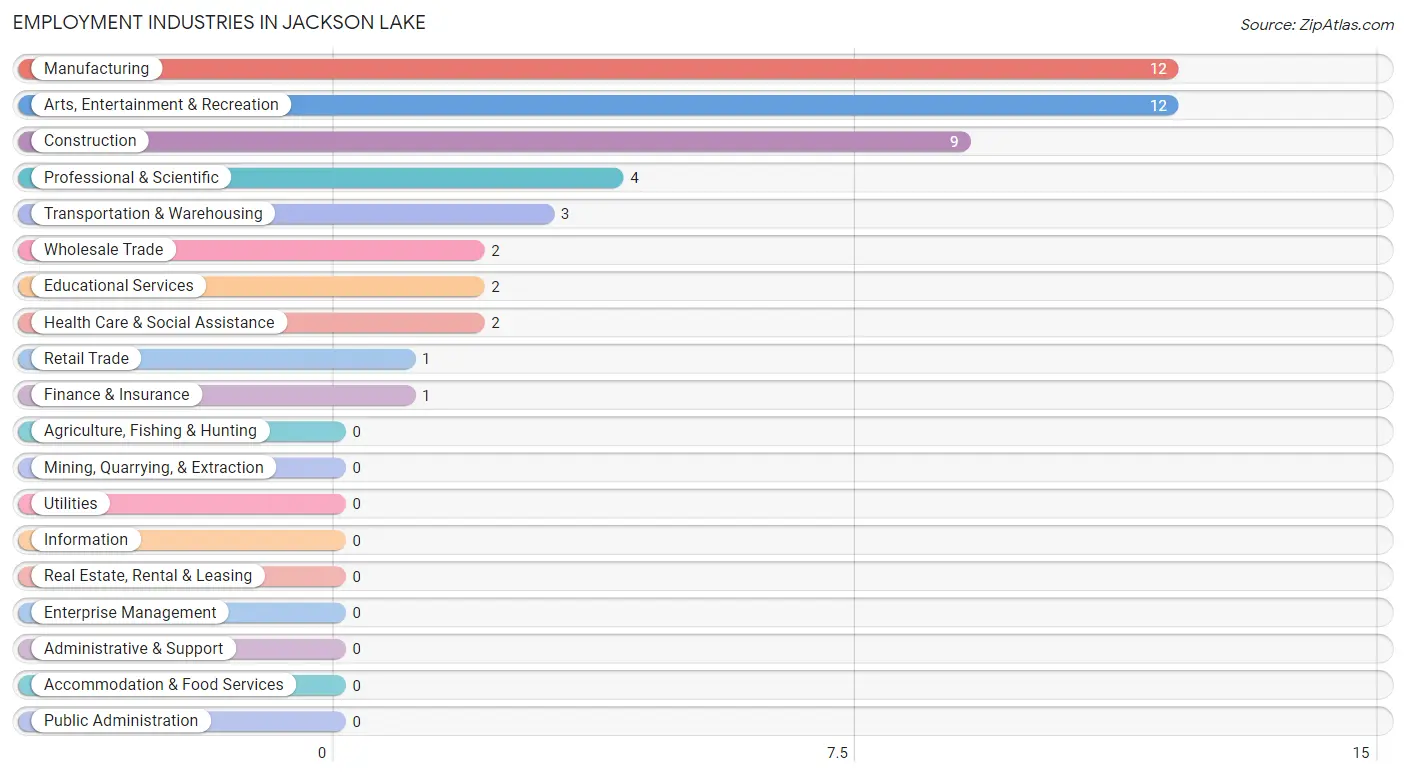
Employment Industries in Jackson Lake
The major employment industries in Jackson Lake include Manufacturing (12 | 19.7%), Arts, Entertainment & Recreation (12 | 19.7%), Construction (9 | 14.7%), Professional & Scientific (4 | 6.6%), and Transportation & Warehousing (3 | 4.9%).
Employment Industries by Sex in Jackson Lake
The Jackson Lake industries that see more men than women are Wholesale Trade (100.0%), Finance & Insurance (100.0%), and Educational Services (100.0%), whereas the industries that tend to have a higher number of women are Retail Trade (100.0%), Transportation & Warehousing (100.0%), and Professional & Scientific (100.0%).
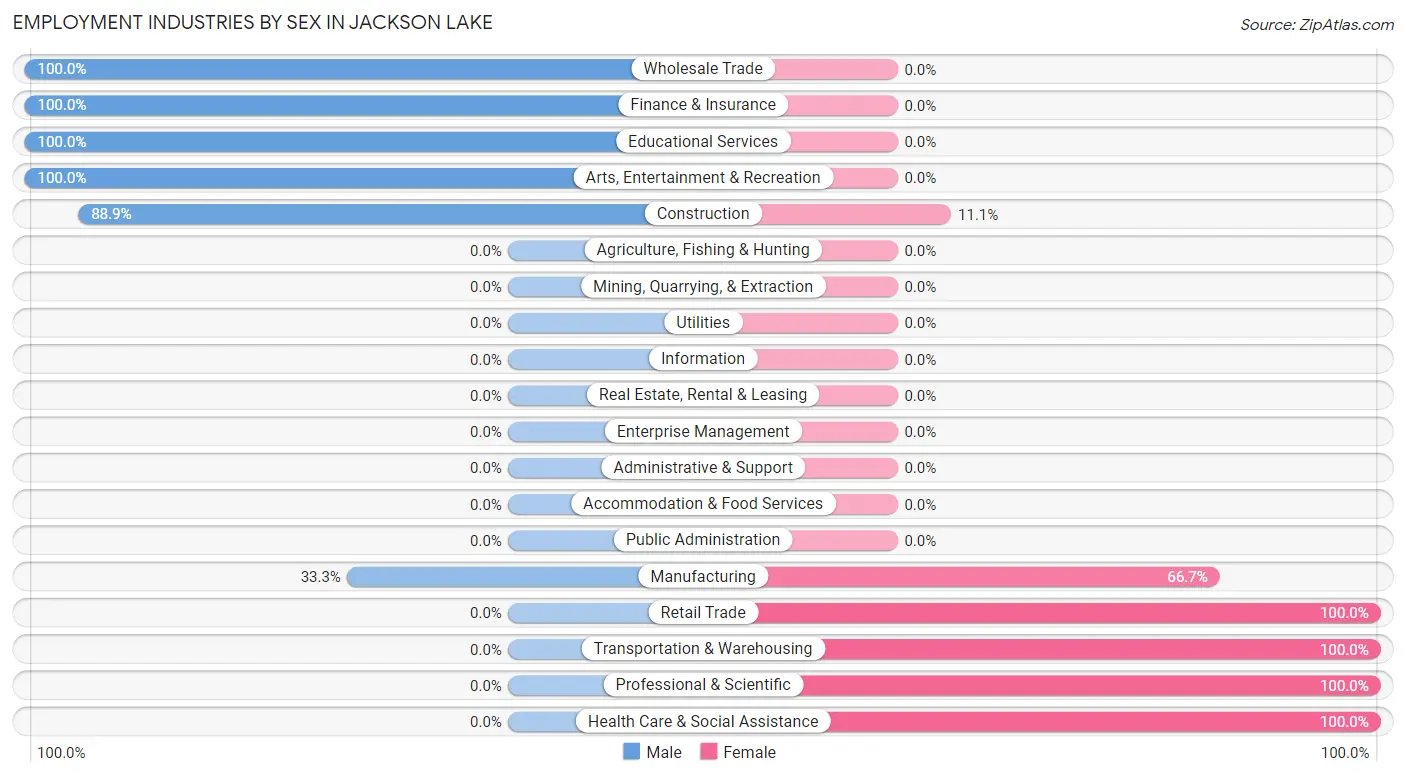
| Industry | Male | Female |
| Agriculture, Fishing & Hunting | 0 (0.0%) | 0 (0.0%) |
| Mining, Quarrying, & Extraction | 0 (0.0%) | 0 (0.0%) |
| Construction | 8 (88.9%) | 1 (11.1%) |
| Manufacturing | 4 (33.3%) | 8 (66.7%) |
| Wholesale Trade | 2 (100.0%) | 0 (0.0%) |
| Retail Trade | 0 (0.0%) | 1 (100.0%) |
| Transportation & Warehousing | 0 (0.0%) | 3 (100.0%) |
| Utilities | 0 (0.0%) | 0 (0.0%) |
| Information | 0 (0.0%) | 0 (0.0%) |
| Finance & Insurance | 1 (100.0%) | 0 (0.0%) |
| Real Estate, Rental & Leasing | 0 (0.0%) | 0 (0.0%) |
| Professional & Scientific | 0 (0.0%) | 4 (100.0%) |
| Enterprise Management | 0 (0.0%) | 0 (0.0%) |
| Administrative & Support | 0 (0.0%) | 0 (0.0%) |
| Educational Services | 2 (100.0%) | 0 (0.0%) |
| Health Care & Social Assistance | 0 (0.0%) | 2 (100.0%) |
| Arts, Entertainment & Recreation | 12 (100.0%) | 0 (0.0%) |
| Accommodation & Food Services | 0 (0.0%) | 0 (0.0%) |
| Public Administration | 0 (0.0%) | 0 (0.0%) |
| Total | 40 (65.6%) | 21 (34.4%) |
Education in Jackson Lake
School Enrollment in Jackson Lake
The most common levels of schooling among the 40 students in Jackson Lake are middle school (15 | 37.5%), high school (14 | 35.0%), and college / undergraduate (8 | 20.0%).
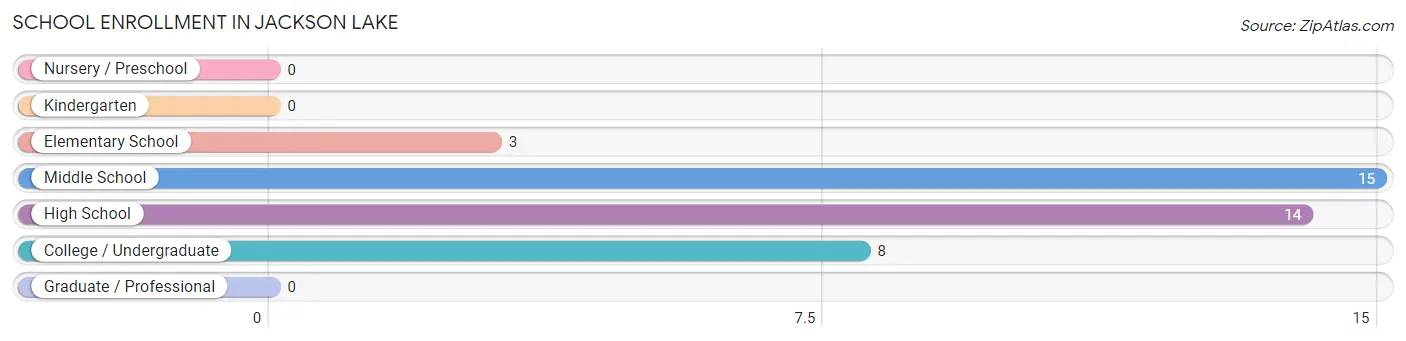
| School Level | # Students | % Students |
| Nursery / Preschool | 0 | 0.0% |
| Kindergarten | 0 | 0.0% |
| Elementary School | 3 | 7.5% |
| Middle School | 15 | 37.5% |
| High School | 14 | 35.0% |
| College / Undergraduate | 8 | 20.0% |
| Graduate / Professional | 0 | 0.0% |
| Total | 40 | 100.0% |
School Enrollment by Age by Funding Source in Jackson Lake
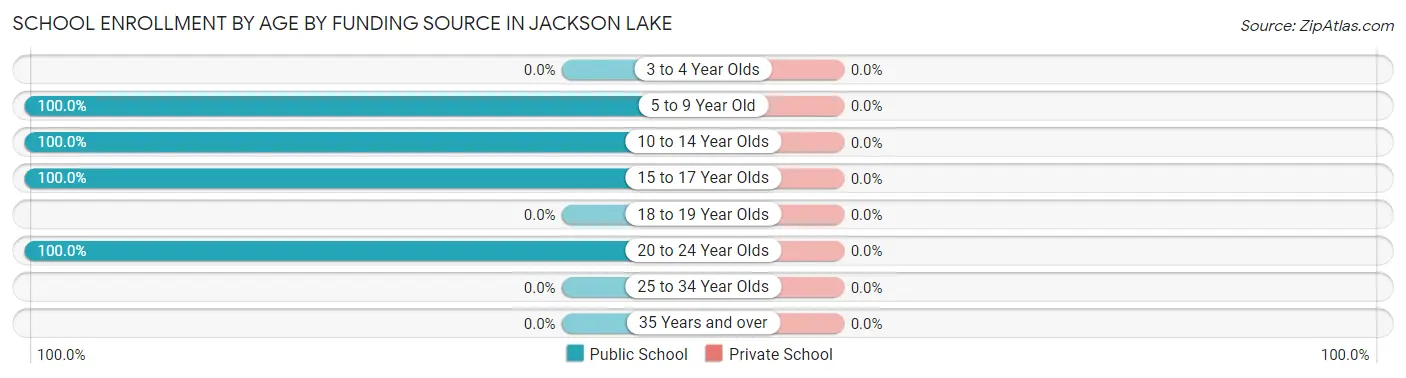
| Age Bracket | Public School | Private School |
| 3 to 4 Year Olds | 0 (0.0%) | 0 (0.0%) |
| 5 to 9 Year Old | 3 (100.0%) | 0 (0.0%) |
| 10 to 14 Year Olds | 18 (100.0%) | 0 (0.0%) |
| 15 to 17 Year Olds | 11 (100.0%) | 0 (0.0%) |
| 18 to 19 Year Olds | 0 (0.0%) | 0 (0.0%) |
| 20 to 24 Year Olds | 8 (100.0%) | 0 (0.0%) |
| 25 to 34 Year Olds | 0 (0.0%) | 0 (0.0%) |
| 35 Years and over | 0 (0.0%) | 0 (0.0%) |
| Total | 40 (100.0%) | 0 (0.0%) |
Educational Attainment by Field of Study in Jackson Lake
Psychology (3 | 21.4%), engineering (3 | 21.4%), business (3 | 21.4%), science & technology (2 | 14.3%), and arts & humanities (2 | 14.3%) are the most common fields of study among 14 individuals in Jackson Lake who have obtained a bachelor's degree or higher.
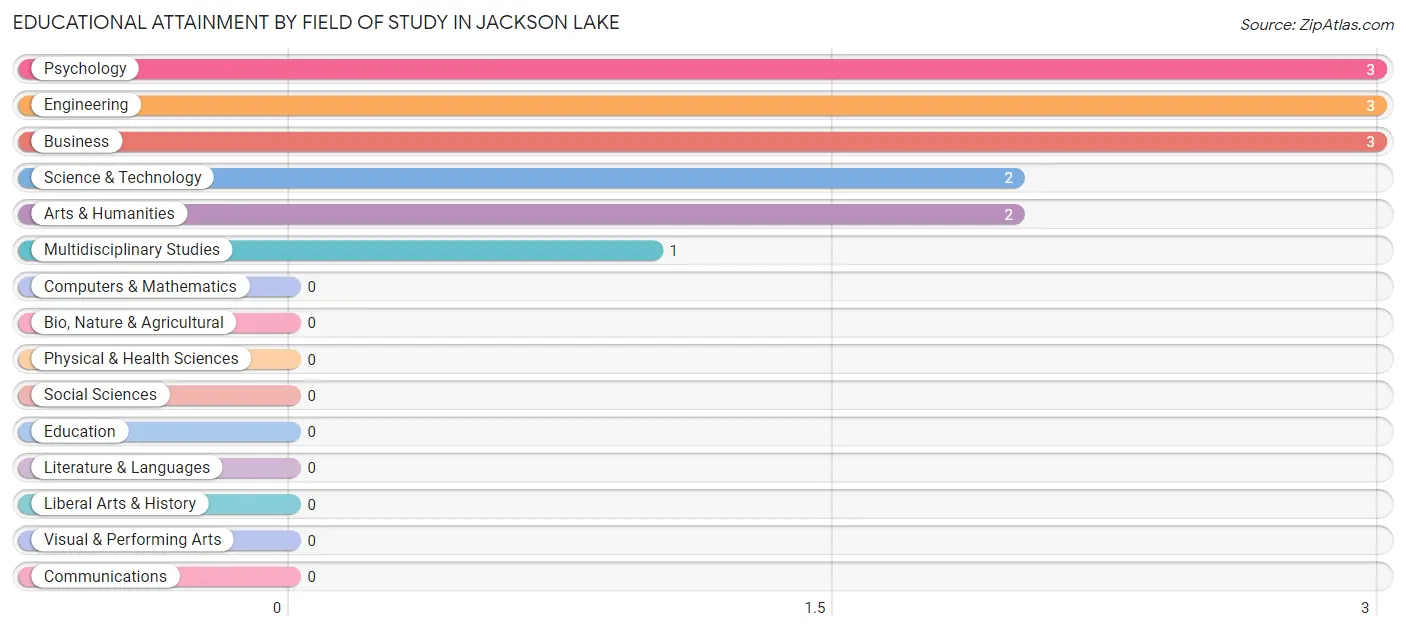
| Field of Study | # Graduates | % Graduates |
| Computers & Mathematics | 0 | 0.0% |
| Bio, Nature & Agricultural | 0 | 0.0% |
| Physical & Health Sciences | 0 | 0.0% |
| Psychology | 3 | 21.4% |
| Social Sciences | 0 | 0.0% |
| Engineering | 3 | 21.4% |
| Multidisciplinary Studies | 1 | 7.1% |
| Science & Technology | 2 | 14.3% |
| Business | 3 | 21.4% |
| Education | 0 | 0.0% |
| Literature & Languages | 0 | 0.0% |
| Liberal Arts & History | 0 | 0.0% |
| Visual & Performing Arts | 0 | 0.0% |
| Communications | 0 | 0.0% |
| Arts & Humanities | 2 | 14.3% |
| Total | 14 | 100.0% |
Transportation & Commute in Jackson Lake
Vehicle Availability by Sex in Jackson Lake
The most prevalent vehicle ownership categories in Jackson Lake are males with 5 or more vehicles (20, accounting for 50.0%) and females with 5 or more vehicles (0, making up 95.2%).
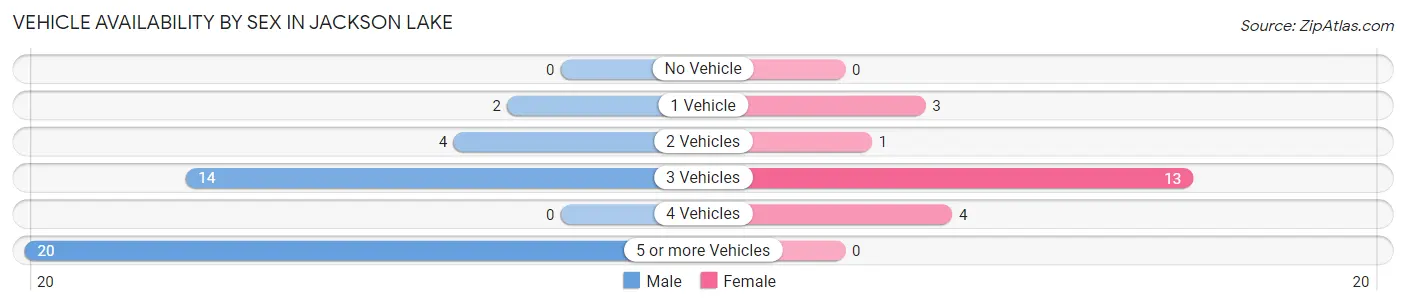
| Vehicles Available | Male | Female |
| No Vehicle | 0 (0.0%) | 0 (0.0%) |
| 1 Vehicle | 2 (5.0%) | 3 (14.3%) |
| 2 Vehicles | 4 (10.0%) | 1 (4.8%) |
| 3 Vehicles | 14 (35.0%) | 13 (61.9%) |
| 4 Vehicles | 0 (0.0%) | 4 (19.1%) |
| 5 or more Vehicles | 20 (50.0%) | 0 (0.0%) |
| Total | 40 (100.0%) | 21 (100.0%) |
Commute Time in Jackson Lake
The most frequently occuring commute durations in Jackson Lake are 60 to 89 minutes (13 commuters, 21.7%), 10 to 14 minutes (12 commuters, 20.0%), and 15 to 19 minutes (10 commuters, 16.7%).
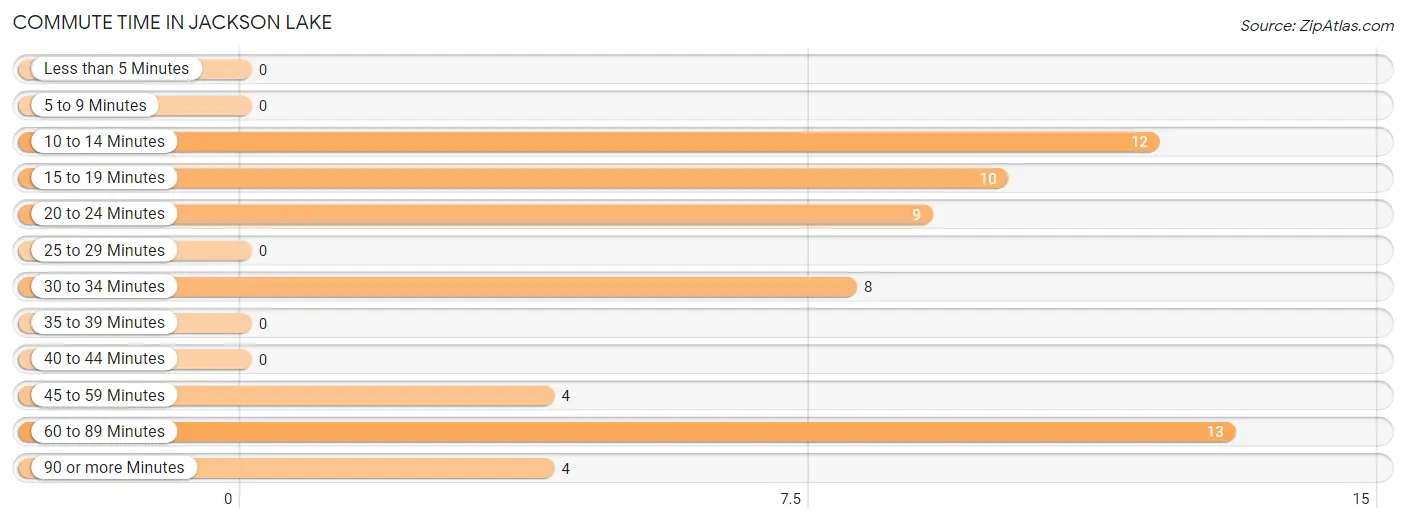
| Commute Time | # Commuters | % Commuters |
| Less than 5 Minutes | 0 | 0.0% |
| 5 to 9 Minutes | 0 | 0.0% |
| 10 to 14 Minutes | 12 | 20.0% |
| 15 to 19 Minutes | 10 | 16.7% |
| 20 to 24 Minutes | 9 | 15.0% |
| 25 to 29 Minutes | 0 | 0.0% |
| 30 to 34 Minutes | 8 | 13.3% |
| 35 to 39 Minutes | 0 | 0.0% |
| 40 to 44 Minutes | 0 | 0.0% |
| 45 to 59 Minutes | 4 | 6.7% |
| 60 to 89 Minutes | 13 | 21.7% |
| 90 or more Minutes | 4 | 6.7% |
Commute Time by Sex in Jackson Lake
The most common commute times in Jackson Lake are 10 to 14 minutes (12 commuters, 30.0%) for males and 20 to 24 minutes (9 commuters, 45.0%) for females.
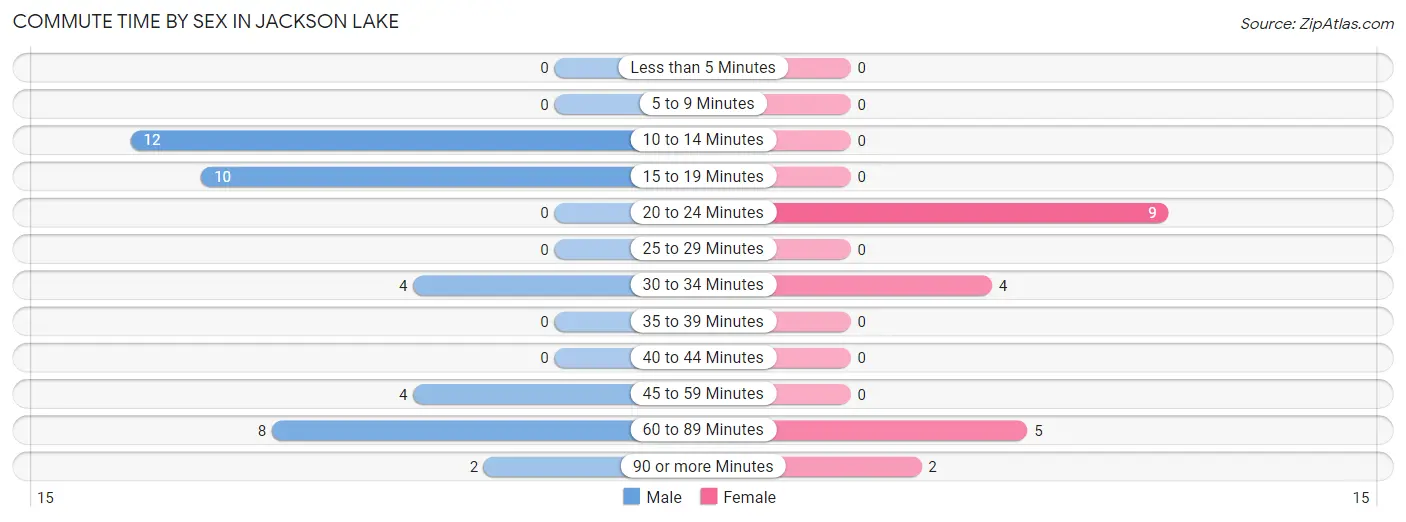
| Commute Time | Male | Female |
| Less than 5 Minutes | 0 (0.0%) | 0 (0.0%) |
| 5 to 9 Minutes | 0 (0.0%) | 0 (0.0%) |
| 10 to 14 Minutes | 12 (30.0%) | 0 (0.0%) |
| 15 to 19 Minutes | 10 (25.0%) | 0 (0.0%) |
| 20 to 24 Minutes | 0 (0.0%) | 9 (45.0%) |
| 25 to 29 Minutes | 0 (0.0%) | 0 (0.0%) |
| 30 to 34 Minutes | 4 (10.0%) | 4 (20.0%) |
| 35 to 39 Minutes | 0 (0.0%) | 0 (0.0%) |
| 40 to 44 Minutes | 0 (0.0%) | 0 (0.0%) |
| 45 to 59 Minutes | 4 (10.0%) | 0 (0.0%) |
| 60 to 89 Minutes | 8 (20.0%) | 5 (25.0%) |
| 90 or more Minutes | 2 (5.0%) | 2 (10.0%) |
Time of Departure to Work by Sex in Jackson Lake
The most frequent times of departure to work in Jackson Lake are 7:00 AM to 7:29 AM (12, 30.0%) for males and 7:30 AM to 7:59 AM (8, 40.0%) for females.
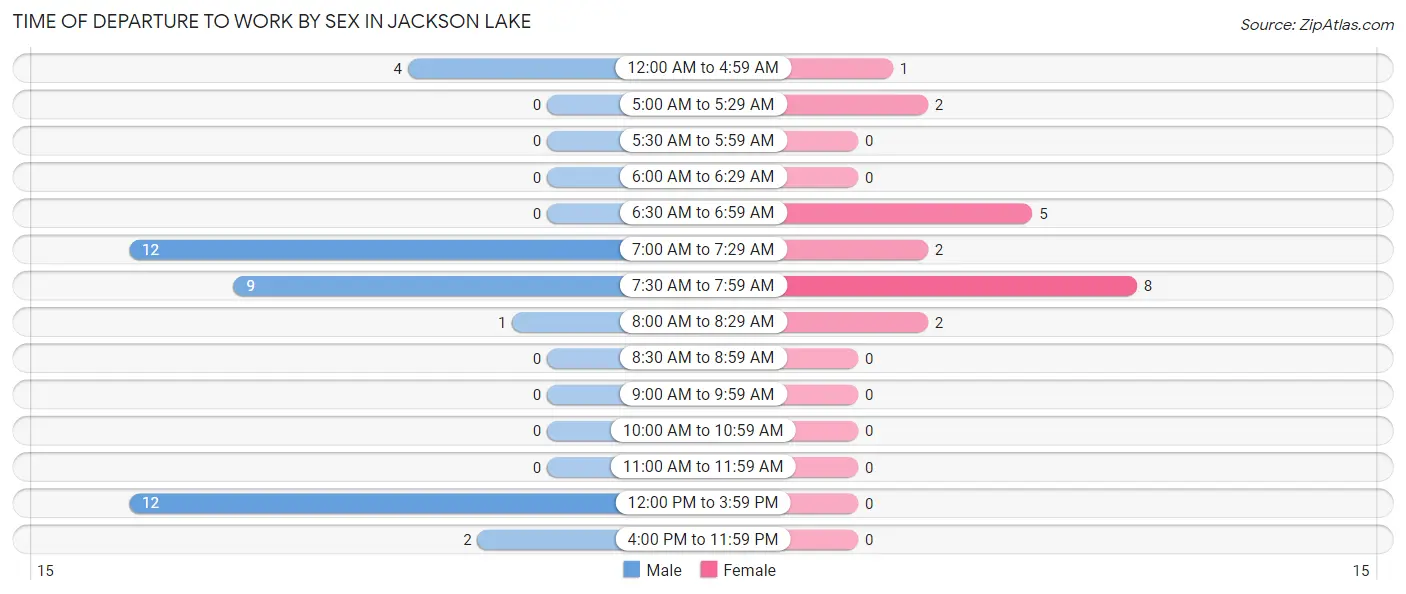
| Time of Departure | Male | Female |
| 12:00 AM to 4:59 AM | 4 (10.0%) | 1 (5.0%) |
| 5:00 AM to 5:29 AM | 0 (0.0%) | 2 (10.0%) |
| 5:30 AM to 5:59 AM | 0 (0.0%) | 0 (0.0%) |
| 6:00 AM to 6:29 AM | 0 (0.0%) | 0 (0.0%) |
| 6:30 AM to 6:59 AM | 0 (0.0%) | 5 (25.0%) |
| 7:00 AM to 7:29 AM | 12 (30.0%) | 2 (10.0%) |
| 7:30 AM to 7:59 AM | 9 (22.5%) | 8 (40.0%) |
| 8:00 AM to 8:29 AM | 1 (2.5%) | 2 (10.0%) |
| 8:30 AM to 8:59 AM | 0 (0.0%) | 0 (0.0%) |
| 9:00 AM to 9:59 AM | 0 (0.0%) | 0 (0.0%) |
| 10:00 AM to 10:59 AM | 0 (0.0%) | 0 (0.0%) |
| 11:00 AM to 11:59 AM | 0 (0.0%) | 0 (0.0%) |
| 12:00 PM to 3:59 PM | 12 (30.0%) | 0 (0.0%) |
| 4:00 PM to 11:59 PM | 2 (5.0%) | 0 (0.0%) |
| Total | 40 (100.0%) | 20 (100.0%) |
Housing Occupancy in Jackson Lake
Occupancy by Ownership in Jackson Lake
Of the total 71 dwellings in Jackson Lake, owner-occupied units account for 61 (85.9%), while renter-occupied units make up 10 (14.1%).
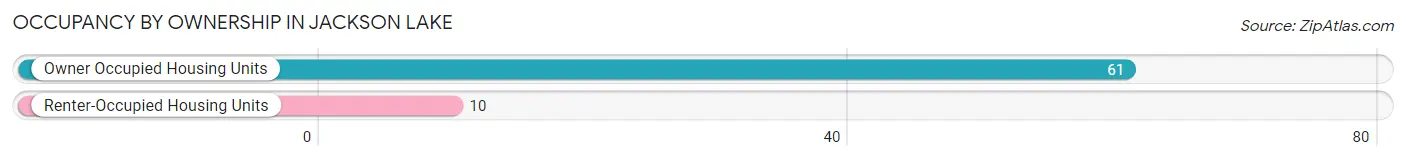
| Occupancy | # Housing Units | % Housing Units |
| Owner Occupied Housing Units | 61 | 85.9% |
| Renter-Occupied Housing Units | 10 | 14.1% |
| Total Occupied Housing Units | 71 | 100.0% |
Occupancy by Household Size in Jackson Lake
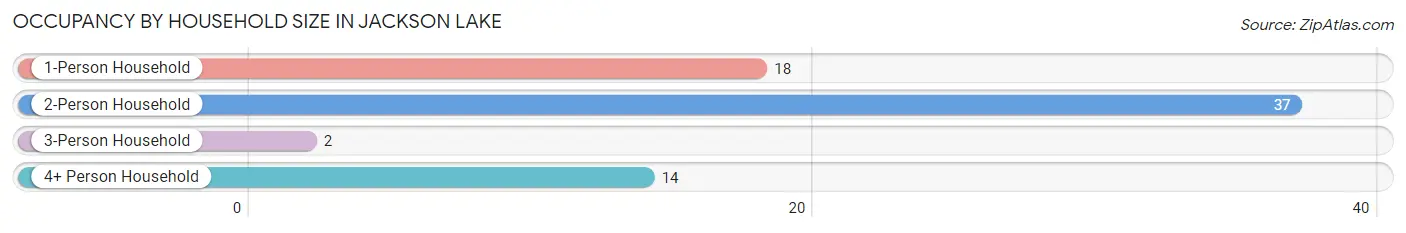
| Household Size | # Housing Units | % Housing Units |
| 1-Person Household | 18 | 25.4% |
| 2-Person Household | 37 | 52.1% |
| 3-Person Household | 2 | 2.8% |
| 4+ Person Household | 14 | 19.7% |
| Total Housing Units | 71 | 100.0% |
Occupancy by Ownership by Household Size in Jackson Lake
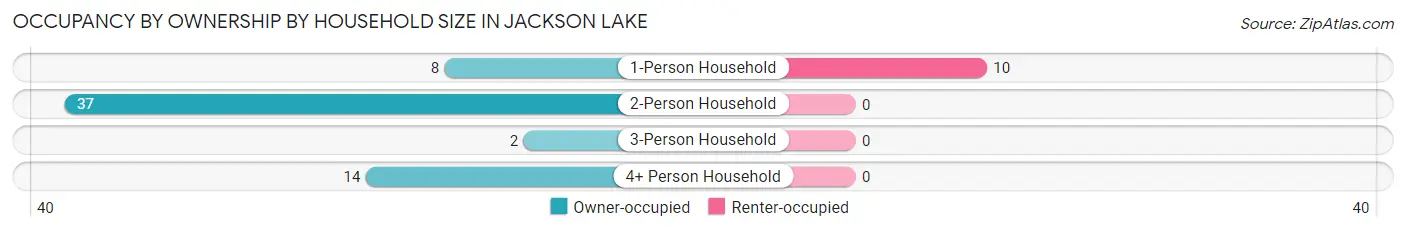
| Household Size | Owner-occupied | Renter-occupied |
| 1-Person Household | 8 (44.4%) | 10 (55.6%) |
| 2-Person Household | 37 (100.0%) | 0 (0.0%) |
| 3-Person Household | 2 (100.0%) | 0 (0.0%) |
| 4+ Person Household | 14 (100.0%) | 0 (0.0%) |
| Total Housing Units | 61 (85.9%) | 10 (14.1%) |
Occupancy by Educational Attainment in Jackson Lake
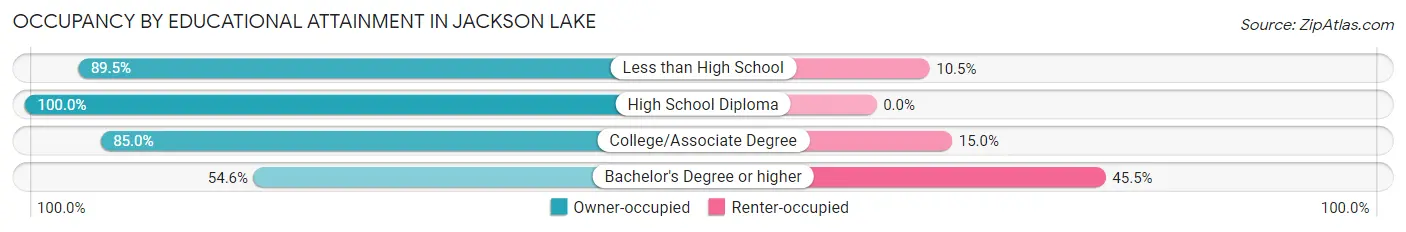
| Household Size | Owner-occupied | Renter-occupied |
| Less than High School | 17 (89.5%) | 2 (10.5%) |
| High School Diploma | 21 (100.0%) | 0 (0.0%) |
| College/Associate Degree | 17 (85.0%) | 3 (15.0%) |
| Bachelor's Degree or higher | 6 (54.5%) | 5 (45.5%) |
Occupancy by Age of Householder in Jackson Lake
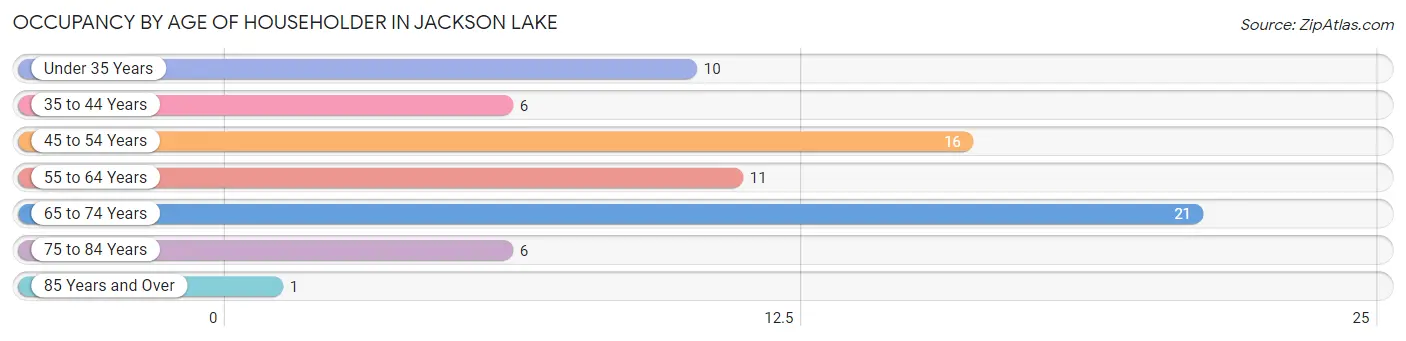
| Age Bracket | # Households | % Households |
| Under 35 Years | 10 | 14.1% |
| 35 to 44 Years | 6 | 8.5% |
| 45 to 54 Years | 16 | 22.5% |
| 55 to 64 Years | 11 | 15.5% |
| 65 to 74 Years | 21 | 29.6% |
| 75 to 84 Years | 6 | 8.5% |
| 85 Years and Over | 1 | 1.4% |
| Total | 71 | 100.0% |
Housing Finances in Jackson Lake
Median Income by Occupancy in Jackson Lake
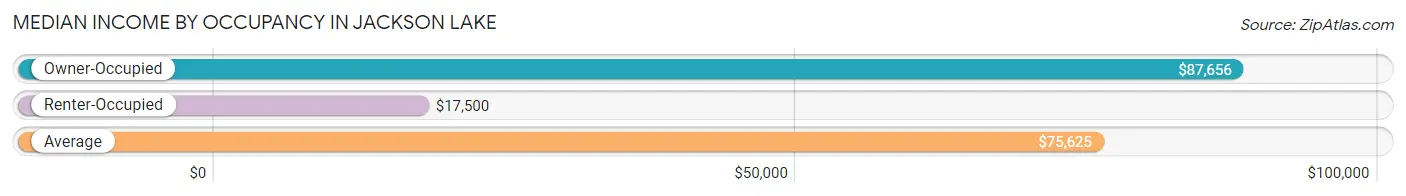
| Occupancy Type | # Households | Median Income |
| Owner-Occupied | 61 (85.9%) | $87,656 |
| Renter-Occupied | 10 (14.1%) | $17,500 |
| Average | 71 (100.0%) | $75,625 |
Occupancy by Householder Income Bracket in Jackson Lake
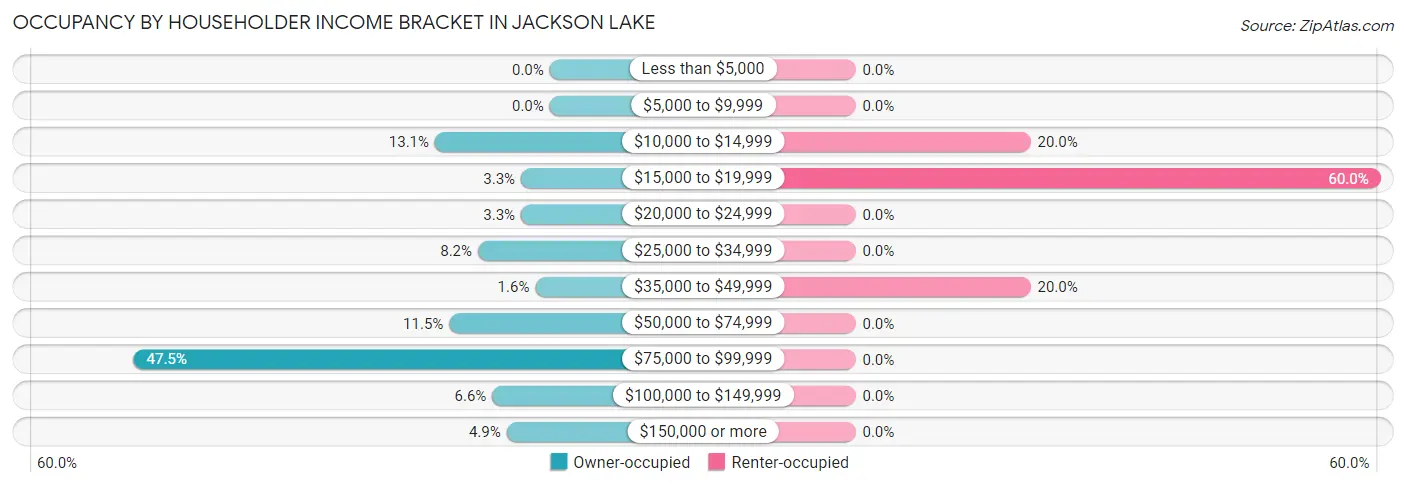
| Income Bracket | Owner-occupied | Renter-occupied |
| Less than $5,000 | 0 (0.0%) | 0 (0.0%) |
| $5,000 to $9,999 | 0 (0.0%) | 0 (0.0%) |
| $10,000 to $14,999 | 8 (13.1%) | 2 (20.0%) |
| $15,000 to $19,999 | 2 (3.3%) | 6 (60.0%) |
| $20,000 to $24,999 | 2 (3.3%) | 0 (0.0%) |
| $25,000 to $34,999 | 5 (8.2%) | 0 (0.0%) |
| $35,000 to $49,999 | 1 (1.6%) | 2 (20.0%) |
| $50,000 to $74,999 | 7 (11.5%) | 0 (0.0%) |
| $75,000 to $99,999 | 29 (47.5%) | 0 (0.0%) |
| $100,000 to $149,999 | 4 (6.6%) | 0 (0.0%) |
| $150,000 or more | 3 (4.9%) | 0 (0.0%) |
| Total | 61 (100.0%) | 10 (100.0%) |
Monthly Housing Cost Tiers in Jackson Lake
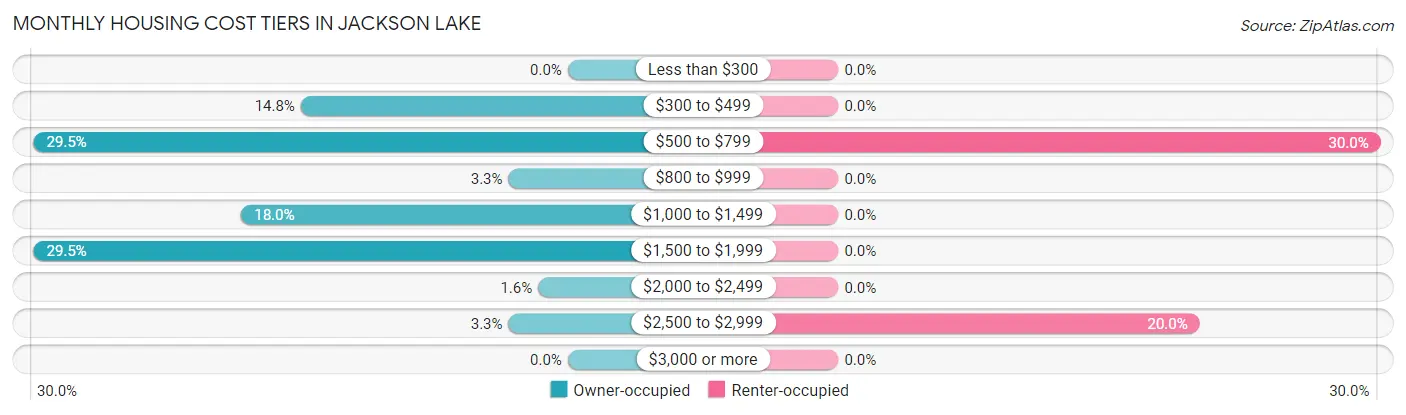
| Monthly Cost | Owner-occupied | Renter-occupied |
| Less than $300 | 0 (0.0%) | 0 (0.0%) |
| $300 to $499 | 9 (14.7%) | 0 (0.0%) |
| $500 to $799 | 18 (29.5%) | 3 (30.0%) |
| $800 to $999 | 2 (3.3%) | 0 (0.0%) |
| $1,000 to $1,499 | 11 (18.0%) | 0 (0.0%) |
| $1,500 to $1,999 | 18 (29.5%) | 0 (0.0%) |
| $2,000 to $2,499 | 1 (1.6%) | 0 (0.0%) |
| $2,500 to $2,999 | 2 (3.3%) | 2 (20.0%) |
| $3,000 or more | 0 (0.0%) | 0 (0.0%) |
| Total | 61 (100.0%) | 10 (100.0%) |
Physical Housing Characteristics in Jackson Lake
Housing Structures in Jackson Lake
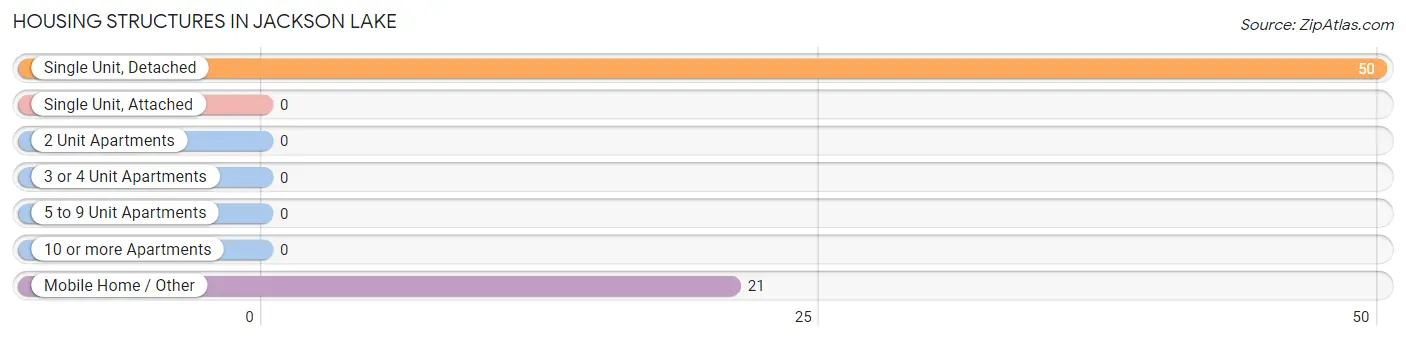
| Structure Type | # Housing Units | % Housing Units |
| Single Unit, Detached | 50 | 70.4% |
| Single Unit, Attached | 0 | 0.0% |
| 2 Unit Apartments | 0 | 0.0% |
| 3 or 4 Unit Apartments | 0 | 0.0% |
| 5 to 9 Unit Apartments | 0 | 0.0% |
| 10 or more Apartments | 0 | 0.0% |
| Mobile Home / Other | 21 | 29.6% |
| Total | 71 | 100.0% |
Housing Structures by Occupancy in Jackson Lake
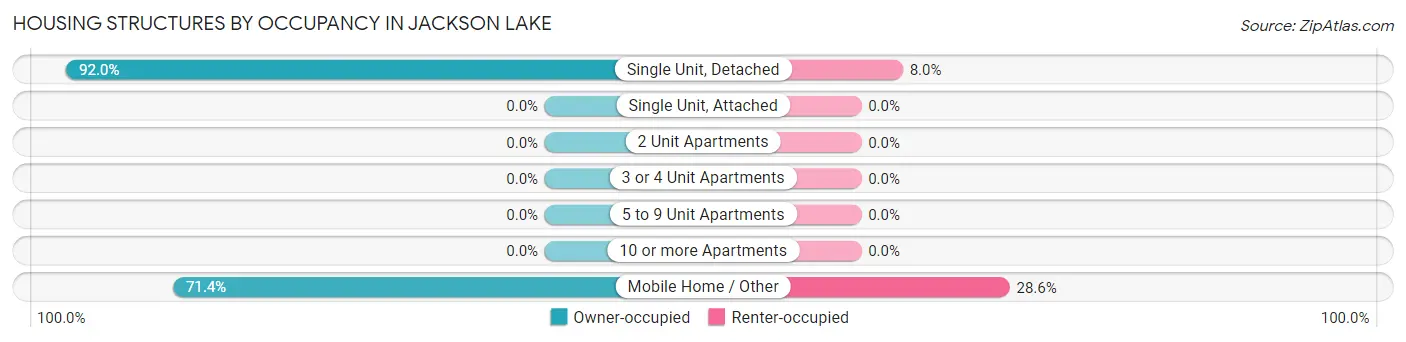
| Structure Type | Owner-occupied | Renter-occupied |
| Single Unit, Detached | 46 (92.0%) | 4 (8.0%) |
| Single Unit, Attached | 0 (0.0%) | 0 (0.0%) |
| 2 Unit Apartments | 0 (0.0%) | 0 (0.0%) |
| 3 or 4 Unit Apartments | 0 (0.0%) | 0 (0.0%) |
| 5 to 9 Unit Apartments | 0 (0.0%) | 0 (0.0%) |
| 10 or more Apartments | 0 (0.0%) | 0 (0.0%) |
| Mobile Home / Other | 15 (71.4%) | 6 (28.6%) |
| Total | 61 (85.9%) | 10 (14.1%) |
Housing Structures by Number of Rooms in Jackson Lake
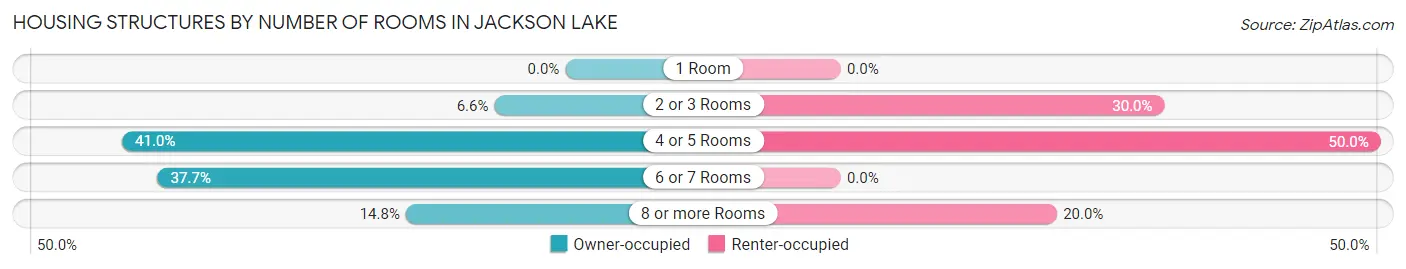
| Number of Rooms | Owner-occupied | Renter-occupied |
| 1 Room | 0 (0.0%) | 0 (0.0%) |
| 2 or 3 Rooms | 4 (6.6%) | 3 (30.0%) |
| 4 or 5 Rooms | 25 (41.0%) | 5 (50.0%) |
| 6 or 7 Rooms | 23 (37.7%) | 0 (0.0%) |
| 8 or more Rooms | 9 (14.7%) | 2 (20.0%) |
| Total | 61 (100.0%) | 10 (100.0%) |
Housing Structure by Heating Type in Jackson Lake
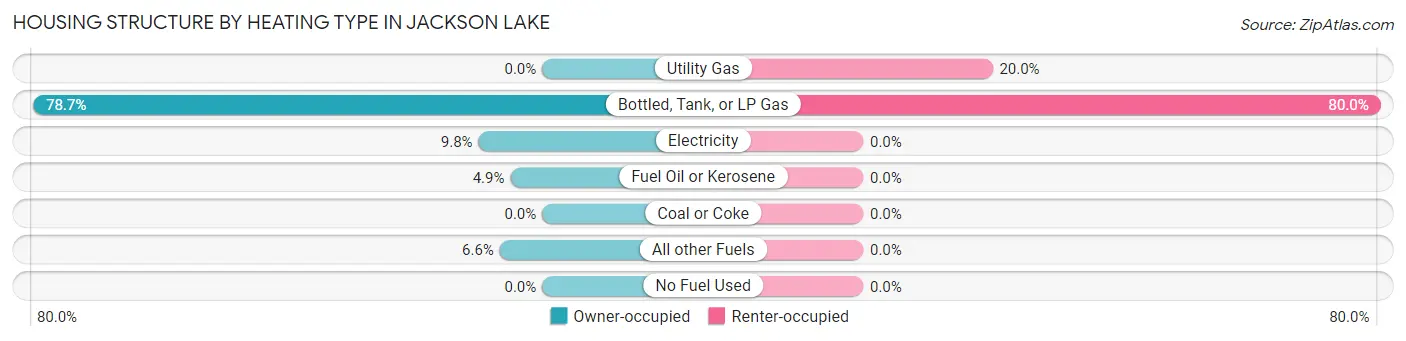
| Heating Type | Owner-occupied | Renter-occupied |
| Utility Gas | 0 (0.0%) | 2 (20.0%) |
| Bottled, Tank, or LP Gas | 48 (78.7%) | 8 (80.0%) |
| Electricity | 6 (9.8%) | 0 (0.0%) |
| Fuel Oil or Kerosene | 3 (4.9%) | 0 (0.0%) |
| Coal or Coke | 0 (0.0%) | 0 (0.0%) |
| All other Fuels | 4 (6.6%) | 0 (0.0%) |
| No Fuel Used | 0 (0.0%) | 0 (0.0%) |
| Total | 61 (100.0%) | 10 (100.0%) |
Household Vehicle Usage in Jackson Lake
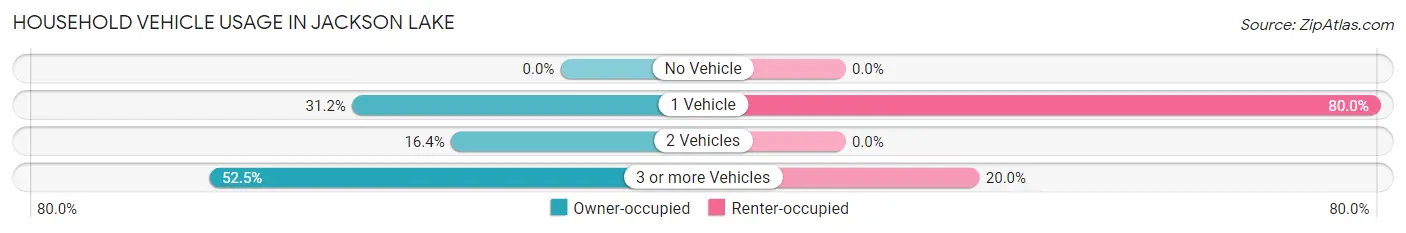
| Vehicles per Household | Owner-occupied | Renter-occupied |
| No Vehicle | 0 (0.0%) | 0 (0.0%) |
| 1 Vehicle | 19 (31.1%) | 8 (80.0%) |
| 2 Vehicles | 10 (16.4%) | 0 (0.0%) |
| 3 or more Vehicles | 32 (52.5%) | 2 (20.0%) |
| Total | 61 (100.0%) | 10 (100.0%) |
Real Estate & Mortgages in Jackson Lake
Real Estate and Mortgage Overview in Jackson Lake
| Characteristic | Without Mortgage | With Mortgage |
| Housing Units | 29 | 32 |
| Median Property Value | $369,400 | $343,800 |
| Median Household Income | $87,813 | $0 |
| Monthly Housing Costs | $539 | $0 |
| Real Estate Taxes | $2,033 | $4 |
Property Value by Mortgage Status in Jackson Lake
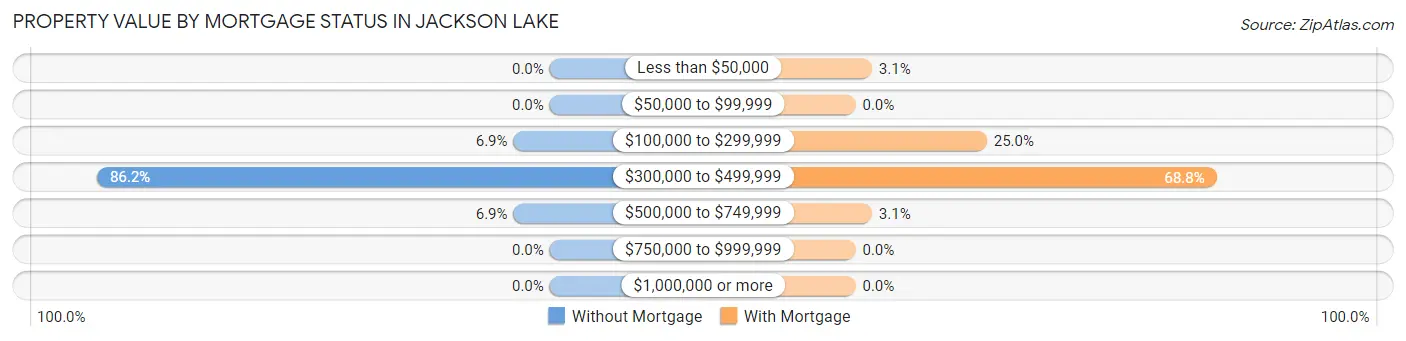
| Property Value | Without Mortgage | With Mortgage |
| Less than $50,000 | 0 (0.0%) | 1 (3.1%) |
| $50,000 to $99,999 | 0 (0.0%) | 0 (0.0%) |
| $100,000 to $299,999 | 2 (6.9%) | 8 (25.0%) |
| $300,000 to $499,999 | 25 (86.2%) | 22 (68.8%) |
| $500,000 to $749,999 | 2 (6.9%) | 1 (3.1%) |
| $750,000 to $999,999 | 0 (0.0%) | 0 (0.0%) |
| $1,000,000 or more | 0 (0.0%) | 0 (0.0%) |
| Total | 29 (100.0%) | 32 (100.0%) |
Household Income by Mortgage Status in Jackson Lake
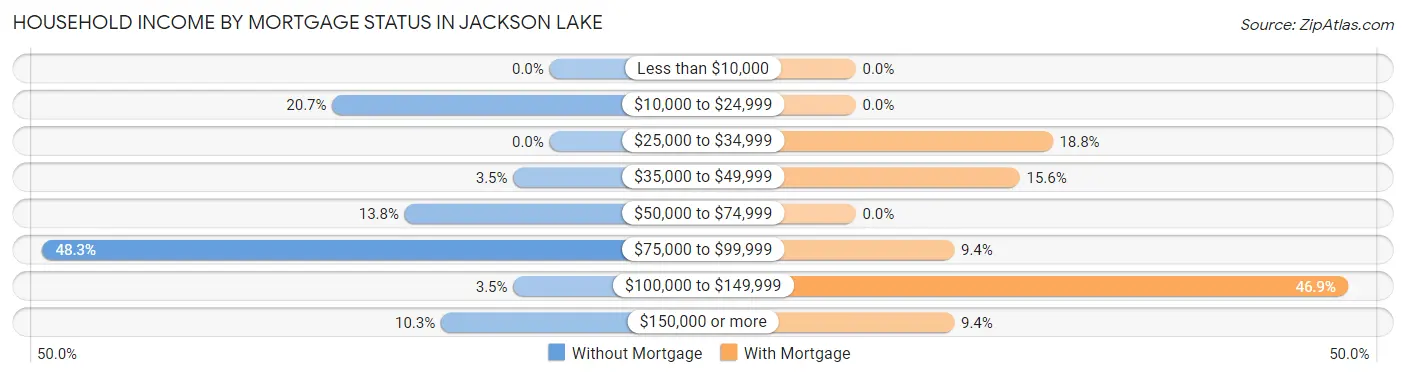
| Household Income | Without Mortgage | With Mortgage |
| Less than $10,000 | 0 (0.0%) | 0 (0.0%) |
| $10,000 to $24,999 | 6 (20.7%) | 0 (0.0%) |
| $25,000 to $34,999 | 0 (0.0%) | 6 (18.8%) |
| $35,000 to $49,999 | 1 (3.5%) | 5 (15.6%) |
| $50,000 to $74,999 | 4 (13.8%) | 0 (0.0%) |
| $75,000 to $99,999 | 14 (48.3%) | 3 (9.4%) |
| $100,000 to $149,999 | 1 (3.5%) | 15 (46.9%) |
| $150,000 or more | 3 (10.3%) | 3 (9.4%) |
| Total | 29 (100.0%) | 32 (100.0%) |
Property Value to Household Income Ratio in Jackson Lake
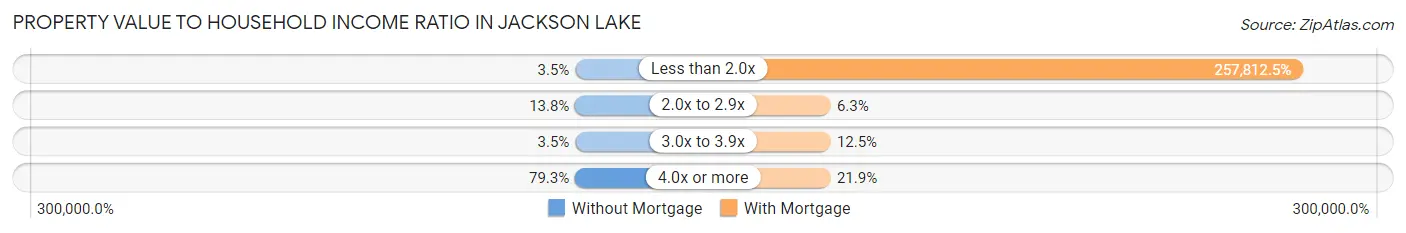
| Value-to-Income Ratio | Without Mortgage | With Mortgage |
| Less than 2.0x | 1 (3.5%) | 82,500 (257,812.5%) |
| 2.0x to 2.9x | 4 (13.8%) | 2 (6.2%) |
| 3.0x to 3.9x | 1 (3.5%) | 4 (12.5%) |
| 4.0x or more | 23 (79.3%) | 7 (21.9%) |
| Total | 29 (100.0%) | 32 (100.0%) |
Real Estate Taxes by Mortgage Status in Jackson Lake
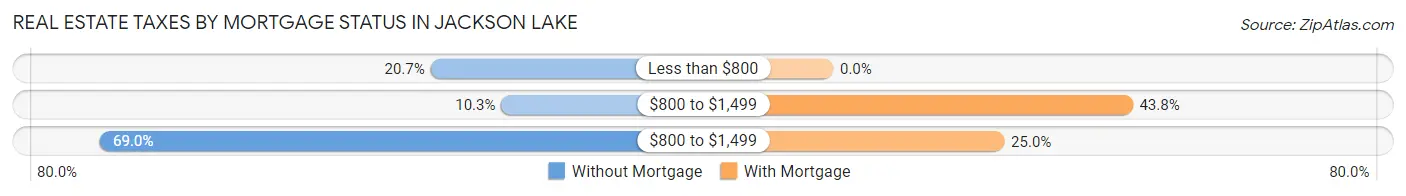
| Property Taxes | Without Mortgage | With Mortgage |
| Less than $800 | 6 (20.7%) | 0 (0.0%) |
| $800 to $1,499 | 3 (10.3%) | 14 (43.8%) |
| $800 to $1,499 | 20 (69.0%) | 8 (25.0%) |
| Total | 29 (100.0%) | 32 (100.0%) |
Health & Disability in Jackson Lake
Health Insurance Coverage by Age in Jackson Lake
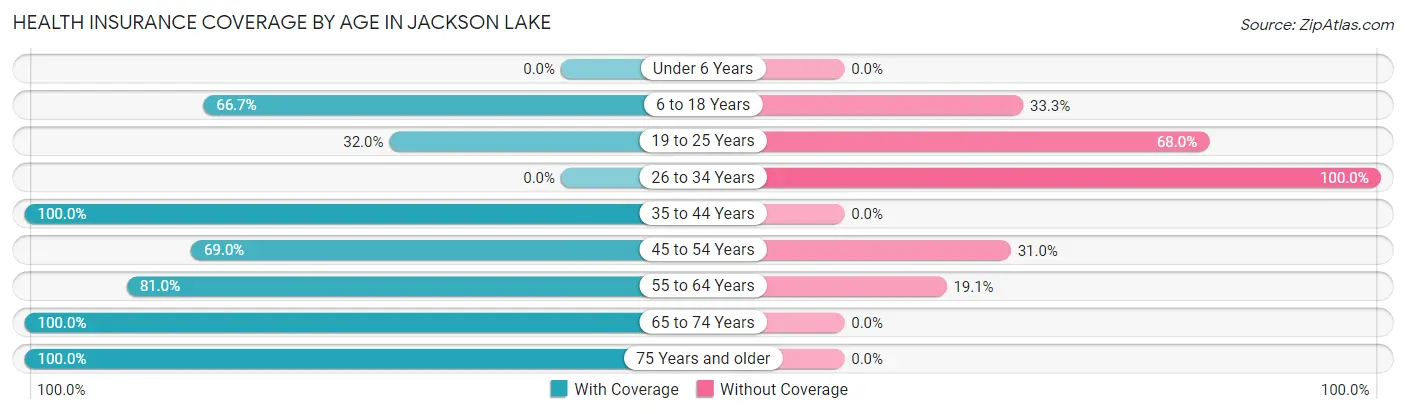
| Age Bracket | With Coverage | Without Coverage |
| Under 6 Years | 0 (0.0%) | 0 (0.0%) |
| 6 to 18 Years | 26 (66.7%) | 13 (33.3%) |
| 19 to 25 Years | 8 (32.0%) | 17 (68.0%) |
| 26 to 34 Years | 0 (0.0%) | 4 (100.0%) |
| 35 to 44 Years | 8 (100.0%) | 0 (0.0%) |
| 45 to 54 Years | 20 (69.0%) | 9 (31.0%) |
| 55 to 64 Years | 17 (80.9%) | 4 (19.1%) |
| 65 to 74 Years | 26 (100.0%) | 0 (0.0%) |
| 75 Years and older | 13 (100.0%) | 0 (0.0%) |
| Total | 118 (71.5%) | 47 (28.5%) |
Health Insurance Coverage by Citizenship Status in Jackson Lake
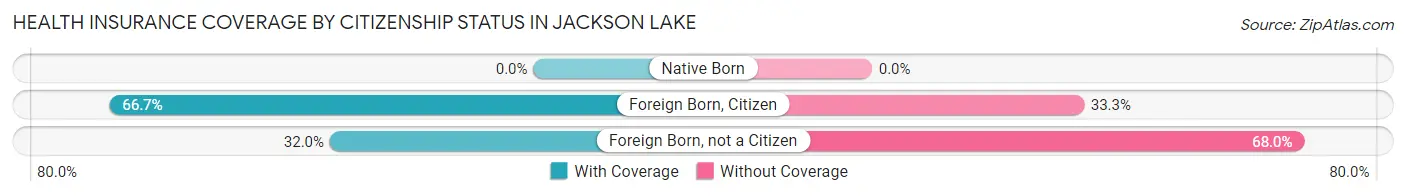
| Citizenship Status | With Coverage | Without Coverage |
| Native Born | 0 (0.0%) | 0 (0.0%) |
| Foreign Born, Citizen | 26 (66.7%) | 13 (33.3%) |
| Foreign Born, not a Citizen | 8 (32.0%) | 17 (68.0%) |
Health Insurance Coverage by Household Income in Jackson Lake
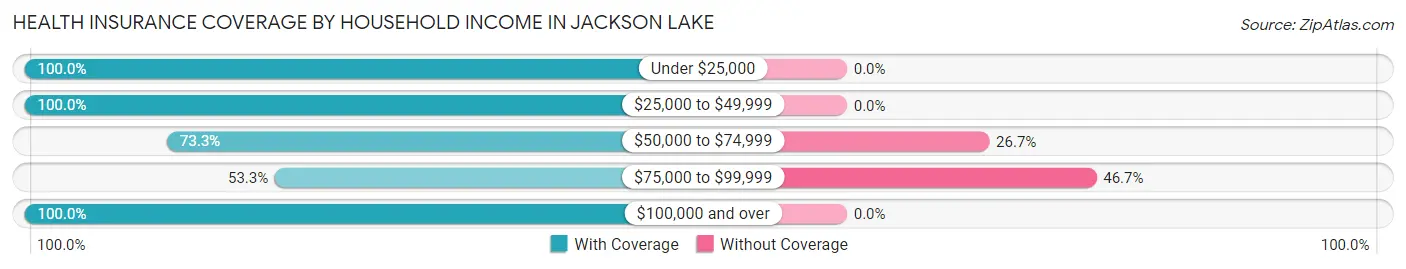
| Household Income | With Coverage | Without Coverage |
| Under $25,000 | 31 (100.0%) | 0 (0.0%) |
| $25,000 to $49,999 | 14 (100.0%) | 0 (0.0%) |
| $50,000 to $74,999 | 11 (73.3%) | 4 (26.7%) |
| $75,000 to $99,999 | 49 (53.3%) | 43 (46.7%) |
| $100,000 and over | 13 (100.0%) | 0 (0.0%) |
Public vs Private Health Insurance Coverage by Age in Jackson Lake
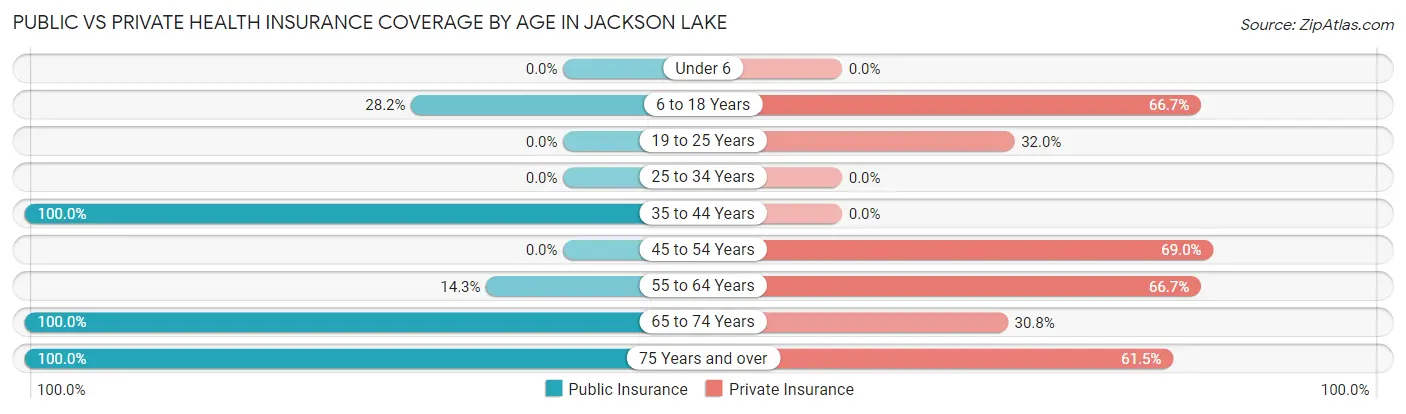
| Age Bracket | Public Insurance | Private Insurance |
| Under 6 | 0 (0.0%) | 0 (0.0%) |
| 6 to 18 Years | 11 (28.2%) | 26 (66.7%) |
| 19 to 25 Years | 0 (0.0%) | 8 (32.0%) |
| 25 to 34 Years | 0 (0.0%) | 0 (0.0%) |
| 35 to 44 Years | 8 (100.0%) | 0 (0.0%) |
| 45 to 54 Years | 0 (0.0%) | 20 (69.0%) |
| 55 to 64 Years | 3 (14.3%) | 14 (66.7%) |
| 65 to 74 Years | 26 (100.0%) | 8 (30.8%) |
| 75 Years and over | 13 (100.0%) | 8 (61.5%) |
| Total | 61 (37.0%) | 84 (50.9%) |
Disability Status by Sex by Age in Jackson Lake
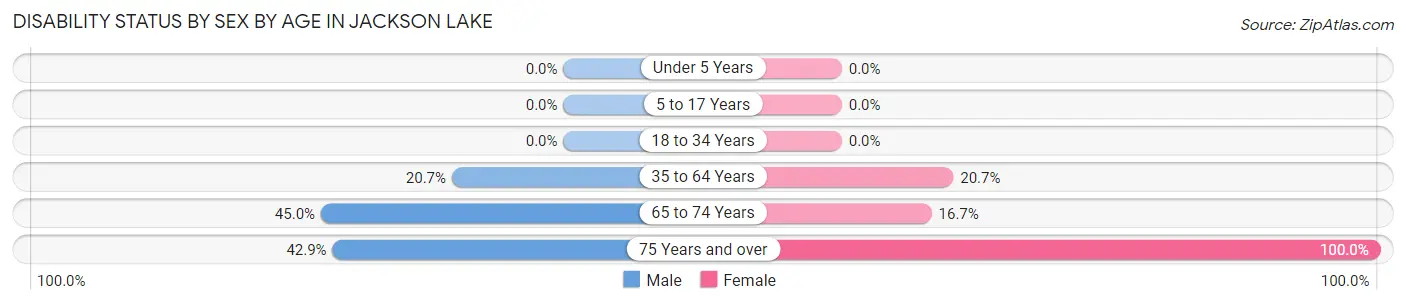
| Age Bracket | Male | Female |
| Under 5 Years | 0 (0.0%) | 0 (0.0%) |
| 5 to 17 Years | 0 (0.0%) | 0 (0.0%) |
| 18 to 34 Years | 0 (0.0%) | 0 (0.0%) |
| 35 to 64 Years | 6 (20.7%) | 6 (20.7%) |
| 65 to 74 Years | 9 (45.0%) | 1 (16.7%) |
| 75 Years and over | 3 (42.9%) | 6 (100.0%) |
Disability Class by Sex by Age in Jackson Lake
Disability Class: Hearing Difficulty
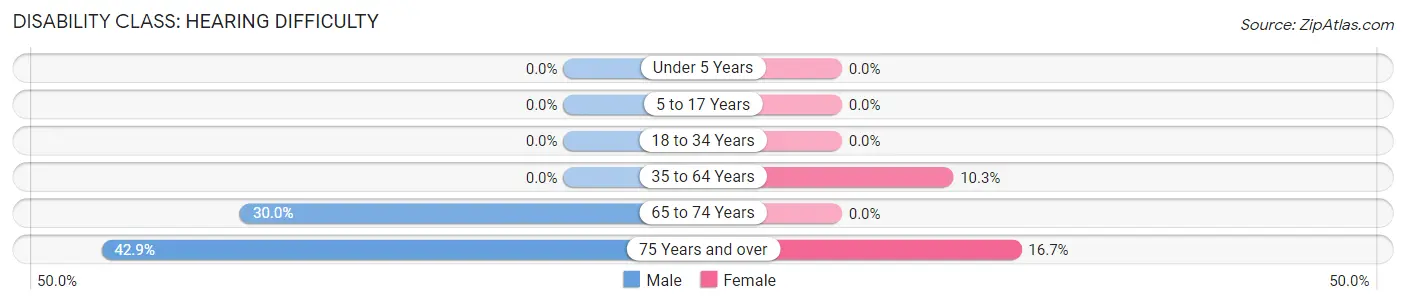
| Age Bracket | Male | Female |
| Under 5 Years | 0 (0.0%) | 0 (0.0%) |
| 5 to 17 Years | 0 (0.0%) | 0 (0.0%) |
| 18 to 34 Years | 0 (0.0%) | 0 (0.0%) |
| 35 to 64 Years | 0 (0.0%) | 3 (10.3%) |
| 65 to 74 Years | 6 (30.0%) | 0 (0.0%) |
| 75 Years and over | 3 (42.9%) | 1 (16.7%) |
Disability Class: Vision Difficulty
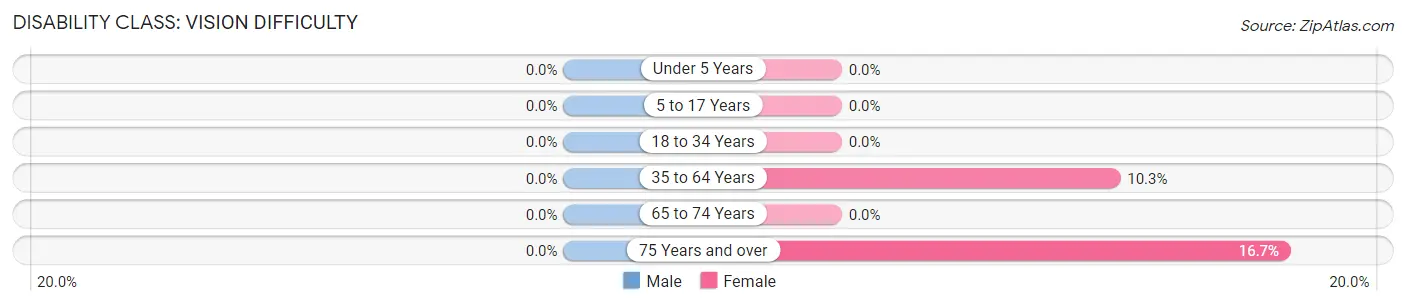
| Age Bracket | Male | Female |
| Under 5 Years | 0 (0.0%) | 0 (0.0%) |
| 5 to 17 Years | 0 (0.0%) | 0 (0.0%) |
| 18 to 34 Years | 0 (0.0%) | 0 (0.0%) |
| 35 to 64 Years | 0 (0.0%) | 3 (10.3%) |
| 65 to 74 Years | 0 (0.0%) | 0 (0.0%) |
| 75 Years and over | 0 (0.0%) | 1 (16.7%) |
Disability Class: Cognitive Difficulty
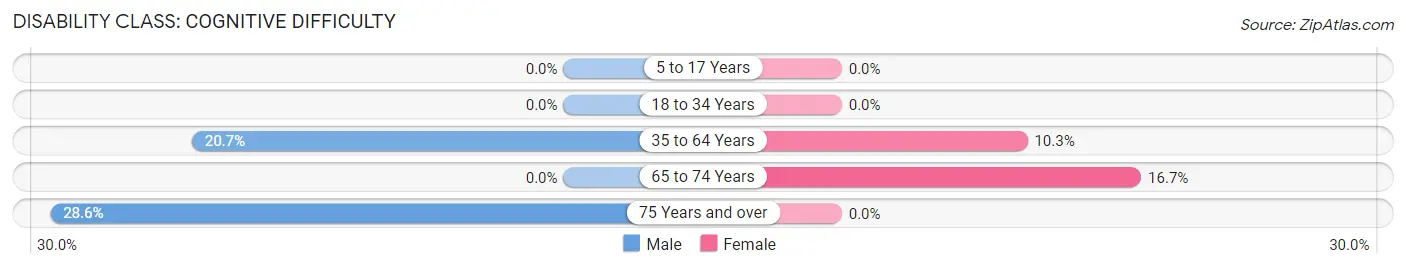
| Age Bracket | Male | Female |
| 5 to 17 Years | 0 (0.0%) | 0 (0.0%) |
| 18 to 34 Years | 0 (0.0%) | 0 (0.0%) |
| 35 to 64 Years | 6 (20.7%) | 3 (10.3%) |
| 65 to 74 Years | 0 (0.0%) | 1 (16.7%) |
| 75 Years and over | 2 (28.6%) | 0 (0.0%) |
Disability Class: Ambulatory Difficulty
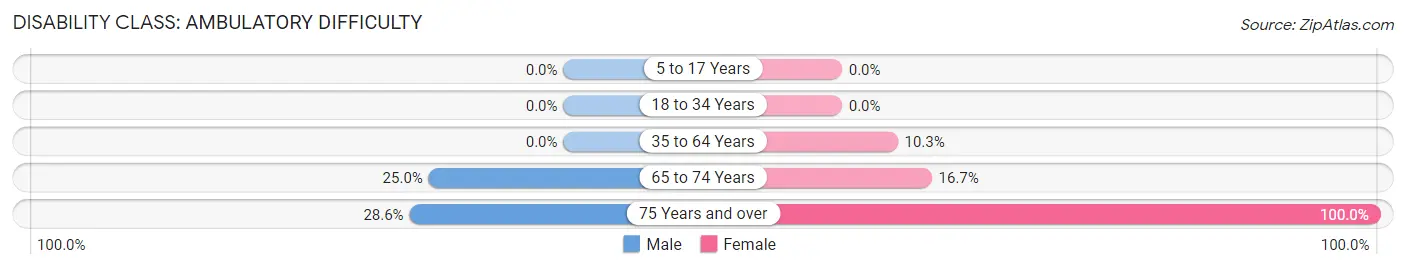
| Age Bracket | Male | Female |
| 5 to 17 Years | 0 (0.0%) | 0 (0.0%) |
| 18 to 34 Years | 0 (0.0%) | 0 (0.0%) |
| 35 to 64 Years | 0 (0.0%) | 3 (10.3%) |
| 65 to 74 Years | 5 (25.0%) | 1 (16.7%) |
| 75 Years and over | 2 (28.6%) | 6 (100.0%) |
Disability Class: Self-Care Difficulty
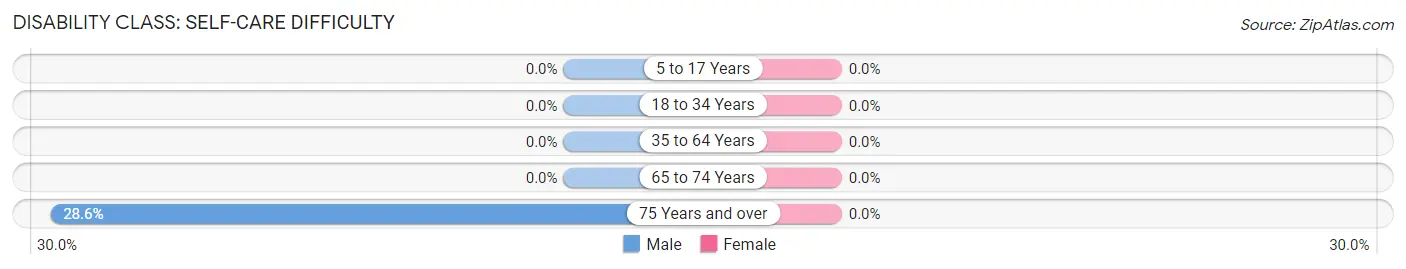
| Age Bracket | Male | Female |
| 5 to 17 Years | 0 (0.0%) | 0 (0.0%) |
| 18 to 34 Years | 0 (0.0%) | 0 (0.0%) |
| 35 to 64 Years | 0 (0.0%) | 0 (0.0%) |
| 65 to 74 Years | 0 (0.0%) | 0 (0.0%) |
| 75 Years and over | 2 (28.6%) | 0 (0.0%) |
Technology Access in Jackson Lake
Computing Device Access in Jackson Lake
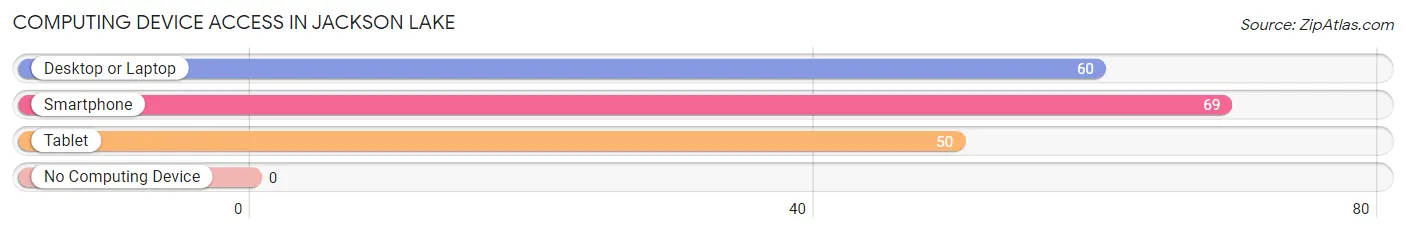
| Device Type | # Households | % Households |
| Desktop or Laptop | 60 | 84.5% |
| Smartphone | 69 | 97.2% |
| Tablet | 50 | 70.4% |
| No Computing Device | 0 | 0.0% |
| Total | 71 | 100.0% |
Internet Access in Jackson Lake
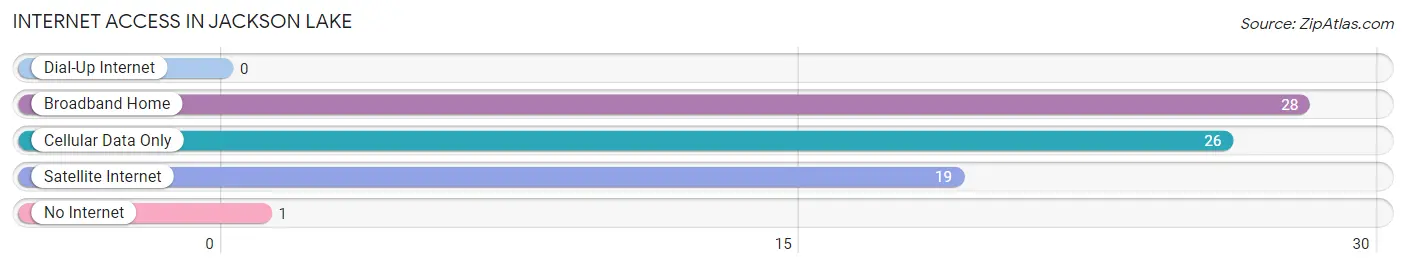
| Internet Type | # Households | % Households |
| Dial-Up Internet | 0 | 0.0% |
| Broadband Home | 28 | 39.4% |
| Cellular Data Only | 26 | 36.6% |
| Satellite Internet | 19 | 26.8% |
| No Internet | 1 | 1.4% |
| Total | 71 | 100.0% |
Jackson Lake Summary
Jackson Lake is a small town located in the state of Colorado, in the United States. It is situated in the northeastern corner of the state, in Jackson County. The town is located on the banks of the North Platte River, and is surrounded by the Medicine Bow National Forest. The town has a population of just over 200 people, and is a popular destination for outdoor recreation.
History
The area around Jackson Lake has been inhabited for thousands of years by Native American tribes, including the Arapaho, Cheyenne, and Ute. The first European settlers arrived in the area in the late 1800s, and the town of Jackson Lake was established in 1887. The town was named after the nearby lake, which was named after the explorer and fur trader, David Jackson.
The town grew slowly over the years, and by the early 1900s, it had become a popular destination for tourists and outdoor enthusiasts. The town was home to several hotels, restaurants, and stores, and was a popular spot for fishing, hunting, and camping.
Geography
Jackson Lake is located in the northeastern corner of Colorado, in Jackson County. The town is situated on the banks of the North Platte River, and is surrounded by the Medicine Bow National Forest. The town is located at an elevation of 6,800 feet, and has a total area of 0.6 square miles.
The climate in Jackson Lake is semi-arid, with hot summers and cold winters. The average annual temperature is around 50 degrees Fahrenheit, and the average annual precipitation is around 16 inches.
Economy
The economy of Jackson Lake is largely based on tourism and outdoor recreation. The town is a popular destination for fishing, hunting, camping, and other outdoor activities. The town is also home to several restaurants, hotels, and stores, which cater to the needs of tourists and outdoor enthusiasts.
The town is also home to several small businesses, including a gas station, a grocery store, and a hardware store. The town is also home to a small airport, which serves the surrounding area.
Demographics
As of the 2010 census, the population of Jackson Lake was 203 people. The racial makeup of the town was 97.5% White, 0.5% Native American, 0.5% Asian, and 1.5% from other races. The median household income was $37,500, and the median family income was $41,250.
The town is home to a small number of churches, including the Jackson Lake Baptist Church, the Jackson Lake Methodist Church, and the Jackson Lake Presbyterian Church. The town is also home to a small library, which serves the needs of the local community.
Conclusion
Jackson Lake is a small town located in the northeastern corner of Colorado, in Jackson County. The town is situated on the banks of the North Platte River, and is surrounded by the Medicine Bow National Forest. The town has a population of just over 200 people, and is a popular destination for outdoor recreation. The economy of the town is largely based on tourism and outdoor recreation, and the town is home to several restaurants, hotels, and stores. The town is also home to several churches, a library, and a small airport.
Common Questions
What is Per Capita Income in Jackson Lake?
Per Capita income in Jackson Lake is $31,487.
What is the Median Family Income in Jackson Lake?
Median Family Income in Jackson Lake is $81,875.
What is the Median Household income in Jackson Lake?
Median Household Income in Jackson Lake is $75,625.
What is Income or Wage Gap in Jackson Lake?
Income or Wage Gap in Jackson Lake is 35.0%.
Women in Jackson Lake earn 65.0 cents for every dollar earned by a man.
What is Inequality or Gini Index in Jackson Lake?
Inequality or Gini Index in Jackson Lake is 0.43.
What is the Total Population of Jackson Lake?
Total Population of Jackson Lake is 165.
What is the Total Male Population of Jackson Lake?
Total Male Population of Jackson Lake is 96.
What is the Total Female Population of Jackson Lake?
Total Female Population of Jackson Lake is 69.
What is the Ratio of Males per 100 Females in Jackson Lake?
There are 139.13 Males per 100 Females in Jackson Lake.
What is the Ratio of Females per 100 Males in Jackson Lake?
There are 71.88 Females per 100 Males in Jackson Lake.
What is the Median Population Age in Jackson Lake?
Median Population Age in Jackson Lake is 48.5 Years.
What is the Average Family Size in Jackson Lake
Average Family Size in Jackson Lake is 2.9 People.
What is the Average Household Size in Jackson Lake
Average Household Size in Jackson Lake is 2.3 People.
How Large is the Labor Force in Jackson Lake?
There are 66 People in the Labor Forcein in Jackson Lake.
What is the Percentage of People in the Labor Force in Jackson Lake?
45.8% of People are in the Labor Force in Jackson Lake.
What is the Unemployment Rate in Jackson Lake?
Unemployment Rate in Jackson Lake is 7.6%.