Zip Codes with the Highest Percentage of Population with a Degree in Engineering in Brighton, CO
RELATED REPORTS & OPTIONS
Engineering
Brighton
Compare Zip Codes
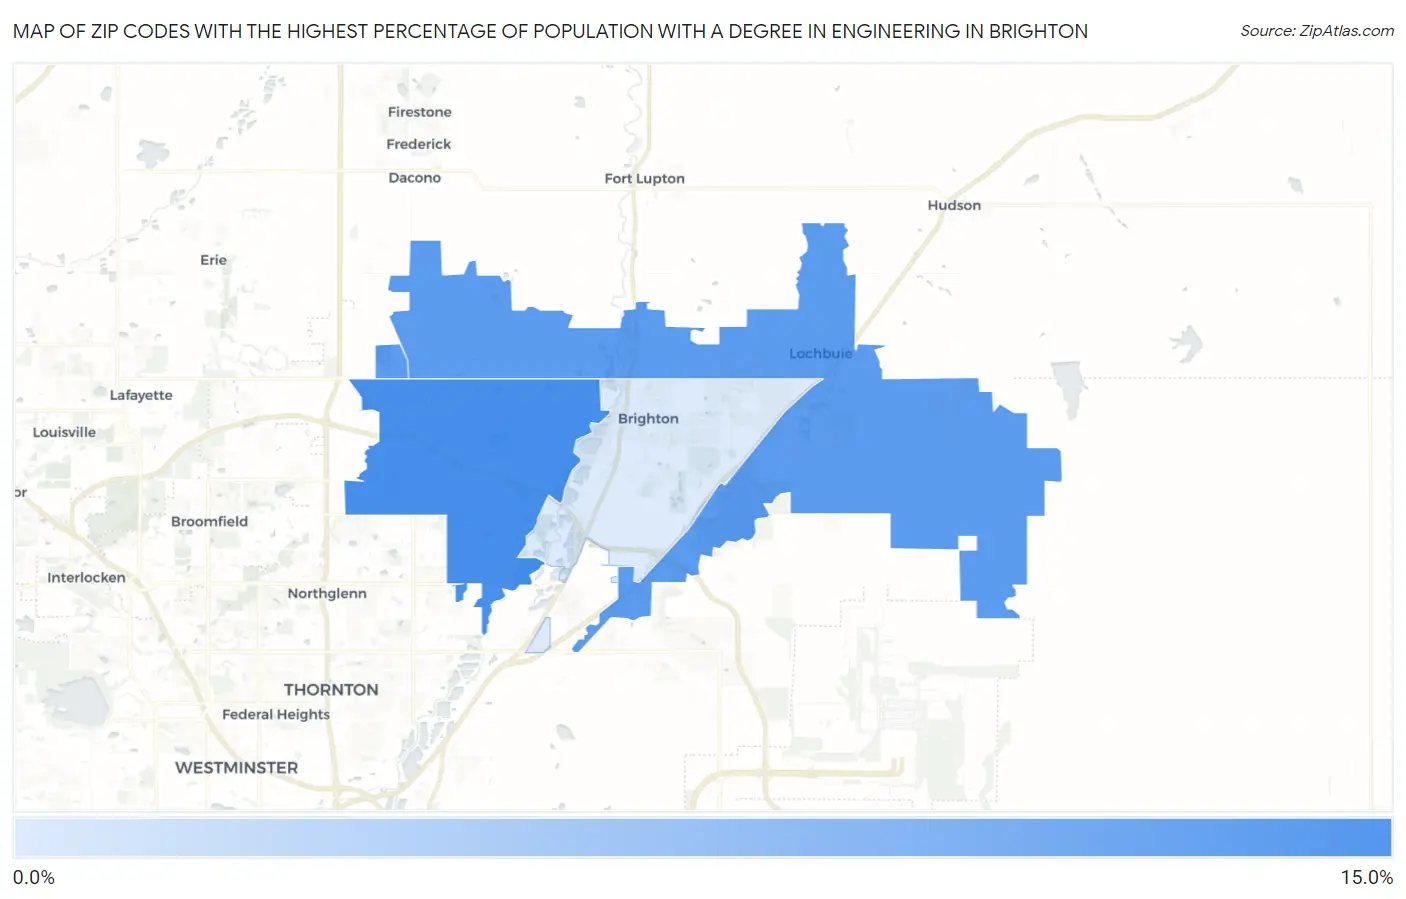
Map of Zip Codes with the Highest Percentage of Population with a Degree in Engineering in Brighton
4.3%
10.5%
Zip Codes with the Highest Percentage of Population with a Degree in Engineering in Brighton, CO
| Zip Code | % Graduates | vs State | vs National | |
| 1. | 80602 | 10.5% | 8.3%(+2.23)#95 | 7.6%(+2.84)#3,991 |
| 2. | 80603 | 9.8% | 8.3%(+1.49)#111 | 7.6%(+2.11)#4,676 |
| 3. | 80601 | 4.3% | 8.3%(-3.94)#300 | 7.6%(-3.33)#15,529 |
1
Common Questions
What are the Top Zip Codes with the Highest Percentage of Population with a Degree in Engineering in Brighton, CO?
Top Zip Codes with the Highest Percentage of Population with a Degree in Engineering in Brighton, CO are:
What zip code has the Highest Percentage of Population with a Degree in Engineering in Brighton, CO?
80602 has the Highest Percentage of Population with a Degree in Engineering in Brighton, CO with 10.5%.
What is the Percentage of Population with a Degree in Engineering in Brighton, CO?
Percentage of Population with a Degree in Engineering in Brighton is 4.8%.
What is the Percentage of Population with a Degree in Engineering in Colorado?
Percentage of Population with a Degree in Engineering in Colorado is 8.3%.
What is the Percentage of Population with a Degree in Engineering in the United States?
Percentage of Population with a Degree in Engineering in the United States is 7.6%.