Beulah Valley, CO Map & Demographics
Beulah Valley Map
Beulah Valley Overview
$25,562
PER CAPITA INCOME
$46,667
AVG HOUSEHOLD INCOME
0.40
INEQUALITY / GINI INDEX
643
TOTAL POPULATION
337
MALE POPULATION
306
FEMALE POPULATION
110.13
MALES / 100 FEMALES
90.80
FEMALES / 100 MALES
47.9
MEDIAN AGE
2.9
AVG FAMILY SIZE
2.4
AVG HOUSEHOLD SIZE
195
LABOR FORCE [ PEOPLE ]
36.4%
PERCENT IN LABOR FORCE
12.3%
UNEMPLOYMENT RATE
Income in Beulah Valley
Income Overview in Beulah Valley
| Characteristic | Number | Measure |
| Per Capita Income | 643 | $25,562 |
| Median Family Income | 171 | $0 |
| Mean Family Income | 171 | $81,083 |
| Median Household Income | 272 | $46,667 |
| Mean Household Income | 272 | $59,899 |
| Income Deficit | 171 | $0 |
| Wage / Income Gap (%) | 643 | 0.00% |
| Wage / Income Gap ($) | 643 | 100.00¢ per $1 |
| Gini / Inequality Index | 643 | 0.40 |
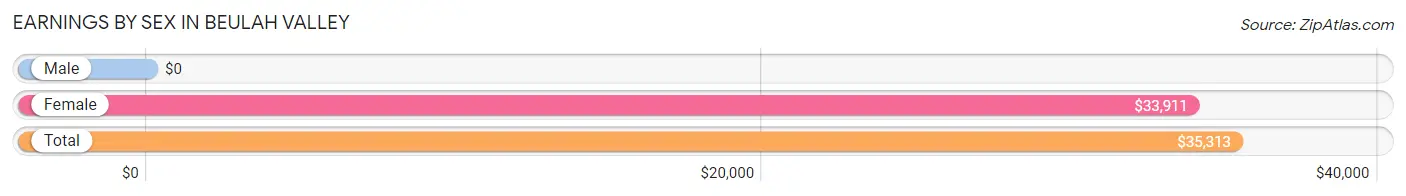
Earnings by Sex in Beulah Valley
| Sex | Number | Average Earnings |
| Male | 94 (46.3%) | $0 |
| Female | 109 (53.7%) | $33,911 |
| Total | 203 (100.0%) | $35,313 |
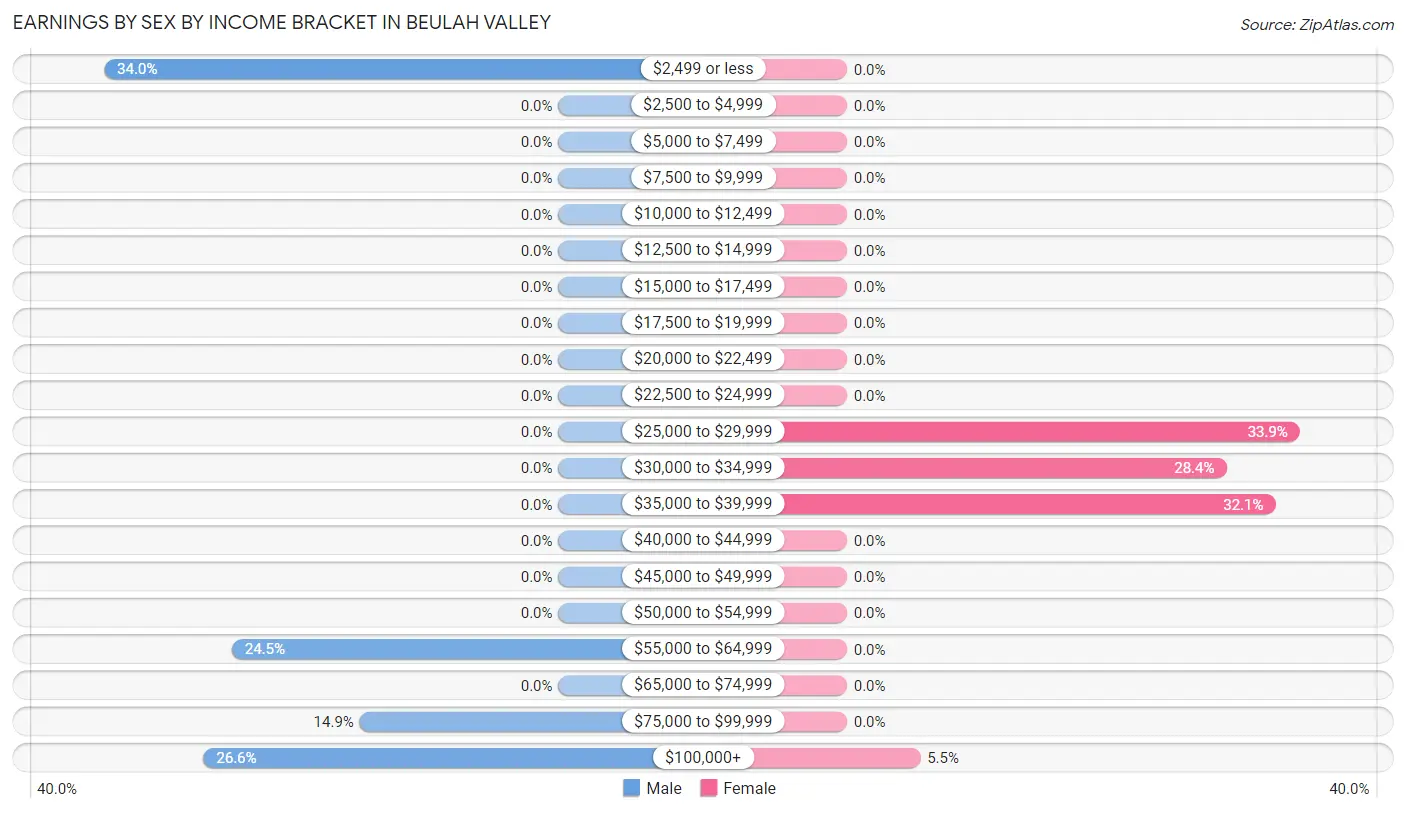
Earnings by Sex by Income Bracket in Beulah Valley
The most common earnings brackets in Beulah Valley are $2,499 or less for men (32 | 34.0%) and $25,000 to $29,999 for women (37 | 33.9%).
| Income | Male | Female |
| $2,499 or less | 32 (34.0%) | 0 (0.0%) |
| $2,500 to $4,999 | 0 (0.0%) | 0 (0.0%) |
| $5,000 to $7,499 | 0 (0.0%) | 0 (0.0%) |
| $7,500 to $9,999 | 0 (0.0%) | 0 (0.0%) |
| $10,000 to $12,499 | 0 (0.0%) | 0 (0.0%) |
| $12,500 to $14,999 | 0 (0.0%) | 0 (0.0%) |
| $15,000 to $17,499 | 0 (0.0%) | 0 (0.0%) |
| $17,500 to $19,999 | 0 (0.0%) | 0 (0.0%) |
| $20,000 to $22,499 | 0 (0.0%) | 0 (0.0%) |
| $22,500 to $24,999 | 0 (0.0%) | 0 (0.0%) |
| $25,000 to $29,999 | 0 (0.0%) | 37 (33.9%) |
| $30,000 to $34,999 | 0 (0.0%) | 31 (28.4%) |
| $35,000 to $39,999 | 0 (0.0%) | 35 (32.1%) |
| $40,000 to $44,999 | 0 (0.0%) | 0 (0.0%) |
| $45,000 to $49,999 | 0 (0.0%) | 0 (0.0%) |
| $50,000 to $54,999 | 0 (0.0%) | 0 (0.0%) |
| $55,000 to $64,999 | 23 (24.5%) | 0 (0.0%) |
| $65,000 to $74,999 | 0 (0.0%) | 0 (0.0%) |
| $75,000 to $99,999 | 14 (14.9%) | 0 (0.0%) |
| $100,000+ | 25 (26.6%) | 6 (5.5%) |
| Total | 94 (100.0%) | 109 (100.0%) |
Earnings by Sex by Educational Attainment in Beulah Valley
| Educational Attainment | Male Income | Female Income |
| Less than High School | - | - |
| High School Diploma | - | - |
| College or Associate's Degree | - | - |
| Bachelor's Degree | - | - |
| Graduate Degree | - | - |
| Total | - | - |
Family Income in Beulah Valley
Family Income Brackets in Beulah Valley
According to the Beulah Valley family income data, there are 50 families falling into the $50,000 to $74,999 income range, which is the most common income bracket and makes up 29.2% of all families.
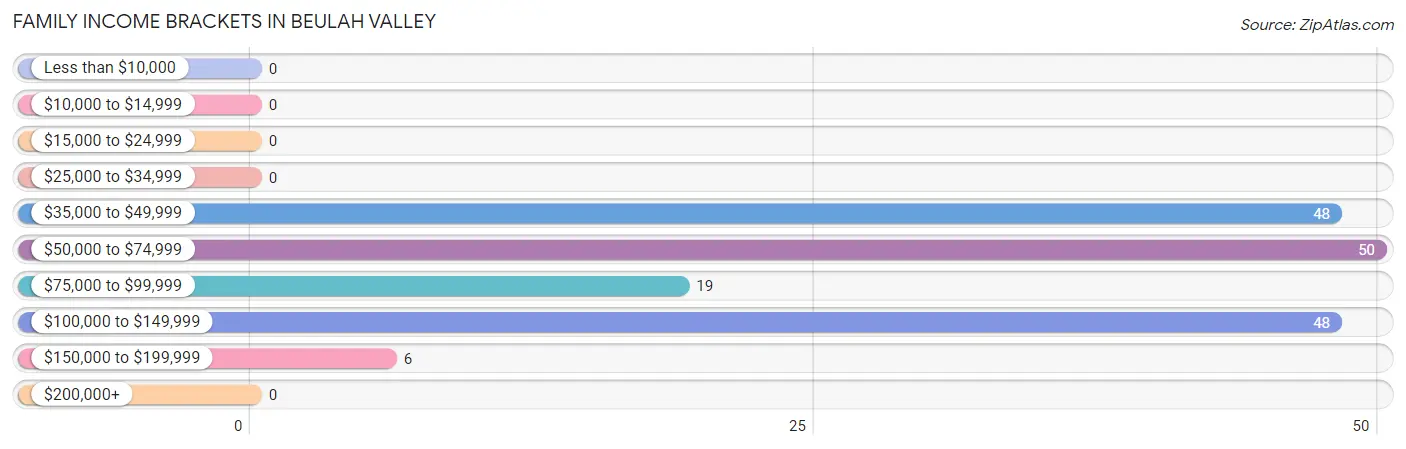
| Income Bracket | # Families | % Families |
| Less than $10,000 | 0 | 0.0% |
| $10,000 to $14,999 | 0 | 0.0% |
| $15,000 to $24,999 | 0 | 0.0% |
| $25,000 to $34,999 | 0 | 0.0% |
| $35,000 to $49,999 | 48 | 28.1% |
| $50,000 to $74,999 | 50 | 29.2% |
| $75,000 to $99,999 | 19 | 11.1% |
| $100,000 to $149,999 | 48 | 28.1% |
| $150,000 to $199,999 | 6 | 3.5% |
| $200,000+ | 0 | 0.0% |
Family Income by Famaliy Size in Beulah Valley
2-person families (117 | 68.4%) account for the highest median family income in Beulah Valley with $50,709 per family, while 2-person families (117 | 68.4%) have the highest median income of $25,354 per family member.
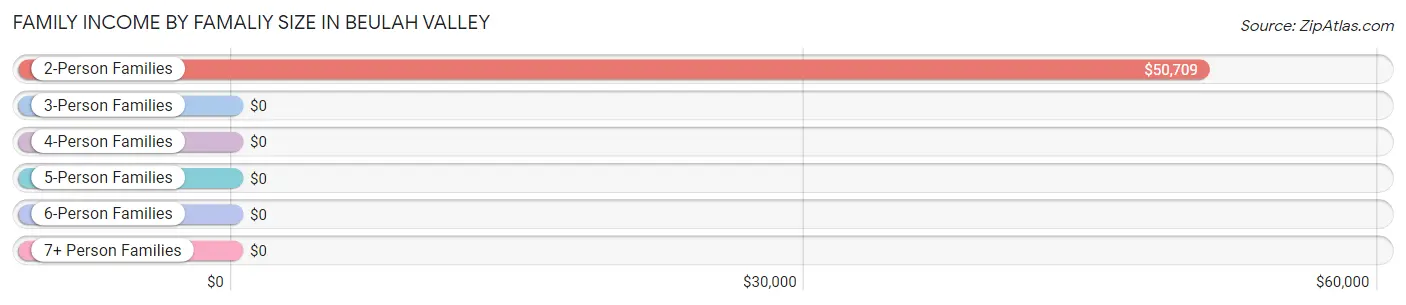
| Income Bracket | # Families | Median Income |
| 2-Person Families | 117 (68.4%) | $50,709 |
| 3-Person Families | 6 (3.5%) | $0 |
| 4-Person Families | 0 (0.0%) | $0 |
| 5-Person Families | 23 (13.5%) | $0 |
| 6-Person Families | 25 (14.6%) | $0 |
| 7+ Person Families | 0 (0.0%) | $0 |
| Total | 171 (100.0%) | $0 |
Family Income by Number of Earners in Beulah Valley
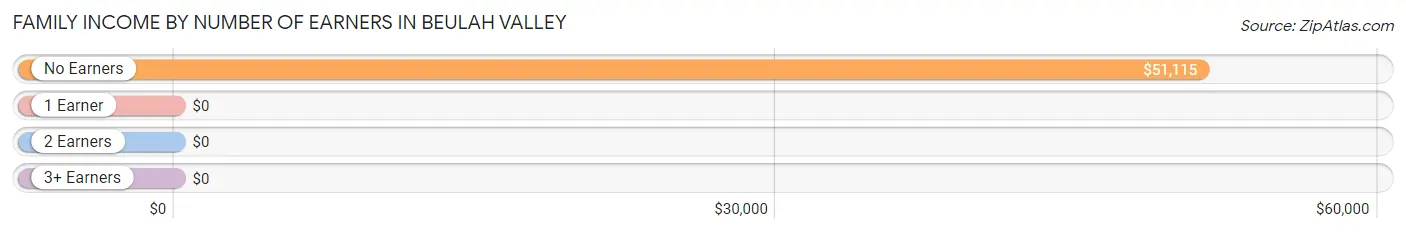
| Number of Earners | # Families | Median Income |
| No Earners | 67 (39.2%) | $51,115 |
| 1 Earner | 75 (43.9%) | $0 |
| 2 Earners | 29 (17.0%) | $0 |
| 3+ Earners | 0 (0.0%) | $0 |
| Total | 171 (100.0%) | $0 |
Household Income in Beulah Valley
Household Income Brackets in Beulah Valley
With 60 households falling in the category, the $50,000 to $74,999 income range is the most frequent in Beulah Valley, accounting for 22.1% of all households.
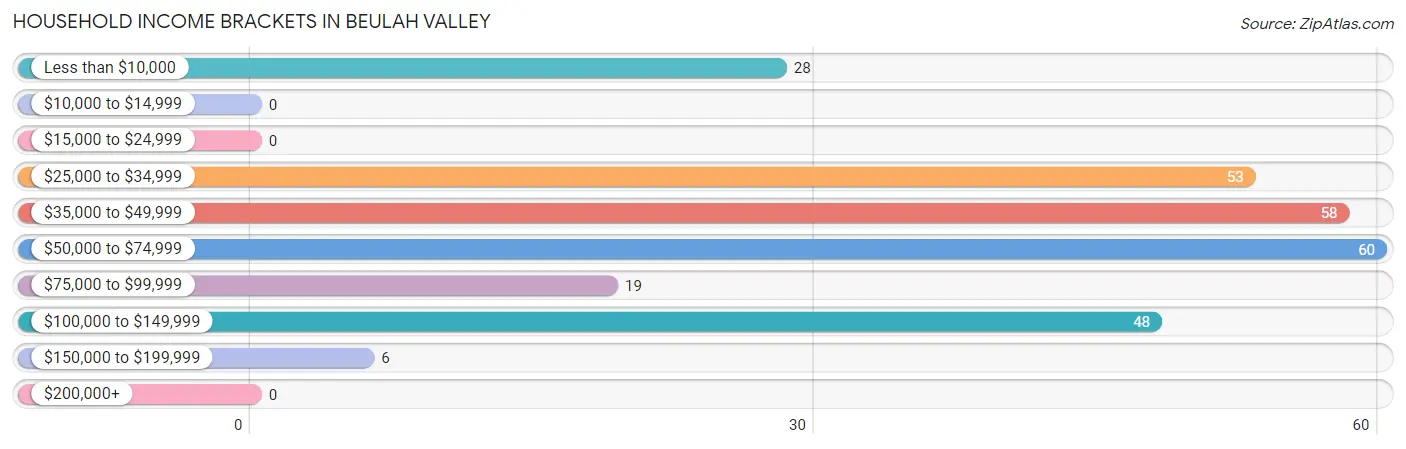
| Income Bracket | # Households | % Households |
| Less than $10,000 | 28 | 10.3% |
| $10,000 to $14,999 | 0 | 0.0% |
| $15,000 to $24,999 | 0 | 0.0% |
| $25,000 to $34,999 | 53 | 19.5% |
| $35,000 to $49,999 | 58 | 21.3% |
| $50,000 to $74,999 | 60 | 22.1% |
| $75,000 to $99,999 | 19 | 7.0% |
| $100,000 to $149,999 | 48 | 17.6% |
| $150,000 to $199,999 | 6 | 2.2% |
| $200,000+ | 0 | 0.0% |
Household Income by Householder Age in Beulah Valley
The median household income in Beulah Valley is $46,667, with the highest median household income of $51,520 found in the 45 to 64 years age bracket for the primary householder. A total of 107 households (39.3%) fall into this category.
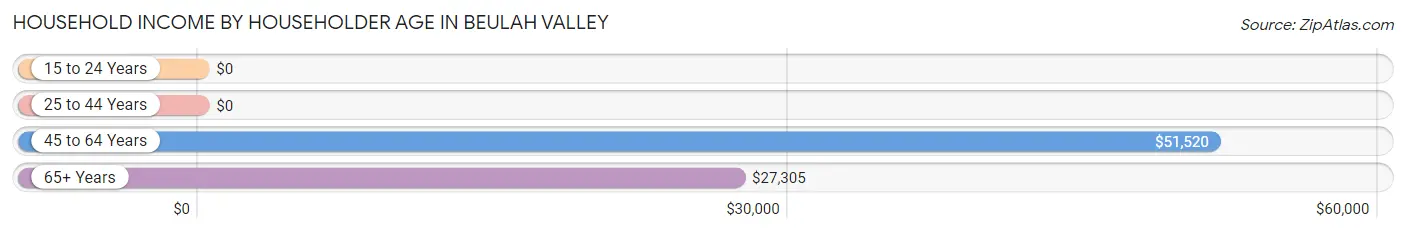
| Income Bracket | # Households | Median Income |
| 15 to 24 Years | 0 (0.0%) | $0 |
| 25 to 44 Years | 50 (18.4%) | $0 |
| 45 to 64 Years | 107 (39.3%) | $51,520 |
| 65+ Years | 115 (42.3%) | $27,305 |
| Total | 272 (100.0%) | $46,667 |
Poverty in Beulah Valley
Income Below Poverty by Sex and Age in Beulah Valley
With 8.6% poverty level for males and 11.4% for females among the residents of Beulah Valley, 25 to 34 year old males and 75 year old and over females are the most vulnerable to poverty, with 29 males (47.5%) and 28 females (40.0%) in their respective age groups living below the poverty level.
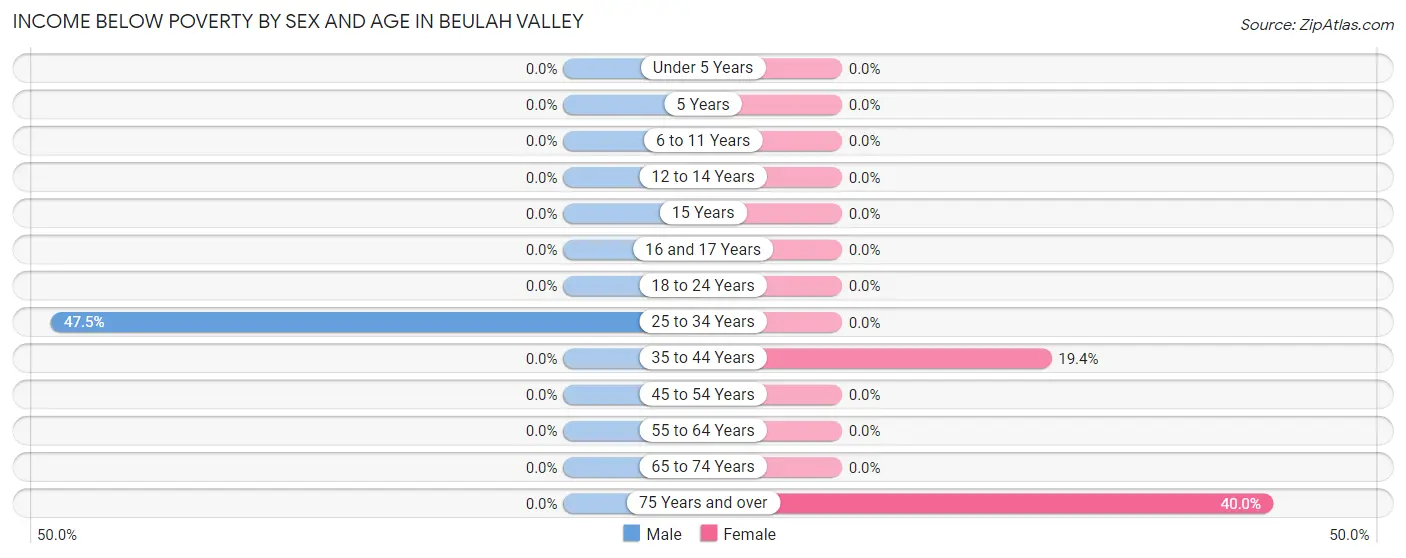
| Age Bracket | Male | Female |
| Under 5 Years | 0 (0.0%) | 0 (0.0%) |
| 5 Years | 0 (0.0%) | 0 (0.0%) |
| 6 to 11 Years | 0 (0.0%) | 0 (0.0%) |
| 12 to 14 Years | 0 (0.0%) | 0 (0.0%) |
| 15 Years | 0 (0.0%) | 0 (0.0%) |
| 16 and 17 Years | 0 (0.0%) | 0 (0.0%) |
| 18 to 24 Years | 0 (0.0%) | 0 (0.0%) |
| 25 to 34 Years | 29 (47.5%) | 0 (0.0%) |
| 35 to 44 Years | 0 (0.0%) | 7 (19.4%) |
| 45 to 54 Years | 0 (0.0%) | 0 (0.0%) |
| 55 to 64 Years | 0 (0.0%) | 0 (0.0%) |
| 65 to 74 Years | 0 (0.0%) | 0 (0.0%) |
| 75 Years and over | 0 (0.0%) | 28 (40.0%) |
| Total | 29 (8.6%) | 35 (11.4%) |
Income Above Poverty by Sex and Age in Beulah Valley
According to the poverty statistics in Beulah Valley, males aged 6 to 11 years and females aged 6 to 11 years are the age groups that are most secure financially, with 100.0% of males and 100.0% of females in these age groups living above the poverty line.
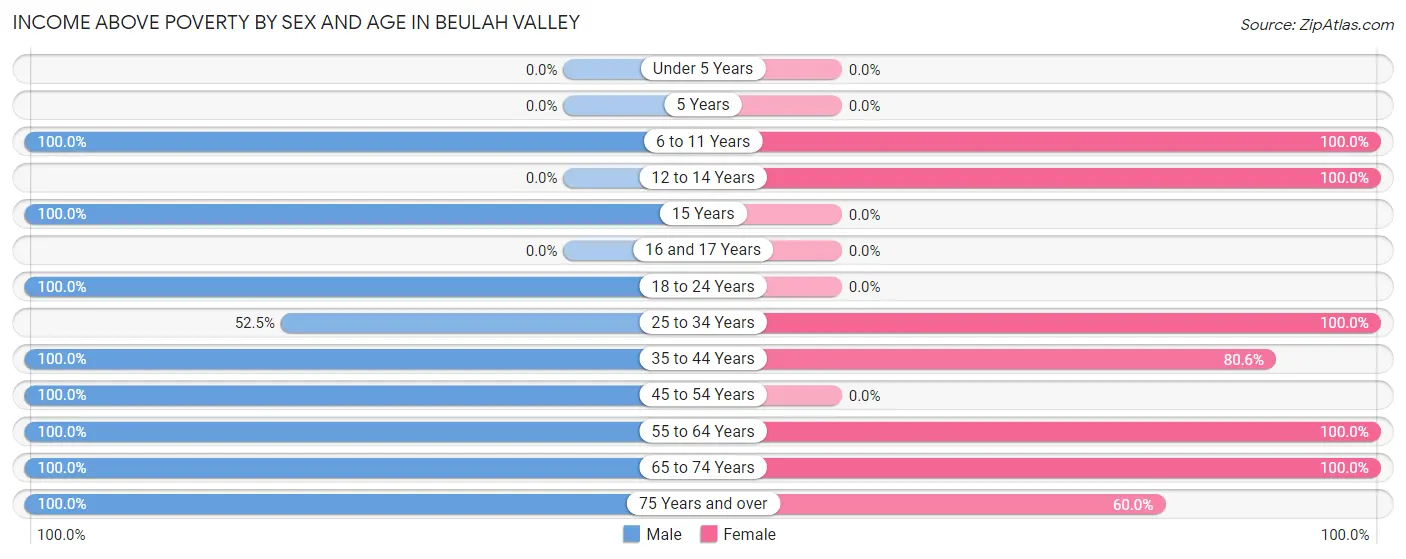
| Age Bracket | Male | Female |
| Under 5 Years | 0 (0.0%) | 0 (0.0%) |
| 5 Years | 0 (0.0%) | 0 (0.0%) |
| 6 to 11 Years | 52 (100.0%) | 23 (100.0%) |
| 12 to 14 Years | 0 (0.0%) | 24 (100.0%) |
| 15 Years | 8 (100.0%) | 0 (0.0%) |
| 16 and 17 Years | 0 (0.0%) | 0 (0.0%) |
| 18 to 24 Years | 23 (100.0%) | 0 (0.0%) |
| 25 to 34 Years | 32 (52.5%) | 63 (100.0%) |
| 35 to 44 Years | 25 (100.0%) | 29 (80.6%) |
| 45 to 54 Years | 7 (100.0%) | 0 (0.0%) |
| 55 to 64 Years | 81 (100.0%) | 63 (100.0%) |
| 65 to 74 Years | 62 (100.0%) | 27 (100.0%) |
| 75 Years and over | 18 (100.0%) | 42 (60.0%) |
| Total | 308 (91.4%) | 271 (88.6%) |
Income Below Poverty Among Married-Couple Families in Beulah Valley
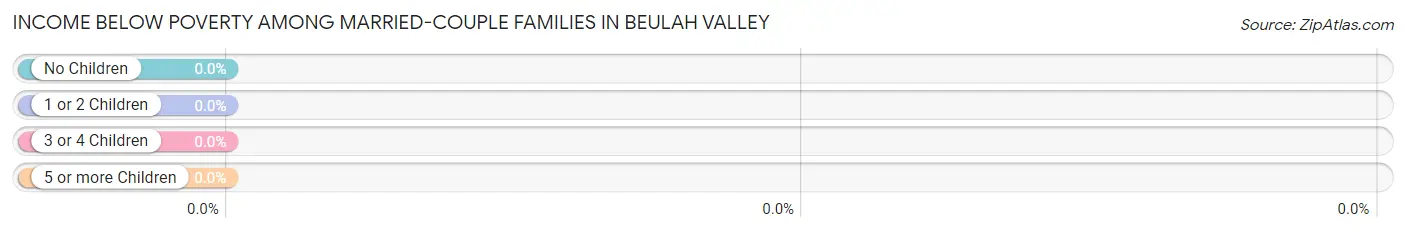
| Children | Above Poverty | Below Poverty |
| No Children | 42 (100.0%) | 0 (0.0%) |
| 1 or 2 Children | 48 (100.0%) | 0 (0.0%) |
| 3 or 4 Children | 0 (0.0%) | 0 (0.0%) |
| 5 or more Children | 0 (0.0%) | 0 (0.0%) |
| Total | 90 (100.0%) | 0 (0.0%) |
Income Below Poverty Among Single-Parent Households in Beulah Valley
| Children | Single Father | Single Mother |
| No Children | 0 (0.0%) | 0 (0.0%) |
| 1 or 2 Children | 0 (0.0%) | 0 (0.0%) |
| 3 or 4 Children | 0 (0.0%) | 0 (0.0%) |
| 5 or more Children | 0 (0.0%) | 0 (0.0%) |
| Total | 0 (0.0%) | 0 (0.0%) |
Income Below Poverty Among Married-Couple vs Single-Parent Households in Beulah Valley
| Children | Married-Couple Families | Single-Parent Households |
| No Children | 0 (0.0%) | 0 (0.0%) |
| 1 or 2 Children | 0 (0.0%) | 0 (0.0%) |
| 3 or 4 Children | 0 (0.0%) | 0 (0.0%) |
| 5 or more Children | 0 (0.0%) | 0 (0.0%) |
| Total | 0 (0.0%) | 0 (0.0%) |
Race in Beulah Valley
The most populous races in Beulah Valley are White / Caucasian (606 | 94.3%), Hispanic or Latino (133 | 20.7%), and Two or more Races (37 | 5.8%).
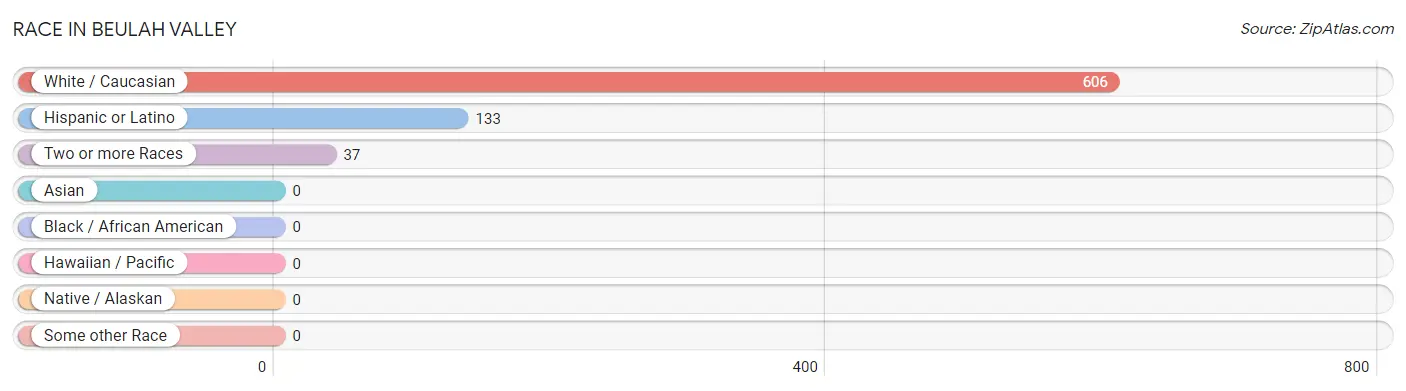
| Race | # Population | % Population |
| Asian | 0 | 0.0% |
| Black / African American | 0 | 0.0% |
| Hawaiian / Pacific | 0 | 0.0% |
| Hispanic or Latino | 133 | 20.7% |
| Native / Alaskan | 0 | 0.0% |
| White / Caucasian | 606 | 94.3% |
| Two or more Races | 37 | 5.8% |
| Some other Race | 0 | 0.0% |
| Total | 643 | 100.0% |
Ancestry in Beulah Valley
The most populous ancestries reported in Beulah Valley are Cuban (101 | 15.7%), English (98 | 15.2%), Russian (74 | 11.5%), French (61 | 9.5%), and German (46 | 7.1%), together accounting for 59.1% of all Beulah Valley residents.
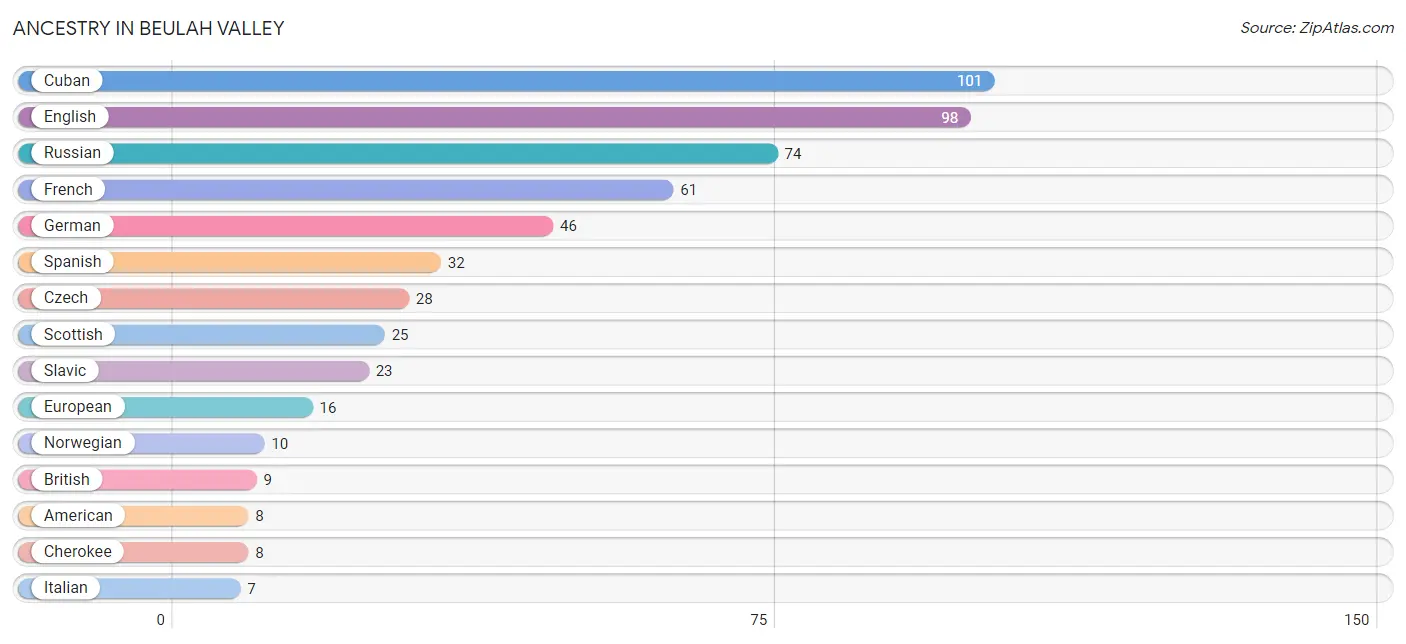
| Ancestry | # Population | % Population |
| American | 8 | 1.2% |
| British | 9 | 1.4% |
| Cherokee | 8 | 1.2% |
| Cuban | 101 | 15.7% |
| Czech | 28 | 4.3% |
| English | 98 | 15.2% |
| European | 16 | 2.5% |
| French | 61 | 9.5% |
| German | 46 | 7.1% |
| Italian | 7 | 1.1% |
| Norwegian | 10 | 1.6% |
| Russian | 74 | 11.5% |
| Scottish | 25 | 3.9% |
| Slavic | 23 | 3.6% |
| Spanish | 32 | 5.0% | View All 15 Rows |
Immigrants in Beulah Valley
The most numerous immigrant groups reported in Beulah Valley came from Europe (31 | 4.8%), Eastern Europe (24 | 3.7%), Russia (24 | 3.7%), Germany (7 | 1.1%), and Western Europe (7 | 1.1%), together accounting for 14.5% of all Beulah Valley residents.
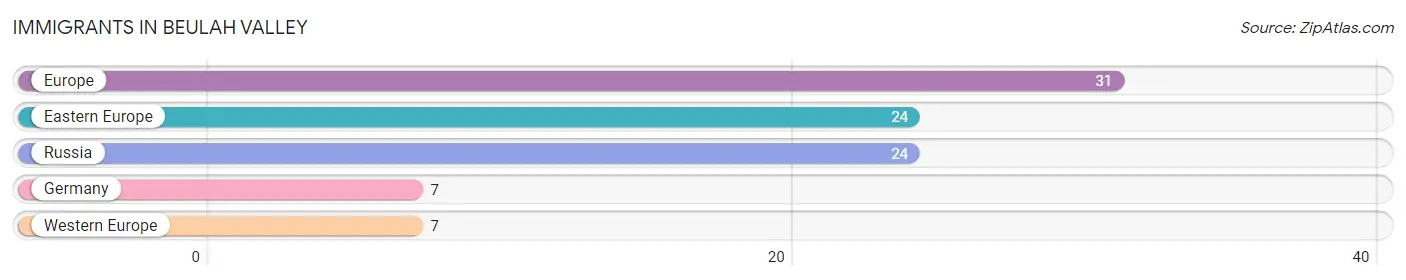
| Immigration Origin | # Population | % Population |
| Eastern Europe | 24 | 3.7% |
| Europe | 31 | 4.8% |
| Germany | 7 | 1.1% |
| Russia | 24 | 3.7% |
| Western Europe | 7 | 1.1% | View All 5 Rows |
Sex and Age in Beulah Valley
Sex and Age in Beulah Valley
The most populous age groups in Beulah Valley are 5 to 9 Years (52 | 15.4%) for men and 85 Years and over (61 | 19.9%) for women.
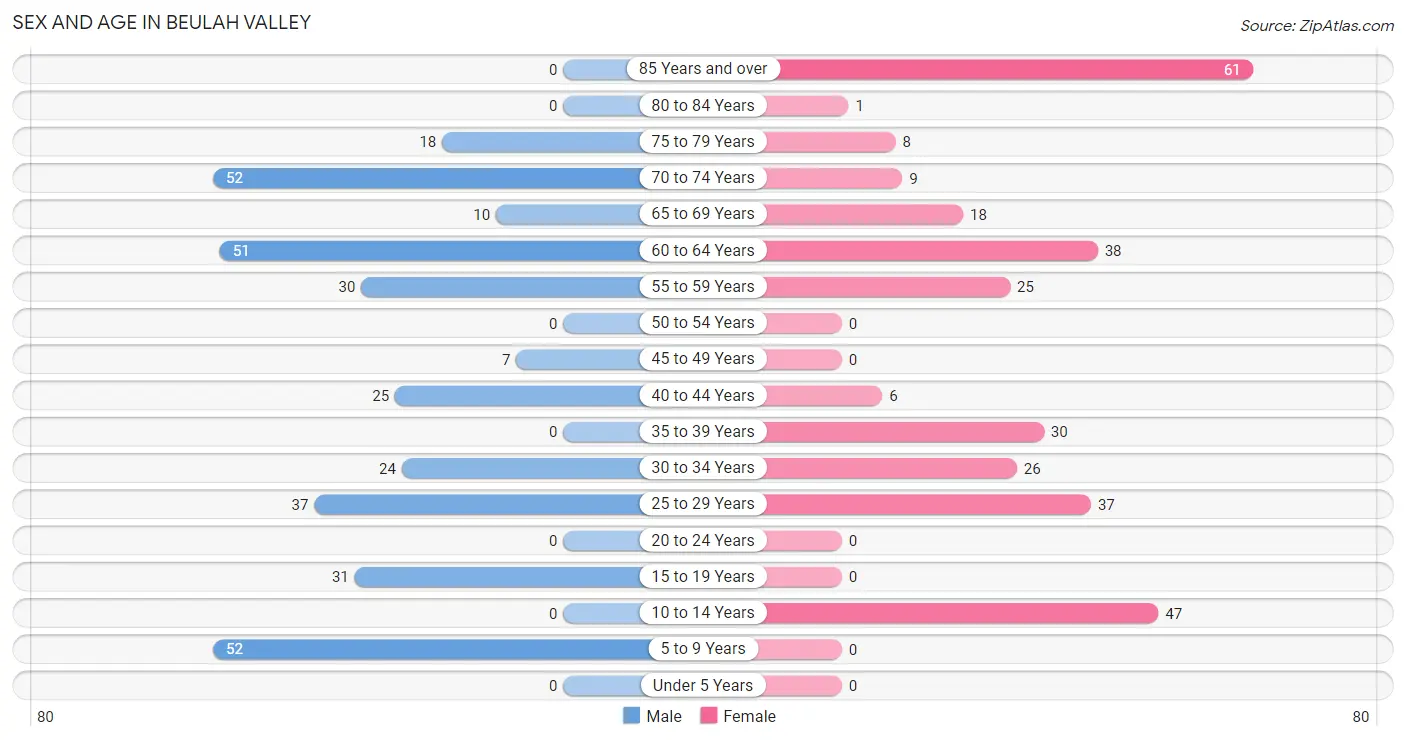
| Age Bracket | Male | Female |
| Under 5 Years | 0 (0.0%) | 0 (0.0%) |
| 5 to 9 Years | 52 (15.4%) | 0 (0.0%) |
| 10 to 14 Years | 0 (0.0%) | 47 (15.4%) |
| 15 to 19 Years | 31 (9.2%) | 0 (0.0%) |
| 20 to 24 Years | 0 (0.0%) | 0 (0.0%) |
| 25 to 29 Years | 37 (11.0%) | 37 (12.1%) |
| 30 to 34 Years | 24 (7.1%) | 26 (8.5%) |
| 35 to 39 Years | 0 (0.0%) | 30 (9.8%) |
| 40 to 44 Years | 25 (7.4%) | 6 (2.0%) |
| 45 to 49 Years | 7 (2.1%) | 0 (0.0%) |
| 50 to 54 Years | 0 (0.0%) | 0 (0.0%) |
| 55 to 59 Years | 30 (8.9%) | 25 (8.2%) |
| 60 to 64 Years | 51 (15.1%) | 38 (12.4%) |
| 65 to 69 Years | 10 (3.0%) | 18 (5.9%) |
| 70 to 74 Years | 52 (15.4%) | 9 (2.9%) |
| 75 to 79 Years | 18 (5.3%) | 8 (2.6%) |
| 80 to 84 Years | 0 (0.0%) | 1 (0.3%) |
| 85 Years and over | 0 (0.0%) | 61 (19.9%) |
| Total | 337 (100.0%) | 306 (100.0%) |
Families and Households in Beulah Valley
Median Family Size in Beulah Valley
The median family size in Beulah Valley is 2.87 persons per family, with married-couple families (90 | 52.6%) accounting for the largest median family size of 3.91 persons per family. On the other hand, single female/mother families (37 | 21.6%) represent the smallest median family size with 1.43 persons per family.
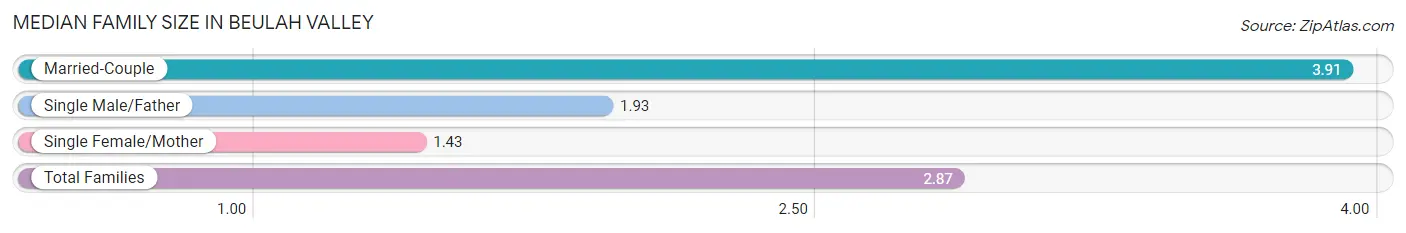
| Family Type | # Families | Family Size |
| Married-Couple | 90 (52.6%) | 3.91 |
| Single Male/Father | 44 (25.7%) | 1.93 |
| Single Female/Mother | 37 (21.6%) | 1.43 |
| Total Families | 171 (100.0%) | 2.87 |
Median Household Size in Beulah Valley
The median household size in Beulah Valley is 2.36 persons per household, with married-couple households (90 | 33.1%) accounting for the largest median household size of 3.91 persons per household. non-family households (101 | 37.1%) represent the smallest median household size with 1.37 persons per household.
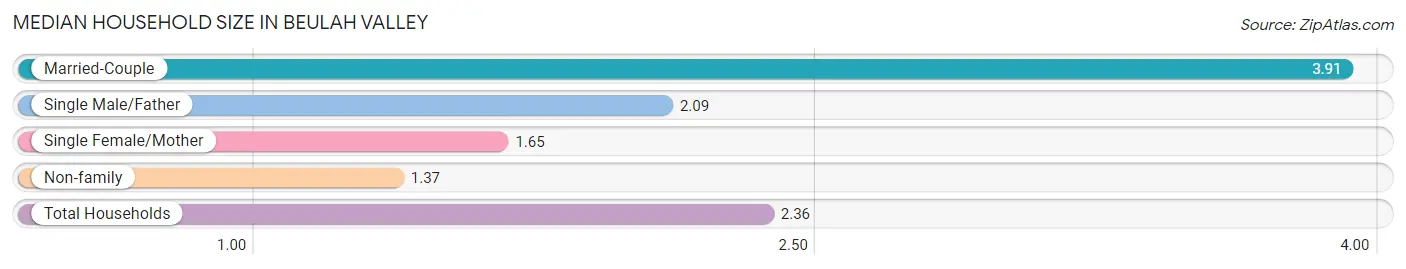
| Household Type | # Households | Household Size |
| Married-Couple | 90 (33.1%) | 3.91 |
| Single Male/Father | 44 (16.2%) | 2.09 |
| Single Female/Mother | 37 (13.6%) | 1.65 |
| Non-family | 101 (37.1%) | 1.37 |
| Total Households | 272 (100.0%) | 2.36 |
Household Size by Marriage Status in Beulah Valley
Out of a total of 272 households in Beulah Valley, 171 (62.9%) are family households, while 101 (37.1%) are nonfamily households. The most numerous type of family households are 2-person households, comprising 110, and the most common type of nonfamily households are 1-person households, comprising 80.
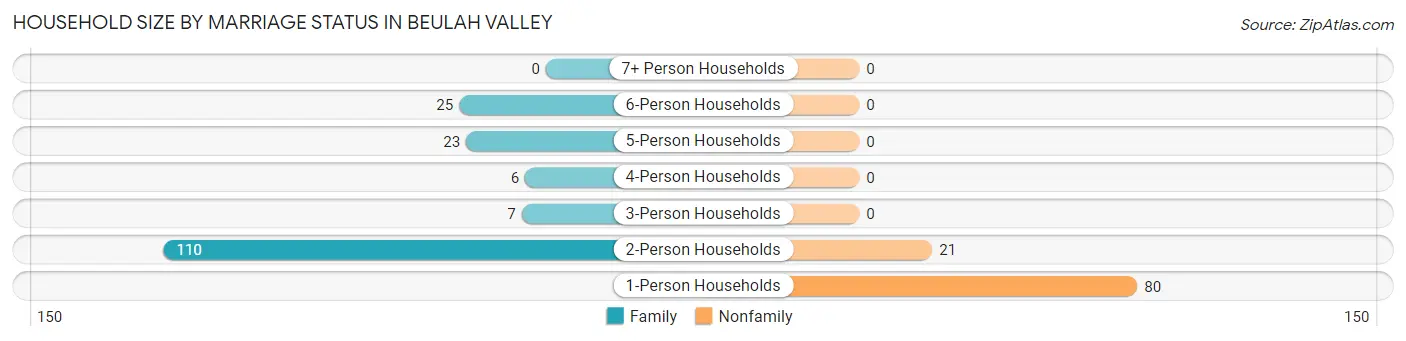
| Household Size | Family Households | Nonfamily Households |
| 1-Person Households | - | 80 (29.4%) |
| 2-Person Households | 110 (40.4%) | 21 (7.7%) |
| 3-Person Households | 7 (2.6%) | 0 (0.0%) |
| 4-Person Households | 6 (2.2%) | 0 (0.0%) |
| 5-Person Households | 23 (8.5%) | 0 (0.0%) |
| 6-Person Households | 25 (9.2%) | 0 (0.0%) |
| 7+ Person Households | 0 (0.0%) | 0 (0.0%) |
| Total | 171 (62.9%) | 101 (37.1%) |
Female Fertility in Beulah Valley
Fertility by Age in Beulah Valley
| Age Bracket | Women with Births | Births / 1,000 Women |
| 15 to 19 years | 0 (0.0%) | 0.0 |
| 20 to 34 years | 0 (0.0%) | 0.0 |
| 35 to 50 years | 0 (0.0%) | 0.0 |
| Total | 0 (0.0%) | 0.0 |
Fertility by Age by Marriage Status in Beulah Valley
| Age Bracket | Married | Unmarried |
| 15 to 19 years | 0 (0.0%) | 0 (0.0%) |
| 20 to 34 years | 0 (0.0%) | 0 (0.0%) |
| 35 to 50 years | 0 (0.0%) | 0 (0.0%) |
| Total | 0 (0.0%) | 0 (0.0%) |
Fertility by Education in Beulah Valley
| Educational Attainment | Women with Births | Births / 1,000 Women |
| Less than High School | 0 (0.0%) | 0.0 |
| High School Diploma | 0 (0.0%) | 0.0 |
| College or Associate's Degree | 0 (0.0%) | 0.0 |
| Bachelor's Degree | 0 (0.0%) | 0.0 |
| Graduate Degree | 0 (0.0%) | 0.0 |
| Total | 0 (0.0%) | 0.0 |
Fertility by Education by Marriage Status in Beulah Valley
| Educational Attainment | Married | Unmarried |
| Less than High School | 0 (0.0%) | 0 (0.0%) |
| High School Diploma | 0 (0.0%) | 0 (0.0%) |
| College or Associate's Degree | 0 (0.0%) | 0 (0.0%) |
| Bachelor's Degree | 0 (0.0%) | 0 (0.0%) |
| Graduate Degree | 0 (0.0%) | 0 (0.0%) |
| Total | 0 (0.0%) | 0 (0.0%) |
Employment Characteristics in Beulah Valley
Employment by Class of Employer in Beulah Valley
Among the 171 employed individuals in Beulah Valley, private company employees (111 | 64.9%), state government employees (25 | 14.6%), and local government employees (23 | 13.5%) make up the most common classes of employment.
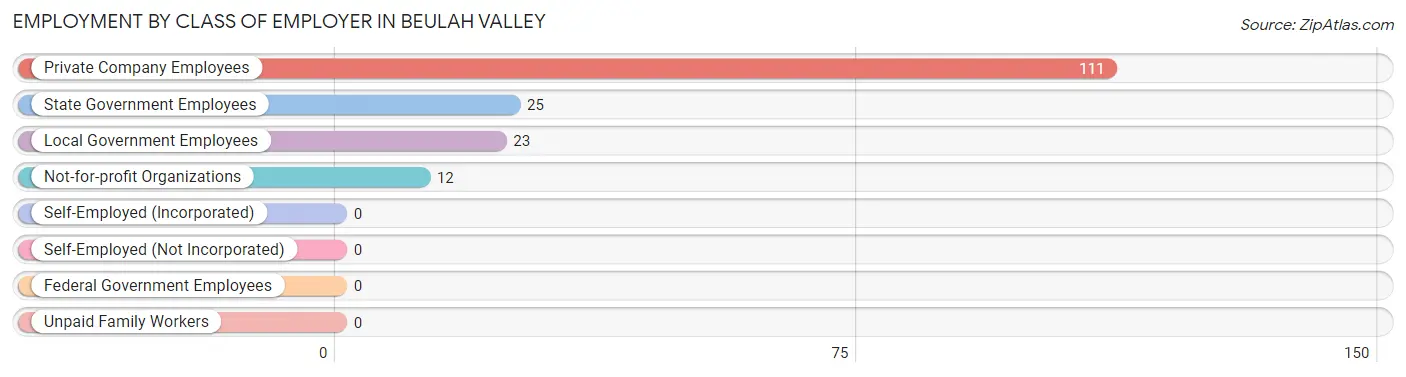
| Employer Class | # Employees | % Employees |
| Private Company Employees | 111 | 64.9% |
| Self-Employed (Incorporated) | 0 | 0.0% |
| Self-Employed (Not Incorporated) | 0 | 0.0% |
| Not-for-profit Organizations | 12 | 7.0% |
| Local Government Employees | 23 | 13.5% |
| State Government Employees | 25 | 14.6% |
| Federal Government Employees | 0 | 0.0% |
| Unpaid Family Workers | 0 | 0.0% |
| Total | 171 | 100.0% |
Employment Status by Age in Beulah Valley
According to the labor force statistics for Beulah Valley, out of the total population over 16 years of age (536), 36.4% or 195 individuals are in the labor force, with 12.3% or 24 of them unemployed. The age group with the highest labor force participation rate is 45 to 54 years, with 100.0% or 7 individuals in the labor force. Within the labor force, the 75 years and over age range has the highest percentage of unemployed individuals, with 100.0% or 16 of them being unemployed.
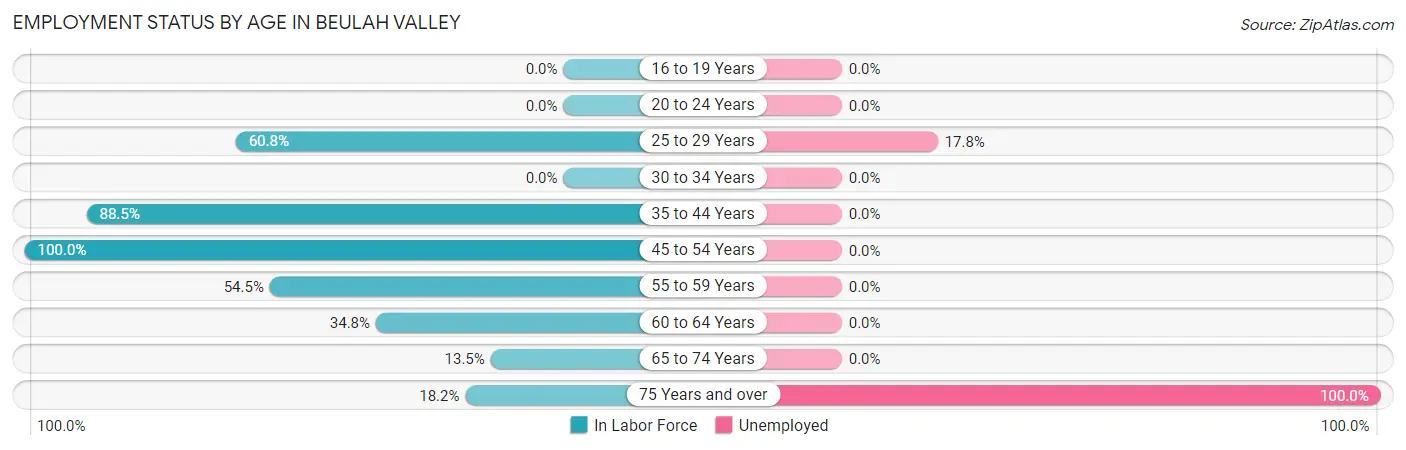
| Age Bracket | In Labor Force | Unemployed |
| 16 to 19 Years | 0 (0.0%) | 0 (0.0%) |
| 20 to 24 Years | 0 (0.0%) | 0 (0.0%) |
| 25 to 29 Years | 45 (60.8%) | 8 (17.8%) |
| 30 to 34 Years | 0 (0.0%) | 0 (0.0%) |
| 35 to 44 Years | 54 (88.5%) | 0 (0.0%) |
| 45 to 54 Years | 7 (100.0%) | 0 (0.0%) |
| 55 to 59 Years | 30 (54.5%) | 0 (0.0%) |
| 60 to 64 Years | 31 (34.8%) | 0 (0.0%) |
| 65 to 74 Years | 12 (13.5%) | 0 (0.0%) |
| 75 Years and over | 16 (18.2%) | 16 (100.0%) |
| Total | 195 (36.4%) | 24 (12.3%) |
Employment Status by Educational Attainment in Beulah Valley
According to labor force statistics for Beulah Valley, 49.7% of individuals (167) out of the total population between 25 and 64 years of age (336) are in the labor force, with 4.8% or 8 of them being unemployed. The group with the highest labor force participation rate are those with the educational attainment of college / associate degree, with 59.7% or 37 individuals in the labor force. Within the labor force, individuals with less than high school education have the highest percentage of unemployment, with 100.0% or 8 of them being unemployed.
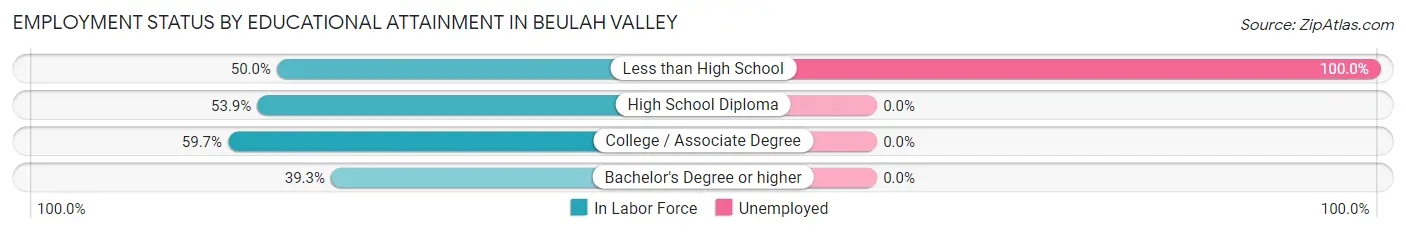
| Educational Attainment | In Labor Force | Unemployed |
| Less than High School | 8 (50.0%) | 16 (100.0%) |
| High School Diploma | 76 (53.9%) | 0 (0.0%) |
| College / Associate Degree | 37 (59.7%) | 0 (0.0%) |
| Bachelor's Degree or higher | 46 (39.3%) | 0 (0.0%) |
| Total | 167 (49.7%) | 16 (4.8%) |
Employment Occupations by Sex in Beulah Valley
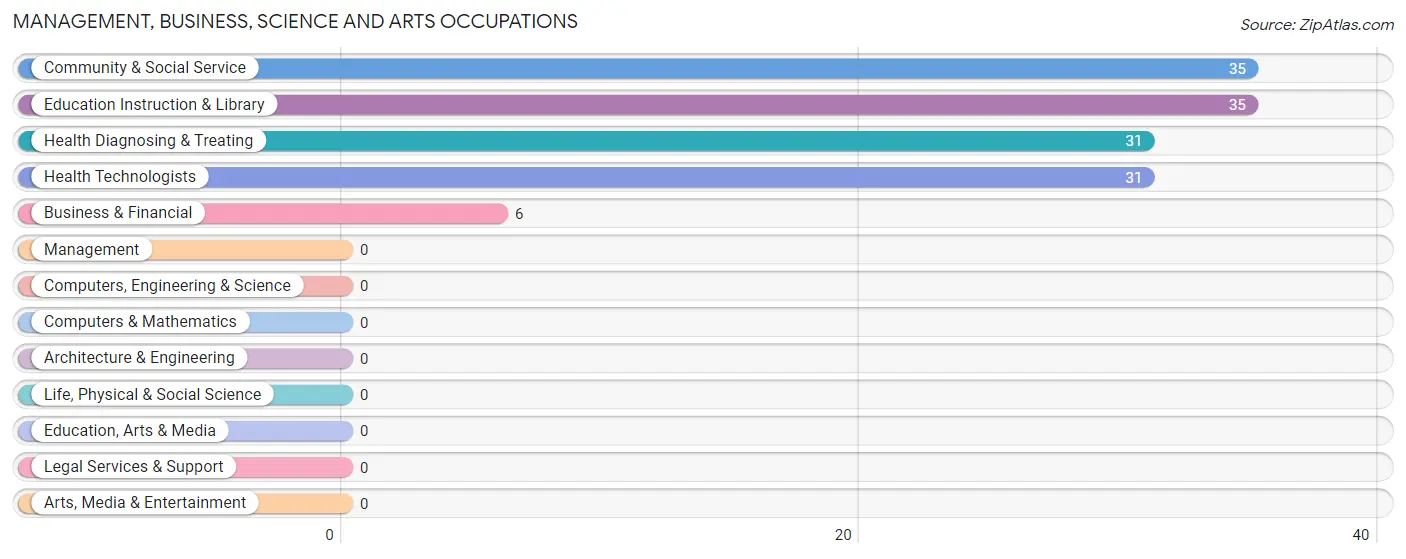
Management, Business, Science and Arts Occupations
The most common Management, Business, Science and Arts occupations in Beulah Valley are Community & Social Service (35 | 20.5%), Education Instruction & Library (35 | 20.5%), Health Diagnosing & Treating (31 | 18.1%), Health Technologists (31 | 18.1%), and Business & Financial (6 | 3.5%).
Management, Business, Science and Arts Occupations by Sex
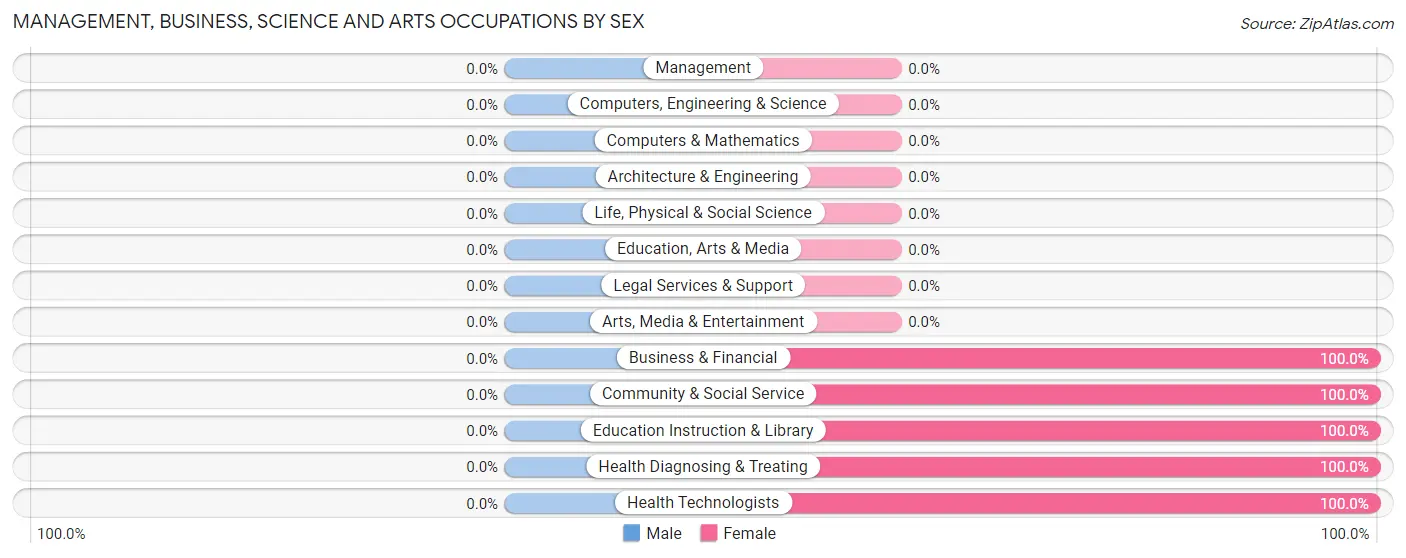
| Occupation | Male | Female |
| Management | 0 (0.0%) | 0 (0.0%) |
| Business & Financial | 0 (0.0%) | 6 (100.0%) |
| Computers, Engineering & Science | 0 (0.0%) | 0 (0.0%) |
| Computers & Mathematics | 0 (0.0%) | 0 (0.0%) |
| Architecture & Engineering | 0 (0.0%) | 0 (0.0%) |
| Life, Physical & Social Science | 0 (0.0%) | 0 (0.0%) |
| Community & Social Service | 0 (0.0%) | 35 (100.0%) |
| Education, Arts & Media | 0 (0.0%) | 0 (0.0%) |
| Legal Services & Support | 0 (0.0%) | 0 (0.0%) |
| Education Instruction & Library | 0 (0.0%) | 35 (100.0%) |
| Arts, Media & Entertainment | 0 (0.0%) | 0 (0.0%) |
| Health Diagnosing & Treating | 0 (0.0%) | 31 (100.0%) |
| Health Technologists | 0 (0.0%) | 31 (100.0%) |
| Total (Category) | 0 (0.0%) | 72 (100.0%) |
| Total (Overall) | 62 (36.3%) | 109 (63.7%) |
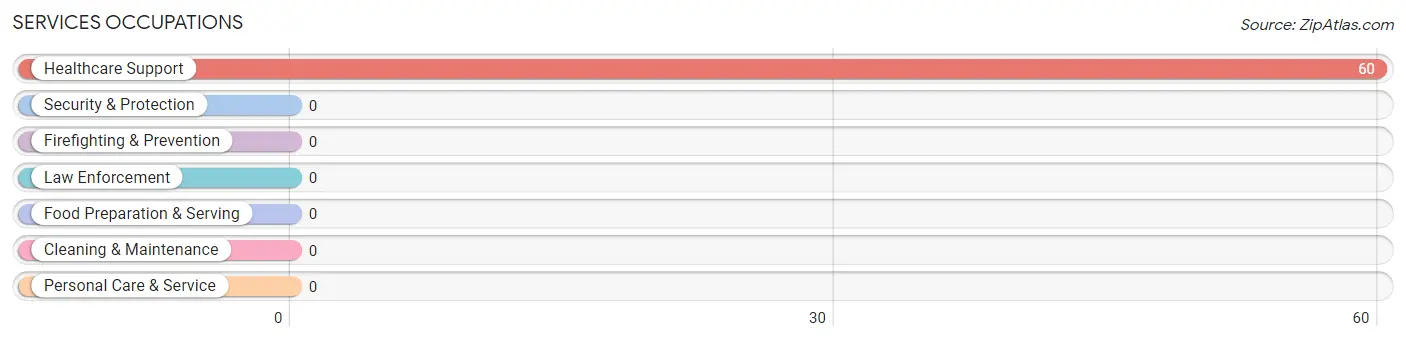
Services Occupations
The most common Services occupations in Beulah Valley are , and Healthcare Support (60 | 35.1%).
Services Occupations by Sex
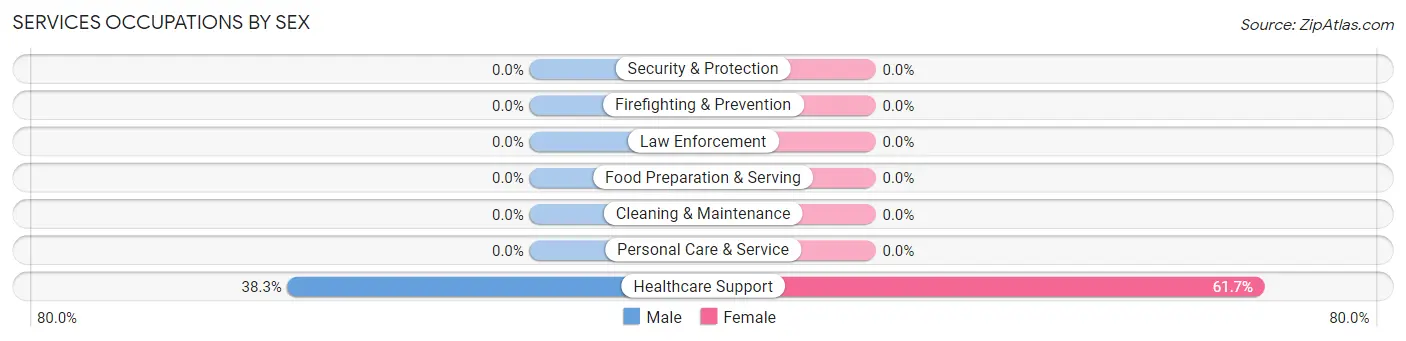
| Occupation | Male | Female |
| Healthcare Support | 23 (38.3%) | 37 (61.7%) |
| Security & Protection | 0 (0.0%) | 0 (0.0%) |
| Firefighting & Prevention | 0 (0.0%) | 0 (0.0%) |
| Law Enforcement | 0 (0.0%) | 0 (0.0%) |
| Food Preparation & Serving | 0 (0.0%) | 0 (0.0%) |
| Cleaning & Maintenance | 0 (0.0%) | 0 (0.0%) |
| Personal Care & Service | 0 (0.0%) | 0 (0.0%) |
| Total (Category) | 23 (38.3%) | 37 (61.7%) |
| Total (Overall) | 62 (36.3%) | 109 (63.7%) |
Sales and Office Occupations
Sales and Office Occupations by Sex
| Occupation | Male | Female |
| Sales & Related | 0 (0.0%) | 0 (0.0%) |
| Office & Administration | 0 (0.0%) | 0 (0.0%) |
| Total (Category) | 0 (0.0%) | 0 (0.0%) |
| Total (Overall) | 62 (36.3%) | 109 (63.7%) |
Natural Resources, Construction and Maintenance Occupations
The most common Natural Resources, Construction and Maintenance occupations in Beulah Valley are , and Construction & Extraction (14 | 8.2%).
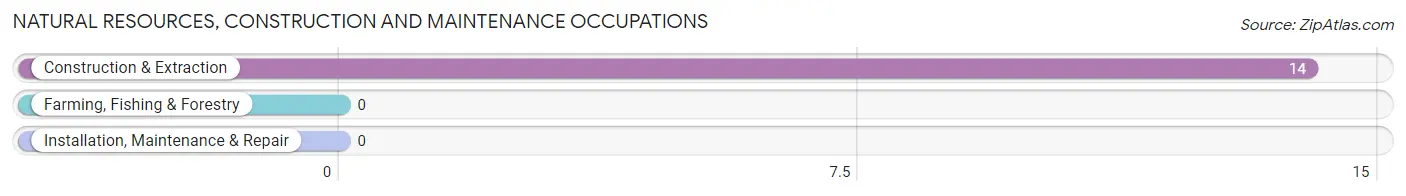
Natural Resources, Construction and Maintenance Occupations by Sex
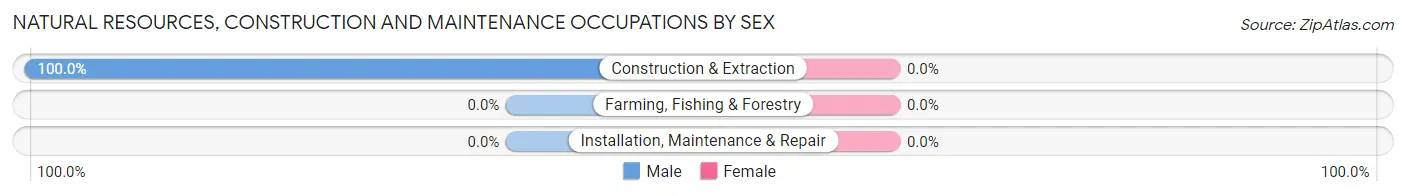
| Occupation | Male | Female |
| Farming, Fishing & Forestry | 0 (0.0%) | 0 (0.0%) |
| Construction & Extraction | 14 (100.0%) | 0 (0.0%) |
| Installation, Maintenance & Repair | 0 (0.0%) | 0 (0.0%) |
| Total (Category) | 14 (100.0%) | 0 (0.0%) |
| Total (Overall) | 62 (36.3%) | 109 (63.7%) |
Production, Transportation and Moving Occupations
The most common Production, Transportation and Moving occupations in Beulah Valley are , and Transportation (25 | 14.6%).
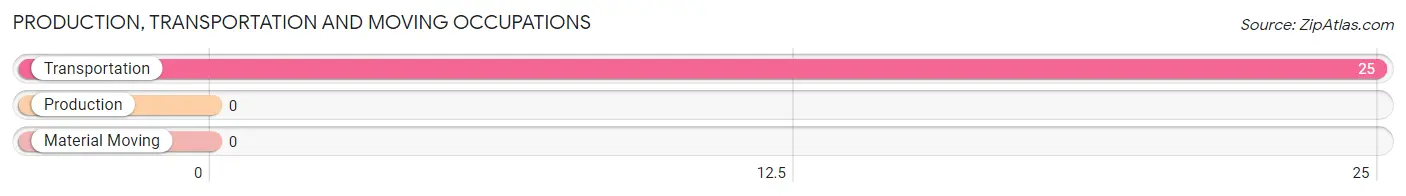
Production, Transportation and Moving Occupations by Sex
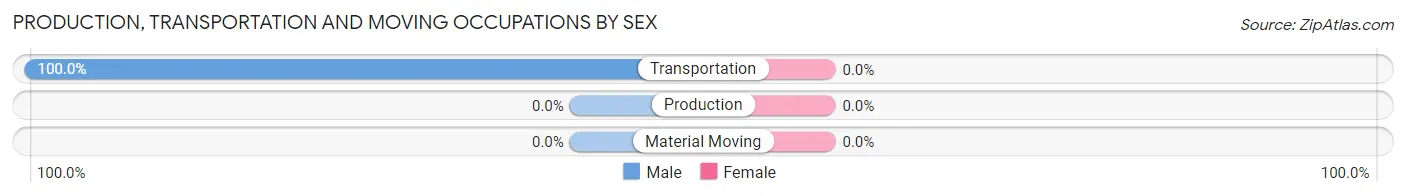
| Occupation | Male | Female |
| Production | 0 (0.0%) | 0 (0.0%) |
| Transportation | 25 (100.0%) | 0 (0.0%) |
| Material Moving | 0 (0.0%) | 0 (0.0%) |
| Total (Category) | 25 (100.0%) | 0 (0.0%) |
| Total (Overall) | 62 (36.3%) | 109 (63.7%) |
Employment Industries by Sex in Beulah Valley
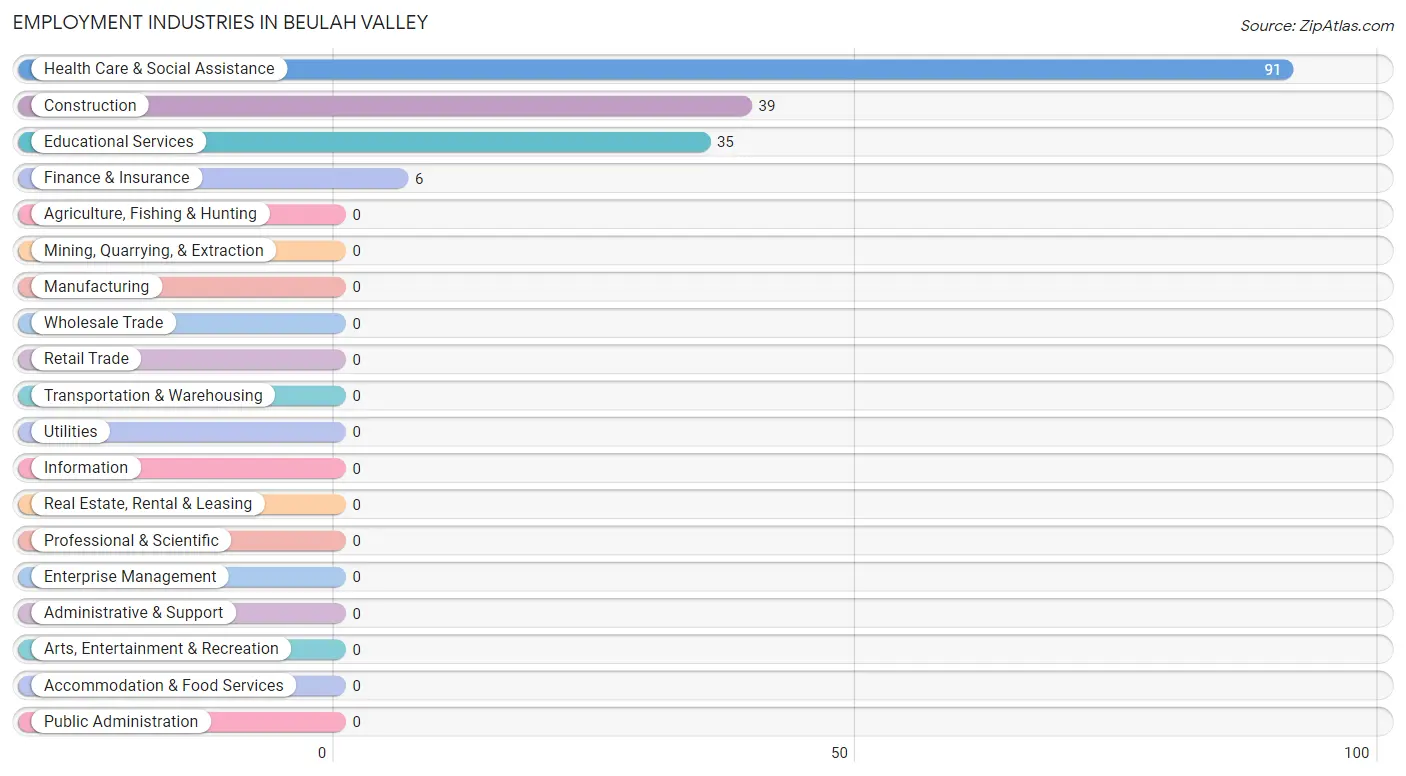
Employment Industries in Beulah Valley
The major employment industries in Beulah Valley include Health Care & Social Assistance (91 | 53.2%), Construction (39 | 22.8%), Educational Services (35 | 20.5%), and Finance & Insurance (6 | 3.5%).
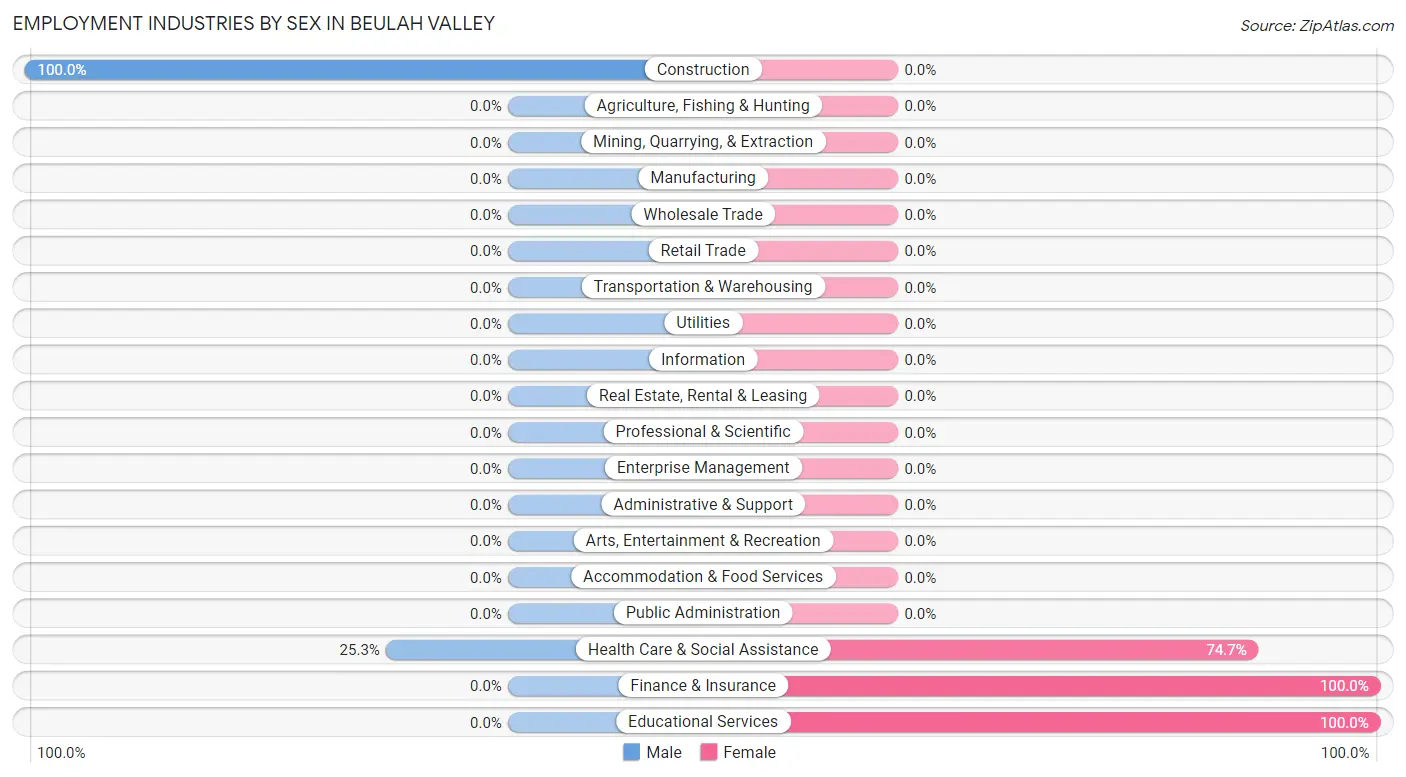
Employment Industries by Sex in Beulah Valley
The Beulah Valley industries that see more men than women are Construction (100.0%), and Health Care & Social Assistance (25.3%), whereas the industries that tend to have a higher number of women are Finance & Insurance (100.0%), Educational Services (100.0%), and Health Care & Social Assistance (74.7%).
| Industry | Male | Female |
| Agriculture, Fishing & Hunting | 0 (0.0%) | 0 (0.0%) |
| Mining, Quarrying, & Extraction | 0 (0.0%) | 0 (0.0%) |
| Construction | 39 (100.0%) | 0 (0.0%) |
| Manufacturing | 0 (0.0%) | 0 (0.0%) |
| Wholesale Trade | 0 (0.0%) | 0 (0.0%) |
| Retail Trade | 0 (0.0%) | 0 (0.0%) |
| Transportation & Warehousing | 0 (0.0%) | 0 (0.0%) |
| Utilities | 0 (0.0%) | 0 (0.0%) |
| Information | 0 (0.0%) | 0 (0.0%) |
| Finance & Insurance | 0 (0.0%) | 6 (100.0%) |
| Real Estate, Rental & Leasing | 0 (0.0%) | 0 (0.0%) |
| Professional & Scientific | 0 (0.0%) | 0 (0.0%) |
| Enterprise Management | 0 (0.0%) | 0 (0.0%) |
| Administrative & Support | 0 (0.0%) | 0 (0.0%) |
| Educational Services | 0 (0.0%) | 35 (100.0%) |
| Health Care & Social Assistance | 23 (25.3%) | 68 (74.7%) |
| Arts, Entertainment & Recreation | 0 (0.0%) | 0 (0.0%) |
| Accommodation & Food Services | 0 (0.0%) | 0 (0.0%) |
| Public Administration | 0 (0.0%) | 0 (0.0%) |
| Total | 62 (36.3%) | 109 (63.7%) |
Education in Beulah Valley
School Enrollment in Beulah Valley
The most common levels of schooling among the 149 students in Beulah Valley are elementary school (52 | 34.9%), middle school (47 | 31.5%), and high school (31 | 20.8%).
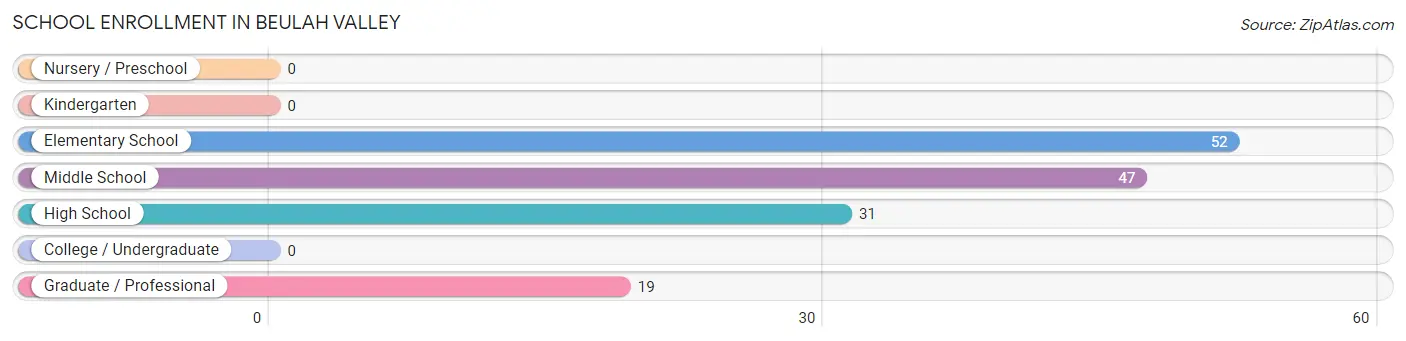
| School Level | # Students | % Students |
| Nursery / Preschool | 0 | 0.0% |
| Kindergarten | 0 | 0.0% |
| Elementary School | 52 | 34.9% |
| Middle School | 47 | 31.5% |
| High School | 31 | 20.8% |
| College / Undergraduate | 0 | 0.0% |
| Graduate / Professional | 19 | 12.8% |
| Total | 149 | 100.0% |
School Enrollment by Age by Funding Source in Beulah Valley
Out of a total of 149 students who are enrolled in schools in Beulah Valley, 12 (8.1%) attend a private institution, while the remaining 137 (91.9%) are enrolled in public schools. The age group of 35 years and over has the highest likelihood of being enrolled in private schools, with 12 (63.2% in the age bracket) enrolled. Conversely, the age group of 5 to 9 year old has the lowest likelihood of being enrolled in a private school, with 52 (100.0% in the age bracket) attending a public institution.
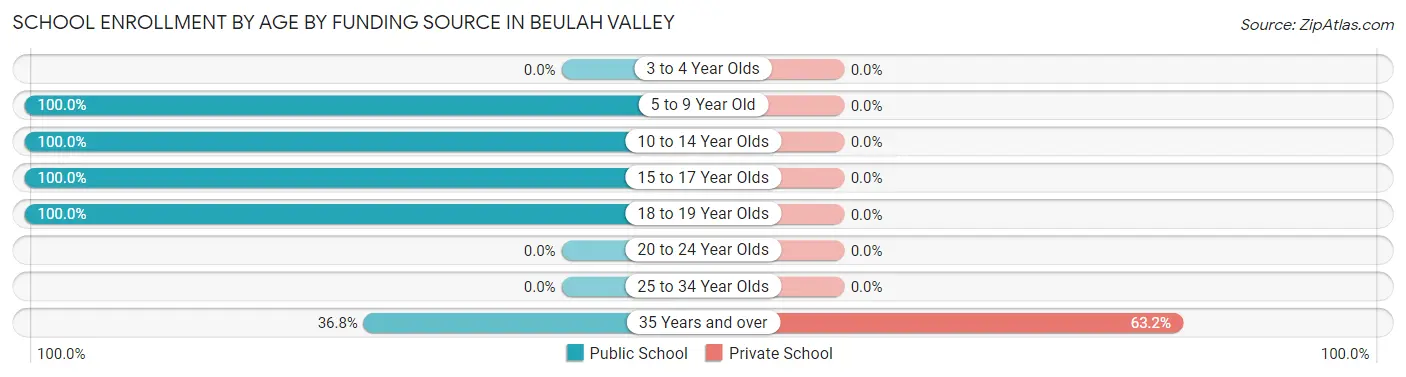
| Age Bracket | Public School | Private School |
| 3 to 4 Year Olds | 0 (0.0%) | 0 (0.0%) |
| 5 to 9 Year Old | 52 (100.0%) | 0 (0.0%) |
| 10 to 14 Year Olds | 47 (100.0%) | 0 (0.0%) |
| 15 to 17 Year Olds | 8 (100.0%) | 0 (0.0%) |
| 18 to 19 Year Olds | 23 (100.0%) | 0 (0.0%) |
| 20 to 24 Year Olds | 0 (0.0%) | 0 (0.0%) |
| 25 to 34 Year Olds | 0 (0.0%) | 0 (0.0%) |
| 35 Years and over | 7 (36.8%) | 12 (63.2%) |
| Total | 137 (91.9%) | 12 (8.1%) |
Educational Attainment by Field of Study in Beulah Valley
Literature & languages (44 | 20.3%), education (33 | 15.2%), bio, nature & agricultural (24 | 11.1%), social sciences (24 | 11.1%), and science & technology (23 | 10.6%) are the most common fields of study among 217 individuals in Beulah Valley who have obtained a bachelor's degree or higher.
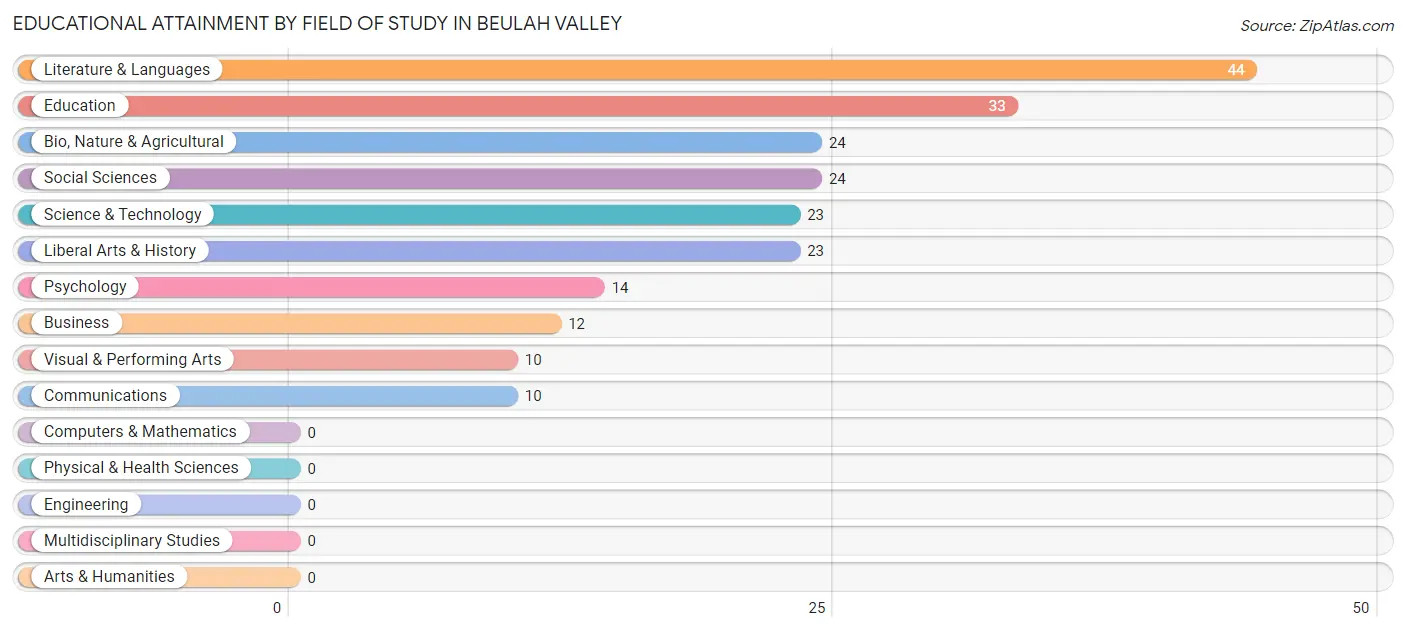
| Field of Study | # Graduates | % Graduates |
| Computers & Mathematics | 0 | 0.0% |
| Bio, Nature & Agricultural | 24 | 11.1% |
| Physical & Health Sciences | 0 | 0.0% |
| Psychology | 14 | 6.5% |
| Social Sciences | 24 | 11.1% |
| Engineering | 0 | 0.0% |
| Multidisciplinary Studies | 0 | 0.0% |
| Science & Technology | 23 | 10.6% |
| Business | 12 | 5.5% |
| Education | 33 | 15.2% |
| Literature & Languages | 44 | 20.3% |
| Liberal Arts & History | 23 | 10.6% |
| Visual & Performing Arts | 10 | 4.6% |
| Communications | 10 | 4.6% |
| Arts & Humanities | 0 | 0.0% |
| Total | 217 | 100.0% |
Transportation & Commute in Beulah Valley
Vehicle Availability by Sex in Beulah Valley
The most prevalent vehicle ownership categories in Beulah Valley are males with 3 vehicles (32, accounting for 51.6%) and females with 3 vehicles (29, making up 29.4%).
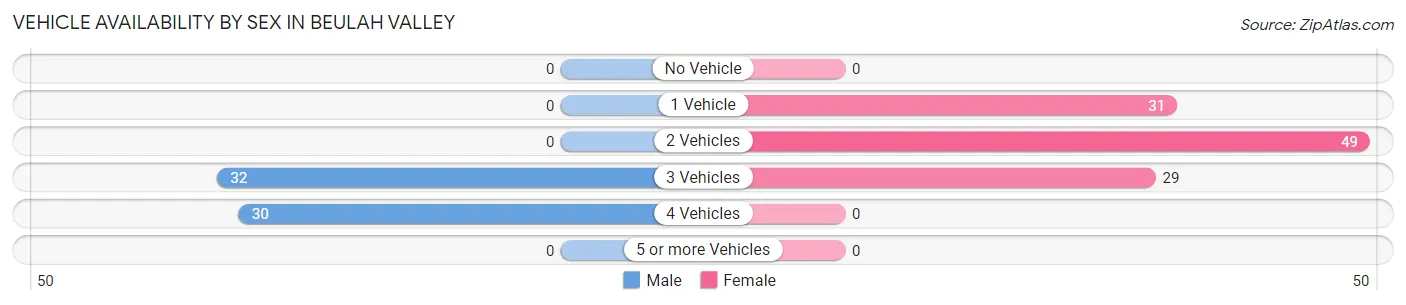
| Vehicles Available | Male | Female |
| No Vehicle | 0 (0.0%) | 0 (0.0%) |
| 1 Vehicle | 0 (0.0%) | 31 (28.4%) |
| 2 Vehicles | 0 (0.0%) | 49 (45.0%) |
| 3 Vehicles | 32 (51.6%) | 29 (26.6%) |
| 4 Vehicles | 30 (48.4%) | 0 (0.0%) |
| 5 or more Vehicles | 0 (0.0%) | 0 (0.0%) |
| Total | 62 (100.0%) | 109 (100.0%) |
Commute Time in Beulah Valley
The most frequently occuring commute durations in Beulah Valley are 30 to 34 minutes (60 commuters, 39.2%), 45 to 59 minutes (48 commuters, 31.4%), and 20 to 24 minutes (31 commuters, 20.3%).
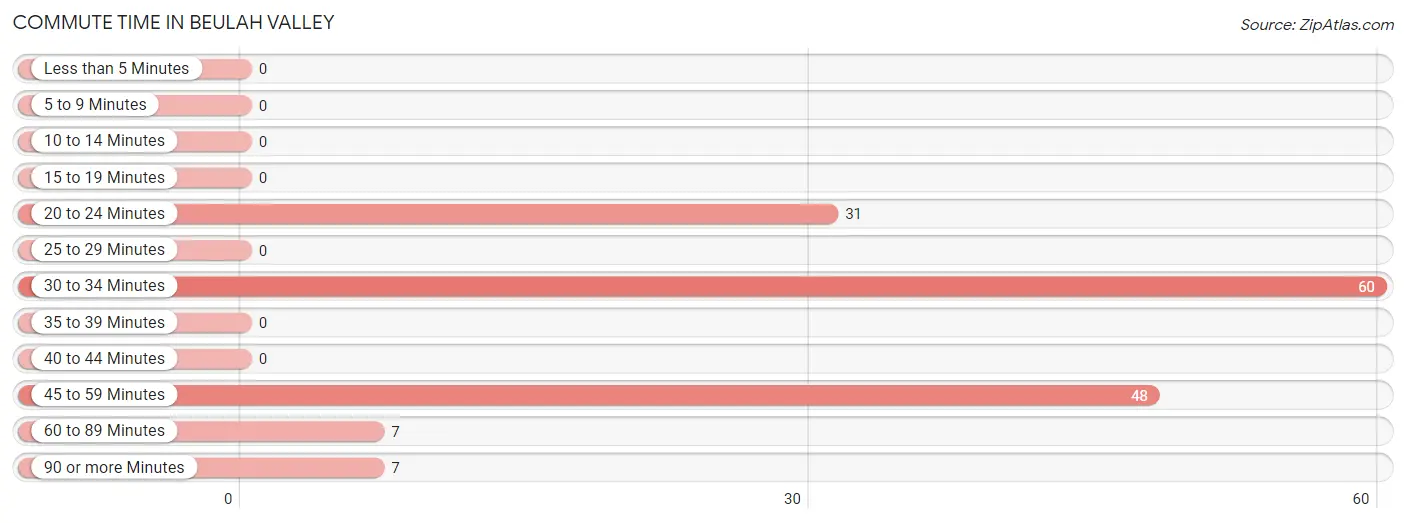
| Commute Time | # Commuters | % Commuters |
| Less than 5 Minutes | 0 | 0.0% |
| 5 to 9 Minutes | 0 | 0.0% |
| 10 to 14 Minutes | 0 | 0.0% |
| 15 to 19 Minutes | 0 | 0.0% |
| 20 to 24 Minutes | 31 | 20.3% |
| 25 to 29 Minutes | 0 | 0.0% |
| 30 to 34 Minutes | 60 | 39.2% |
| 35 to 39 Minutes | 0 | 0.0% |
| 40 to 44 Minutes | 0 | 0.0% |
| 45 to 59 Minutes | 48 | 31.4% |
| 60 to 89 Minutes | 7 | 4.6% |
| 90 or more Minutes | 7 | 4.6% |
Commute Time by Sex in Beulah Valley
The most common commute times in Beulah Valley are 45 to 59 minutes (25 commuters, 40.3%) for males and 30 to 34 minutes (37 commuters, 40.7%) for females.
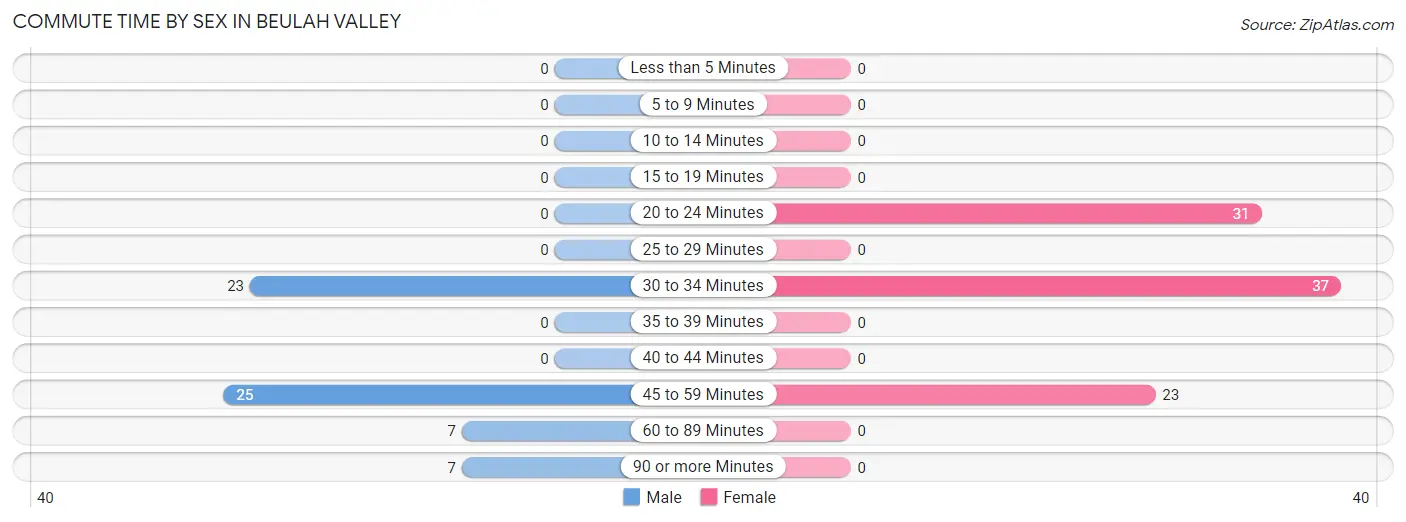
| Commute Time | Male | Female |
| Less than 5 Minutes | 0 (0.0%) | 0 (0.0%) |
| 5 to 9 Minutes | 0 (0.0%) | 0 (0.0%) |
| 10 to 14 Minutes | 0 (0.0%) | 0 (0.0%) |
| 15 to 19 Minutes | 0 (0.0%) | 0 (0.0%) |
| 20 to 24 Minutes | 0 (0.0%) | 31 (34.1%) |
| 25 to 29 Minutes | 0 (0.0%) | 0 (0.0%) |
| 30 to 34 Minutes | 23 (37.1%) | 37 (40.7%) |
| 35 to 39 Minutes | 0 (0.0%) | 0 (0.0%) |
| 40 to 44 Minutes | 0 (0.0%) | 0 (0.0%) |
| 45 to 59 Minutes | 25 (40.3%) | 23 (25.3%) |
| 60 to 89 Minutes | 7 (11.3%) | 0 (0.0%) |
| 90 or more Minutes | 7 (11.3%) | 0 (0.0%) |
Time of Departure to Work by Sex in Beulah Valley
The most frequent times of departure to work in Beulah Valley are 6:30 AM to 6:59 AM (25, 40.3%) for males and 8:30 AM to 8:59 AM (60, 65.9%) for females.
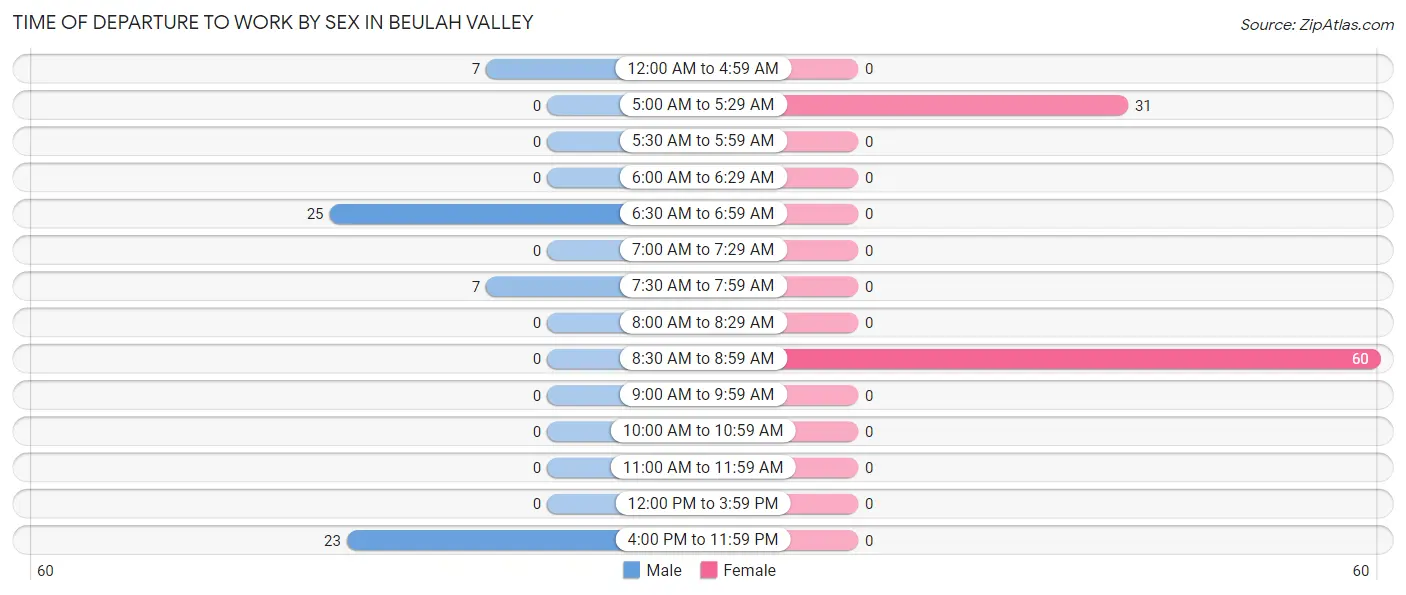
| Time of Departure | Male | Female |
| 12:00 AM to 4:59 AM | 7 (11.3%) | 0 (0.0%) |
| 5:00 AM to 5:29 AM | 0 (0.0%) | 31 (34.1%) |
| 5:30 AM to 5:59 AM | 0 (0.0%) | 0 (0.0%) |
| 6:00 AM to 6:29 AM | 0 (0.0%) | 0 (0.0%) |
| 6:30 AM to 6:59 AM | 25 (40.3%) | 0 (0.0%) |
| 7:00 AM to 7:29 AM | 0 (0.0%) | 0 (0.0%) |
| 7:30 AM to 7:59 AM | 7 (11.3%) | 0 (0.0%) |
| 8:00 AM to 8:29 AM | 0 (0.0%) | 0 (0.0%) |
| 8:30 AM to 8:59 AM | 0 (0.0%) | 60 (65.9%) |
| 9:00 AM to 9:59 AM | 0 (0.0%) | 0 (0.0%) |
| 10:00 AM to 10:59 AM | 0 (0.0%) | 0 (0.0%) |
| 11:00 AM to 11:59 AM | 0 (0.0%) | 0 (0.0%) |
| 12:00 PM to 3:59 PM | 0 (0.0%) | 0 (0.0%) |
| 4:00 PM to 11:59 PM | 23 (37.1%) | 0 (0.0%) |
| Total | 62 (100.0%) | 91 (100.0%) |
Housing Occupancy in Beulah Valley
Occupancy by Ownership in Beulah Valley
Of the total 272 dwellings in Beulah Valley, owner-occupied units account for 245 (90.1%), while renter-occupied units make up 27 (9.9%).
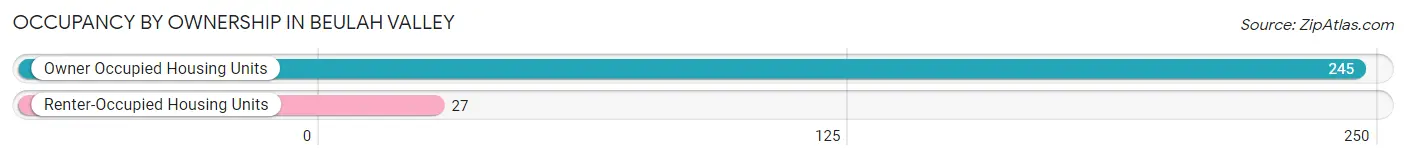
| Occupancy | # Housing Units | % Housing Units |
| Owner Occupied Housing Units | 245 | 90.1% |
| Renter-Occupied Housing Units | 27 | 9.9% |
| Total Occupied Housing Units | 272 | 100.0% |
Occupancy by Household Size in Beulah Valley
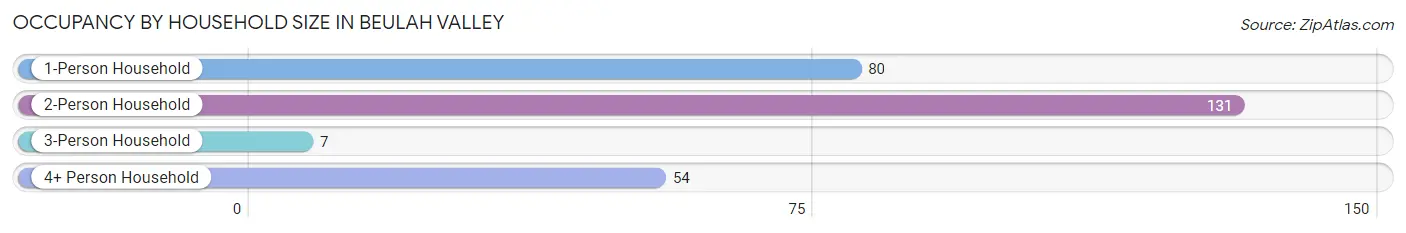
| Household Size | # Housing Units | % Housing Units |
| 1-Person Household | 80 | 29.4% |
| 2-Person Household | 131 | 48.2% |
| 3-Person Household | 7 | 2.6% |
| 4+ Person Household | 54 | 19.9% |
| Total Housing Units | 272 | 100.0% |
Occupancy by Ownership by Household Size in Beulah Valley
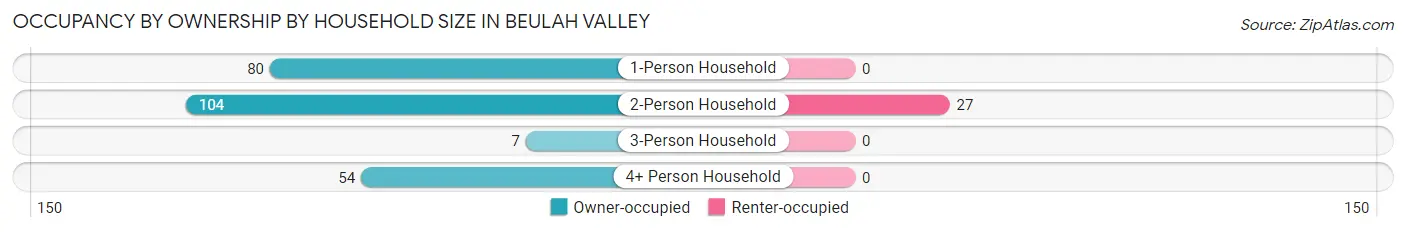
| Household Size | Owner-occupied | Renter-occupied |
| 1-Person Household | 80 (100.0%) | 0 (0.0%) |
| 2-Person Household | 104 (79.4%) | 27 (20.6%) |
| 3-Person Household | 7 (100.0%) | 0 (0.0%) |
| 4+ Person Household | 54 (100.0%) | 0 (0.0%) |
| Total Housing Units | 245 (90.1%) | 27 (9.9%) |
Occupancy by Educational Attainment in Beulah Valley
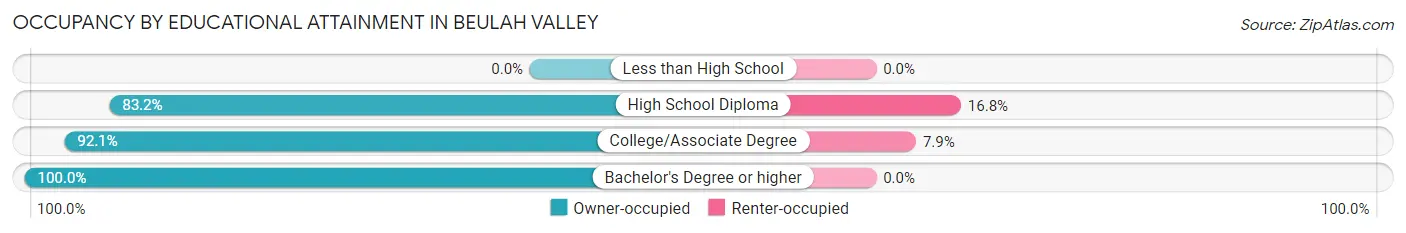
| Household Size | Owner-occupied | Renter-occupied |
| Less than High School | 0 (0.0%) | 0 (0.0%) |
| High School Diploma | 104 (83.2%) | 21 (16.8%) |
| College/Associate Degree | 70 (92.1%) | 6 (7.9%) |
| Bachelor's Degree or higher | 71 (100.0%) | 0 (0.0%) |
Occupancy by Age of Householder in Beulah Valley
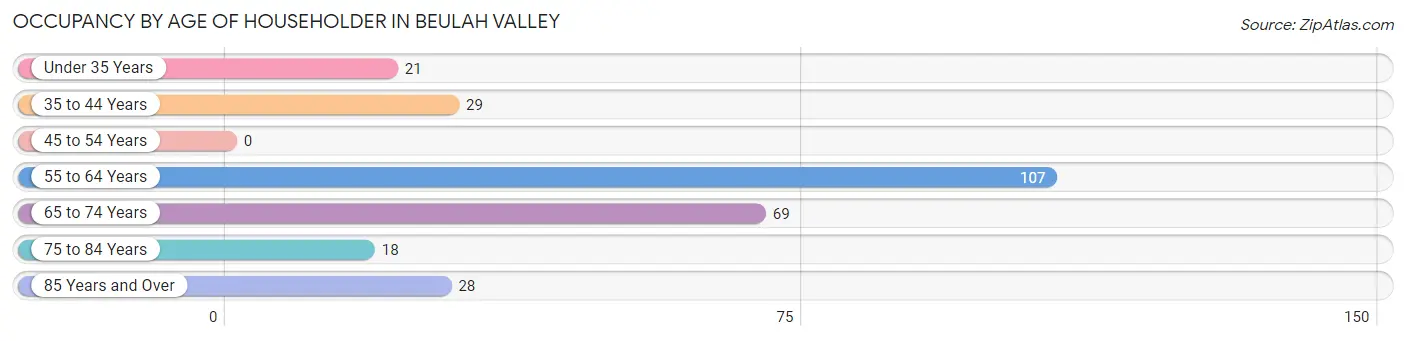
| Age Bracket | # Households | % Households |
| Under 35 Years | 21 | 7.7% |
| 35 to 44 Years | 29 | 10.7% |
| 45 to 54 Years | 0 | 0.0% |
| 55 to 64 Years | 107 | 39.3% |
| 65 to 74 Years | 69 | 25.4% |
| 75 to 84 Years | 18 | 6.6% |
| 85 Years and Over | 28 | 10.3% |
| Total | 272 | 100.0% |
Housing Finances in Beulah Valley
Median Income by Occupancy in Beulah Valley
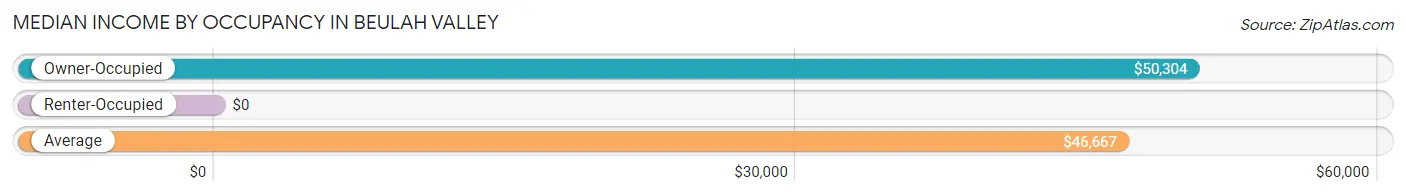
| Occupancy Type | # Households | Median Income |
| Owner-Occupied | 245 (90.1%) | $50,304 |
| Renter-Occupied | 27 (9.9%) | $0 |
| Average | 272 (100.0%) | $46,667 |
Occupancy by Householder Income Bracket in Beulah Valley
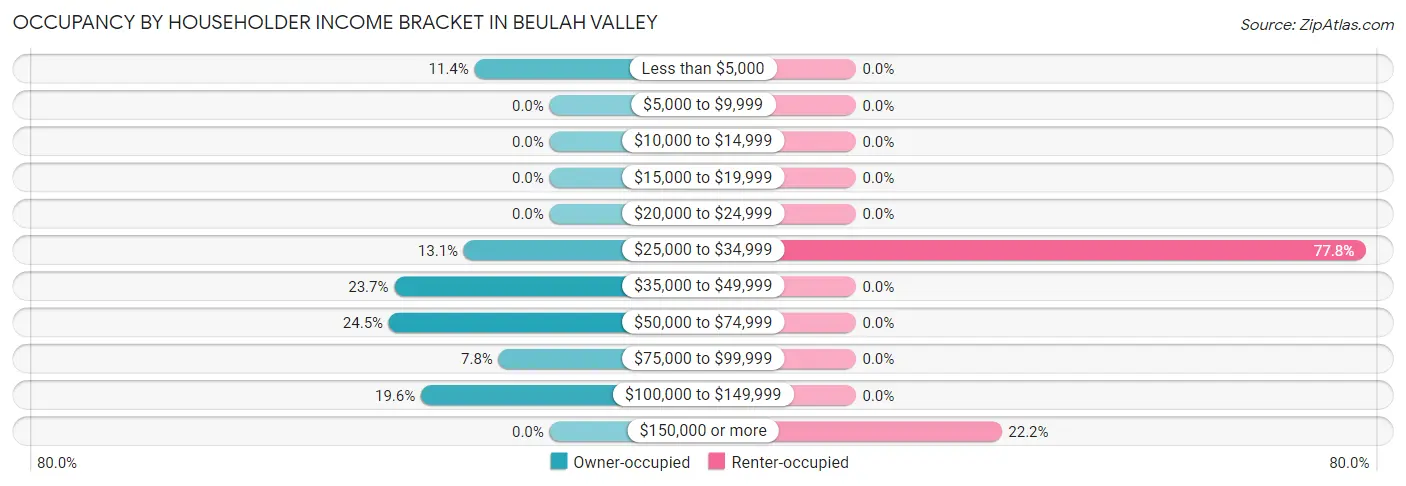
| Income Bracket | Owner-occupied | Renter-occupied |
| Less than $5,000 | 28 (11.4%) | 0 (0.0%) |
| $5,000 to $9,999 | 0 (0.0%) | 0 (0.0%) |
| $10,000 to $14,999 | 0 (0.0%) | 0 (0.0%) |
| $15,000 to $19,999 | 0 (0.0%) | 0 (0.0%) |
| $20,000 to $24,999 | 0 (0.0%) | 0 (0.0%) |
| $25,000 to $34,999 | 32 (13.1%) | 21 (77.8%) |
| $35,000 to $49,999 | 58 (23.7%) | 0 (0.0%) |
| $50,000 to $74,999 | 60 (24.5%) | 0 (0.0%) |
| $75,000 to $99,999 | 19 (7.8%) | 0 (0.0%) |
| $100,000 to $149,999 | 48 (19.6%) | 0 (0.0%) |
| $150,000 or more | 0 (0.0%) | 6 (22.2%) |
| Total | 245 (100.0%) | 27 (100.0%) |
Monthly Housing Cost Tiers in Beulah Valley
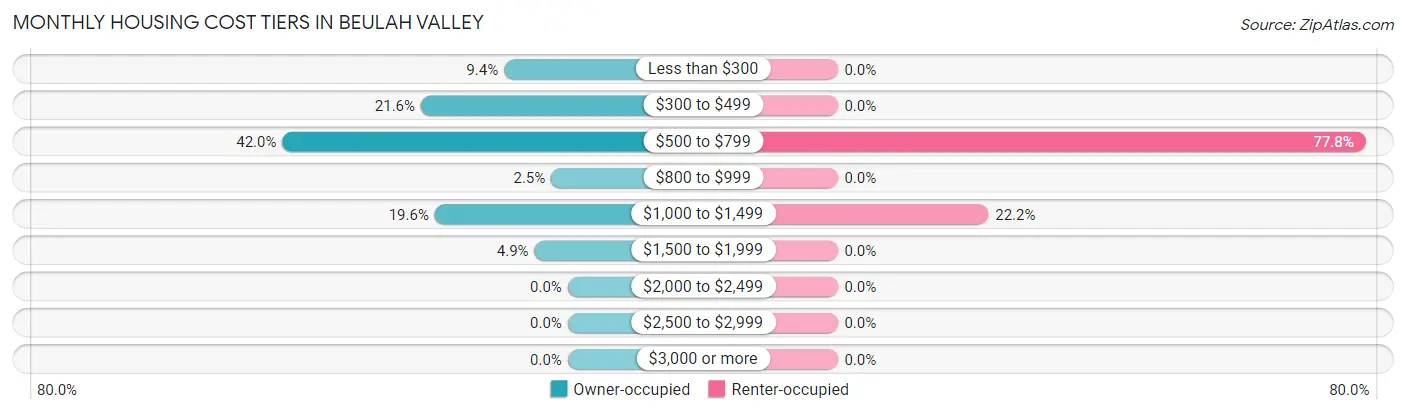
| Monthly Cost | Owner-occupied | Renter-occupied |
| Less than $300 | 23 (9.4%) | 0 (0.0%) |
| $300 to $499 | 53 (21.6%) | 0 (0.0%) |
| $500 to $799 | 103 (42.0%) | 21 (77.8%) |
| $800 to $999 | 6 (2.5%) | 0 (0.0%) |
| $1,000 to $1,499 | 48 (19.6%) | 6 (22.2%) |
| $1,500 to $1,999 | 12 (4.9%) | 0 (0.0%) |
| $2,000 to $2,499 | 0 (0.0%) | 0 (0.0%) |
| $2,500 to $2,999 | 0 (0.0%) | 0 (0.0%) |
| $3,000 or more | 0 (0.0%) | 0 (0.0%) |
| Total | 245 (100.0%) | 27 (100.0%) |
Physical Housing Characteristics in Beulah Valley
Housing Structures in Beulah Valley
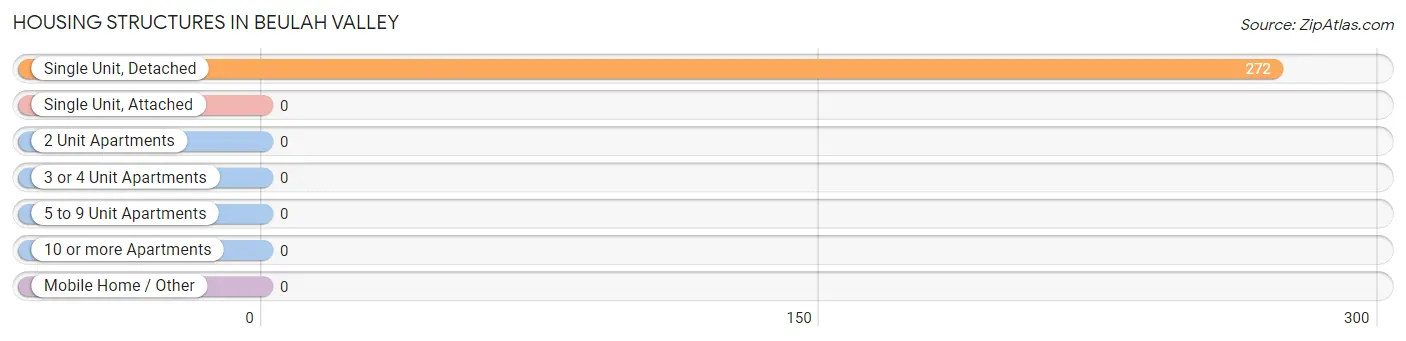
| Structure Type | # Housing Units | % Housing Units |
| Single Unit, Detached | 272 | 100.0% |
| Single Unit, Attached | 0 | 0.0% |
| 2 Unit Apartments | 0 | 0.0% |
| 3 or 4 Unit Apartments | 0 | 0.0% |
| 5 to 9 Unit Apartments | 0 | 0.0% |
| 10 or more Apartments | 0 | 0.0% |
| Mobile Home / Other | 0 | 0.0% |
| Total | 272 | 100.0% |
Housing Structures by Occupancy in Beulah Valley
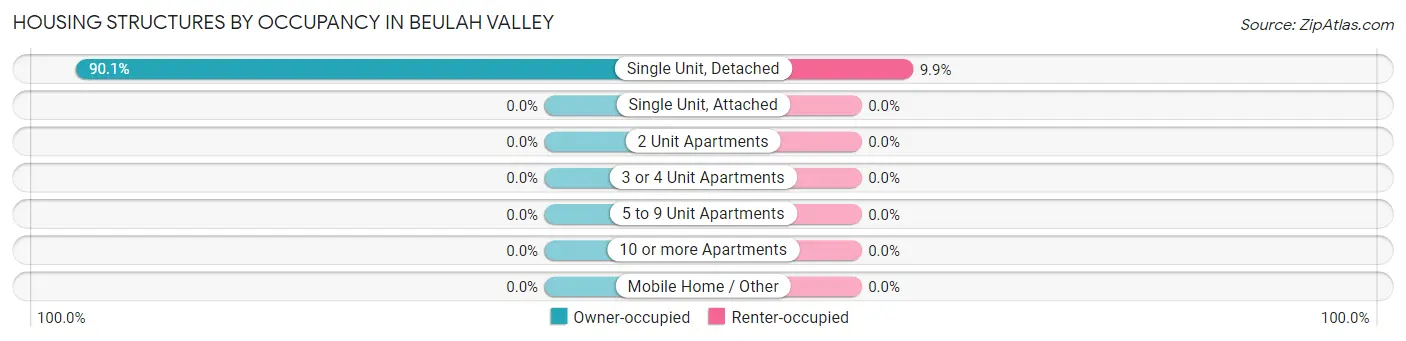
| Structure Type | Owner-occupied | Renter-occupied |
| Single Unit, Detached | 245 (90.1%) | 27 (9.9%) |
| Single Unit, Attached | 0 (0.0%) | 0 (0.0%) |
| 2 Unit Apartments | 0 (0.0%) | 0 (0.0%) |
| 3 or 4 Unit Apartments | 0 (0.0%) | 0 (0.0%) |
| 5 to 9 Unit Apartments | 0 (0.0%) | 0 (0.0%) |
| 10 or more Apartments | 0 (0.0%) | 0 (0.0%) |
| Mobile Home / Other | 0 (0.0%) | 0 (0.0%) |
| Total | 245 (90.1%) | 27 (9.9%) |
Housing Structures by Number of Rooms in Beulah Valley
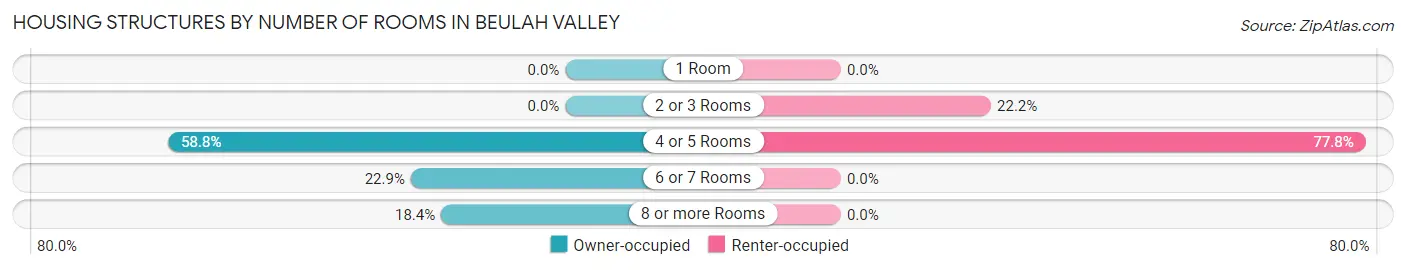
| Number of Rooms | Owner-occupied | Renter-occupied |
| 1 Room | 0 (0.0%) | 0 (0.0%) |
| 2 or 3 Rooms | 0 (0.0%) | 6 (22.2%) |
| 4 or 5 Rooms | 144 (58.8%) | 21 (77.8%) |
| 6 or 7 Rooms | 56 (22.9%) | 0 (0.0%) |
| 8 or more Rooms | 45 (18.4%) | 0 (0.0%) |
| Total | 245 (100.0%) | 27 (100.0%) |
Housing Structure by Heating Type in Beulah Valley
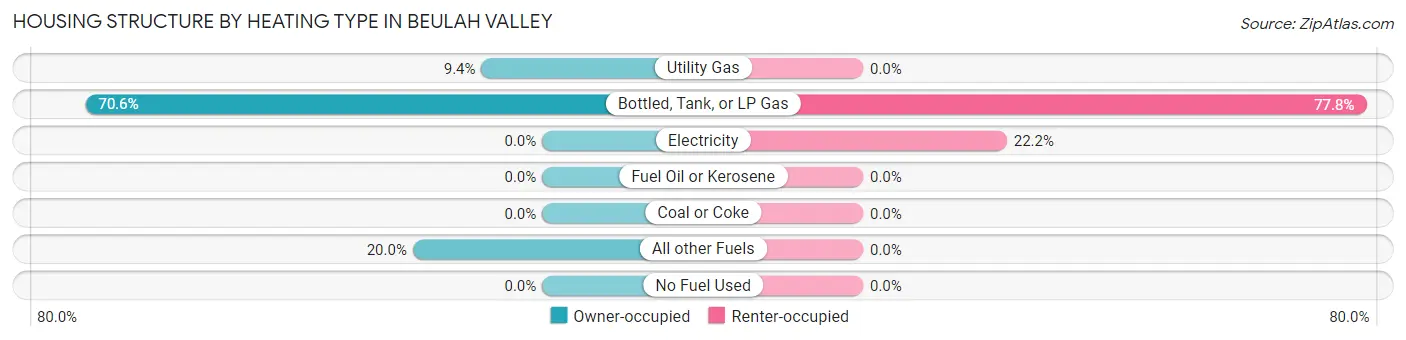
| Heating Type | Owner-occupied | Renter-occupied |
| Utility Gas | 23 (9.4%) | 0 (0.0%) |
| Bottled, Tank, or LP Gas | 173 (70.6%) | 21 (77.8%) |
| Electricity | 0 (0.0%) | 6 (22.2%) |
| Fuel Oil or Kerosene | 0 (0.0%) | 0 (0.0%) |
| Coal or Coke | 0 (0.0%) | 0 (0.0%) |
| All other Fuels | 49 (20.0%) | 0 (0.0%) |
| No Fuel Used | 0 (0.0%) | 0 (0.0%) |
| Total | 245 (100.0%) | 27 (100.0%) |
Household Vehicle Usage in Beulah Valley
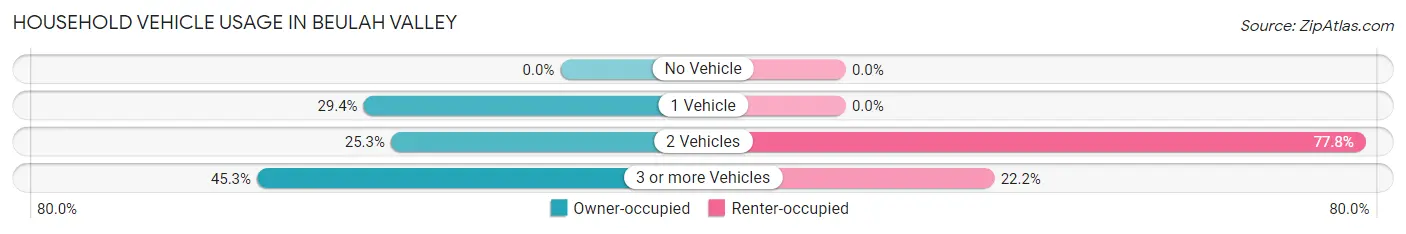
| Vehicles per Household | Owner-occupied | Renter-occupied |
| No Vehicle | 0 (0.0%) | 0 (0.0%) |
| 1 Vehicle | 72 (29.4%) | 0 (0.0%) |
| 2 Vehicles | 62 (25.3%) | 21 (77.8%) |
| 3 or more Vehicles | 111 (45.3%) | 6 (22.2%) |
| Total | 245 (100.0%) | 27 (100.0%) |
Real Estate & Mortgages in Beulah Valley
Real Estate and Mortgage Overview in Beulah Valley
| Characteristic | Without Mortgage | With Mortgage |
| Housing Units | 160 | 85 |
| Median Property Value | $281,800 | $139,100 |
| Median Household Income | $50,203 | $0 |
| Monthly Housing Costs | $544 | $0 |
| Real Estate Taxes | $1,675 | $0 |
Property Value by Mortgage Status in Beulah Valley
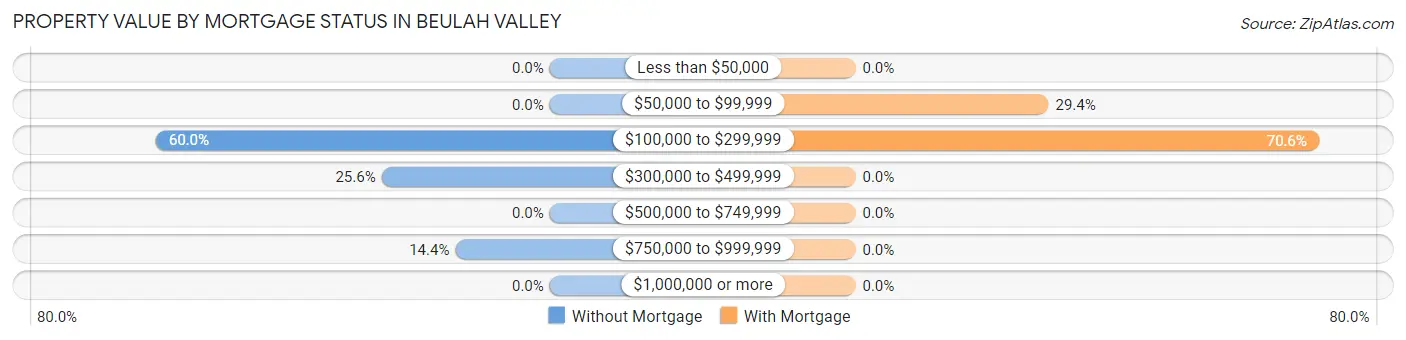
| Property Value | Without Mortgage | With Mortgage |
| Less than $50,000 | 0 (0.0%) | 0 (0.0%) |
| $50,000 to $99,999 | 0 (0.0%) | 25 (29.4%) |
| $100,000 to $299,999 | 96 (60.0%) | 60 (70.6%) |
| $300,000 to $499,999 | 41 (25.6%) | 0 (0.0%) |
| $500,000 to $749,999 | 0 (0.0%) | 0 (0.0%) |
| $750,000 to $999,999 | 23 (14.4%) | 0 (0.0%) |
| $1,000,000 or more | 0 (0.0%) | 0 (0.0%) |
| Total | 160 (100.0%) | 85 (100.0%) |
Household Income by Mortgage Status in Beulah Valley
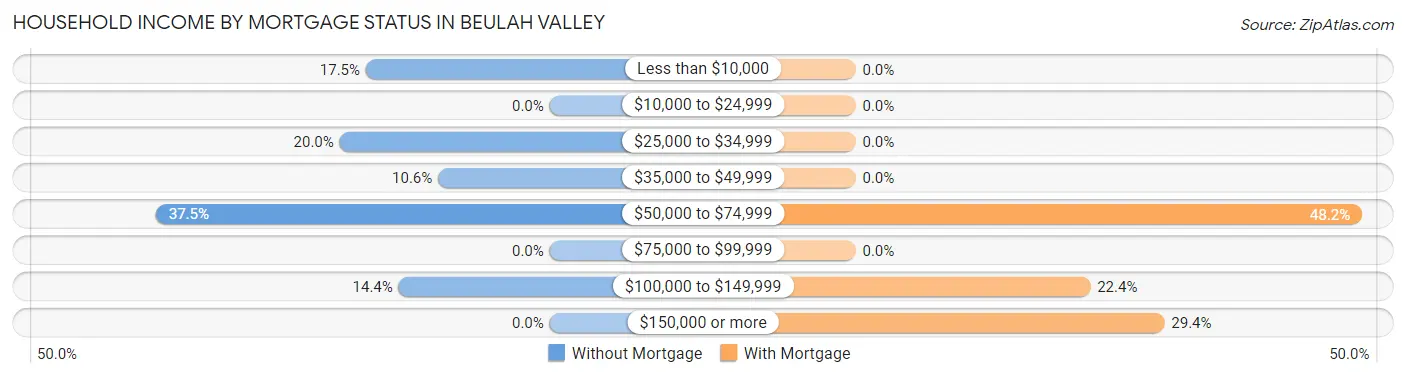
| Household Income | Without Mortgage | With Mortgage |
| Less than $10,000 | 28 (17.5%) | 0 (0.0%) |
| $10,000 to $24,999 | 0 (0.0%) | 0 (0.0%) |
| $25,000 to $34,999 | 32 (20.0%) | 0 (0.0%) |
| $35,000 to $49,999 | 17 (10.6%) | 0 (0.0%) |
| $50,000 to $74,999 | 60 (37.5%) | 41 (48.2%) |
| $75,000 to $99,999 | 0 (0.0%) | 0 (0.0%) |
| $100,000 to $149,999 | 23 (14.4%) | 19 (22.4%) |
| $150,000 or more | 0 (0.0%) | 25 (29.4%) |
| Total | 160 (100.0%) | 85 (100.0%) |
Property Value to Household Income Ratio in Beulah Valley
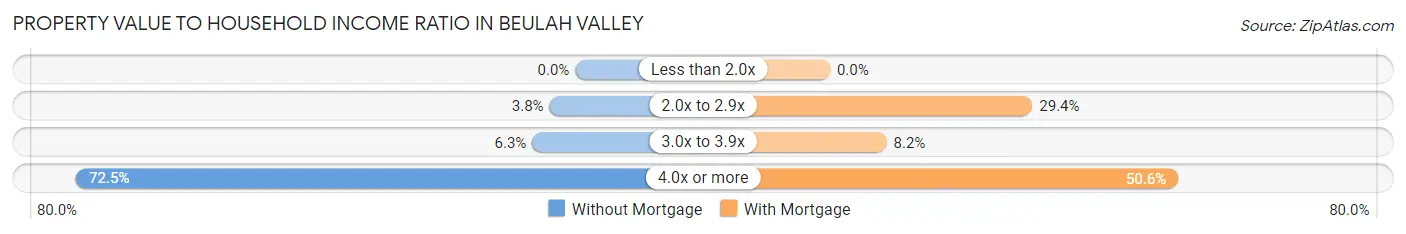
| Value-to-Income Ratio | Without Mortgage | With Mortgage |
| Less than 2.0x | 0 (0.0%) | 0 (0.0%) |
| 2.0x to 2.9x | 6 (3.7%) | 25 (29.4%) |
| 3.0x to 3.9x | 10 (6.2%) | 7 (8.2%) |
| 4.0x or more | 116 (72.5%) | 43 (50.6%) |
| Total | 160 (100.0%) | 85 (100.0%) |
Real Estate Taxes by Mortgage Status in Beulah Valley
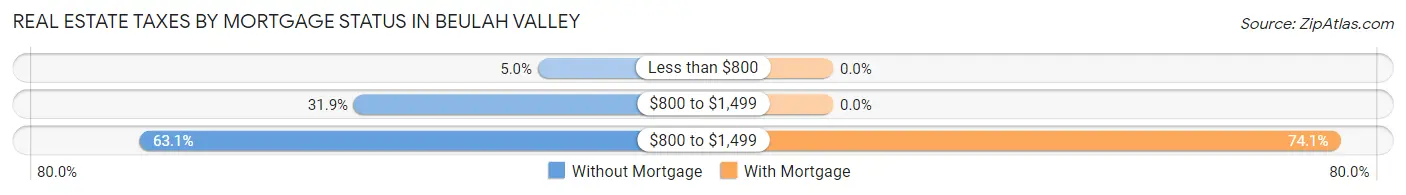
| Property Taxes | Without Mortgage | With Mortgage |
| Less than $800 | 8 (5.0%) | 0 (0.0%) |
| $800 to $1,499 | 51 (31.9%) | 0 (0.0%) |
| $800 to $1,499 | 101 (63.1%) | 63 (74.1%) |
| Total | 160 (100.0%) | 85 (100.0%) |
Health & Disability in Beulah Valley
Health Insurance Coverage by Age in Beulah Valley
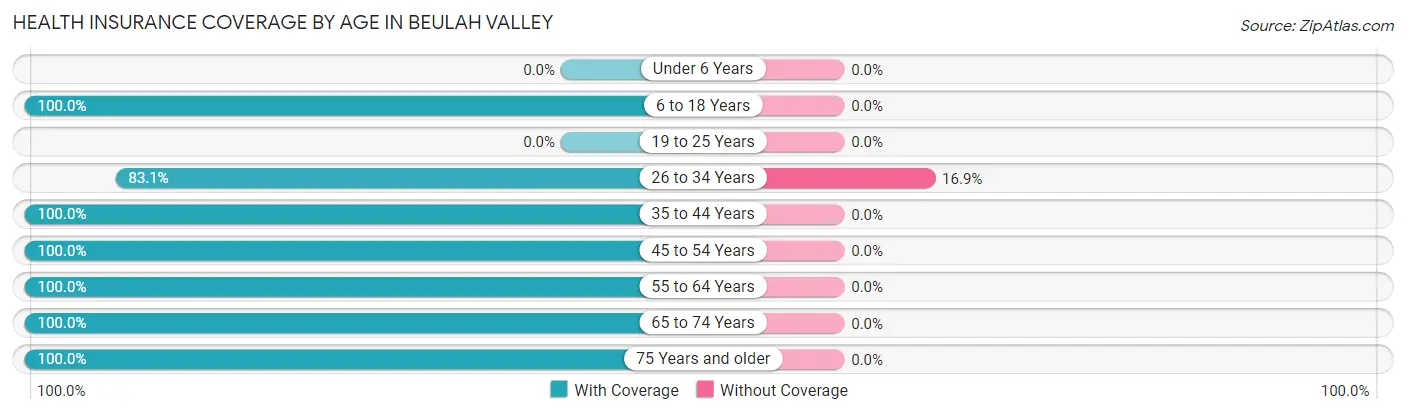
| Age Bracket | With Coverage | Without Coverage |
| Under 6 Years | 0 (0.0%) | 0 (0.0%) |
| 6 to 18 Years | 130 (100.0%) | 0 (0.0%) |
| 19 to 25 Years | 0 (0.0%) | 0 (0.0%) |
| 26 to 34 Years | 103 (83.1%) | 21 (16.9%) |
| 35 to 44 Years | 61 (100.0%) | 0 (0.0%) |
| 45 to 54 Years | 7 (100.0%) | 0 (0.0%) |
| 55 to 64 Years | 144 (100.0%) | 0 (0.0%) |
| 65 to 74 Years | 89 (100.0%) | 0 (0.0%) |
| 75 Years and older | 88 (100.0%) | 0 (0.0%) |
| Total | 622 (96.7%) | 21 (3.3%) |
Health Insurance Coverage by Citizenship Status in Beulah Valley
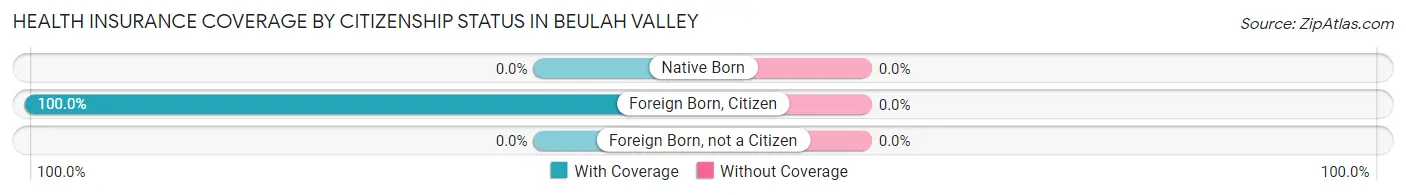
| Citizenship Status | With Coverage | Without Coverage |
| Native Born | 0 (0.0%) | 0 (0.0%) |
| Foreign Born, Citizen | 130 (100.0%) | 0 (0.0%) |
| Foreign Born, not a Citizen | 0 (0.0%) | 0 (0.0%) |
Health Insurance Coverage by Household Income in Beulah Valley
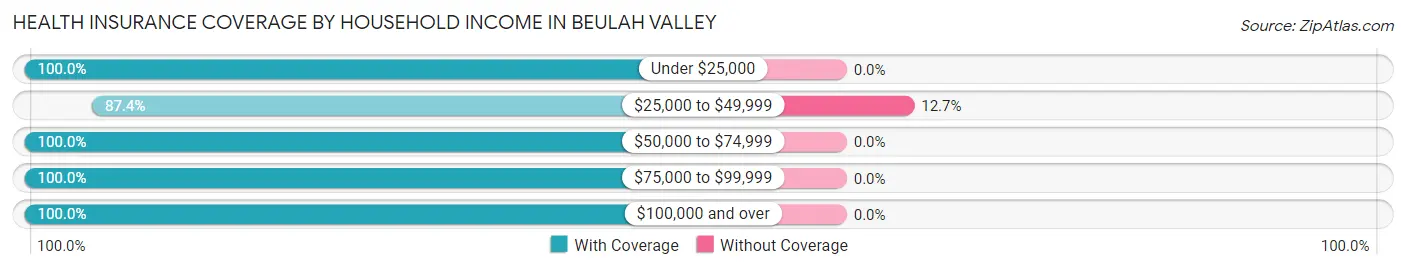
| Household Income | With Coverage | Without Coverage |
| Under $25,000 | 28 (100.0%) | 0 (0.0%) |
| $25,000 to $49,999 | 145 (87.4%) | 21 (12.7%) |
| $50,000 to $74,999 | 123 (100.0%) | 0 (0.0%) |
| $75,000 to $99,999 | 45 (100.0%) | 0 (0.0%) |
| $100,000 and over | 281 (100.0%) | 0 (0.0%) |
Public vs Private Health Insurance Coverage by Age in Beulah Valley
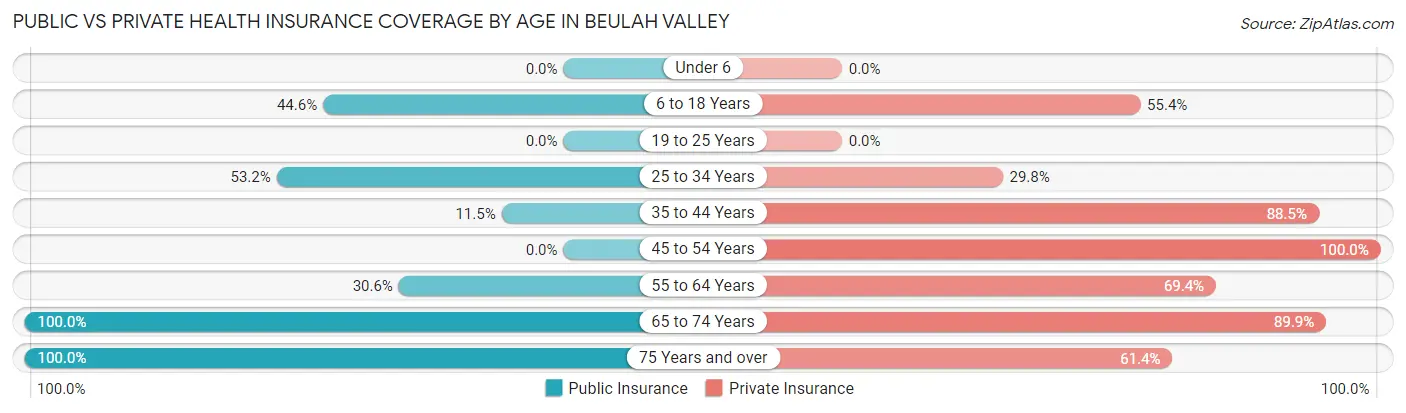
| Age Bracket | Public Insurance | Private Insurance |
| Under 6 | 0 (0.0%) | 0 (0.0%) |
| 6 to 18 Years | 58 (44.6%) | 72 (55.4%) |
| 19 to 25 Years | 0 (0.0%) | 0 (0.0%) |
| 25 to 34 Years | 66 (53.2%) | 37 (29.8%) |
| 35 to 44 Years | 7 (11.5%) | 54 (88.5%) |
| 45 to 54 Years | 0 (0.0%) | 7 (100.0%) |
| 55 to 64 Years | 44 (30.6%) | 100 (69.4%) |
| 65 to 74 Years | 89 (100.0%) | 80 (89.9%) |
| 75 Years and over | 88 (100.0%) | 54 (61.4%) |
| Total | 352 (54.7%) | 404 (62.8%) |
Disability Status by Sex by Age in Beulah Valley
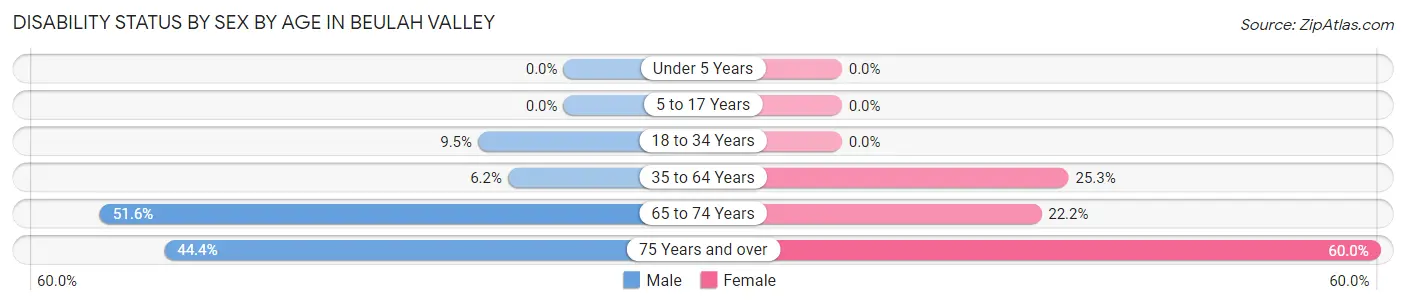
| Age Bracket | Male | Female |
| Under 5 Years | 0 (0.0%) | 0 (0.0%) |
| 5 to 17 Years | 0 (0.0%) | 0 (0.0%) |
| 18 to 34 Years | 8 (9.5%) | 0 (0.0%) |
| 35 to 64 Years | 7 (6.2%) | 25 (25.3%) |
| 65 to 74 Years | 32 (51.6%) | 6 (22.2%) |
| 75 Years and over | 8 (44.4%) | 42 (60.0%) |
Disability Class by Sex by Age in Beulah Valley
Disability Class: Hearing Difficulty
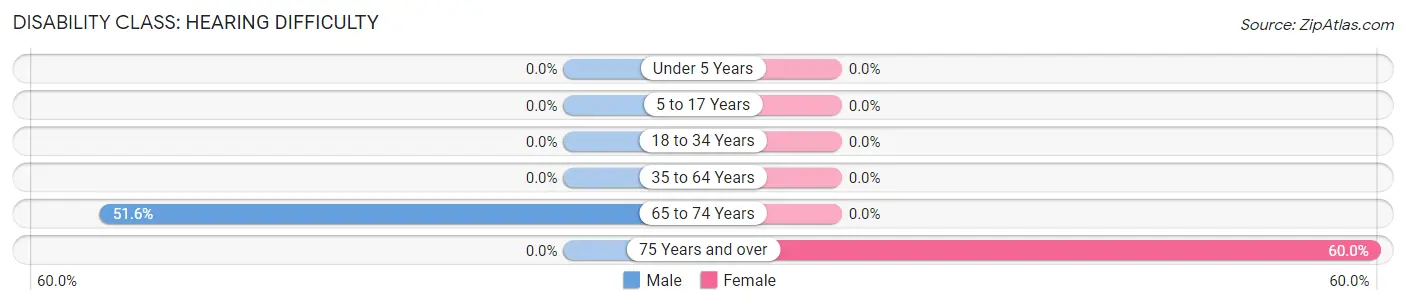
| Age Bracket | Male | Female |
| Under 5 Years | 0 (0.0%) | 0 (0.0%) |
| 5 to 17 Years | 0 (0.0%) | 0 (0.0%) |
| 18 to 34 Years | 0 (0.0%) | 0 (0.0%) |
| 35 to 64 Years | 0 (0.0%) | 0 (0.0%) |
| 65 to 74 Years | 32 (51.6%) | 0 (0.0%) |
| 75 Years and over | 0 (0.0%) | 42 (60.0%) |
Disability Class: Vision Difficulty
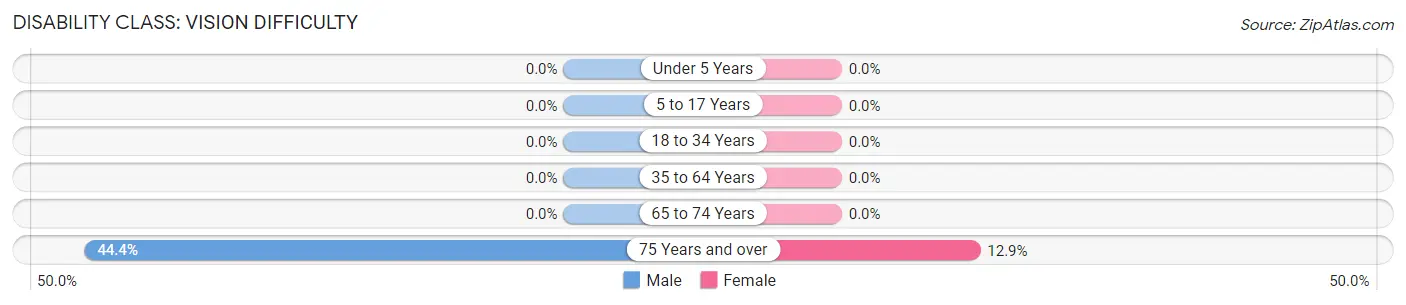
| Age Bracket | Male | Female |
| Under 5 Years | 0 (0.0%) | 0 (0.0%) |
| 5 to 17 Years | 0 (0.0%) | 0 (0.0%) |
| 18 to 34 Years | 0 (0.0%) | 0 (0.0%) |
| 35 to 64 Years | 0 (0.0%) | 0 (0.0%) |
| 65 to 74 Years | 0 (0.0%) | 0 (0.0%) |
| 75 Years and over | 8 (44.4%) | 9 (12.9%) |
Disability Class: Cognitive Difficulty
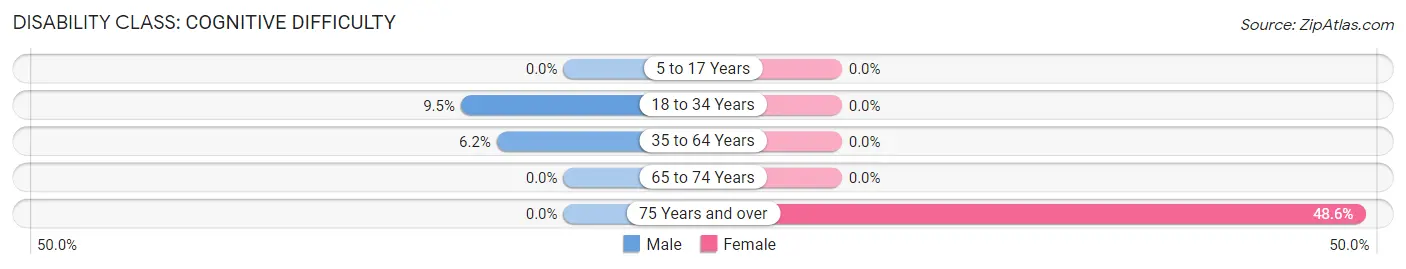
| Age Bracket | Male | Female |
| 5 to 17 Years | 0 (0.0%) | 0 (0.0%) |
| 18 to 34 Years | 8 (9.5%) | 0 (0.0%) |
| 35 to 64 Years | 7 (6.2%) | 0 (0.0%) |
| 65 to 74 Years | 0 (0.0%) | 0 (0.0%) |
| 75 Years and over | 0 (0.0%) | 34 (48.6%) |
Disability Class: Ambulatory Difficulty
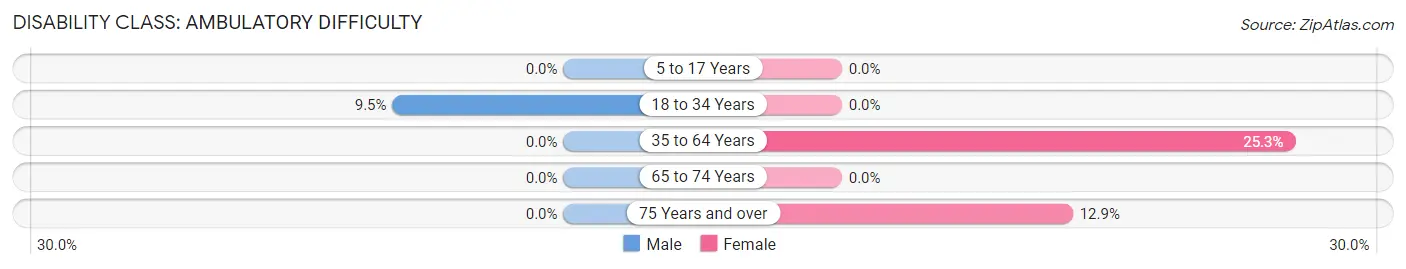
| Age Bracket | Male | Female |
| 5 to 17 Years | 0 (0.0%) | 0 (0.0%) |
| 18 to 34 Years | 8 (9.5%) | 0 (0.0%) |
| 35 to 64 Years | 0 (0.0%) | 25 (25.3%) |
| 65 to 74 Years | 0 (0.0%) | 0 (0.0%) |
| 75 Years and over | 0 (0.0%) | 9 (12.9%) |
Disability Class: Self-Care Difficulty
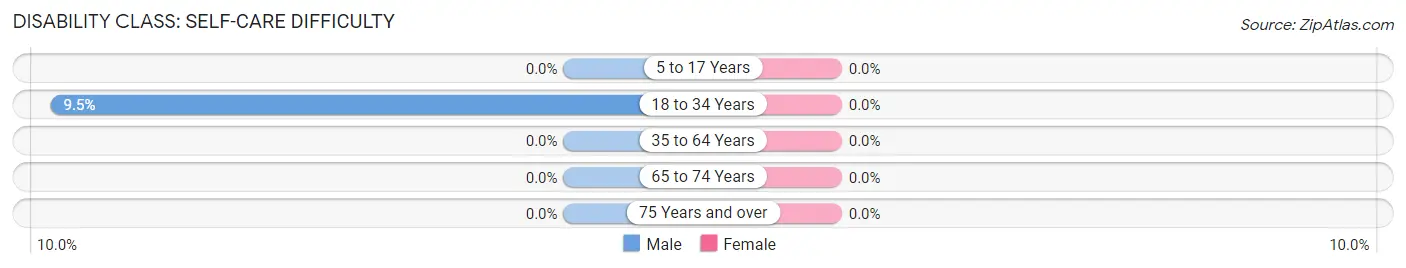
| Age Bracket | Male | Female |
| 5 to 17 Years | 0 (0.0%) | 0 (0.0%) |
| 18 to 34 Years | 8 (9.5%) | 0 (0.0%) |
| 35 to 64 Years | 0 (0.0%) | 0 (0.0%) |
| 65 to 74 Years | 0 (0.0%) | 0 (0.0%) |
| 75 Years and over | 0 (0.0%) | 0 (0.0%) |
Technology Access in Beulah Valley
Computing Device Access in Beulah Valley
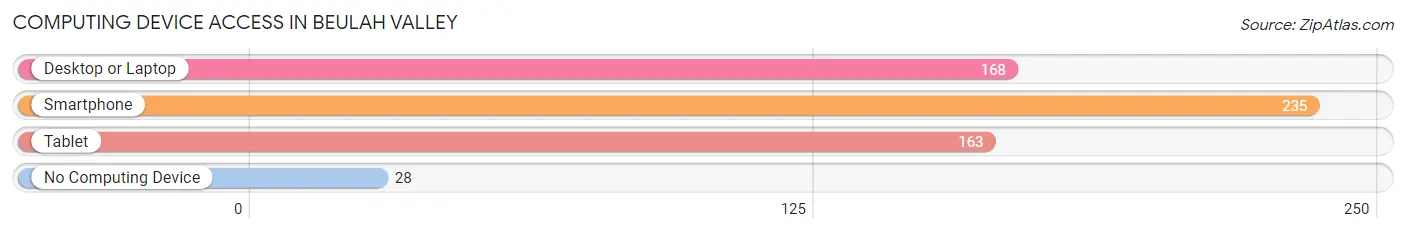
| Device Type | # Households | % Households |
| Desktop or Laptop | 168 | 61.8% |
| Smartphone | 235 | 86.4% |
| Tablet | 163 | 59.9% |
| No Computing Device | 28 | 10.3% |
| Total | 272 | 100.0% |
Internet Access in Beulah Valley
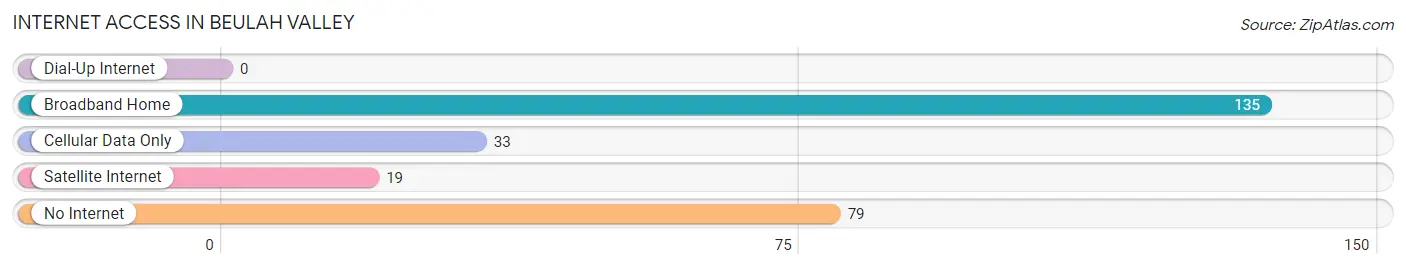
| Internet Type | # Households | % Households |
| Dial-Up Internet | 0 | 0.0% |
| Broadband Home | 135 | 49.6% |
| Cellular Data Only | 33 | 12.1% |
| Satellite Internet | 19 | 7.0% |
| No Internet | 79 | 29.0% |
| Total | 272 | 100.0% |
Beulah Valley Summary
Beulah Valley is a small unincorporated community located in Pueblo County, Colorado. It is situated in the Wet Mountain Valley, at an elevation of 8,000 feet, and is surrounded by the Sangre de Cristo Mountains. The population of Beulah Valley was estimated to be around 1,000 in 2020.
History
Beulah Valley was first settled in the late 1800s by miners and ranchers. The area was originally known as “Beulah”, after the biblical city of Beulah. The name was changed to Beulah Valley in the early 1900s.
The area was home to several small mining operations, including the Beulah Mine, which was in operation from 1891 to 1910. The Beulah Mine was the largest producer of gold in the Wet Mountain Valley.
The town of Beulah Valley was officially incorporated in 1910. The town was home to a variety of businesses, including a general store, a hotel, a saloon, and a post office.
Geography
Beulah Valley is located in the Wet Mountain Valley, at an elevation of 8,000 feet. The valley is surrounded by the Sangre de Cristo Mountains, which reach heights of up to 14,000 feet.
The valley is home to several small streams, including the Beulah Creek, which flows through the town. The valley is also home to several small lakes, including the Beulah Reservoir.
The climate in Beulah Valley is semi-arid, with hot summers and cold winters. The average annual temperature is around 50 degrees Fahrenheit.
Economy
The economy of Beulah Valley is largely based on agriculture and tourism. The area is home to several small farms, which produce a variety of crops, including hay, alfalfa, and potatoes.
The area is also home to several small businesses, including restaurants, stores, and lodging. Tourism is an important part of the local economy, as the area is home to several popular attractions, including the Beulah Reservoir, the Beulah Mine, and the Sangre de Cristo Mountains.
Demographics
The population of Beulah Valley was estimated to be around 1,000 in 2020. The majority of the population is white (90%), with the remaining population being made up of Hispanic (7%), Native American (2%), and other (1%) ethnicities.
The median household income in Beulah Valley is around $50,000, and the median home value is around $200,000. The unemployment rate in the area is around 4%.
Conclusion
Beulah Valley is a small unincorporated community located in Pueblo County, Colorado. It is situated in the Wet Mountain Valley, at an elevation of 8,000 feet, and is surrounded by the Sangre de Cristo Mountains. The population of Beulah Valley was estimated to be around 1,000 in 2020. The economy of Beulah Valley is largely based on agriculture and tourism, and the median household income is around $50,000. Beulah Valley is a popular tourist destination, and is home to several popular attractions, including the Beulah Reservoir, the Beulah Mine, and the Sangre de Cristo Mountains.
Common Questions
What is Per Capita Income in Beulah Valley?
Per Capita income in Beulah Valley is $25,562.
What is the Median Household income in Beulah Valley?
Median Household Income in Beulah Valley is $46,667.
What is Inequality or Gini Index in Beulah Valley?
Inequality or Gini Index in Beulah Valley is 0.40.
What is the Total Population of Beulah Valley?
Total Population of Beulah Valley is 643.
What is the Total Male Population of Beulah Valley?
Total Male Population of Beulah Valley is 337.
What is the Total Female Population of Beulah Valley?
Total Female Population of Beulah Valley is 306.
What is the Ratio of Males per 100 Females in Beulah Valley?
There are 110.13 Males per 100 Females in Beulah Valley.
What is the Ratio of Females per 100 Males in Beulah Valley?
There are 90.80 Females per 100 Males in Beulah Valley.
What is the Median Population Age in Beulah Valley?
Median Population Age in Beulah Valley is 47.9 Years.
What is the Average Family Size in Beulah Valley
Average Family Size in Beulah Valley is 2.9 People.
What is the Average Household Size in Beulah Valley
Average Household Size in Beulah Valley is 2.4 People.
How Large is the Labor Force in Beulah Valley?
There are 195 People in the Labor Forcein in Beulah Valley.
What is the Percentage of People in the Labor Force in Beulah Valley?
36.4% of People are in the Labor Force in Beulah Valley.
What is the Unemployment Rate in Beulah Valley?
Unemployment Rate in Beulah Valley is 12.3%.