Zip Codes with the Highest Percentage of Population Employed in Health Diagnosing & Treating in Colorado Springs, CO
RELATED REPORTS & OPTIONS
Health Diagnosing & Treating
Colorado Springs
Compare Zip Codes
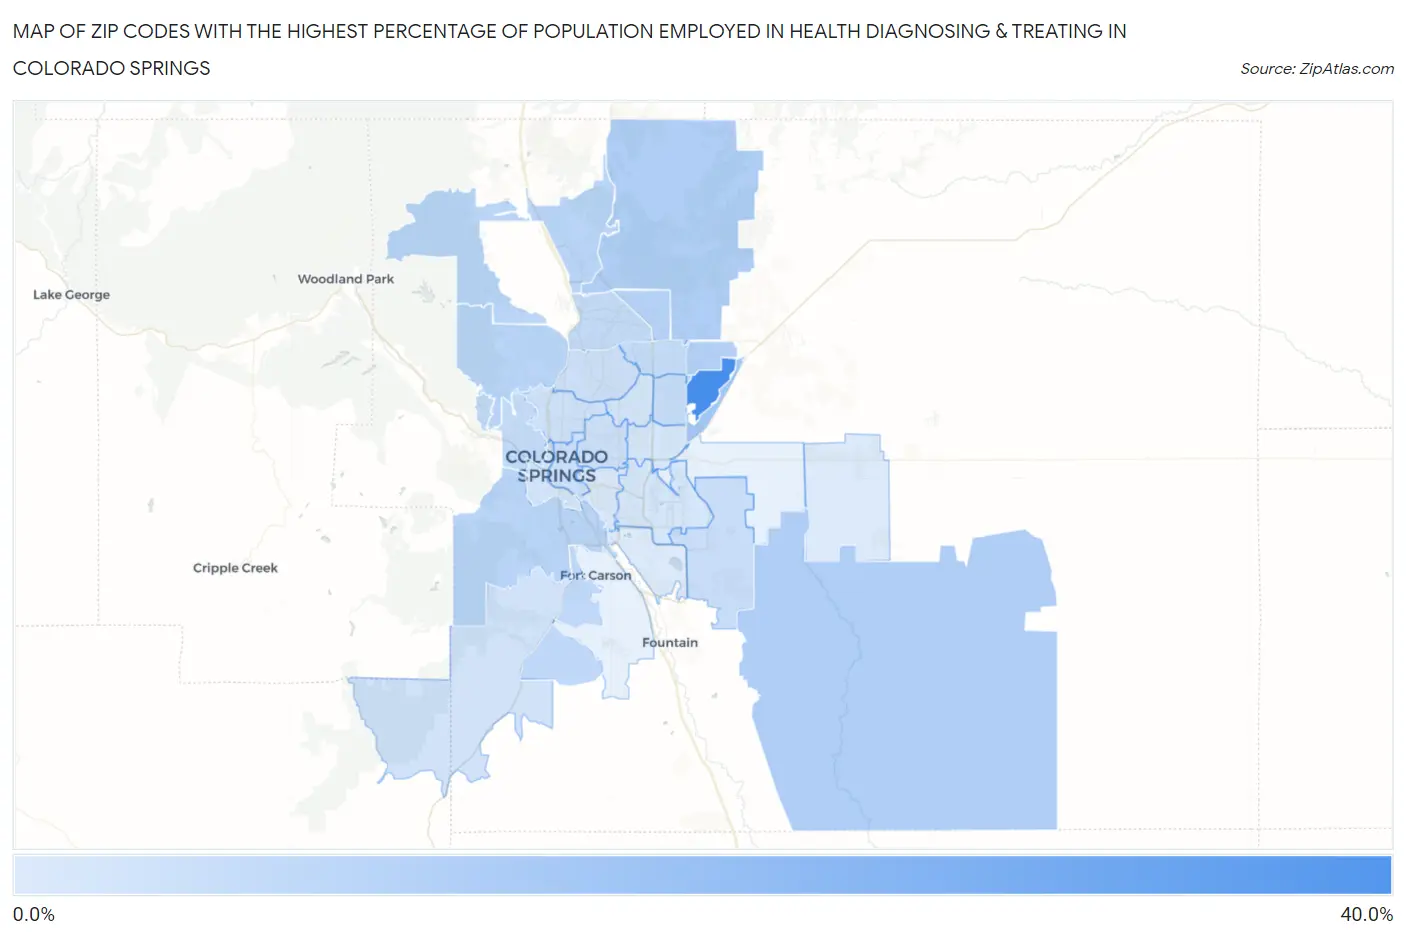
Map of Zip Codes with the Highest Percentage of Population Employed in Health Diagnosing & Treating in Colorado Springs
3.3%
32.1%
Zip Codes with the Highest Percentage of Population Employed in Health Diagnosing & Treating in Colorado Springs, CO
| Zip Code | % Employed | vs State | vs National | |
| 1. | 80938 | 32.1% | 5.8%(+26.3)#3 | 6.2%(+25.9)#185 |
| 2. | 80951 | 13.4% | 5.8%(+7.59)#24 | 6.2%(+7.16)#1,610 |
| 3. | 80908 | 11.1% | 5.8%(+5.33)#37 | 6.2%(+4.90)#2,781 |
| 4. | 80928 | 11.0% | 5.8%(+5.15)#40 | 6.2%(+4.71)#2,915 |
| 5. | 80927 | 10.5% | 5.8%(+4.66)#43 | 6.2%(+4.22)#3,346 |
| 6. | 80924 | 10.1% | 5.8%(+4.29)#52 | 6.2%(+3.85)#3,759 |
| 7. | 80906 | 9.4% | 5.8%(+3.55)#62 | 6.2%(+3.12)#4,740 |
| 8. | 80919 | 9.3% | 5.8%(+3.50)#64 | 6.2%(+3.06)#4,843 |
| 9. | 80921 | 9.2% | 5.8%(+3.43)#66 | 6.2%(+2.99)#4,972 |
| 10. | 80902 | 8.6% | 5.8%(+2.80)#79 | 6.2%(+2.36)#6,125 |
| 11. | 80920 | 7.8% | 5.8%(+1.99)#97 | 6.2%(+1.55)#7,996 |
| 12. | 80904 | 7.6% | 5.8%(+1.82)#106 | 6.2%(+1.38)#8,444 |
| 13. | 80923 | 7.2% | 5.8%(+1.44)#126 | 6.2%(+1.00)#9,575 |
| 14. | 80922 | 7.2% | 5.8%(+1.38)#130 | 6.2%(+0.946)#9,746 |
| 15. | 80925 | 6.9% | 5.8%(+1.14)#143 | 6.2%(+0.701)#10,530 |
| 16. | 80918 | 6.2% | 5.8%(+0.363)#180 | 6.2%(-0.074)#13,267 |
| 17. | 80909 | 6.1% | 5.8%(+0.308)#182 | 6.2%(-0.130)#13,478 |
| 18. | 80903 | 5.9% | 5.8%(+0.138)#188 | 6.2%(-0.299)#14,058 |
| 19. | 80907 | 5.8% | 5.8%(+0.025)#195 | 6.2%(-0.412)#14,479 |
| 20. | 80926 | 5.5% | 5.8%(-0.339)#220 | 6.2%(-0.776)#15,901 |
| 21. | 80905 | 4.9% | 5.8%(-0.881)#251 | 6.2%(-1.32)#17,985 |
| 22. | 80917 | 4.9% | 5.8%(-0.903)#256 | 6.2%(-1.34)#18,081 |
| 23. | 80916 | 4.7% | 5.8%(-1.13)#270 | 6.2%(-1.57)#18,958 |
| 24. | 80915 | 4.6% | 5.8%(-1.16)#273 | 6.2%(-1.60)#19,068 |
| 25. | 80910 | 3.8% | 5.8%(-1.99)#316 | 6.2%(-2.42)#21,935 |
| 26. | 80930 | 3.5% | 5.8%(-2.28)#335 | 6.2%(-2.72)#22,845 |
| 27. | 80911 | 3.3% | 5.8%(-2.47)#342 | 6.2%(-2.91)#23,361 |
1
Common Questions
What are the Top 10 Zip Codes with the Highest Percentage of Population Employed in Health Diagnosing & Treating in Colorado Springs, CO?
Top 10 Zip Codes with the Highest Percentage of Population Employed in Health Diagnosing & Treating in Colorado Springs, CO are:
What zip code has the Highest Percentage of Population Employed in Health Diagnosing & Treating in Colorado Springs, CO?
80938 has the Highest Percentage of Population Employed in Health Diagnosing & Treating in Colorado Springs, CO with 32.1%.
What is the Percentage of Population Employed in Health Diagnosing & Treating in Colorado Springs, CO?
Percentage of Population Employed in Health Diagnosing & Treating in Colorado Springs is 6.9%.
What is the Percentage of Population Employed in Health Diagnosing & Treating in Colorado?
Percentage of Population Employed in Health Diagnosing & Treating in Colorado is 5.8%.
What is the Percentage of Population Employed in Health Diagnosing & Treating in the United States?
Percentage of Population Employed in Health Diagnosing & Treating in the United States is 6.2%.